w. r. grace & co. - jefferies · 3 © 2014 w. r. grace & co. how we grow –how we win our...
TRANSCRIPT

1 © 2014 W. R. Grace & Co.
Gregory E. Poling
President & Chief Operating OfficerMeeting Our Growth
Objectives:
How We Grow How We Win
W. R. Grace & Co.Jefferies Industrials Conference
August 12, 2014

2 © 2014 W. R. Grace & Co.
Disclaimer
Safe Harbor Statement under the Private Securities Litigation Reform Act of 1995
This presentation contains forward-looking statements, that is, information related to future, not past, events. Such
statements generally include the words “believes,” “plans,” “intends,” “targets,” “will,” “expects,” “suggests,”
“anticipates,” “outlook,” “continues” or similar expressions. Forward-looking statements include, without limitation,
expected financial positions; results of operations; cash flows; financing plans; business strategy; operating plans;
capital and other expenditures; competitive positions; growth opportunities for existing products; benefits from new
technology and cost reduction initiatives, plans and objectives; and markets for securities. For these statements, Grace
claims the protection of the safe harbor for forward-looking statements contained in the Private Securities Litigation
Reform Act of 1995. Like other businesses, Grace is subject to risks and uncertainties that could cause its actual
results to differ materially from its projections or that could cause other forward-looking statements to prove incorrect.
Factors that could cause actual results to materially differ from those contained in the forward-looking statements
include, without limitation: risks related to foreign operations, especially in emerging regions, the cost and availability of
raw materials and energy, the effectiveness of its research and development and growth investments, acquisitions and
divestitures of assets and gains and losses from dispositions, developments affecting Grace's funded and unfunded
pension obligations, its legal and environmental proceedings, costs of compliance with environmental regulation and
those additional factors set forth in Grace's most recent Annual Report on Form 10-K, quarterly report on Form 10-Q
and current reports on Form 8-K, which have been filed with the Securities and Exchange Commission and are readily
available on the Internet at www.sec.gov. Reported results should not be considered as an indication of future
performance. Readers are cautioned not to place undue reliance on Grace's projections and forward-looking
statements, which speak only as the date thereof. Grace undertakes no obligation to publicly release any revision to
the projections and forward-looking statements contained in this announcement, or to update them to reflect events or
circumstances occurring after the date of this announcement.
Non-GAAP Financial Terms
These slides contain certain “non-GAAP financial terms” which are defined in Appendix I.
Reconciliations of non-GAAP terms to the closest GAAP term (i.e., net income) are provided in Appendix II.

3 © 2014 W. R. Grace & Co.
How We Grow – How We Win
Our Portfolio
Catalysts Technologies
Materials Technologies
Construction Products
Why Invest

4 © 2014 W. R. Grace & Co.
We Manage a High-value, High-margin Portfolio
Serving Diverse Industries
Refining Catalysts
Specialty Catalysts
Advanced Refining
Technologies (ART) JV
Industrial
Consumer
Coatings
Pharmaceutical
Packaging
Specialty Construction
Chemicals
Specialty Building
Materials
$1.1 billion
40.1%
$382 million
34.0%
= corporate average
$0.9 billion
34.6%
$213 million
24.3%
> corporate average
$1.1 billion
36.0%
$184 million
17.3%
> corporate average
Sales
Gross margin
Adj EBITDA
Adj EBITDA margin
Adj EBIT ROIC
Oil refining
Polyolefins
Petrochemicals
Engineered Materials
Discovery Sciences
Packaging Technologies
Commercial
Infrastructure
Residential
Catalysts Technologies Materials Technologies Construction Products
Product
Lines
Industries
2013 Financial Highlights
Segments

5 © 2014 W. R. Grace & Co.
Core Competencies
Core Competencies Drive Our Growth and
Returns on Invested Capital
Grow core franchises in
big, global markets
Differentiate products at
the customer level
Build capabilities in
emerging markets
Drive productivity by reducing
complexity and cost of poor
quality (COPQ)
Strategies
Invest our cash flow to drive
growth and returnsCapital
Allocation

6 © 2014 W. R. Grace & Co.
Adjusted EBIT ROIC projected to be >30% in 2014 from 23% in 2009
~$1.5 billion invested during this time, including $500 million for UNIPOL® PP business
High ROIC: An Operating and Investing Priority
Growth: ~1.5X GDP Organic Sales Growth
New Product Commercialization
Emerging Region Penetration
Bolt-on Acquisitions
Adjusted Free Cash Flow:
>$400 million/year
Net Working Capital Days
Profitability:
38–40% Gross Margin
Value Pricing
Mix Improvement
Productivity
Return on
Invested
Capital
(ROIC)

7 © 2014 W. R. Grace & Co.
Net Sales ($MM) Adjusted Free Cash Flow ($MM)
Adjusted EBIT ROIC
23.3%
29.8%
37.7% 38.9%
27.4%>30%
0%
10%
20%
30%
40%
2009 2010 2011 2012 2013 2014O
397
246278
421 430>400
$0
$100
$200
$300
$400
$500
2009 2010 2011 2012 2013 2014O
Segment Gross Margin
Adjusted
EBITDA ($MM)
379478
633 677 674
780-760
13.4%
17.9%19.7%
21.5% 22.0%~23%
0%
5%
10%
15%
20%
25%
$0
$200
$400
$600
$800
2009 2010 2011 2012 2013 2014O
Adjusted
EBITDA Margin
Note 1: 2014 Outlook as of July 23, 2014
Note 2: Net sales excludes ART JV deconsolidated in December 2009 and rare earth surcharges of
$280 million, $110 million and $15 million in 2011, 2012 and 2013, respectively.
Solid Track Record of Strong Financial Performance
2590 26752932 3046 3047
~3300
34.1% 35.3% 36.2% 37.0% 37.1% ~38%
0%
10%
20%
30%
40%
$0
$1,000
$2,000
$3,000
$4,000
2009 2010 2011 2012 2013 2014O

8 © 2014 W. R. Grace & Co.
Five-year Financial Framework
Metric2014
Outlook
2014 – 2018
FrameworkDrivers
Sales 7-9%1.5X GDP
plus pricing
• New product
commercialization
• Construction recovery
• Emerging regions
Segment Gross Margin 37-39% 38-40%• Value pricing
• Mix improvement
• Productivity
Adjusted EBITDA ~23% 23-24%• Operating leverage
• Productivity
Cash tax rate ~10% 10-15%• NOLs, warrant + DPO
settlements
• Tax planning
Adjusted Free
Cash Flow>$400 M
>$2 B cumulative
over 5 years
• Earnings growth
• Tight working capital
management
• Disciplined capital
investment
Adjusted EBIT ROIC >30% >30%• Earnings growth
• Disciplined capital
allocation
Return of cash
to shareholders$250-500 M
>$2 B cumulative
over 5 years
• Share valuation
• Operating cash flow
• Additional leverage

9 © 2014 W. R. Grace & Co.
We Invest in Growth by Deploying Our Assets for Highest Return
Opportunities
Base Demand Growth
Emerging Regions Growth
New Product Commercialization
Market Adjacencies
Bolt-on Acquisitions
Assets
Leading Technology
Global Operations
Dedicated Sales and
Technical Service
Business-focused R&D
Talent, Technology and Trust are critical in winning with customers

10 © 2014 W. R. Grace & Co.
Focused Growth ProgramsProjected
Annual
Growth
Risk Return
FCC / Refinery Catalysts –
Invest to maintain #1 position3-4%
Hydroprocessing Catalysts –
Invest to improve position6-8%
Polyolefins – Catalysts and Licensing 6-8%
Discovery Sciences >10%
Waterproofing / Specialty Building
Materials technologies6-8%
New Product Incubation – Adjacent
markets and / or technologies>10%
Internal Investment Focused on Programs with
Higher than Average Margins and Growth
High
Medium

11 © 2014 W. R. Grace & Co.
Margin Improvement Through Productivity and Mix
Improve gross margins 300 bps in 5 years
30%37% 40%
2003 2013 2018
Second wave productivity initiatives provide
opportunities for additional margin expansion
Improve Mix – 100 bps Refresh Products – 100 bpsDrive Productivity – 100 bps
Grow High Margin Businesses
PE / PP catalysts
PP licensing
New FCC catalysts
Discovery Sciences
SBM specialties
Product differentiation
through technology to
improve performance
Re-formulate to deliver value
Optimize manufacturing
investments
Reduce COPQ
Use global process
improvement

12 © 2014 W. R. Grace & Co.
$3.8
$5.5
$6.7
Polymer
Catalysts
Market
4-5% CAGRRefining
Catalysts
Market
2-4% CAGR
Catalysts Technologies
© 2014 W. R. Grace & Co.
Petrochemical
Catalysts Market
2-3% CAGR
$16
billion
market
2013 Financial Highlights
$1.1 billion sales
40.1% Gross margin
$382 million Adjusted EBITDA
34.0% Adjusted EBITDA margin
46
13 © 2014 W. R. Grace & Co.
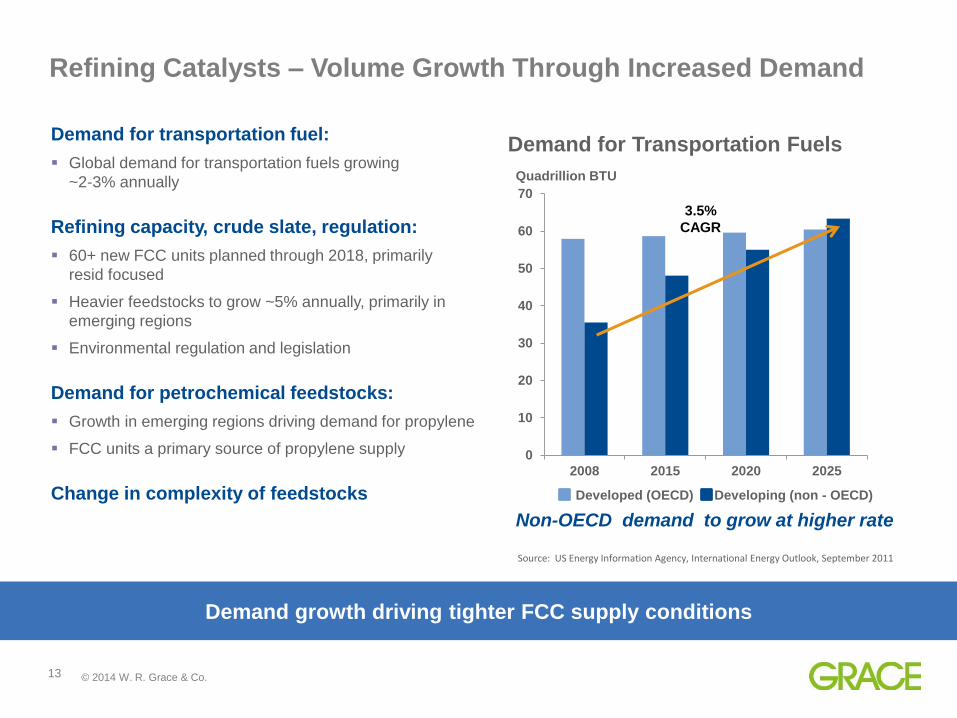
Refining Catalysts – Volume Growth Through Increased Demand
Demand for transportation fuel:
Global demand for transportation fuels growing
~2-3% annually
Refining capacity, crude slate, regulation:
60+ new FCC units planned through 2018, primarily
resid focused
Heavier feedstocks to grow ~5% annually, primarily in
emerging regions
Environmental regulation and legislation
Demand for petrochemical feedstocks:
Growth in emerging regions driving demand for propylene
FCC units a primary source of propylene supply
Change in complexity of feedstocks
Demand growth driving tighter FCC supply conditions
0
10
20
30
40
50
60
70
2008 2015 2020 2025
OECD Non-OECD
Quadrillion BTU
Non-OECD demand to grow at higher rate
Source: US Energy Information Agency, International Energy Outlook, September 2011
Demand for Transportation Fuels
Developed (OECD) Developing (non - OECD)
3.5%
CAGR

14 © 2014 W. R. Grace & Co.
Catalysts Technologies
Application Market DynamicTechnology
ChallengesOfferings
Shale: growing portion of North
American crude diet
Heavy resid processing,
primarily in Middle East
and Asia
Growth in resid-to-propylene
applications, primarily Asia
Heavy crudes
Contaminants
Activity
Selectivity
Stability
ACHIEVE® family of
FCC catalysts – shale
Midas® GOLD FCC catalysts –
heavy resid
Heavy resid treating and
conversion
Growing demand for low-sulfur
diesel fuel
Investment in hydrocrackers
Heavy crudes
Contaminants
Activity
Selectivity
Stability
ICR® catalyst systems for
hydrocracking and fixed bed
resid hydrotreating
SmART Catalyst System® for
ultra-low sulfur diesel production
Population growth
Increased consumer
consumption – emerging
economies
Substitution of other materials
Feedstock cost position
Strength
Flexibility
Clarity
Processability
MAGNAPORE® chromium PE
catalysts
CONSISTA® 6th generation non-
phthalate PP catalysts
UNIPOL® Polypropylene Process
technology
FCC
HPC
Specialty Catalysts
Value Growth through New Product Development

15 © 2014 W. R. Grace & Co.
Example: UNIPOL® PP Acquisition Provided
Leadership Position in PP Catalysts and Licensing
Sources: Company estimates; Chemical Marketing Resources, Inc.
Others
20%
9%
8%
21%
42%
Grace
LyondellBasell
(Spheripol®) Lummus
(Novolen®)
Ineos
(Innovene®)
Polypropylene Catalysts
PP demand growing >GDP
PP process technology licensing creates catalyst market
PP catalysts are:
• Process specific
• Impart polymer performance characteristics
• Driver for polymer differentiation
• Driver for process differentiation
UNIPOL® PP Update
Delivering cost and operational synergies
Key personnel and know-how retained
Seamless functional integration
Strong cultural fit
2012 Polypropylene Catalyst Market
$500
million
market

16 © 2014 W. R. Grace & Co.
Catalysts Technologies Portfolio Strength
Application* 2008 2014
RE
FIN
ER
Y
FCC
HPC EB Resid
HPC FB Resid
HPC Distillate
HPC Hydrocracking
SP
EC
IAL
TY
Polyethylene (PE) Catalyst
PE Catalyst Support
Polypropylene (PP) Catalyst
PP Process Technology Licensing ---
PE / PP Single Site Catalyst
Chemical Catalysts
FU
TU
RE
Zeolite Technology
Alternate Feedstock Catalysts ---
MTO Catalysts ---
Market Leader Developing PositionStrong Position
* HPC applications served through the company’s
Advanced Refining Technologies (ART) joint venture.
2008 2013 2018P
A strong portfolio getting
stronger with a more
diversified earnings base.
Refining
Catalysts
Segment EBIT ($mm)
33%
67%
73%
27%
~40%
~60%
Specialty
Catalysts
~16%
CAGR
~8-9%
CAGR
17 © 2014 W. R. Grace & Co.
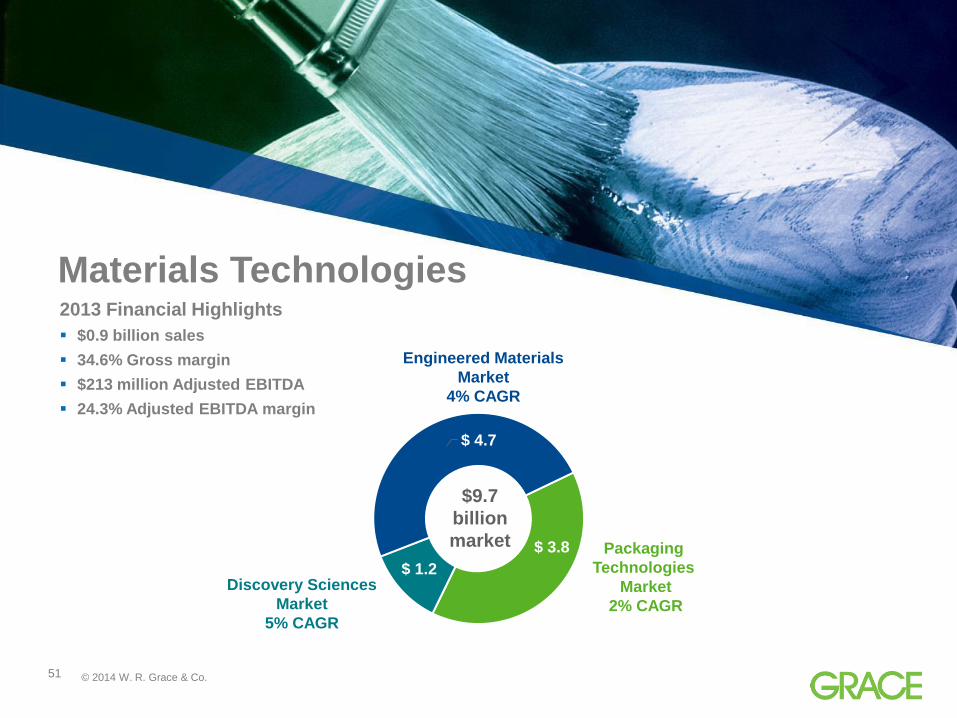
Materials Technologies
$ 3.8
$ 1.2
$ 4.7
$9.7
billion
market Packaging
Technologies
Market
2% CAGR
Discovery Sciences
Market
5% CAGR
Engineered Materials
Market
4% CAGR
2013 Financial Highlights
$0.9 billion sales
34.6% Gross margin
$213 million Adjusted EBITDA
24.3% Adjusted EBITDA margin
© 2014 W. R. Grace & Co.51

18 © 2014 W. R. Grace & Co.
Materials Technologies
Application Market Dynamics Technology Solutions Offerings
Recovery in US and
European markets
Continued growth in
emerging regions
Mix of large global and
regional customers
Provide improved
performance with lower
cost
Green technologies
SYLOID® silica matting for
industrial coatings
SYLOBLOC® plastics anti-block
LUDOX® colloidal binder
SYLOBEAD® adsorbents for
gas drying
Growth / consolidation in
pharma and biotech
High cost and long
development time for
new drugs
Outsourcing to
custom manufacturers
Reduce time and cost in
drug discovery
Higher purity for bio and
pharma applications
VYDAC® silica-based media
Reveleris® chromatography
instrumentation
Synthetech® pharmaceutical
intermediates
Growth in emerging regions
Convenience
Sustainability
Food & beverage
regulations
Prevent spoilage and
contamination
New coatings solutions to
address move away from
BPA epoxy resins
DAREX® coatings and
can sealants
Daraform® closure sealants
Discovery
Sciences
Engineered
Materials
Packaging
Technologies

19 © 2014 W. R. Grace & Co.
Example: Specialty Silica Innovation
The Award-Winning Reveleris® Flash Chromatography Solution
Grace
differentiated
silica
Specialty silica
consumables
Patented
instrument for
drug discovery
Reveleris® Flash Chromatography Solutions
60% 40%
Flash Chromatography
$130
Million
Market
InstrumentsSilica
Consumables
Reveleris® Flash Chromatography
Leveraged capability as world’s largest
manufacturer of specialty silica gel
Combined with detector technology from bolt-on
acquisition
Innovation on silica columns to accelerate drug
discovery and development
Established a new benchmark for quality in flash
purification
Growth rate 25-30%
5% CAGR

20 © 2014 W. R. Grace & Co.
Construction Products
$7.1
$1.1
$6.4 $14.6 Billion
Market
Concrete
Chemicals
Market
Specialty Building
Materials Market
Cement Additives
Market
4-5% CAGR
2013 Financial Highlights
$1.1 billion sales
36.0% Gross margin
$184 million Adjusted EBITDA
17.3% Adjusted EBITDA margin
© 2014 W. R. Grace & Co.55

21 © 2014 W. R. Grace & Co.
Construction Materials
Specialty materials, systems and services that
strengthen, enhance and protect structures
Business
Units
Market
DynamicsProduct Applications Offerings
Mature market
recovery,
especially US
Emerging region
growth and
infrastructure
build-out
Increasing
quality of
construction
projects
Improves cement quality
Improves efficiency of the
grinding process
HEA2® grinding aid
CBA® quality improver
Improves concrete properties such
as flow, placement and durability
Improves performance in use
Reduces labor and material costs
ADVA® dispersants
DCI® corrosion inhibitors
STRUX® structural fibers
Products for improving concrete
aesthetics
Provides protection to new
buildings and infrastructure projects
Repairs and improvements for
existing buildings/ infrastructure
Preprufe® commercial foundation
waterproofing systems
Ice & Water Shield® residential
roofing underlayment systems
PIERI® products for concrete
aesthetics
Cement
Chemicals
Concrete
Chemicals
Building
Materials

22 © 2014 W. R. Grace & Co.
Example: High-Value Application
46%
37%
17%
Product line growth 18% CAGR
Improved leak prevention through unique
adhesive bond
New product increases quality and
contractor productivity
• ~17% value add delivered
Specified on major projects throughout
the world
Preprufe®: The Premier Pre-Applied Waterproofing System
Below Grade Waterproofing
Asia Pacific
EMEA
Americas
$900 Million
Market
Museum of Islamic Arts
(Qatar)
Las Vegas Airport
(USA)
Milan Metro Line Tunnel
(Italy)
The Morocco Mall
(Morocco)

23 © 2014 W. R. Grace & Co.
What You Can Expect Going Forward (2014–2018)
We will continue to drive shareholder value:
Sales growth: 1.5X GDP; 2X GDP in growth products
Gross margin: 38-40% gross margin
Adjusted EBIT growth: 8-10% per year
Adjusted Free Cash Flow: >$400 million per year
Expected share repurchase: based on capital allocation process
(1-5% per year)
Adjusted EBIT ROIC: >30%
We maintain our operational intensity by focusing
on our opportunities and building on our momentum.
Return on
Invested
Capital
(ROIC)

24 © 2014 W. R. Grace & Co.
Why Should You Like These Businesses
Strong market position
Leading technology
Deep customer relationships
Shared material science and formulations expertise
Assets levered across the company
High returns on invested capital
Why Invest

25 © 2014 W. R. Grace & Co.
For additional information, please visit www.grace.com or contact:
J. Mark Sutherland
Vice President, Investor Relations
+1 410.531.4590
David Joseph
Finance Manager, Investor Relations
+1 410.531.8209

26 © 2014 W. R. Grace & Co.
Appendix I: Definitions of Non-GAAP Measures
Non-GAAP Financial Terms
Adjusted EBIT means net income adjusted for interest income and expense, income taxes, costs related to Chapter 11, asbestos-related costs, restructuring
expenses and related asset impairments, pension costs other than service and interest costs, expected returns on plan assets, and amortization of prior service
costs/credits, certain income and expense items related to divested businesses, product lines, and certain other investments and gains and losses on sales of
businesses, product lines, and certain other investments. In the 2013 first quarter, we also adjusted for the currency transaction loss incurred on our Venezuelan
cash balances of $6.9 million.
Adjusted EBITDA means Adjusted EBIT adjusted for depreciation and amortization.
Adjusted Free Cash Flow means net cash provided by or used for operating activities minus capital expenditures plus the net cash flow from costs related to
Chapter 11, cash paid to resolve contingencies subject to Chapter 11, accelerated payments under defined benefit pension arrangements, and expenditures for
asbestos-related items. Grace uses Adjusted Free Cash Flow as a liquidity measure to evaluate its ability to generate cash to support its ongoing business
operations, to invest in its businesses, and to provide a return of capital to shareholders.
Adjusted Earnings Per Share (EPS) means Diluted EPS adjusted for costs related to Chapter 11, asbestos-related costs, restructuring expenses and related
asset impairments, pension costs other than service and interest costs, expected returns on plan assets, and amortization of prior service costs/credits, certain
income and expense items related to divested businesses, product lines, and certain other investments and gains and losses on sales of businesses, product lines,
and certain other investments, and certain discrete tax items..
Adjusted EBIT Return On Invested Capital means Adjusted EBIT (on a trailing four quarters basis) divided by the sum of net working capital, properties and
equipment and certain other assets and liabilities.
We use Adjusted EBIT as a performance measure in significant business decisions and in determining certain incentive compensation. We use Adjusted EBIT as a
performance measure because it provides improved period-to-period comparability for decision making and compensation purposes, and because it better
measures the ongoing earnings results of our strategic and operating decisions by excluding the earnings effects of our Chapter 11 proceedings, asbestos liabilities,
restructuring activities, and divested businesses.
Adjusted EBIT, Adjusted EBITDA, Adjusted Free Cash Flow, Adjusted EPS, and Adjusted EBIT Return On Invested Capital do not purport to represent
income measures as defined under U.S. GAAP, and should not be used as alternatives to such measures as an indicator of our performance. These measures are
provided to investors and others to improve the period-to-period comparability and peer-to-peer comparability of our financial results, and to ensure that investors
understand the information we use to evaluate the performance of our businesses. We have provided in the following tables a reconciliation of these non-GAAP
measures to the most directly comparable financial measure calculated and presented in accordance with U.S. GAAP.
Adjusted EBIT has material limitations as an operating performance measure because it excludes Chapter 11- and asbestos-related costs and may exclude income
and expenses from restructuring activities and divested businesses, which historically have been material components of our net income. Adjusted EBITDA also
has material limitations as an operating performance measure because it excludes the impact of depreciation and amortization expense. Our business is
substantially dependent on the successful deployment of capital, and depreciation and amortization expense is a necessary element of our costs. We compensate
for the limitations of these measurements by using these indicators together with net income as measured under U.S. GAAP to present a complete analysis of our
results of operations. Adjusted EBIT and Adjusted EBITDA should be evaluated together with net income measured under U.S. GAAP for a complete understanding
of our results of operations.

27 © 2014 W. R. Grace & Co.
Appendix II: Reconciliation of Adjusted EBITDA to Net Income
* Due to its bankruptcy, Grace had significant intercompany loans between its non-U.S. subsidiaries and its U.S. debtor subsidiaries that are not related to its operating
activities. In addition Grace had accumulated significant cash balances during its bankruptcy. The intercompany loans were paid when Grace emerged from bankruptcy,
and excess cash balances were used to fund a significant portion of Grace’s emergence from bankruptcy. Accordingly, income and expense items related to the
intercompany loans and the cash balances are categorized as costs related to Chapter 11.