w- - digital library/67531/metadc130731/m2/1/high... · for measuring aptitudes, the general...
TRANSCRIPT

CORRELATION OF SELECTED OATB AND
SORT VARIABLES
APPROVED:
? iJt Major Professor
) / " )
y * ' " W -Minor prof@s«or
Dean of the School of Education
Dean of the Graduate School

CORRELATION OF SELECTED GATB AND
SORT VARIABLES
THESIS
Presented to the Graduate Council of the
North Texas State University in Partial
Fulfillment of the Requirement®
For the Degree of
MASTER OF SCIENCE
By
Richard T. McWilliam®. B. S.
Denton, Texas
August, 19@®
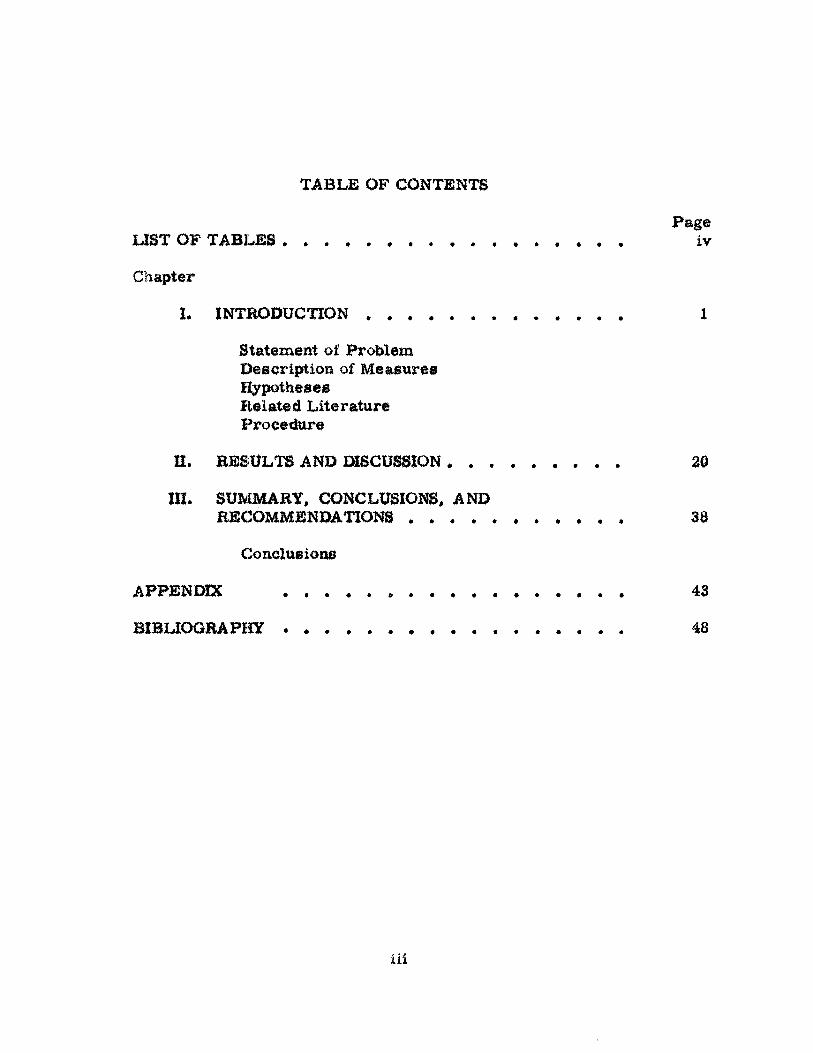
TABLE OF CONTENTS
Page
USX OF TABLES iv
Chapter
I. INTRODUCTION 1 Statement of Problem Description of Measure® Hypotheses Belated Literature Procedure
H. RESULTS AND DISCUSSION 20
m . SUMMARY. CONCLUSIONS, AND
RECOMMENDATIONS 38
Conclusions
APPENDIX 43
BIBUOGRA PHY 48
in

LIST OF TABLEi
Table
I.
II.
m .
IV,
v»
VI.
VII.
VIII.
DC.
X.
Itf
dtmmm
XII.
XIII.
XIV. XV.
XVI.
Traits Measured by the GATB and the SORT . .
Means and Standard .
Correlations Belated to Hypotheses for Group I.
Group I Correlation® of GATB with SORT Variables
Means and Standard Deviations for Group II . .
Correlations Related to Hypotheses for Group II
Group II Correlations of GATB with SORT Variable®
Means and Standard Deviations of Group III . .
Correlations Related to Hypotheses for Group III
Group III Correlations of GATB with SORT Variables
Inte rsorrel ations of the GATB Variables of Group I
Intercorrelations of the GATB Variables of Group II
Intercorrelations of the GATB Variables of Group III
Intercorrelations of SORT Variables for Group I
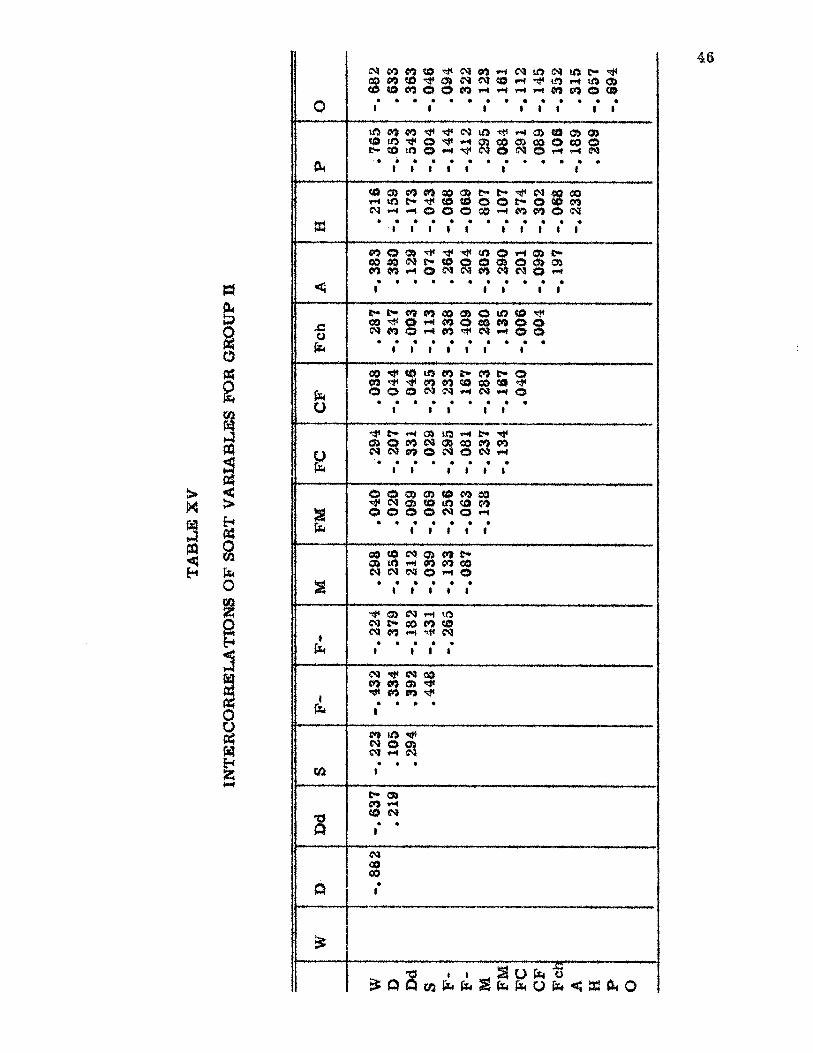
Intercorrelations of SORT Variables for Group H
Intercorrelations of SORT Variables for Group IH
iv
Page
8
21
22
2$
28
28
SO
33
34
8S
43
43
44
43
40
47

CHAPTER I
INTRODUCTION
Few attempts have been made to relate toe concepts of person-
ality and aptitude. As Allen pointed out* most theories and studies of
personality have developed independently of theories and studies of
aptitude (2). Stevenson, although including a discussion of intelligence
in his study of personality, did not relate intelligence to personality
and did not include aptitude ia his study at all (22). More recently,
Coleman has also included some reference to intellectual ability in his
work in personality, but again failed to relate personality and intelli-
gence except as both are involved in the context of solving personal
problems and making decision® of a personal nature (8). Thus*
Coleman overlooked the involvement of intellectual ability in academic
and occupational situation® which, in essence, omitted the concept of
aptitude. Baughman and Welch viewed personality as the mental
characteristics other than those of a basically intellectual nature (§).
Their concept of personality <5) exemplified those definitions of person-
ality which basically ignore intellectual processes. Baughman and Welch
discussed intelligence and the measurement of intelligence to provide a
reference point for the discussion of personality measurement (5), but
1
omitted it as an aspect of personality. In studying the primary factors
of personality, Jenkins (16} found IS® scales measuring primary factors,
none of which measured intelligence level or areas of aptitude. He did
find, however, primary facton® of "theoretical thinking" and "spatial
disorientation" as personality components, the scales nearest to intelli-
gence or aptitude measures in his study <16).
Among the various studies available on aptitude# one of the most
unusual viewpoints is that of Broadley and Broadley (1% who placed person-
ality in a list of aptitude®. In contrast, Vernon <24) and Goslin (12)
viewed aptitude and personality as separate entities# with the only in-
volvement of the two being a rather one-sided situation in which person-
ality sometimes limits the full development of aptitude* This omitted a
positive or constructive relationship of the two. For these and other
writers# Bingham's (8) definition of aptitude as "potential ability in per-
formance" was probably adequate without basic change or elaboration.
These writers on personality and aptitude could# therefore# be described
as having viewed their respective subjects as separate entities which
were only slightly related to each other.
In a different perspective, several writers have considered
aptitude to be related to personality in very basic ways. Allport de-
fined personality as "the dynamic organization within the individual of
those psychophysical systems that determine his unique adjustment to
his environment" (3). While this definition by Allport encompassed

3
the concept# of personal i ty and aptitude as previously discussed, Allport
actually saw no definite re la t ionship between personal i ty and aptitude
<3). Nevertheless, his definition did not preclude such a relat ionship,
am did some definitions. Allen (2) objected to the lack of theore t ica l
proposals to explain the possible source of aptitude® in personality and
the relat ionship of aptitudes to personal i ty . While he recognized that
the relat ionship of emotional f ac to r s and intellectual factors l ike apti-
tude would not be s imple, he maintained the exis tence of such re la t ion-
ship# f o r s eve ra l reason® (2). One reason was that emotional exper i -
ences or condition* may inhibit aptitude development (2). Another was
that aptitudes s e e m to be modifiable to some degree by environmental
changes <2). These and other r easons can ted Allen to conclude that
aptitudes should be studied as " l ea rned way® of adjusting to the world,11
just as attitudes, values* and t emperament a r e studied as l ea rned
behavior pa t te rns f o r dealing with the environment (2). Along para l le l
l ine* of thought, Denton and Taylor <10) did a fac tor analytic study of
mental abil i t ies and personal i ty traits in which they found l imi ted
relationships between cer ta in fluency s c o r e s and some personality
s c o r e s . While the relat ionships found were not outstanding when con*
s ide red in light of the a lmost one- to-one relat ionship# found between
cer ta in aptitudes, they were significant in that they pointed toward the
existence of measurable relationship® which could f u r t h e r shed light on
the structure of personal i ty .

4
Another similar theoretical viewpoint was held by Guilford,
whose concept of personality contained a relationship of aptitudes and
personality, although no clear-cut explanation was given <13). To
Guilford, "an individual's personality is his unique pattern of traits"
(18)* In elaborating on his definition, Guilford explained that "a trait
ie any distinguishable, relatively enduring way in which one individual
differs from others" <13). It becomes apparent that this comprehen-
sive view of personality included not only temperament, interests,
and attitudes, but also aptitudes. Personality is no longer to be viewed
as one thing and aptitudes another, but aptitudes become a grouping of
t ra i ts which are only some of the many and diverse trai ts of the indi-
vidual's personality.
Statement of Problem
If, then, aptitude traits and personality t ra i ts of an individual
are all different aspects of an integrated whole personality, it i s possi-
ble that measurable relationship* exist between some of these t ra i ts .
The overall purpose of this study is, therefore, to determine if there
are measurable relationships between some specific aptitudes and certain
basic personality t rai ts .
Description of Measures
In trying to measure the basic traits of personality, a pro-
jective test, toe Structured-Objective Rorschach Test (SOKT), was

selected. Projective technique* are particularly useful for obtaining
an integrated picture of the personality rather than a random mixture
of isolated traits (17). The choice of the SORT as the projective instru-
ment was based on several factor®. First , the SORT in designed to
measure what the traditional Rorschach measures <21). This is im-
portant, because the Rorschach has been shown to have several de-
terminant# which are significantly correlated with intelligence. Altus
and Thompson (4) found that the number of whole blot responses (W)
and the number of human movement responses (M) were the most
valid and reliable measures of intelligence in the Rorschach test. By
using simple correlation, Abrams (I) was able to produce a formula
using the determinants W, M, F+% (good form percentage), and R
(total number of responses) of the Rorschach to give an IQ score which
i® highly correlated with the Wechsler-Bellevue Full Scale IQ score.
Therefore, since the Rorschach seems to measure intelligence# and
the SORT is designed to measure what the Rorschach measure® (21),
it is suggested that the SORT will measure intelligence. Further,
because aptitude seems to be partly the result of Interaction of
emotional and intellectual traits (6), the SORT, a basic personality
test measuring intellectual and emotional traits, should be particularly
weH suited for measuring aptitudes.
There are several differences between the Rorschach and the
SORT that must be kept in mind. The Rorschach provides only stimulus

card® to which the subject makes association® that are clarified in an
Inquiry following the association period, l a contrast, the SOET pro-
vide® lor each Mot thirty responses arranged in t r iads (23). The
subject chooses one response from each triad, giving ten responses
per blot or one hundred responses for the whole test (28). There is
no inquiry in the SORT, standardised keys being used to score r e -
sponses (23). These very differences, i. e . , objective scoring and
design for group testing, were the other reasons for the selection of
the SOET.
For measuring aptitudes, the General Aptitude Test Battery
(GATB) was chosen. The GATB was chosen because its validity and
reliability have been well established (11) and it was designed for
group testing. One other reason for the selection of the GATB was
that it requires less time for administration than other possibly more
sensitive aptitude tes ts . The time required for administration was
important, because subjects were available for only limited periods.
The GATB has twelve tests that provide nine aptitude measures .
Coordination and dexterity tests were omitted (See Table I) because
they were not believed to be as closely related to personality measured
by the SORT as intelligence factors would be. This was because no
dexterity is required on the SOET, while intellectual activity is .
Because general intelligence measures are designed to sample
various abilities (§), it was hypothesized that the GATB factor g

(general intelligence) would correlate significantly with SORT variable#
which should measure intelligence. Using intelligence related vari-
able# of the Rorschach (1;4) and the theoretical design of the SORT
(21), the GATE factor g should correlate significantly with the SORT
variables W, M, and F+* The variable F+ was used instead of F+%
because R is fixed on toe SORT, whereas it is variable on the Rorschach.
The SORT variable F- should also correlate significantly with GATB
factor g, because F- is an almost inversely proportional measure of
F+> although this is not a full description of F* by any means*
Since the GATB factors s» n» and v each contribute to the
factor g (see Table l>, it was hypothesized that M, W4 F+, and F - of
the SORT would correlate significantly with each of them (s* n* and v)#
although the correlations might be expected to be smaller* It was also
suspected that the GATB factor p would correlate significantly with
the SORT variables Dd, F+, and F- . The GATB factor p is measured
by having the subject pick an item which is identical in shape and detail
to the first item in a series of several similar items* Dd is the tenden-
cy to see detail* while F+ and F- show the tendency to have good or
poor form perception. A final relationship was suggested between the
GATB factor q and the SORT variable Dd, which measures the tenden-
cy to observe detail.

8
TABLE 1
TRAITS MEASURED BY THE GATB AND THE SORT
A. Tra i t s of the General Aptitude Test Battery, also showing the subtests providing the trait score.
1. g--Intelligence Far t 3—Three—Dimensional Space Par t 4--Vocabulary Par t 6--Arithmetic
2. v-~ Verbal Aptitude Par t 4- - Vocabulary
3. a—Numerical Aptitude Par t 2--Computation Par t 8--Arithmetic Reasoning
4. -Spatial Aptitude Par t 3--Three--Dimensional gpaee
5. p—Form Perception Pa r t 5--Tool Matching Par t 7 - -Form Matching
6. <j--Clerical Perception Part I - -Name Perception
Adapted from Chroribach (9}
B. Trai ts of the Structured-Objective Rorschach Test
7. Whole blot <W) 8. Major Mot detail (D) 9. Minor blot detail <Dd)
10. White space (S) 11. Good form <Ff) 12. Poor form (¥*} 13. Human movement <M) 14. Animal movement <FM) 15. Good form and eolor <FC) 16. Poor form and color <CF) 17. Shading (Fch) 18. Animal* part or whole (A) I B . Human, part or whole (H) 20. Modal responses <P) 21. Rare responses (O)
Adapted f rom Stone <28)

9
Hypotheses
In light of the above, the following hypotheses were advanced:
1. the GATB factor® g, n, v, and s will each correlate sig-
nificantly with each of the SORT variables W, M, F+, and F-;
2. the GATB factor p will correlate significantly with the
SORT variables Dd, F+, and F«; and
8. the GATB factor q will correlate significantly with the
SORT variable Dd.
Related Literature
Although personality has been studied extensively in relationship
to many variables, only infrequently has it been studied in relation to
aptitude* One of these was conducted by Benton and Taylor using tests
composed by Taylor and Guilford for the measurement of ability and
personality (10). In the factor analysis of the test results, six factor®
were obtained (10). Two of these factors had loadings of both person*
ality and aptitude items. One factor, which Denton identified as
Surgency, had loadings of Rhathymia .71, Social Extraversion . 51,
Cycloid Tendency . 42, and Verbal Versatility . 29 (10).. Surgency
corresponded approximately to "drive" in the sense of "initiative".
Rhathymia was best described by such terms as "happy-go-lucky,
carefree, and unconcerned" (13). Cycloid Tendency referred to ex-
tremes of emotional states (13). Social Extraversion was the result

10
of treating Social Introversion as a reflected variable <10). Items
dealing with "moodiness", as well m being "lost in thought" and
"self-conscious" , indicated the nature of Social Introversion (10).
Verbal versatility was measured by exercises dealing with similes (10).
In addition to this relationship, Denton and Taylor found that
there was a correlation of . 27 between Rhathymia and Verbal Versa-
tility (10). The only other factor which contained both aptitude and
personality items had loadings of Thinking Introversion . 54, -Social
Extraversion . 30, and Ideational Fluency . 28 (10). Denton and Taylor
were unable to identify this factor and the relationship of the variables
composing it. Denton and Taylor did notice, however, that both of
these factors contained aptitude variables involving the meaning of
words (10). The remaining personality variable, Depression, and
the other aptitude variables were not included in either of the factors
which involved both personality and aptitude variables.
In another factor analytic study* Khan found only one factor
with both personality and aptitude measures involved (IT), f o r
measuring personality, Khan used the Guilford-Zimmerman Temper*
ament Survey and the 80RT. Aptitude was measured by Seigal's
Multiple Aptitude Test. Positive loadings of Rare Response (0) . 39,
Spatial Relation (Three-Dimension) . 30, and Applied Science and
Mechanics . 33, as well as negative loadings of Popular Response (F)
- . 41 and Animal Response (A) - . 87 were found for this factor (17).

11
Khan identified this factor as spatial visualization because of the
aptitude* involved (1?). Original thinking was also involved as shown
toy the SOET variable® involved (17).
Guilford* Christensen, Frisk, and Merrifield (14) have also
tried to find relationships of personality variables to aptitudes. They
found that the personality trait impulsiveness correlated , 35 with
measures of expression®! fluency and . 22 with measures of ideational
fluency (14h This was interpreted by them as meaning that the
impulsive person has an advantage in speed tests of thinking (14). In
the same study, Guilford et. found that meditative thinking corre-
lated >. 20 with logical evaluation and expression®! fluency and - 22 and
. 25 respectively with semantic spontaneous flexibility and originality
(14). One unpublished stucty by Goedinghaus (13, p. 41$) reported
that for college women there was a correlation of 33 between their
masculinity scores and their aptitude®.
Using correlational techniques, Merrifield, Guilford,
Christensen, and Frick (19) found several relationships between apti-
tude factors and certain traits of motivation and temperament. While
none of the correlations were larger than . S3 and most were approxi-
mately aero, enough reached the level of statistical significance to be
beyond the number that should have been significant by chance (19).
Nine aptitude traits were found to have significant correlations with
traits of motivation andfor temperament. Examples of these include

12
expressions! fluency, which correlated . 25 with impulsiveness, . 21 with
meditative thinking, and . 16 with aesthetic expression. Again, verbal
comprehension correlated . 25 with aesthetic expression, . 21 with toler-
ance of ambiguity, *% 33 with meticulousness, 22 with the need for
discipline, - . 22 with general activity, 21 with cultural conformity,
and - .17 with autistic thinking. These and other relationships found in
their study caused Merrifield jg* al. to conclude that the trait® of person-
ality have a rather email role in determining aptitudes of a person (19).
Since intelligence is very closely related to aptitude, a sample
of studies dealing with the relationship of personality and intelligence is
included here. One such study was conducted by Wren, Ferguson, and
Kennedy, in which it was found that the personality traits self-sufficiency
and dominance were related to intelligence (20). Critical ratios of 6.8
and 7.73 were obtained for the men and women respectively when com-
paring scores on the personality variables self-sufficiency and intelli-
gence of the two group# of extremely divergent intelligence levels; i . e . ,
more intelligent groups had greater self-sufficiency than less intelli-
gent groups (25). Among this same group of junior college students*
there was a definite tendency for the mentally inferior group of men to
be more dominant than the mentally superior group (23). The domi-
nance was a compensatory mechanism for lower intelligence (25).
Conversely, the self-sufficiency of the higher intelligence group may
have been due to the greater success experienced by the more gifted

13
group (23).
Some intelligence- personality studies have included the use of
promotive techniques to measure personality aad intelligence* Altus
and Thompson (4), using college studemtts, determined thst there ware
several indicators of intelligence in the Rorschach Test . M correlated
• 43 with Measures of Verbal Aptitude and * 43 with the Ohio Psychological,
separating the number of M*s into two groups, 0-8 and 4-*(4). W
correlated . 13 with the Measure of Vermel Aptitude end »$$ with the
Ohio Psychological,separating the number of W*s scored into two
groups 0*4 and §-*(4). Altus and Thompson believed that to significant
relationship was found between F*% and intelligence because the group
tested was composed of college students and therefore not composed of
a wide range of intelligence (4), Abrams, wording along these same
lines, found a formula lor an !Q equivalent to the Wechsler-Bellevue
Full Scale IQ (1). The Full Soale IQ correlated . 364 with Borschaoh
F*%, . 3*0 with M« .356 with f » and . 329 with B <1). Using these
variables* the formula produced an IQ score correlated . 528 with the
Wechsler-Bellevue Full Scale IQ.
Another related a rea of study involves achievement and person*
aiity. Achievement i s only related to aptitude in the ra ther Indirect
way of achieveme nt*s being limited by the level of intelligence. In a
study of achievement in mathematics, overachievers emerged with
more favorable personality ratings then underachievers (IS). Such

14
terms as cooperative, conscientious, responsible, honest, sincere,
outgoing, independent, etc*, described over&chievers, while self-
eentered, aloof, stubborn, opinionated, resentful, conventional, in-
hibited, etc#, described the under&chievers <18), Holland, in at-
tempting to predict and understand the nature of academic achievement,
discovered that nonintellectual variables such as Superego, Persistence,
tad Deferred Gratification were indispensable (15)< Pierce, studying
high achieving boy#, described them as having more favorable person-
ality traits than low achieving boys <20). Among the characteristics
he lifted for overachievers were a greater sense ol responsibility,
greater tolerance, higher motivation, greater involvement in achievement
tacks, and more school related interests than the unde rachievers <20),
Overahcievers also took greater responsibility for homework, showed
greater independence, and had mothers who fostered independence in
them <20),
Procedure
Two sections of introductory psychology classes and two
sections of advanced psychology classes were chosen for testing on
the basis of availability. The advanced classes were included to pro-
vide a specialised group to contrast with the introductory classes, which
were believed to contain a more generalised cross-section of students.
Those subjects with special knowledge of either tests were excluded
from the data, providing Si introductory and 43 advanced students for

15
a total of 101 subjects. No attempt was made to control age# eex ratio,
classification, or major, other than the the selective factors inherent in
the courses themselves. Two different class period® were required
for testing each section. The GATE test® were administered f i rs t to
all student®, followed by the SORT, the only explanation being that the
data would be used in research and that each person*® ©core® would b#
kept in confidence. The two advanced class#® were able to take all
seven parts of the GATB in one period, while the introductory classes
took parts one through five the f i rs t period and part® seven and eight
during the second period of testing. During all testing, standard
procedures were followed very closely. For the SOBT, the Wot®
were projected on a screen and the appropriate directions in the manu-
al were followed for that method of administration.
One variable involving the students' motivation was introduced
in one of the introductory sections when the instructor allowed several
student* who had not participated in the f i r s t testing session to leave
just as the second session ol testing was about to begin. This variable
has been evaluated and is discussed in the resul ts and discussion
sections of this stuffy. All tests were hand-scored# using standard keys.
The converted s c o w s of the GATB were used in order to obtain
the six aptitude factors from the seven tes ts . Eaw scores of each of
the fifteen variables of the SORT were then correlated with each of the
six GATB factors by simple correlation. Each correlation was then

tested for significance, using J. The scores of the advanced classes
were computed only as a tingle group* but the score# of the intro-
ductory classes were computed both together and separately because
of the variable introduced by the instructor ©f one class. The corre-
lations of the introductory classes were then compared for significant
difference in the groups. And finally, the correlations of the intro-
ductory group and the correlations of the advanced group were checked
for significant difference.

CHAPTER BIBLIOGRAPHY
1. Abrams, Elias N., "Prediction of Intelligence from Certain Rorschach Factors ," Journal of Clinical Psychology, XI (January* 1955), 81-83,
2. Allen, Dean A.» "Aptitudes and Personality," Harvard Educational Review, XXVI (Winter, li§§), 17-23, '
8. AUport, Gordon W., Personality, New York, Henry Holt and Company, 1937.
4. Altue, W. D. and Grace M. Thompson, "The Rorschach as a Measure of Intelligence," Journal of C o i n i n g , Psychology, XHI < 1949), 341-347.
5. Baughman, ES. Earl and George S. Welch, Personality; ^ Behavioral, Science, Englewood Cliffs/ New Jersey, Prentice*-Hall, Inc., 1962.
S. Bingham, Walter Van Dyke, Aptitudes and Aptitude Testing, Hew York, Harper and Brothers, 1917."
7. Broacttey, Charles V, and Margaret B. Broac&ey, Know Your Real Abilities, Mew York, McGraw-Hill Book Company, Inc., 1§48.
8. Coleman, James C. , Personality Qynamics and Effective Behavior, Chicago* Scott, Foresman and Company, 1960.
9. Cronbach, Lee J . , Essentials of Psychological Testing, New York, Harper and Row, 1900.
10. Denton, J. C. and C. W. Taylor, "A Factor Analysis of Mental Abilities and Personality Trai ts ," Psychometrika. XX (March, 1955), 75-81.
11. Dvorak, Beatrice J . , "The General Aptitude Test Battery," Personnel and Guidance Journal, XXXV (November, 1956), 145-152.
17

18
12. Goelin, David A*, The Search for Ability# New York, Russell Sage Foundation, 19®l.
1$, Guilford, Joy P . , Personality, New York, McGraw-Hill Book Company, Inc . , 1949.
14. Guilford, Joy P . , P. R. Christensen, J. W. Frick, and P . R. Merrifleld, "The Relations of Creative-Thinking Aptitudes to Non-Aptitude Personality Traits," The University of Southern California, Reports from the Psychological Laboratory, Number 20 (December, 1957).
15. Holland, John L., "The Prediction ©f College Grade* from Personality and Aptitude Variables," The Journal of Educational Psychology, Lg (October, I960), 145-254.
1®. Jenkins. Thomas H., "Measurement of the Pr imary Factor# of the Total Personality," j£he Journal of Psychology, LIV (October, 1882), 417*442,
17. Khan, Lilian, "Factor Analysis of Certain Aptitude and Person-ality Variables," Indian Journal of Psychology, XXXVII (Part I, 1902), 27-38.
18. Keimowits, Robert I. and Heinz L. Ansbacher, "Personality and Achievement in Mathematics*" Journal of Applied Psychology, XIV (M«gr, 1960), 84-87.
I f , Merrifield, P . R . , J . P . Guilford, P. R. Christensen, J . W. Frick, "Interrelationships Between Certain Abilities* and Certain Trait* of Motivation and Temperament," Journal of General. Psychology, LXV (July, 1981), 57-74.
20. Pierce , Jamee V. , "Personality and Achievement Among Able High School Boy*," Journal of Individual Psychology, XVUX (May. 1961), 102-107.
21. Slegel, Laurence, "Test Reviews,1' Journal of Counseling Psychology, VI (Spring, 1959), 72-73.
22. Stevenson, George H., Personality and | t s Deviations, Toronto, The Ryereon Press, 1947.
28. Stone, Jolcs B . , JhO Rorschach Test , Los Angeles* California Test Bureau, 1958.

la
24. Vernon* Philip D. , The Measurement of Abilitita, New York, Philosophical Library, 1081.
25. Wrenn, C. Gilbert, Leonard W. Ferguson and John L. Kennedy, L«vel and Personality," Journal of Social
Psychology, m (August, 1030), 301-308.

CHAPTER II
RESULTS AN© DISCUSSION
Before preventing the results* a short resume of the hypotheses
advanced la given here. First , it was hypothesized that each of the
factors g, n, v, and s would correlate with each of the variables W,
M, F+, and F - . It was also suggested that p would correlate with Dd,
F+, and F - . Finally, it was hypothesised that q would correlate with
Dd. The results are presented for each group in the same order as
the hypotheses, with a brief survey of the unpredicted correlations
included at the close of each discussion of hypotheses.
Because it was suspected that the two introductory psychology
classes were not equivalent, correlations were calculated for both
groups separately. The correlation# reaching the level of significance
in one class did not correspond to any of the significant correlations
in the other class. A comparison of these two groups with the advanced
class revealed that none of the significant correlations in any one class
corresponded to any of the correlations in any other class. Thus, the
results from each group are presented and discussed separately before
an overview of the three classes is presented. In aU data reported,
those correlations marked with a single asterisk (*) reach or exceed
20

21
the . OS level of significance, and those marked with a double aster isk
(••) reach or exceed the . 01 level of significance.
The f i r s t group reported here is the advanced psychology
class , hereaf ter r e f e r r ed to as Group I. So that the composition of this
TABLE II
MEANS AND STANDARD DEVIATIONS FOE GROUP I#
Variable Mean Deviation
& v
GATB n 8 P <1
123.58 110.01 119.74 124. 26 117.87 114.65
13.51 10.5® 12.14 18.14 19.70 11.88
W D Dd S F+ F~
SORT M FM FC CF Fch A H P O
31.00 54.72 13. SO 13.32 30.72 12.33
8.74 10.33 12.03 7.44
18.19 33.84 23.05 §4.85
3.79
5. 73 4. 30 3.88 2. 80 §.57 2.98 3.40 2.12 2.13 2. 25' 4.04 4. 84 4.48 8.07 2.88
•composed of 43 subjects
22
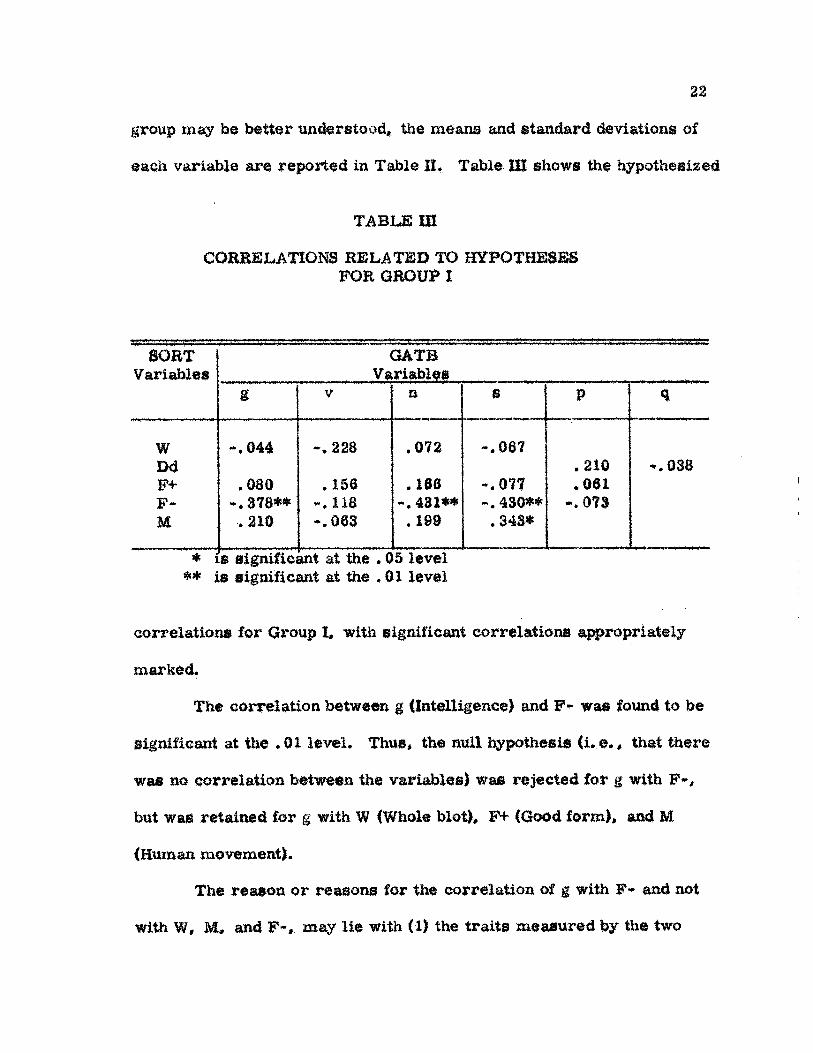
group may be better understood, the means and standard deviations of
each variable are reported in Table H. Table III shows the hypothesized
TABLE HI
CORRELATIONS RELATED TO HYPOTHESES FOR GROUP I
SORT Variables
GATB V ariable©
SORT Variables
g V a s P <1
W Dd F+ F-M
*. 044
.080 -.378**
.210
.158 - .118 -.OSS
.072
. 166 -.431**
.180
*»• 067
-.077 -.430**
.343*
.210
. o s i -.073
». 038
' ' *• ' j| m signifies ant at the . 0 is level *# is significant at the , 01 level
correlations for Group I, with significant correlations appropriately
marked.
The correlation between g (Intelligence) and F- was found to be
significant at the .01 level. Thus* the null hypothesis (i. e . , that there
was m correlation between the variable#} was rejected for g with F- ,
but was retained for g with W (Whole blot), P+ (Good form), and M
(Human movement).
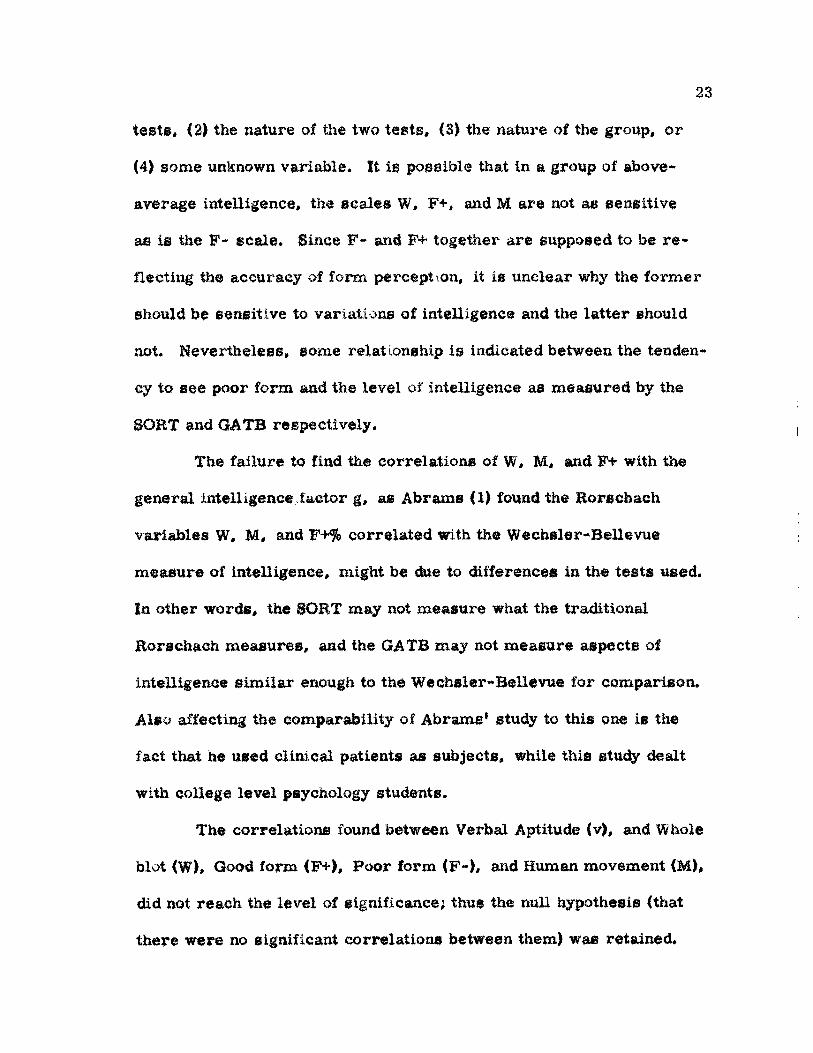
The reason or reasons for the correlation of g with F- and not
with W, M, and F», may lie with (1) the traits measured by the two
23
tes t s , (2) the nature of the two teste, (3) the nature of the group, o r
(4) some unknown variable. It if possible that In a group of above-
average intelligence, the sca les W, F+, and M a re not am sensit ive
as is the F - scale . Since F - and F+ together a re supposed to be r e -
flecting the accuracy of form perception, it is unclear why the f o r m e r
should be sensitive to variations of intelligence and the l a t t e r should
not. Nevertheless, some relationship i s indicated between the tenden-
cy to see poor form and the level of intelligence as measured by the
SORT and GATB respectively.
The fa i lure to find the correlation® of W, M* and F+ with the
general intelligence, factor g, a® Abrams (1) found the Rorschach
variables W, M, and F+% correla ted with the Wechsler-Bellevue
measure of intelligence, might be due to differences in the t e s t s used.
In other words, the SORT may not measure what the traditional
Rorschach measures* and the GATB may not measu re aspect® of
intelligence s imi la r enough to the Wechsler-Bellevue for comparison.
Also affecting the comparability of Abrams* study to this one is the
fact that he used clinical patients as subjects , while this study dealt
with college level psychology students.
The correlat ions found between Verbal Aptitude (v), and Whole
blot <W), Good form <F+), Poor form (F-), and Human movement <M),
did not reach the level of significance; thus the null hypothesis (that
there were no significant correlat ions between them) was retained.

24
These correlations* as well as those of a (Numerical Aptitude) and s
{Spatial Aptitude) with W, M, F+, and F - , had been predated because
of the fact that v, n, and s, each contribute to the variable g. However,
the complete absence of expected correlations with the variable v may
indicate that the relationship® do not exist or that they are too small
lor the tests to measure.
Of the possible relationships between a and each variable W,
M, F+, and F- , only a and F~ reached the level of significance. A
similar situation was noted a moment ago in the correlation of g with
F - . There are several possible explanations for such a result. For
example, the same trait measured by g and n may also be measured
by F-i or perhaps F - measures separate aspects of two distinct traits.
It seems likely* however, that F- is a measure of a general intelli-
gence trait that is measured to some degree by several of the GATE
scales.
Although relationships were proposed for s with W, M, F+,
and F- , only the correlations of s with F - and with M reached the
level of significance. Since s contributes to g, the correlation of F-
with both s and g suggests the possibility that F* measures a trait
common to both s and g. This might also be the same trail which is
reflected in the correlation of F- and n. M is a measure of mental
agility, and s is a measure of the ability to visualise a three-dimen-
sional figure from the unfolded, flattened, two-dimensional figure.
25
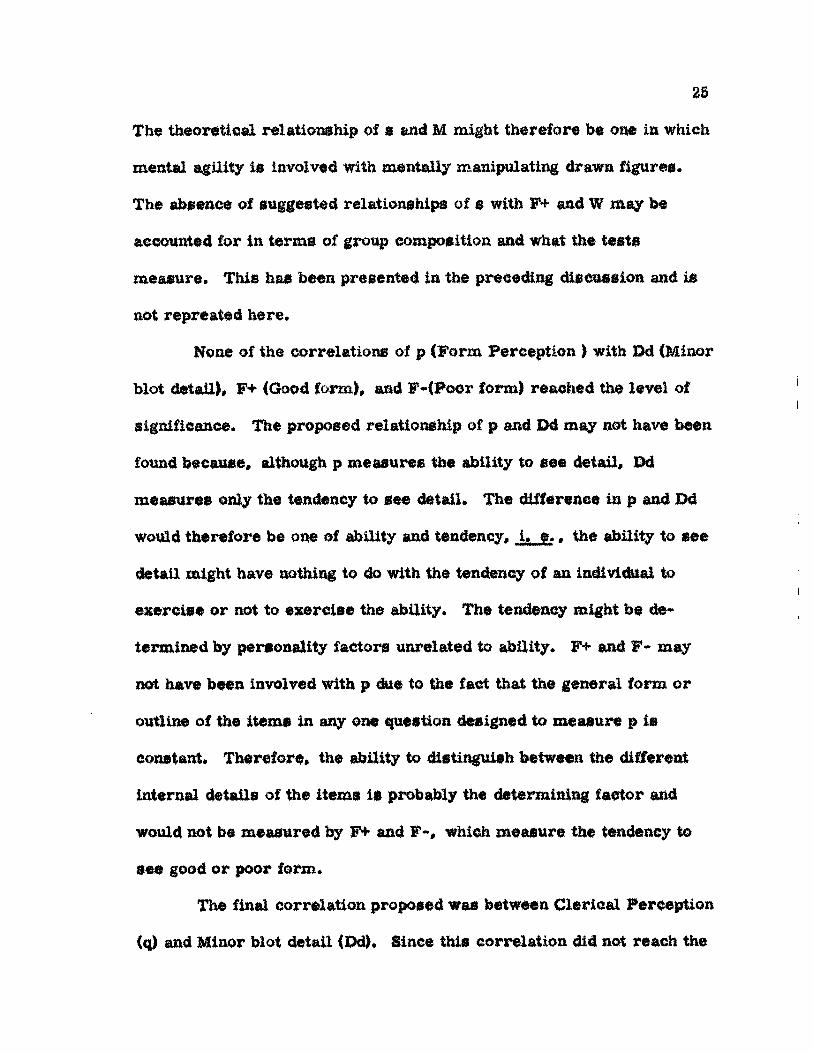
The theoretical relationship of s and M might therefor® be one in which
mental agility is involved with mentally manipulating drawn figure*.
The absence of suggested relationships of s with F+ and W may be
accounted for in terms of group composition and what the tests
measure. This has been presented in the preceding discussion and is
not repreated here.
None of the correlations of p (Form Perception ) with Dd (Minor
blot detail), F+ (Good form), and F-(Poor form) reached the level of
significance. The proposed relationship of p and Dd may not have been
found because, although p measures the ability to see detail, Dd
measures only the tendency to see detail. The difference in p and Dd
would therefore be one of ability and tendency, i. e . , the ability to see
detail might have nothing to do with the tendency of an individual to
exercise or not to exercise the ability. The tendency might be de-
termined by personality factors unrelated to ability. F* and f * may
not have been involved with p due to the fact that the general form or
outline of the items in any one question designed to measure p is
constant. Therefore, the ability to distinguish between the different
internal details of the items is probably the determining factor and
would not be measured by F+ and F-, which measure the tendency to
see good or poor form.
The final correlation proposed was between Clerical Perception
(q) and Minor blot detail (Dd). Since this correlation did not reach the

26
level of significance, it i s again assumed that the ability to see detail,
this t ime measured by q, is not closely related to the tendency to see
detail, as measured by Dd. Thus, it would again seem that propensi-
t ies and potentials a re not related in this a rea of perception.
In viewing the correlations of the SORT variable# with the
GATE variables (see Table IV), it will be seen that there are some
TABU! IV
GROUP I CORRELATIONS OF GATB WITH SORT VARIABLES
SORT GATB " J 1 " L
Variables Variables s •y* n s P q
W 044 - .228 - 072 - .087 236 .048 D , 020 . 127 00® .007 . 051 - . 015 Dd ,014 . 11S - ,096 .003 . 210 - .038 S 14® .083 .011 - .306* , 146 - , 012 F , 080 . 156 ,167 - .077 ,061 .010 y . - ,378** 118 - , 411** - .430** 073 242 M • 210 - . 0 8 3 ,108 .348* ,032 —. 233 FM ,120 . 266 - ,016 - . 052 - ,037 2 i i FG .177 - .188 ,08$ ,124 , 042 - . 056 CF - , i t s 156 - ,29S* .063 «116 - .044 Feb 101 - .124 ,008 .000 204 - .151 A 100 .457** ,061 - . 024 ,004 .161 H - .120 - .254 - ,0§3 . 101 .072 ,227 P - . 1 1 1 - . 1 7 3 ,014 - .166 196 - .057 O . 057 .260 «120 .133 . 274 .112
* is significant at the . 05 level ** is significant at the . 01 level
significant correlat ions that were not hypothesized. One of these was
27
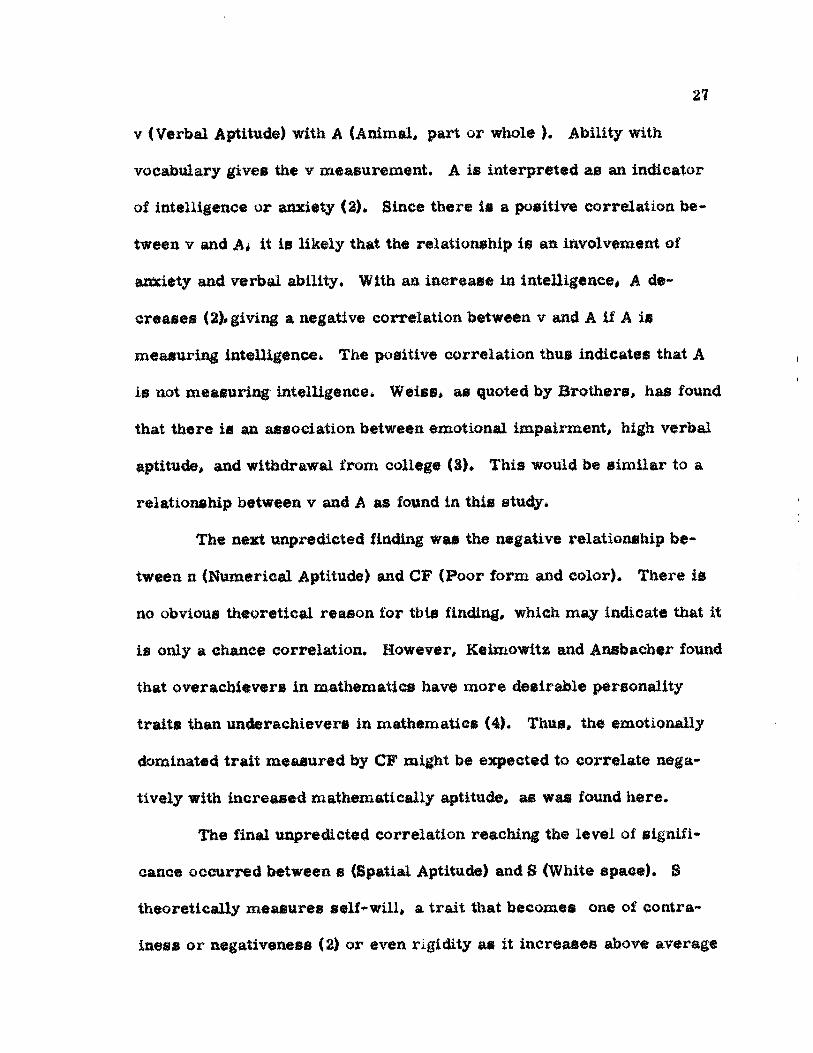
v (Verbal Aptitude) with A (Animal, part or whole ). Ability with
vocabulary gives the v measurement. A is interpreted as an indicator
of intelligence or anxiety (2). Since there is a positive correlation be-
tween v and A# it i t likely that the relationship if an involvement ol
anxiety and verbal ability. With an increase in intelligence* A de-
creases (2), giving a negative correlation between v and A if A is
measuring intelligence. The positive correlation thus indicates that A
is not measuring intelligence, Weiss* as quoted by Brothers* has found
that there is an association between emotional impairment* high verbal
aptitude, and withdrawal from college (3). This would be similar to a
relationship between v and A as found in this study.
The next unpredicted finding was the negative relationship be-
tween n (numerical Aptitude) and CF (Poor form and color). There is
no obvious theoretical reason for this finding, which may indicate that it
i s only a chance correlation. However, Keimowit* and Ansbacher found
that overachievers in mathematics have more desirable personality
t ra i ts than underachievers in mathematics (4). Thus, the emotionally
dominated trait measured by CF might be expected to correlate nega-
tively with increased mathematically aptitude, as was found here .
The final unpredicted correlation reaching the level of signifi*
canoe occurred between s (Spatial Aptitude) and § (White space). S
theoretically measures self* will, a t rai t that becomes one of contrar-
iness or negativeness (2) or even rigidity as it increases above average

23
(5). The negative correlation of s and S might therefore he interpreted
as indicating that as rigidity increases, the ability to visualize three-
dimensional figures from two - dimensional figures decrease®.
The correlation® for Group II (an introductory psychology class),
TABLE V
MEANS AND STANDARD DEVIATIONS FOE GROUP n*
Variable Mean Standard Deviat ion
& 117.47 13.09 V 110.50 11.53 n 110.79 13.17 s 110.21 10.50 P 115.91 10.04 q i i a . i i 12.32
w 28. 62 6 . 22 D 33.44 4.02 Dd 14.09 2.02 S 12.91 3.12 F+ 10.47 4.98
IS. 06 3.50 M, 8.02 3.04 FM 1 0 . 8 0 2. 38 FC 11.97 2.54 CF 7.08 2.21 Feh 10.00 3. 07 A 33.02 3.79 H 22.32 5.31 P 51.44 0. 20 O 0.79 2.00
* Composed of 34 subjects

as
while different from those in Group 1, seem to include some relation-
ships with both statistical and theoretical significance. To provide a
more complete picture of this group, Table V contains means and
standard deviations of the variables of Group II. Table VI contains
the correlation® obtained which relate to the stated hypotheses.
TABLE VI
CORRELATIONS BELATED TO HYPOTHESES FOE GROUP II
SORT GATB Variables Variables
g V n P <1
W a § 8 *.9§S .088 . 354* Dd 110 F+ .002 . 189 -.052 - .036 -.04® F- *. 241 -.009 - . 264 - .312 -.058 M .232 .081 .275 . 239
* is significant at the . 05 level
In this group only one predicted correlation was found to reach
the level of significance. The correlation of Spatial Aptitude (s) and
Whole blot (W) might be explained in terms of the relationship of W to
intelligence and, then, 6 to intelligence. However, an explanation in
these terms would create more discrepancies (in considering why the
other hypothesized relationships between g and W, v and W, and n and
W did not also appear) than it would answer.

30
la looking at all of the correlations of GATB with SOKT
variables (see Table VH), there were several variable® which corre-
lated at a significant level, which had not been predicted. Taking g
TABLE VII
GROUP O CORRELATIONS OF GATB WITH SOET VARIABLES
SORT Variables
GATB Variables
W D m s F F-M wm FC CF Fob A H P O
* split
g
.189
.034 •.214 .458** .032 .241 .232
' .004 .226
•.,113 -.113 .045 . a i s .213
*• 143
•.085 . 115 .020 .300* .189
..009 .081 .OSS .038
-.053 -.234 -.040 .004
•.184 -.021
n
088 ,025 ,181 304* 052
275 019 110 112 077 063 848* 192 184
4 is significant at the . 05 level is significant at the . 01 level
384* 288 287 188 038 312 258 009 287 088 079 058 182 398* 222
128 054 129 183 048 088 187 018 225 010 184 182 028 220 289
T
•.231 .298 .110 .203 . 271
•. 008 .111
•.187 -.012 -.088 •.219 .011 • 058
-.181 -.040
with S, (White space) v with S, and n with S, there is perhaps a contusion
factor reflected in these correlations. There is , however, no obvious
theoretical explanation of this relationship, but there are explanations
which make it difficult to see how these correlations occurred. For

SI
example, the rigidity represented by S might be expected to lower
the flexibility often, put forth as conducive to learning new and different
material, thug being negatively correlated to intelligence rather than
positively correlated as was found here.
In the area of intellectual functioning, S is interpreted m
rigidity (5). In the area of temperament, S is interpreted as per-
sistence (3). It then becomes possible that the effect of increased S
could be destructive in terms of intellectual functioning and constructive
in terms of temperament. Thus, if the effect of persistence more than
offsets the rigidity produced as 8 increases, then there could possibly
be a net positive effect on intellectual performance.
Another correlation reaching the level of significance was
between n (Numerical Aptitude and H <Human movement). Stone found
a positive correlation of f irst-year college grade-point averages and
H on the 80RT <5). Beck maintained that human responses on the
Rorschach were Indicative of intelligence level <2). There is, there-
fore, theoretical background for this finding. The problem in accepting
an n with H correlation would be why a similar correlation was not
found with other variables in tee QATB and the variable H. This
might be due to the fact that the aspect of general intelligence which
Beck observed to be related to H might be involved in the mathematical
area of general intelligence.

32
The relationship of s (Spatial Aptitude) and P (Popular response)
may indicate that some increase in contact with reality increases the
ability to visualise three-dimensional figures from two*dimensional
ones. It may mean that the two are related to a third common variable
which is not measured directly by either test. Of course, any of these
relationships for this group could be due to the composition of the group,
or some other uncontrolled factor. The underlying assumption that
the GATB and the SOET are measuring the same traits is also subject
to close scrutiny, since only one the hypothesised correlations was
found. Again, there is the possibility that these findings were due to
chance.
The other class of introductory students, Group HI, produced
results different from either of the two preceding groups. This group
was subject to one variable that the other two groups were not. This
variation in procedure involved releasing some of the students from the
testing situation in M l view of the remaining subjects just before the
second session of testing began. This variation was unavoidable, and
therefore this group has been retained to compare it with the other two
groups. In Table VIII, the means and standard deviation® of the varia-
bles are presented for comparison to the other two groups. There is
the possibility, for example, that the intelligence levels of the three
groups differ enough to cause some variation in the results. However,
upon casual inspection, the remaining variables show little difference

33
among the group®. Nevertheless, further investigation of the effects
of differences in the groups might b# worthwhile.
TABLE VIIl
MEANS AND STANDARD DEVIATIONS OF GROUP in*
Variable Mean Standard Deviation
I v
GATB « s p
%
98
13.58 11.91 10,47 14* 77 15.02 0. 70
W D Dd S F+ F -
SOET M FM FC CF Feh A H F O
31.08 31.82 IS* 58 12. 28 27.17 11. 21 10, #8 10,0$ 12,87 8,17
17,25 34.08 23,33 56.00 3.9®
4, 38 4, 73 2,88 3, 40 4,7? 2,84 4, 23 2.01 2,40 1,79 3.48 4,00 4.78 @,@0 2.07
• composed of 24 subjects
Of the predicted cor relatione for this group, none reached the
level of significance (see Table IX). Therefore, the discussion will be

34
devoted to a consideration of why the predicted findings were absent
and to the consideration of the correlations found which reached the
level of significance.
TABLE IX
CORRELATIONS RELATED TO HYPOTHESES FOR GROUP HI
SORT GATE Variables Variables
g V n s P <1
W •» 108 . 026 -.303 031 m - . 240 -.172 F+ .000 -.008 .0§1 -.042 - .035 F - - .O i i .035 -»133 -.119 - . 058 M .018 -.099 -.096 .201
It is possible that this group wa§ unique to the extent that none
of the expected results were found. The different treatment of this
group may account in part for the result® obtained for this group.
Table X contain® all of the correlations obtained for the GATB
with SORT variables. Although several of these can easily be seen
to reach the level of significance# for the most part they lack obvious
theoretical explanations. A negative correlation was found between g
(Intelligence) and Dd (Minor blot detail). This correlation might be a
result of the interference of intellectual functioning with concentration
on detail at the expense of an overall picture.

35
There Is no obvious theoretical explanation lor the correlation
of n and D (Major Wot detail), in te rms of what D or n measures . This
lack of explanation i® also present in the correlations for s with Dd and
O (Original response). In all of thee® finding#, chance might account
will m "%r sMMJUJm Jk
GROUP HI COBJUS LA HONS OF GATE WITH SOBT VARIABLES
SOBT GATB Variables Variables Variables
: 8 V n B P <i
W 100 . 026 - .303 - .031 - .170 - .335 0 . 208 . 068 .401* . 323 .259 .424* Dd 380* - .804 1 - . 248 -.53?** - .240 - . 172 S 4 030 .000 •» 13® - .088 . 208 . 177 F ,000 ». 003 • 051 - .042 - .035 • 180 F - - .056 . 033 158 - .119 - .058 - .045 M . 019 - .099 - .098 .201 .080 - .071 FM . 048 - .232 .318 .008 - . 110 - .104 FC 190 .089 - .265 : - .142 308* - .208 CF «• no 185 - . 048 - .150 . 024 .008 Fch .258 . 232 .303 . 072 . 383* . 188 A .09? . 137 .078 .145 - .204 - .002
IS .021 - .055 - . 133 . 182 —. 0a0 - .215 P .210 .019 .180 .181 . 289 . 113 o - .118 - .010 .032 -.544** . 005 .289
* is significant at the . OS level ** i t significant at the .01 level
for the results. The correlations of p (Form Perception) with PC
(Poor form and color and Fch (Shading) as well as q (Clerical Perception)
with 0 , a re also lacking obvious theoretical background other than their

36
being the result of chance.
In an overview of all three groups, some similarities were
noticed between Groups I and II, while Group HI was seen to be singu-
lar in it® general characteristics. Groups I and II had significant
correlation® of the aptitude factor# g, v, n, and s with personality
variables, but no significant correlations of p and q with personality
variable#. Since the aptitudes g, v, n, and e seem to involve the
ability to manipulate and understand abstraction® on a higher level than
the more perceptual aptitudes p and q, it might be that personality
trait® are m .re closely related to those aptitudes involving greater
abstraction than to those involving little depth of abstraction.
On a more specific level, the inconsistencies observed from
group to group may indicate that chance has contributed highly to the
results. For further comparisons of the groups, tables of the inter-
correlations of GATE variables and intercorrelations of SOET vari-
ables are presented in the appendix.

CHAPTER BIBLIOGRAPHY
1. Abrams, Elias N., "Prediction of Intelligence from Certain Rorschach Factor®,M Journal of Applied Psychology, 3CI (January, 195&), 81-83.
2. Beck, Samuel J . t A Variety of Personality Pictures, Vol. U of Rorschach* s Tfst, <3 Volumes), New York. Grime and Stratton, 1847.
3. Dailaa Morning Mews, April 8, 1988.
4. fteimowitz, Robert I. and Heinz L. Ansbacher, "Personality and Achievement in Mathematics," Journal of Applied Psychology, XIV (May, 19C0), 84-87.
6. Stone, Jolcs B . , ®*Q Rorschach Test, Los Ang@l#8« California Test Bureau, 1958.
37

CHAPTER III
SUMMARY* CONCLUSIONS, AND RECOMMENDATIONS
Although relatively few studies of the relationship of person-
ality and aptitude have been made, there are theoretical and empirical
indication® that some relationship® might exist between certain aspects
of personality and some aptitudes. This study was made to determine
if such relationships do exist. The General Aptitude Test Battery and
the Structured-Objective Rorschach Test were chosen as the instru-
ments to measure aptitude and personality traits respectively. On the
hates of theoretical implications and previous findings, the following
hypotheses were made; each OATB factor g, n, v, and s would corre-
late with each SORT variable W, M, F+ and F-; The OATB factor p
would correlate significantly with SORT variables Dd, F+, and F-; and
the GATB factor % would correlate significantly with the SORT variable
Dd.
The procedure involved testing classes of introductory psycholo-
gy students and advanced psychology students with the GATB and SORT
during two different class periods. The scores of 101 subjects (58
introductory and 43 advanced) were correlated as three groups. The
advanced class comprised Group I and the introductory classes comprised
38

38
Groups I and II. A division of the introductory classes was mad® on
the basis of different treatment of the two classes before the second
session of testing began. When correlations between variable® in one
group were compared with correlations between variables in the other
groups, the correlations were found to be unique for each group. Thus
each group was treated independently of the others.
Several of the correlations hypothesized for Group 1 were found,
although most were not. Significant negative correlations were found
between F* (Poor form) and each of the GATB variables g (Intelligence)*
n (Numerical Aptitude), and s (Spatial Aptitude). This was interpreted
as meaning that the tendency to see poor form may be related to a
general intelligence trait. Human movement (M) was found to corre-
late with s . Thus, Spatial Aptitude seems to be related to mental
agility as measured by M. Several correlations reached the level of
significance, but had not been hypothesized. Verbal Aptitude (v) and
Animal, part or whole (A) were significantly related, perhaps indicating
that there is some relationship between emotional maturity and verbal
ability. Numerical Aptitude (n) and Poor form and color (CF) showed a
significant relationship. Finally, s was negatively correlated with §
(White space) showing a possible inverse relationship between Spatial
Aptitude and rigidity as measured by S.
Group II. an introductory class, had only one correlation of
those predicted that reached the level of significance. Spatial Aptitude

40
(s) and Whole blot (W) were correlated, perhaps indicating that the
ability to organize a whole blot into a meaningful whole may be related
to Spatial Aptitude* Unpredicted correlations occurred between each of
the variable® g {Intelligence), v (Verbal Aptitude), n (Numerical Aptitude),
and the SORT variable S (White space). Thin was interpretable in terms
of an increase in intelligence due to an increase in persistence as
measured by S. Also unpredicated were correlations between n and H
(Human* part of whole), and that between s and P (Popular response).
The last group was felt to have been treated differently enough
from the other two to cast doubt on it® comparability to the other two.
Thus, the finding that Group III had no predicted correlations reach the
level of significance was not completely surprising. Even more signifi-
cant may be the fact that the correlations obtained were very difficult to
interpret in terms of theories used to explain the other two groups'
results. The negative correlation of Dd with g and with a might be in-
terpreted as indicating that the tendency to concentrate on minor details
reduces intellectual functioning in a general way and more particularly
in the area of Spatial Aptitude. The correlations of s and q (Clerical
Aptitude) with D (Major blot detail), p (Form Perception) with FC
(Good form and color) and Fch (Shading), and s with O (Original response)#
are not readily explained.
The three groups were not similar on the whole, but Groups I
and II showed a general overall pattern in one respect. Both I and II

41
had correlations between personality variables and the GATB variables
g, n, v, and s, and had none with p and q. The variables g, n, v, and
8 are similar in that they all involve a symbolic manipulation on a much
Mgher level than that of p and q» which measure perceptual aptitude®#
This might, therefore* be interpreted as indicating that personality is
more closely related to aptitudes involving greater abstractions than
those of l e t t e r abstractions. The differences in the results of the groups
may indicate that they could also be accounted for by chance* i . e«. the
tests don't actually measure the same traits and the correlations re-
sulted by chance.
Conclusions
The conclusions which may be drawn are limited by two
considerations. First, the results may be due to change and therefor#
lack meaning. Second, the conclusions must be limited in application
to other groups by consideration of the composition of the groups in this
study* Even if the results are not due to chance, this second concept
must be kept in mind. The conclusions presented here are based on
the assumption that the findings are not due to chance.
While the specific relationships of personality awl aptitudes
may not be stable, there is the tendency for personality to be more
closely related to aptitudes involved in greater abstraction than to
aptitudes of less abstraction. This was suggested by Groups I and !L
Group III is not considered because of the variation in procedure

42
previously noted. From the advanced group, F - appears to be related
in a general way to intelligence involved in mathematical and spatial
abstraction. From Group U# S seems to be related in a general way to
verbal and mathematical aptitudes. However, the most meaningful
conclusion from this etudy might be that the relationships between
personality and aptitude® cannot be measured with reliability unlng the
GATB and SORT, if such relationship® exist at all.

APPENDIX
TABLE XI
INTERCORRELATIONS OF THE GATB VARIABLES OF GROUP t
g n at P Q
g .412 .725 . 5 8 1 .378 . 120 V * 308 .044 i2W .135 n . 234 • i 270 . 2 2 3 » *472 . 0 9 9
P .447 q
TABLE XU
INTERCORRELATIONS OF THE GATB VARIABLES OF GROUP II
* V a § P q
S .612 ,780 . 736 .'57$ .470 V .339 .288 . 408 .•545 a .431 .534 .535 s < 523 .30®
P . 646 Q
43

44
TABLE Kill
INTERGGRRELATIONS OF THE GATB VARIABLES OF GBO0P III
8 V n a P f|
g . ?3S . s o t .835 . 384 . a i t V .420 . 463 . 32? .356 n .$21 .427 .419 a .343 .081 P • 743
'

S3
<
Jm o
u
sa %
pgi
m
CI
45 © N n o D ' c o S i f l N e a x N u o g tfSNi.OPJiAHOOW^StflSO* • • • • • • • • • • • • « * t l i l t # I
"W'H ^ "ifiai ^ © o» i i S o S m m m & h o «*$ © 51 *4 m
i i
i «
c* 55 tj» CM €*i 10 «fr 00 ** o ̂ m S © o
««( SSI
I I » * i i
I** £H M © *• -to
I I I
e* e* r* e*s ^ ^ <*l «*4 $* O C* M ©
• • « 9 I I 9
t i l * t
<# m © **# *• m © m m m m m m $** © o « ^ W H I i t » f
CO *• C* 490 ct *1 **i # <& «0( ** 9 © © a «* e« o ©
S U 3 8 3 5 *» <p*t « eg ^
tw <# o «S N K5 e<9 *4 «* ©
® OJ © 1(5 8 SI IP © Ci w • • • »
© 10 o
tf» **l W H # • * *
* I *# (ft f* #| r* €i
* *
i «
a C0
S4- , _ § Q fc "§ SQte feS^faOpE»<l f f l f t .O
i> H
m H
2 « ™ 8
o
1 m t SB
0
s N o o w s e ^ s ^ O T i H c ^ t o c - a i a i j - ' ^
• • • • • • • • • • • • • »
1 1 1 1 1 4 I t
ft*
5 $ $ 1 2 5 ^ $ 8 3 3 2 S 8 1 t « i « I «
» « * i a * » t i * f 5 < & o o t » o 0 0 9
• « • • * • • • • • • •
1 I 1 1 t t 1 1 1 t
< • • • * • • « • • • • 1 1 i 1 1
Fch
j i 1
tttj)0f«0O«0OO
• • • * • # • • • • t I « I t t i
fo Q
Q O < # * t f t ' 0 * t » 0 * c » O • • • • • • • • •
i i t i t
8 € ^ 0 3 ^ c i f l o c s | i « f • « • • • • • •
I I f i l l
FM
q> & m m m m m o o o S w o n • • • • • • •
i i i i §
91
m m n m m &* 5 u l M ^ co 00 * 9 ( f t C9 O v * O • • • * • •
1 1 1 « 1
1
f ® ^ H CSJ £ * o© c** * 0
• * * * «
1 1 1 1
1 fa
m «# m m m m m *# * # m m
' * * # •
i
m
«*$ m t f i mom m « * m '% • •
•
S $* * < &
0! *4 CD C* » •
*
ft
m m • i
£ • a t » S y fe o
^ Q Q c f t f r f e S f e f e U f e ^ S & O
46

M H
s s 3 8
3 §
o
s
0
op»NH « o « a i f l « « o « o i f iHN#ci>f ( f l o ) o o n « N p • « * • * • • • * • « • • •
i i i i i i i
A*
fA 0) ^
» • • • • * • • • • • • » 1 i l l 1
33 t i i i i t § i
• • • * • • • • * » • § t i t t i
€ fc
^cftCi#*wt^3§c-»G»c5 * • ' • • • • • • • •
i » i i i §
f&t
u
<*0*OC*<#C»tt<NfC*
• * • • ' • • • • •
» l I I » i
I FC
j
1H WCtOiHO^O J|» » ii '* » • • •
t 1 I I I
g
f**t c*9 «•* **t CM €5
m m *& m m m m
O H H H CO H H
1 1 1 1 «
Sf
<M f# £<* O ̂ «*
m m @* & *Hi **4 <*sp t?» 10 09 % • • • • *
1 1 1
1
fa
*o m o ^ c* tn f*«t o 0 i i H et 5 ^ ci » * 'it '» • # t «
£ m m <«$ m 51 eg <# to # S • • • •
i
w
*# M"> fr»
m m m *4 *<4 m • • *•
i «
s
o o
• * t i
Q
m m * # . i
*
£ © 2 01 £ i X S O & «3 H ft. 0
47

BIBLIOQBAFHY
Books
Allport, Gordon W., Personality. New York, Henry Holt and Company, 193?.
Baughman, B. Sar i and George S. Welch, Personality: Ji Behavioral Science, Englewood Clifffc, Hew Jersey, Prentice-Hall, lac., 1962.
Beck* Samuel 9»» & Variety of Personality Pictures. Vol. 11 of Rorschach's Test. <3 volumes), New York, Grune and Stratton, 1947.
Broadley, Charles V. and Margaret E. Broadley, Know Your Real Abilities, New York, McGraw-Hill Book Company, lac . , 1048.
Coleman, James C. * Personality Dynamics and Effective Behavior, Chicago, Scott, Foresman and Company, 1090.
Cronbach, l#ee J . , Essentials of Psychological Testing, New York Harper and Bow, 1909.
Goslin, David A., The Search (or Ability. New York, Russell Sage Foundation, 1903.
Guilford, Joy P . , Personality, New York, McGraw-Hill Book Company, Inc., 1019.
Stevenson, George H., Personality audi ts Deviations, Toronto, The Ryerson Press , 1947.'
Stone, Joics B . , 8*0 Rorschach Test, Los Angeles, California Test Bureau, 19S8,
Vernon, Philip D. , The Measurement of Abilities. New York, PhUosophical Ubrary, 1981.
48

Article®
Abrams, Elias N*, "Prediction of Intelligence from Certain Rorschach Factor*," Journal of Clinical Psychology, XI (January, 1959), 31*83.
Allen* Dean A. , "Aptitudes and Personality," Harvard Educational Review, XXVI (Winter, 1938), 17-23.
Altus, W. 0 . and Grace M. Thompson, "The Rorschach as a Measure of Intelligence," Journal of Consulting Psychology, XIH (1848), S4I-S47.
Bingham, Walter Van Dyke, Aptitude* and Aptitude Testing, New York, Harper and Brothers, 1937.
Denton, J. C. and C. W. Taylor, "A Factor Analysis of Mental Abilities and Personalities Traits," Psychometrlka. XX (March, 1055), 70-81.
Dvorak, Beatrice J . , "The General Aptitude Test Battery," Personnel and Guidance Journal, XXXV (November, ItSS), 14§*1S2.
Guilford, Joy P . , P. R. Christeruen, J . W. Frick, and P. R. Merrifield, "The Relations of Creative-Thinking Aptitudes to £ion* Aptitude Personality Traits," The University of Southern California, Reports from the Psychological Laboratory. Number 20 (December, 1887).
Holland, John JU, "The Prediction of College Grades from Personality and Aptitudes Variable®," The Journal of Educational Psychology, U (October, lifO), 245-254.
Jenkins, Thomas N., "Measurement of the Primary Factors of the Total Personality," The Journal of Psychology, LJV (October, 1962), 417-442.
Khan, Lilian, "Factor Analysis of Certain Aptitude and Personality Variables," Indian Journal of Psychology. XXXVII (Part I, 1902), 27*38.
Keimowitz, Robert I. and Heinz L. Ansbacher* "Personality and Achievement in Mathematics,n Journal of Applied Psychology, XIV (May, I960), 84-87.

50
Merrifield, P. R., J, P. Guilford, P. E. Christ® neen, J. W. Frlek, ''Inter r elationships Between Certain Abilities and Certain Traits of Motivation and Temperament," Journal of Psychology, L3CY (July, 10$!*, SI-74.
Pierce, James V., "Personality and Achievement Among Able High School Boy®,M Journal of Individual Psychology, XVtH (May* 19C1), 102-10?.
Siegel, Laurence, "Test Reviews," Journal, of Counseling Fgyeholog *»88>, n«n.
Wreaa, C. Gilbert, Leonard W. Ferguion, and John L. Kennedy* "Intelligence Level end Personality," Journal of Social Psychology, VII (August, 1»S8), 301-308.
Newspapers
Dallae Morning l|gw§* April ®, 186®.