vulnerability of tropical pacific fisheries and
TRANSCRIPT

433
Chapter 8
Vulnerability of oceanic fisheries in the tropical Pacific to climate change
Patrick Lehodey, John Hampton, Rich W Brill, Simon Nicol, Inna Senina,Beatriz Calmettes, Hans O Pörtner, Laurent Bopp, Tatiana Ilyina, Johann D Belland John Sibert
‘The Pacific Islands region is the most important tuna fishing area in the world.’ (Gillett et al. 2001)i
i Gillett et al. (2001) Tuna: A Key Economic Resource in the Pacific. Pacific Studies Series, Asian Development Bank, Manila, Philippines.
Photo: David Itano

434
Contents Page
8.1 Introduction 435
8.2 Nature and status of oceanic fisheries 436 8.2.1 Main species and their uses 436 8.2.2 Recent harvest levels 438 8.2.3 Status of stocks 440 8.2.4 Estimated current sustainable production 441
8.3 Observed effects of climate variability on tuna 443
8.4 Vulnerability of oceanic fisheries to the direct effects of climate change 447
8.4.1 Ocean temperature 447 8.4.2 Dissolved oxygen 450 8.4.3 Ocean currents 454 8.4.4 Ocean acidification 457
8.5 Vulnerability of oceanic fisheries to the indirect effects of climate change 460
8.5.1 Lower levels of the food web 460 8.5.2 Mid levels of the food web 464
8.6 Integrated vulnerability assessment 466 8.6.1 Ecosystem-tuna simulations 467
8.7 Projected changes in the catch of skipjack and bigeye tuna 475
8.8 Uncertainty and gaps in knowledge 477
8.9 Future research 478
8.10 Management implications and recommendations 480
References 485

435
CHAPTER 8
8.1 Introduction
The oceanic fisheries of the tropical Pacific Ocean are of great importance to many of the economies and people of the region1–3. In the waters surrounding the Pacific Islandsii, the four main species that underpin these oceanic fisheries, skipjack tuna Katsuwonus pelamis, yellowfin tuna Thunnus albacares, bigeye tuna T. obesus and South Pacific albacore tuna T. alalunga, yield combined harvests well in excess of 1 million tonnes each year, and support fishing operations ranging from industrial fleets to subsistence catches. Across the wider Western and Central Pacific Ocean (WCPO) these four species of tuna provide catches of about 2.5 million tonnes a year4 (Chapter 1).
The key benefits of oceanic fisheries to Pacific Island countries and territories (PICTs) are economic development, government revenue, significant contributions to food security, and employment. In five PICTs, the licence fees associated with access agreements for distant water fishing nations to harvest tuna from their exclusive economic zones (EEZs) provide between 10% and 42% of all government revenue2. In another two PICTs, fishing and processing operations for tuna contribute ~ 20% to gross domestic product (Chapter 12). Across the region, tuna fishing and processing operations employ > 12,000 people2. Tuna is also a major part of the diet for both rural and urban communities in many PICTs2,5.
Serious efforts are being made to ‘domesticate’ more of the tuna fishing and processing operations to deliver even greater benefits to the region (Chapters 1 and 12). At present, about 25% of the purse-seine vessels participating in the industrial fishery in the WCPO are flagged to, or otherwise considered to be part of, the domestic fleets of PICTs. There are plans to increase this percentage in the years ahead. Several PICTs have also attracted investments in onshore processing facilities recently. Papua New Guinea (PNG) in particular is positioning itself to process a larger proportion of the 400,000–500,000 tonnes of tuna caught each year within its waters, as well as catches from the EEZs of other PICTs. Such development would double the 8550 people, mostly women, currently employed in existing processing facilities in PNG (Chapter 12).
All such plans depend, however, on sustainable management of resources. Because tuna are highly migratory, such management involves the cooperation of all countries within the distribution zones of the main species, and the distant water fishing nations from outside this region that also harvest these fish. Consequently, management is focused on the entire WCPO, i.e. the Pacific Ocean west of 150°W. The institution mainly responsible for managing tuna resources and fisheries across the WCPO is the Western and Central Pacific Fisheries Commission (WCPFC), supported by the Forum Fisheries Agency (FFA), the Parties to the Nauru Agreement (PNA), and the members of the Te Vaka Moana Arrangement. National fishery services and agencies including the Western Pacific Regional Fishery Management Council (WPRFMC) for the US Pacific Islands (Chapter 1), are also actively involved in management.ii Approximately 130°E to 130°W and 25°N to 25°S.
436
As a result of the concerted and combined action of these institutions, the status of most of the tuna resources of the tropical Pacific is considered to be healthy by global standards (Section 8.2.3). Nevertheless, the populations of tuna in the region are coming under increased pressure as stocks in other oceans become overfished, and global demand and prices for tuna increase, encouraging even more fishing effort and capacity. The need for effective management is greater than ever. However, assessing the size of the stocks of the four species of tuna, and the effects of fishing, to provide a sound scientific basis for management decisions is not straightforward. In particular, the effects of fishing on these highly migratory species is complicated by variation in the vast WCPO (Chapter 3), and the food webs supporting tuna (Chapter 4). Some of the most profound changes in the tropical Pacific Ocean affecting the catches of tuna are related to the El Niño-Southern Oscillation (ENSO), especially the effects of El Niño and La Niña episodes on water temperature and primary production6,7 (Section 8.3).
Given the very strong influence of ENSO on the distribution and abundance of tuna in the equatorial Pacific, there is considerable concern that projected changes to the WCPO and oceanic food webs (Chapters 3 and 4) may also have significant effects on tuna resources. The purpose of this chapter, therefore, is to assess the likely effects of climate change in the tropical Pacific on the oceanic fisheries that are so important to the economies of PICTs, and the livelihoods and food security of their people.
To set the scene, we describe the composition of the oceanic fisheries in the region, how the main species are caught and used, the status of the stocks, and the estimated harvests they can sustain. Because ENSO events have such a profound effect on the distribution and abundance of tuna, we also describe how these fish respond to El Niño and La Niña episodes. We then assess the vulnerability of tuna to the direct and indirect effects of climate change under low (B1) and high (A2) Intergovernmental Panel on Climate Change emissions scenarios8 for 2035 and 2100, using the vulnerability framework outlined in Chapter 1. We conclude with an assessment of the consequences of this vulnerability for future harvests from oceanic fisheries, remaining uncertainty, gaps in knowledge, the research required to improve future assessments, and management recommendations to help PICTs maintain the benefits of their important oceanic fisheries in the face of climate change.
8.2 Nature and status of oceanic fisheries
8.2.1 Main species and their uses
The oceanic fisheries of the tropical Pacific are comprised of large fish species that complete their life cycles in the open ocean and have only limited dependence on coastal habitats for food. As outlined above, the oceanic fisheries of the WCPO are dominated by skipjack, yellowfin and bigeye tuna and South Pacific albacore, which

437
CHAPTER 8
together represent > 90% of the total catch taken by industrial fleets. The remainder of the catch is comprised predominately of billfish (marlin and swordfish), oceanic sharks and Pacific bluefin tuna (T. orientalis).
The industrial tuna fisheries in the EEZs of PICTs are based on the use of large vessels owned by major fishing companies, with much of the catch marketed by multinational fish trading corporations4. The largest of the two main fisheries is commonly referred to as the ‘surface fishery’, where purse-seine and pole-and-line vessels (Figure 8.1) target schools of skipjack tuna, and the smaller size classes (< 80 cm)of yellowfin tuna, in the equatorial regions of the WCPO9. The catch from the surface fishery is used for canning. Although juvenile bigeye tuna are not the target of the surface fishery, the use of floating fish aggregating devices (FADs) now aids the capture of this species. The surface fishery also includes boats that use trolling gear to target albacore, and small-scale artisanal fisheries using various fishing gear such as handlines and ringnets.
Figure 8.1 The main species caught by oceanic fisheries in the tropical Pacific Ocean and the vessels used by the industrial surface and longline fisheries.

438
The second of the two main fisheries is based on longline vessels (Figure 8.1) that target mature bigeye and yellowfin tuna in equatorial waters for the Japanese sashimi trade and other high-value markets. In southern subtropical waters, the longline fishery catches mainly albacore for canning, but also a proportion of high-value yellowfin and bigeye tuna. The fleets engaged in the surface and longline fisheries are a mix of domestic vessels from PICTs and those from distant water fishing nations4.
8.2.2 Recent harvest levels
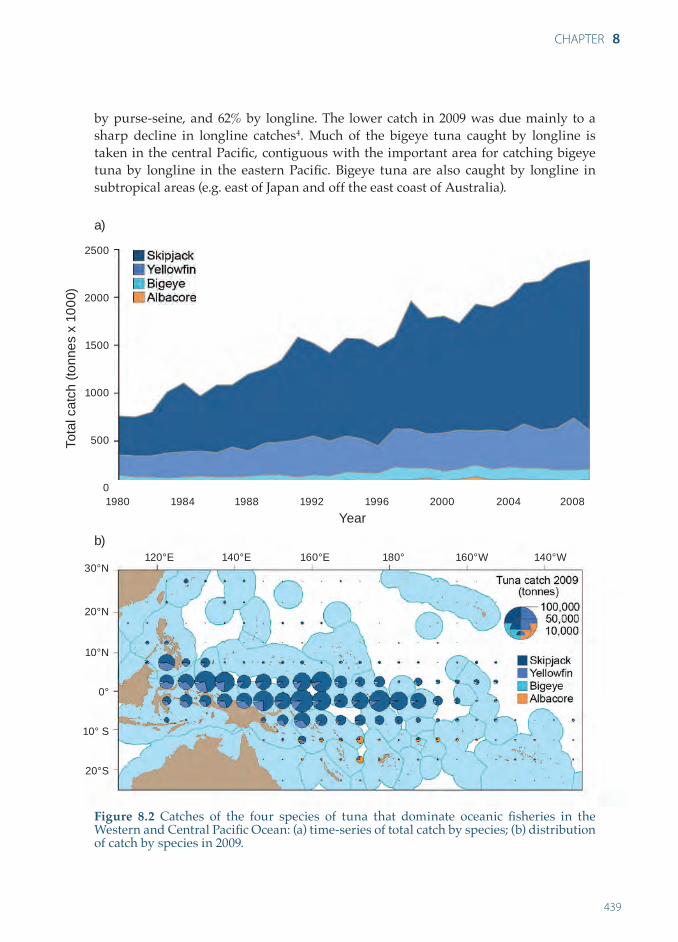
Over the past five years, the total catch of the four main species of tuna from the WCPO has increased, with the catch of ~ 2,468,000 tonnes in 2009 being the highest recorded4 (Figure 8.2a). The catch by pole-and-line, longline and artisanal fisheries has remained relatively stable over time; the increase has been due mainly to the development of the purse-seine fishery. The purse-seine and pole-and-line vessels in the surface fishery landed 77% and 7% of the total catch from the WCPO, respectively. The longline fishery accounted for 9%, and the remainder (7%) was taken by troll gear and a variety of artisanal fishing methods, mostly in eastern Indonesia and the Philippines. The catches from the WCPO represented 58% of the estimated global tuna catch in 2009. Based on an average for 2005–2009, ~ 48% of the catch from the WCPO comes from the waters of PICTs. In this area, 96% of the catch is taken within the EEZs of the eight countries that are the Parties to the Nauru Agreement (PNA)iii.
Skipjack dominates the total catch of tuna from the WCPO (Figure 8.2a) and almost all the catch of this species is taken by purse-seining. In 2009, the skipjack catch from the WCPO was ~ 1,790,000 tonnes, of which 52% was caught within the area under the juridiction of PICTs (Figure 8.2b). In this area, 99% came from the EEZs of PNA members. The distribution of skipjack tuna catches by purse-seine vessels in equatorial areas is not constant, but varies greatly according to ENSO events6 (Section 8.3).
The annual catch of yellowfin tuna in the WCPO has generally been between 400,000 and 470,000 tonnes in recent years4. Most of this catch (64%) is taken by purse-seine vessels, with 60% of the total purse-seine catch from the WCPO in 2009 coming from the area of PICTs, harvested almost exclusively (99%) from the EEZs of PNA members. The longline catch of yellowfin tuna has ranged from 75,000–82,000 tonnes in recent years, which is well below the catches taken in the late 1970s to early 1980s (90,000–120,000 tonnes). The east-west distribution of yellowfin tuna caught by purse-seine is also strongly influenced by ENSO events, with larger catches taken east of 160°E during El Niño episodes9.
Landings of bigeye tuna increased during the late 1990s in association with the expanding use of drifting FADs by purse-seine vessels4. In 2009, the catch of bigeye tuna from the WCPO – the lowest since 2003 – was ~ 119,000 tonnes, with 36% taken iii PNA members are: Federated States of Micronesia, Kiribati, Marshall Islands, Nauru, Palau,
Papua New Guinea, Solomon Islands and Tuvalu (www.pnatuna.com). Their EEZs represent ~ 12% of the WCPO convention area.
439
CHAPTER 8
by purse-seine, and 62% by longline. The lower catch in 2009 was due mainly to a sharp decline in longline catches4. Much of the bigeye tuna caught by longline is taken in the central Pacifi c, contiguous with the important area for catching bigeye tuna by longline in the eastern Pacifi c. Bigeye tuna are also caught by longline in subtropical areas (e.g. east of Japan and off the east coast of Australia).
Figure 8.2 Catches of the four species of tuna that dominate oceanic fi sheries in the Western and Central Pacifi c Ocean: (a) time-series of total catch by species; (b) distribution of catch by species in 2009.
2500
2000
1500
1000
500
0
30°N
20°N
10°N
0°
10° S
20°S
Tota
l cat
ch (t
onne
s x
1000
)
Year1980 1984 1988 1992 1996 2000 2004 2008
120°E 140°E 160°E 180° 160°W 140°W
a)
b)

440
Since 2001, annual catches of South Pacific albacore have exceeded 50,000 tonnes, partly as a result of the growth in domestic longline fisheries of PICTs. In 2009, the total catch (66,996 tonnes) was the highest on record, with good catches from the longline fishery4. The longline catch of albacore in subtropical waters of PICTs was 30,943 tonnes (46% of total catch), with the remaining catch coming mainly from the distant water longline fleet (34,026 tonnes) and the troll fishery (2027 tonnes) in New Zealand waters and the adjacent subtropical convergence zoneiv.
Among the other species, the greatest catches are of swordfish, which are targeted by longliners in the northern Pacific off Japan and Hawaii, off eastern Australia and in the subtropical waters of the south-central Pacific. Since 2000, the annual catches of swordfish from the WCPO have averaged about 20,000 tonnes. The catches of striped and black marlin have averaged ~ 4700 and ~ 2000 tonnes, respectively. Reliable catch statistics for other species in the oceanic fishery are not available.
8.2.3 Status of stocks
The status of tuna stocks in the WCPO, and in the area of the juridiction of PICTs, is assessed regularly using models that describe the population dynamics of each species9,10 and discussed at the annual scientific meeting of the WCPFC11. The most sophisticated of these models integrate catch, fish size and tagging data12. The purpose of using these models to monitor the status of the four species of tuna is to estimate parameters that determine the probability that a stock has breached key management thresholds. The key indicators for each species of tuna are the ratios of current fishing mortality (F) and stock biomass to the values of these variables that result in the maximum sustainable yield (MSY)13 (Box 8.1).
The most recent stock assessments for skipjack tuna show that this species is currently exploited at a moderate level relative to its biological potential (Figure 8.3). Current fishing mortality rates are estimated to be below the FMSY reference point (Box 8.1) and overfishing is not occurring (i.e. FCURRENT < FMSY)10. Similar conclusions have been drawn for albacore14 and yellowfin tuna15 (Figure 8.3). However, caution is warranted for yellowfin tuna, because in the equatorial zone where 95% of the WCPO catch is taken, levels of fishing mortality and spawning biomass (SB) are close to their MSY levels.
The latest stock assessments for bigeye tuna are less optimistic (Figure 8.3). The current estimated fishing mortality rates are significantly greater than the FMSY level(FCURRENT > FMSY) and overfishing is occurring for this species16. In the WCPO, recent catches of bigeye tuna have been sustained by higher-than-average levels of recruitment, which have also maintained spawning biomass above the SBMSY level (Box 8.1). Future levels of recruitment are highly uncertain and a return to long-term average levels of recruitment is expected to result in a rapid decline in spawning biomass to below the SBMSY level16.
iv Note that catch estimates for all four species of tuna are revised regularly – see www.wcpfc.int/statistical-bulletins for improved estimates for 2009.

441
CHAPTER 8
Figure 8.3 Status of the stocks of the four main species of tuna caught in the tropical Pacific in 2009. The horizontal axis represents the level of spawning biomass (population of mature fish) relative to the level resulting in the maximum sustainable yield (MSY) (Box 8.1). The vertical axis represents the level of fishing mortality (intensity of fishing) compared with the level resulting in MSY. The area of the graph above the horizontal line (red and orange) indicates that overfishing is occurring, while the area to the left of the vertical line (red and yellow) indicates that the stock has been overfished. Lines represent confidence limits for the assessments of each species in 2009. Changes in the stock status of each species over the history of the fishery are provided in recent stock assessment reports10,14–16.
8.2.4 Estimated current sustainable production
The sustainable harvest for each species of tuna can be estimated from the stock assessment models. If skipjack tuna recruitment remains at recent above-average levels, which may not necessarily occur because of the natural, climate-related, variability of fish stocks19, it is estimated that around 1.8–2.0 million tonnes can be harvested each year from the equatorial zone of the WCPO11. The annual maximum sustainable yield of yellowfin tuna from the WCPO is estimated to be ~ 440,000 tonnes, whereas the MSY for bigeye tuna is calculated to be ~ 120,000 tonnes, and ~ 98,000 tonnes for albacore10,14–16.
Fish
ing
mor
talit
y re
lativ
e to
MSY
leve
l
Mor
talit
y to
o hi
gh (o
verfi
shin
g)2.0
1.5
1.0
0.5
0.0
Biomass too low (overfishing)
Bigeye
Yellowfin
AlbacoreSkipjack
Spawning biomass relative to MSY level
0.0 0.5 1.0 1.5 2.0 2.5 3.0 3.5

442
Box 8.1. Maximum sustainable yield
The concept of maximum sustainable yield (MSY) is often applied to the management of large-scale fisheries. This simplistic model relates long-term average catch (or yield), fishing mortality, and spawning biomass, based on the assumption that key characteristics of the fish stock, such as natural mortality rates, growth rates and recruitment for a given level of spawning biomass, do not change over time17,18. Either the MSY itself, or the FMSY and SBMSY (see diagram below) are frequently used as ‘reference points’. If these reference points are exceeded, appropriate management actions to reduce fishing are then implemented.
When fishing mortality exceeds FMSY, overfishing is said to be occurring, and when the spawning biomass falls below the SBMSY, the stock is said to be in an overfished state. Management systems using MSY-based reference points need to accommodate variability in the population processes that result from fluctuations in environmental conditions, such as recruitment, natural mortality and catchability. Such systems also need to make allowances for changes in the fishery, such as increasing efficiency of fishing effort or changes in the sizes of fish being targeted.
Maximum sustainable yield (MSY): The maximum average long-term catch that can be taken from a fishery assuming that the productivity characteristics of the stock do not change over time.
Fishing mortality at MSY (FMSY): The level of fishing mortality, or intensity of exploitation, that results in the MSY being achieved.
Spawning biomass at MSY (SBMSY): The level to which the spawning biomass of a fish stock will fall if the MSY is taken on a continuous basis.
0.0 0.5 1.0 1.5 2.0 2.5 3.0
0.0 0.5 1.0 1.5 2.0 2.5 3.0
1.0
0.8
0.6
0.4
0.2
0.0
1.0
0.8
0.6
0.4
0.2
0.0
Rel
ativ
e sp
awni
ng b
iom
ass
Rel
ativ
e yi
eld
Relative fishing mortality
443
CHAPTER 8
Fishing mortality for these species is currently constrained by a combination of conservation and management measures (CMMs) implemented by WCPFC, PNA and individual PICTs. Total effort in the purse-seine fishery is currently constrained mainly by the total number of fishing days allowed in the EEZs of PNA members, and on the high seas, as provided under the WCPFC’s CMM 2008-01. This CMM presently incorporates a 3-month closure each year for purse-seine fishing on FADs, other floating objects and whale sharks – a measure designed to reduce fishing mortality on juvenile bigeye and yellowfin tuna. In addition, the CMM specifies certain limits on the catch of bigeye tuna by longline. The aim of CMM 2008-01 is to reduce fishing mortality of bigeye and yellowfin tuna, but it also serves to limit to some extent future growth of skipjack tuna catches by restricting the expansion of purse-seine effort. Various exemptions mean, however, that the limits to effort specified by the CMM actually allow for a considerable expansion in purse-seine fishing from present levels20. Furthermore, the efficiency of purse-seine fishing effort is increasing because of the use of new technology, resulting in progressively higher catches of skipjack.
The PNA members are also placing limits on purse-seine fishing effort within their EEZs, through a ‘vessel day scheme’. PNA also introduced a policy in 2010 of licencing only those purse-seine vessels that do not fish in the two tropical high-seas pockets, a policy subsequently adopted by WCPFC. PNA recently decided to extend this policy in 2011 to other areas of the high seas between 10°N and 20°S in the tropical WCPO. WCPFC and PNA have also implemented a catch retention policy whereby all skipjack, yellowfin and bigeye tuna captured by purse-seine must be retained on board and landed (or transshipped). Observers are now also generally required on all purse-seine vessels fishing in the region to monitor compliance with these measures. The prohibition on discarding tuna will also help meet the need to use fish for food security (Chapters 1 and 12) by making tuna available at low cost in those urban centres where transshipping occurs.
For albacore, catch and effort are limited mainly by the individual licencing policies of PICTs. However, WCPFC, through CMM 2005-02, has also restricted the number of vessels fishing for albacore in the region south of 20°S to no more than the average number in 2005, or 2000–2004.
8.3 Observed effects of climate variability on tuna
It is now evident that the dynamics of many marine fish stocks are linked to multiple scales of climate variability19,21,22. Changes in climate, manifested through variation in sea surface temperature (Chapters 2 and 3), for example, can affect the distribution and migration patterns of marine fish, and the survival of larvae and subsequent recruitment of young fish (Chapter 1). An important case in point is the large-scale, east-west displacements of skipjack tuna in the equatorial Pacific, which are correlated with ENSO events6. ENSO is an oscillation between a warm

444
(El Niño) and a cold (La Niña) state, which evolves under the influence of the dynamic interaction between atmosphere and ocean, with an irregular frequency of 2–7 years (Chapter 2). Because the interannual variation in abundance and distribution of skipjack tuna is fundamental to this chapter, we explain the known effects of ENSO events on this important species in more detail below.
The physical oceanography of the tropical Pacific Ocean is influenced strongly by the North Equatorial Current (NEC) and the South Equatorial Current (SEC) (Chapter 3), which are driven by the prevailing trade winds blowing from east to west. En route, the water temperature of the currents at the surface increases, resulting in the formation of a thick layer of warm water (> 29°C) on the western side of the Pacific basin, commonly known as the ‘Warm Pool’. In the eastern and central Pacific, the NEC, SEC, and the rotation of the Earth create a divergence at the equator, which causes an upwelling of deeper cold water and a relatively shallow thermocline (Chapter 3). This region, known as the Pacific Equatorial Divergence (PEQD) province23, is rich in nutrients that increase the primary production in the upper layer of the ocean (Chapter 4), creating a productive ‘cold tongue’ of surface water. In comparison, productivity in the adjacent provinces, the North Pacific Tropical Gyre, the South Pacific Subtropical Gyre and the Warm Pool, is markedly lower (Chapter 4).
The general east-west water transport is counter-balanced by the North Equatorial Counter Current (NECC) and the South Equatorial Counter Current (SECC), the Equatorial Undercurrent (EUC) and the retroflexion currents (Kuroshio and East Australian Currents), which constitute the western boundaries of the northern and southern subtropical gyres (Chapter 3). There is limited seasonal variation in these prevailing oceanographic conditions in the tropical Pacific, but strong interannual variability due to ENSO.
During La Niña episodes, stronger trade winds increase the intensity of the SEC and push the Warm Pool to the extreme west of the equatorial Pacific. Upwelling intensity in PEQD also increases, bringing the thermocline closer to the surface, while it deepens in the Warm Pool (Chapters 3 and 4). Conversely, during El Niño events, the trade winds weaken and allow the warm waters of the Warm Pool to spread far to the east in the central Pacific. The upwelling of nutrient-rich waters in PEQD decreases in intensity. The thermocline deepens in the central and eastern Pacific, and rises abnormally in the western Pacific.
The extension of the warmer water preferred by skipjack tuna to the east during El Niño episodes results in greater catches of this species in the region where the Warm Pool and PEQD converge: this convergence appears to promote the aggregation of the macrozooplankton and micronekton that are the prey of skipjack6
(Chapter 4). The longitudinal displacement of the front of the Warm Pool to the east can be followed using the 29°C isotherm. However, the sea surface salinity gradient, and the formation of a subsurface density barrier layer at the convergence24, are better markers of the eastern edge of the Warm Pool.

445
CHAPTER 8
These displacements of skipjack tuna related to ENSO occur over the entire western-central equatorial Pacific (Figure 8.4), and lead to large fluctuations in catches from the EEZs of PICTs. During El Niño events, higher purse-seine catches are made in PICTs in the central Pacific, such as Kiribati (Line Islands). However, the eastward extension of the Warm Pool during El Niño episodes is also associated with a shallowing of the thermocline, and stronger wind stresses than usual in the western Pacific, leading to an increase of primary production in the western equatorial Pacific7 (Chapters 3and 4). As a result, catch rates in the Solomon Islands and PNG increase several months after the completion of an El Niño episode in response to the increased productivity, higher recruitment and contraction of skipjack habitat. This is especially the case if an El Niño event is followed by a La Niña episode, when the nutrient-rich waters of PEQD typically extend as far west as 160°E.
Figure 8.4 Impact of El Niño-Southern Oscillation (ENSO) on skipjack catch distribution and movement in the Western and Central Pacific Ocean. (a) Skipjack tuna catch (tonnes) and mean sea surface temperature (°C) in the tropical Pacific Ocean during the first half of 1989 (La Niña period) (top panel), and in the first half of 1992 (El Niño period) (bottom panel), showing effects of ENSO on the location of the Warm Pool (28–29°C) and distribution of skipjack catch. (b) Average monthly skipjack catch per unit effort (CPUE) by purse-seine vessels in the western equatorial Pacific; blue line is the longitudinal gravity centre of CPUE, black line is the 29°C SST isotherm, and red line is the Southern Oscillation Index (SOI); each variable was smoothed with a 5-month moving average.
Changes in the depth of the thermocline in the Warm Pool associated with ENSO events not only influence the abundance of tuna, but also affect the catchability of some species. The shallowing of the thermocline during El Niño episodes reduces the depth at which yellowfin tuna have access to abundant food, which increases catch
a) b)Ye
ar 140°E 180° 140°W 100°W
2010
2005
2000
1995
1990
1985
140°E 180° 140°W 100°W
40°N
20°N
0°
20°S
40°S
40°N
20°N
0°
20°S
40°S
40 000 mt20 000 mt4 000 mt
40 000 mt20 000 mt
4 000 mt

446
rates of this species by the surface fishery25. The opposite happens during La Niña events, when a deeper thermocline extends the vertical habitat of both yellowfin and bigeye tuna, reducing the concentration of these species in shallower water and their vulnerability to surface fishing gear. Catches of skipjack tuna are not greatly affected by the depth of the thermocline because this species lives in the surface layer, and is vulnerable to being caught by purse-seine and pole-and-line vessels at all times.
Longline catch rates of both bigeye and yellowfin tuna also seem to increase in regions of increased SST and greater vertical stratification26. For albacore, higher catch rates are recorded from the southern subtropical areas of the Pacific Ocean six months before, or at the onset of, El Niño episodes27. This pattern is linked to a shallowing of the mixed layer depth in equatorial waters (Chapter 3), and a reduction in extent of the 18 to 25°C isotherms in the water column, which are the preferred temperature range of adult albacore28.
There is also evidence that recruitment of tuna is influenced strongly by variability in ENSO. Recent estimates from a population dynamics model showed a link between skipjack tuna recruitment and ENSO events29, with the biomass of fish recruited to the stock being correlated with the Southern Oscillation Index (Chapter 1) eight months earlier (Figure 8.5). Thus, it seems that the dominance of either El Niño or La Niña episodes during multi-year periods, possibly in correlation with the Pacific Decadal Oscillation (Chapter 1), can result in either high or low productivity of tuna.
The frequency and intensity of the southern oscillation may also have a key role by regularly resetting the equatorial system, i.e. when a La Niña event starts after an El Niño event. This mechanism affects reproduction and growth of many organisms in the food web, allowing populations of tuna to produce strong cohorts regularly.
Figure 8.5 Estimated biomass (tonnes) of young skipjack tuna (heavy blue line) in the Western and Central Pacific Ocean, and the Southern Oscillation Index (SOI) lagged by 8 months (shaded blue line) (source: Senina et al. 2008)29. Note that SOI has been multiplied by 10 to highlight the variation.
5.5
5.0
4.5
4.0
-30
-20
-10
0
+10
+20
+30Bio
mas
s (x
106
tonn
es)
Sou
ther
n O
scill
atio
n In
dex
Year
1975 1980 1985 1990 1995 2000
1975 1980 1985 1990 1995 2000 2005

447
CHAPTER 8
8.4 Vulnerability of oceanic fisheries to the direct effects of climate change
Much evidence suggests that, like many other marine organisms, the four main species of tuna in the tropical Pacific Ocean are likely to respond to the projected changes in water temperature, dissolved oxygen (O2), ocean currents and ocean acidification described in Chapter 3. Such responses allow species to optimise their use of energy for growth, movement, predation and reproduction30,31. Species with more efficient physiological O2 supply systems have greater geographical and thermal distributions32,33. Moreover, the greater the thermal window of aerobic performance (or thermal niche), the more competitive a species is at the ecosystem level34. The direct effects of climate change have much scope to alter the physiological performance of the main species of tuna and, therefore, their survival, distribution and abundance. The effects on the thermal niche of a species are particularly important in the context of climate change because multiple stressors, such as hypoxia, predation pressure or competition, may narrow this thermal window and decrease physiological performance.
In this section, we assess the vulnerability of the four species of tuna to projected changes in ocean temperature, dissolved O2, ocean currents and ocean acidification described in Chapter 3. Because the modelling we report in Section 8.6 is based on the IPSL coupled climate model (IPSL-CM4), we refer in some places to the changes projected by this model, rather than the multi-model means from the Coupled Model Intercomparison Project Phase 3 (CMIP3) multi-model dataset35 given in Chapter 3. We assess the vulnerability of tuna species by integrating their exposure and sensitivity to the projected physical and chemical changes in the tropical Pacific Ocean to provide a potential impact, which may or may not be reduced through the adaptive capacities of tuna.
8.4.1 Ocean temperature
Exposure and sensitivity
The sea surface temperature of the tropical Pacific Ocean, based on the CMIP3 models, is projected to rise by 0.7–0.8°C under the B1 and A2 emissions scenarios by 2035 relative to 1980–1999; and by 1.4°C under B1 and 2.5°C under A2 in 2100 (Chapter 3). Changes in SST simulated by IPSL-CM4 for the tropical Pacific Ocean project greater warming. By 2035, SST is projected to rise by 1.5°C under the B1 and A2 scenarios relative to 2000–2009; and from no change to 5°C under B1 and 1.5–6°C under A2 by 2100. At a depth of 80 m, water temperature is expected to rise by 0.5°C in 2035 under B1 and A2, and by 1.0°C and 1.5°C under B1 and A2 in 2100, respectively (Chapter 3).
Sea surface temperatures in the central and east equatorial Pacific are expected to warm more than those in the west. However, the size of the Warm Pool (as defined by the 29°C isotherm) is projected to increase by 230–250% by 2035 under B1 and A2,

448
and by 480% under B1 and 770% under A2 in 2100 (Chapter 3). This increase is likely to result in average background SST conditions which may be described as ‘El Niño-like’. ENSO events themselves are projected to continue for the remainder of the 21st century at least, although there is little agreement among models about the frequency or amplitude of El Niño and La Niña episodes in the future36 (Chapter 2).
Tuna have specialised anatomy (i.e. a vascular counter-current heat exchanger) allowing them to sustain muscle temperature significantly above ambient temperature, thus increasing both their physiological performance and the range of temperatures in which they can live37–43. A potential disadvantage of this heat-conserving mechanism is that it may cause overheating, especially at large body size39,44,45. Tuna can, however, reduce the efficacy of their vascular counter-current heat exchangers, i.e. they can thermoregulate physiologically, to dissipate a large part of metabolically produced heat at reduced excess muscle temperatures46–50.
Excess heat can also be dissipated simply by moving into colder waters, either temporarily through regular descents51,52, or with seasonal migration to higher latitudes. In this way, the feeding habitat of adult fish can be extended to the rich, deep forage layer53, or to more productive temperate surface waters.
Nevertheless, each species of tuna has a limited range of SST within which it occurs (Table 8.1). In addition, it is not always appropriate to use SST for estimating the distributions of tuna, because these fish species make extensive vertical movements to feed. For example, albacore in tropical areas are commonly caught where SSTs are ~ 30°C, but they are captured on longline gear at depths of 150–250 m, where water temperatures are 18–25°C54.
Table 8.1 Range of sea surface temperatures (SSTs) throughout the distributions (all occurrences) of tuna species in the Pacific Ocean, together with the SST range where substantial commercial catches are made (abundant occurrences) (source: Sund et al. 1981)30.
Common name Species All occurrences (°C)
Abundant occurrences (°C)
Skipjack Katsuwonus pelamis 17–30 20–29
Yellowfin Thunnus albacares 18–31 20–30
Bigeye T. obesus 11–29 13–27
Albacore T. alalunga 13–25 15–21
Southern bluefin T. maccoyii 10.5–21 17–20
The different life stages of each species of tuna can be expected to have different sensitivity to changes in SST because the difference between body temperature and ambient water temperature is linked to (1) the whole-body heat-transfer coefficient, (2) the rate of temperature change due to internal heat production, and (3) ambient water temperature and body temperature48,55. Indeed, tuna are most sensitive to water temperature during their larval and juvenile life stages and widen the range of their thermal habitat as they grow.
449
CHAPTER 8
At the scale of a population, thermal habitat at steady state can be represented by a size-based Gaussian distribution, i.e. a distribution with an optimal temperature and a standard error for each size cohort, where the optimal temperature decreases with size and the standard error increases with weight56. This model relies, however, on the assumption that each species has evolved an intrinsic body (cellular) temperature at which its physiological performance is optimal. Our general knowledge on the reproductive biology and ecology of tuna also indicates that the optimal temperature window is narrowest and warmest for spawning.
Potential impact and adaptive capacity
The projected warming of the tropical Pacific Ocean may have two main effects on the basin-scale distributions of the four species of tuna. The first involves possible changes in spawning location and success. Because all tuna species return to the tropics to reproduce30, they may face greater overheating problems, and more limitations to their activity, as SST increases as a result of global warming. Although tuna are known to make regular descents into colder water at high ambient temperatures to alleviate elevated heat transfer, electronic tagging data suggest that their physiological thermoregulatory mechanisms are of limited value in preventing overheating. Changes in temperature (and other environmental variables) may, therefore, lead to phenological adaptation, i.e. arriving earlier on spawning grounds, or use of more subtropical areas for spawning. Spatial shifts in the distributions of young fish are expected to occur if new spawning areas are used, with possible consequences for recruitment due to altered feeding success and rates of predation.
The second potential impact relates to changes in the distribution of the fish outside the spawning season. This is likely to be more subdued, however, due to the physiological thermoregulatory abilities of tuna, and their freedom to simply occupy greater depths, or more temperate waters, to seek out their preferred temperatures. Increased stratification of the water column, resulting from higher SST, may alter the vertical distribution of tuna and affect their access to deep-forage organisms (Chapters 3 and 4), especially skipjack and yellowfin tuna because they seem to be more sensitive to strong vertical temperature gradients. Projected decreases in dissolved O2 concentration with depth (Chapter 3, Section 8.4.2) may also interact with increasing temperatures to create an even greater barrier to vertical migration for the most sensitive species. For bigeye tuna and swordfish, which are known to be able to penetrate some dissolved O2 barriers and feed at depths > 500 m, spending more time at greater depth due to higher water temperatures at the surface may compromise the capture of prey due to the lower levels of light57–59.
Vulnerability
The vulnerability of tuna to increased SST is considered to be low due to their mobility, which is expected to enable them to move to areas within their preferred temperature ranges, both for spawning and feeding. However, the expected changes

450
in distribution of tuna are likely to have consequences for tuna fishing operations. The location of prime fishing grounds may change, and the catchability of tuna by surface and longline fisheries may alter in a way similar to that which now occurs during ENSO events (Section 8.3). In particular, good fishing grounds could be displaced further eastward along the equator, or shift to higher latitudes. Regardless of where fishing is concentrated, increased stratification could enhance the catch rates of the surface-dwelling skipjack and yellowfin tuna where SST remains within their preferred ranges.
8.4.2 Dissolved oxygen
Together with temperature, the availability of dissolved oxygen is the other fundamental variable that constrains the physiology of marine organisms. Both variables are intimately linked because the concentration of O2 in water is related to temperature (Chapter 3). The performance of oceanic fish species is related to the availability of dissolved oxygen, and the capacity of their ventilatory and circulatory systems to supply sufficient O2 to meet their physiological requirements over and above basic maintenance functions. However, this aerobic capacity is thermally limited, which means that it quickly decreases outside the optimal temperature window of the species34,60.
Exposure and sensitivity
Information about the exposure of tuna to changes in O2 concentrations in the tropical Pacific Ocean is limited and somewhat conflicting. Oxygen concentration is not calculated in the CMIP3 climate models and only a few biogeochemical models are available to make projections of future levels of O2 in the region. In surface waters, these models indicate that a minor decrease in O2 under the B1 and A2 emissions scenarios by 2100 is likely, due to the reduced solubility of gases in warmer water. In subsurface waters, the increased temperature and stratification of the ocean at higher latitudes are expected to lead to decreased transfer of O2 from the atmosphere to the ocean due to less ventilation and advection, resulting in lower concentrations of O2 in the tropical thermocline (Chapter 3). As a result, under the A2 scenario in 2100, average concentrations of O2 are projected to decrease by 0.2 ml/l in the subtropical Pacific thermocline, where the observed concentrations are now ~ 3 ml/l (Chapter 3).
A recent simulation61 projects a large decrease in O2 in tropical subsurface waters under global warming, therefore reinforcing the existing low levels of O2, and suboxic areas in the eastern Pacific. This change is due to an increase in the carbon-to-nitrogen (C/N) ratio of organic matter formed in the ocean at higher CO2 levels, and the respiration of this excess organic carbon. In contrast, using a fixed C/N ratio, the IPSL-CM4 simulations projected increased concentrations of O2 in the equatorial thermocline due to reduced biological production (and therefore remineralisation/oxidation) within the water masses flowing to the equator (Figure 8.6).

451
CHAPTER 8
In general, there is closer agreement among the various models for the WCPO, where a decrease or limited change in O2 levels in surface waters is expected. However, the models project opposite trends for the eastern Pacific in subsurface waters, where there is still little consensus on the most probable mechanisms likely to control O2 concentrations.
Marine fish are highly sensitive to the availability of dissolved O2 – many species cannot maintain their metabolic rate and swim when O2 decreases to 1 mg/l or less62. The four species of tuna conform to this general pattern, although the lower, lethal, O2 levels vary considerably among them (Table 8.2). The species also have different behavioural responses to reduced ambient O2 levels55,63–67.
In general, yellowfin tuna have slightly better tolerance of low ambient O2 concentrations than skipjack tuna. For example, skipjack tuna increase their swimming speeds when O2 levels fall below 4 mg/l, whereas yellowfin tuna show no such behaviour until O2 concentration reaches 2.5 mg/l63. Although there is a general level of O2 that limits the vertical movements of tuna, skipjack spend less than 10% of their time at depths where O2 levels are below ~ 5.0 mg/l (3.8 ml/l, 75% saturation), whereas yellowfin tuna spend less than 10% of their time at depths where ambient O2 levels are < 4.3 mg/l (3.3 ml/l, 65% saturation)68,69.
140°E 180° 140°W
-50 -30 -10 -6 -2 2 6 10 30 50Dissolved O2 (µmol per litre)
140°E 180° 140°W
20°N
0°
20°S
20°N
0°
20°S
B1, 5 m depth A2, 5 m depthb)a)
c) B1, 100 m depth d) A2, 100 m depth
Figure 8.6 Projected differences in dissolved O2 (μmol per litre) in the tropical Pacific Ocean in 2100, relative to 2000–2009, under (a) the B1 emissions scenario at a depth of 5 m; (b) A2 at 5 m; (c) B1 at 100 m; and (d) A2 at 100 m. All simulations are from the IPSL-CM4 coupled global climate model.

452
Table 8.2 Lower lethal oxygen (O2) levels for the four species of tuna in the tropical Pacific, based on the ratio of the minimum hydrostatic equilibrium speeds of a skipjack tuna of 50 cm to those of other tuna species and other body sizes. The lower lethal O2 level for a 50 cm skipjack tuna has been estimated by converting mg O2 per litre to ml O2 per litre. Percentage saturation was calculated at a temperature of 25°C for skipjack, yellowfin and bigeye tuna, and 15°C for albacore.
Common name Fork length (cm)
Lower lethal O2 levelsmg/l ml/l % saturation
Skipjack 50 2.45 1.87 3775 2.83 2.16 43
Yellowfin 50 1.49 1.14 2375 2.32 1.77 35
Bigeye 50 0.52 0.40 875 0.65 0.50 10
Albacore 50 1.67 1.23 2175 1.39 1.03 18
Although early research suggested that albacore was tolerant of low O2 levels70, more recent studies have shown that this species has a reduced uptake of O2 in water containing < 5 mg/l (3.7 ml/l, 64% saturation at 15°C)71. This implies that their cardio-respiratory system is unable to extract sufficient O2 from the water under these conditions to meet metabolic O2 demand. Absence of albacore in the areas of the eastern equatorial Pacific with minimum O2 levels supports the conclusion that these fish have low tolerance to hypoxic waters.
In contrast, bigeye tuna routinely reach depths where ambient O2 content is below 1.5 ml/l53,72. The much greater tolerance of bigeye tuna to low levels of O2 allows them to make extensive daily vertical excursions, mirroring the movements of their micronekton prey (squid, euphausiids and mesopelagic fish) when they descend to the deep layers at dawn73,74 (Chapter 4). Bigeye tuna have evolved blood with an unusual characteristic that enables them to tolerate low ambient O2, and simultaneously maintain the elevated metabolic rates characteristic of tuna species75. In particular, the blood of bigeye tuna has a large decrease in O2 affinity as it is warmed during its passage through the vascular counter-current heat exchangers. As a result, off-loading of O2 in the swimming muscles is not compromised, even though the blood has a high O2 affinity during its passage through the gills.
Potential impact and adaptive capacity
The uncertainty in the projected concentrations of dissolved O2 makes it difficult to assess the impact of changes in O2 on the availability of suitable habitat in the tropical Pacific Ocean for tuna. The more optimistic IPSL-CM4 simulations (Figure 8.6), even under the B1 scenario, would improve the conditions for tuna. The effects are likely to be greatest in the eastern equatorial Pacific, which is presently characterised by low O2 concentrations in subsurface waters (Chapter 3), and even suboxic conditions (e.g. dissolved O2 < 0.2 mg/l) at relatively shallow depths76. The expansion of areas
453
CHAPTER 8
in the eastern equatorial Pacific suitable for tuna may not be reflected accurately in catches because the vertical extension of the habitat is likely to make yellowfin tuna less vulnerable to the surface fishery.
The decreases in O2 concentrations in surface and subsurface waters at mid to high latitudes that occur as the ocean warms may limit the extension of tuna habitat into more temperate areas. Restrictions on the use of subsurface areas by tuna are expected to be greater in the northern than in the southern Pacific, due to marked differences in projected O2 levels in subsurface waters in the two mid-latitude regions (Figure 8.6). In the tropical region, the projected change in O2 levels in surface waters is limited and is likely to have minor effects. In subsurface waters, the effects are expected to depend on the real change observed in the subsurface layer, for which there are currently opposite projections according to proposed mechanisms.
The distribution and catchability of tuna are well known to be influenced by levels of dissolved O2
55,63,68–70,72,77–79. Even so, changes in O2 in subsurface waters should have limited impact on skipjack tuna inhabiting the surface layer. Such changes would have a greater impact on species that swim regularly between the surface and subsurface (yellowfin tuna and albacore), and to deeper layers (bigeye tuna). Yellowfin tuna and albacore would be affected most by lower O2 levels in the thermocline – reductions in O2 below 2.5 mg/l would constrain yellowfin to the surface layer, or cause them to move to areas with more favourable concentrations of O2 in the upper water column. Where the distribution of yellowfin is restricted in this way, they are likely to be more vulnerable to capture by the surface fishery. The effects of limited distribution on productivity, and changes in catchability, would need to be taken into account when identifying appropriate levels of catch and effort for these species (Section 8.10). Bigeye tuna would be less affected due to their greater tolerance of lower levels of O2 (Table 8.2), unless anoxic conditions or ‘dead zones’ (with O2 concentration < 1 ml/l) develop.
Vulnerability
Skipjack tuna are considered to have a low vulnerability to the projected changes in O2 because they live near the surface and the greatest potential changes in O2 for all models are expected to occur in subsurface waters. Furthermore, the core habitat for skipjack tuna is in the WCPO, where the lowest changes in O2 are expected to occur.
The vulnerability of yellowfin tuna cannot be identified with confidence until global climate models can provide more consistent simulations of O2 levels in subsurface waters. In the event that the projections made by the IPSL-CM4 model are supported, climate change would have a positive effect on yellowfin tuna through substantial expansion of the depth to which this species can forage. Changes associated with O2 concentrations in the WCPO would have no major effect on yellowfin tuna and albacore, although suitable habitats for these species may extend further south and east.
454
Regardless of the direction of changes in dissolved O2, bigeye tuna appear to have a very low vulnerability to changes in O2 levels because of their high natural tolerance of low concentrations.
Reproduction of the four species of tuna is not considered to be vulnerable to the projected changes in O2 alone because their spawning grounds are all largely distributed in the WCPO80, where future variation in O2 concentrations is expected to be low. However, it remains to be determined whether interactions between the effects of increased temperatures (Section 8.4.1) and changes in O2 concentrations could affect spawning success in tuna in a much greater way than expected for either variable on its own. This is likely to be a possibility because the thermal range suitable for spawning of tuna is expected to narrow due to the greater O2 demand needed to produce large quantities of eggs or sperm at higher temperatures34.
Bigeye and yellowfin tuna are also known to spawn in the eastern Pacific Ocean. Uncertainty about the likely changes in O2 concentration in that part of the region does not permit any conclusions about the vulnerability of these species in those spawning grounds.
8.4.3 Ocean currents
Exposure and sensitivity
The currents of the upper water column across much of the tropical Pacific Ocean are expected to change in the future, particularly as a result of weakened wind regimes at low latitudes and strengthened winds in the subtropical Southern Hemisphere (Chapters 2 and 3). The transport volume of the SEC is expected to decrease by 3–8% under the B1 and A2 emissions scenarios by 2035, by ~ 10% under B1 in 2100 and ~ 20% under A2 in 2100 (Chapter 3). Even greater changes are projected for the SECC, which is expected to decrease in velocity by ~ 10–20% by 2035 under B1 and A2, and by ~ 30% under B1 and 60% under A2 by 2100 (Chapter 3).
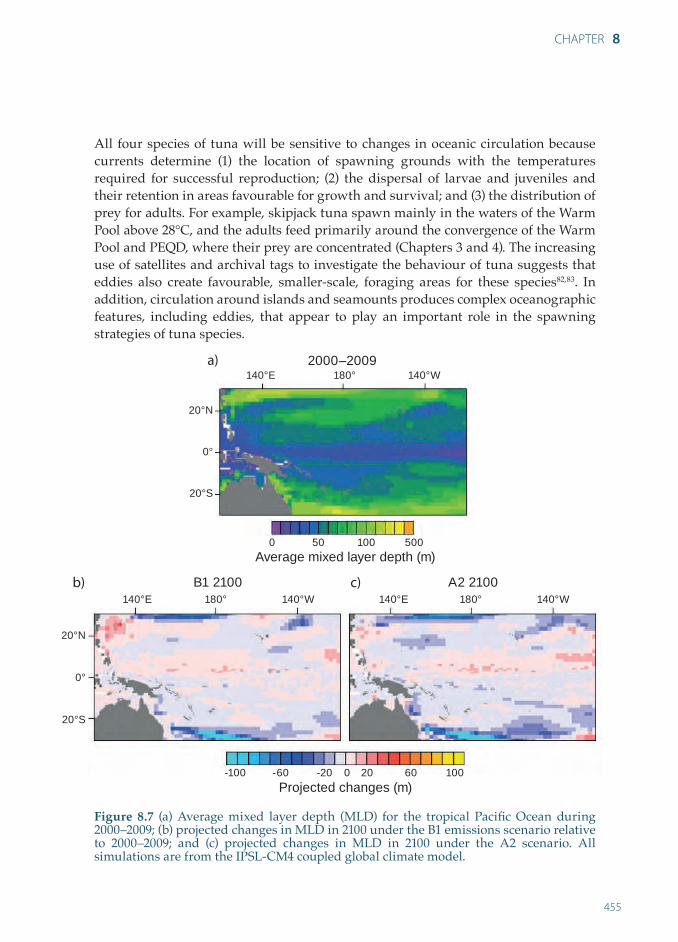
The eddies and upwellings associated with the SEC and SECC are expected to decline, and the vertical stratification of the tropical Pacific Ocean is projected to increase due to the weakened tropical circulation associated with global warming81 (Chapter 3). The simulations of mixed layer depth under the B1 and A2 scenarios for 2100 from the IPSL-CM4 model are illustrated in Figure 8.7. These simulations show shoaling of the maximum mixed layer depth by up to 20 m in the tropical Pacific Ocean. As explained in Chapter 3, upwelling in the Pacific equatorial region, and in coastal areas, is still simulated rather poorly by many global climate models.
455
CHAPTER 8
All four species of tuna will be sensitive to changes in oceanic circulation because currents determine (1) the location of spawning grounds with the temperatures required for successful reproduction; (2) the dispersal of larvae and juveniles and their retention in areas favourable for growth and survival; and (3) the distribution of prey for adults. For example, skipjack tuna spawn mainly in the waters of the Warm Pool above 28°C, and the adults feed primarily around the convergence of the Warm Pool and PEQD, where their prey are concentrated (Chapters 3 and 4). The increasing use of satellites and archival tags to investigate the behaviour of tuna suggests that eddies also create favourable, smaller-scale, foraging areas for these species82,83. In addition, circulation around islands and seamounts produces complex oceanographic features, including eddies, that appear to play an important role in the spawning strategies of tuna species.
140°E 180° 140°W
140°E 180° 140°W 140°E 180° 140°W
20°N
0°
20°S
20°N
0°
20°S
0 50 100 500 Average mixed layer depth (m)
Projected changes (m)-100 -60 -20 0 20 60 100
b)
a)
c)
Figure 8.7 (a) Average mixed layer depth (MLD) for the tropical Pacific Ocean during 2000–2009; (b) projected changes in MLD in 2100 under the B1 emissions scenario relative to 2000–2009; and (c) projected changes in MLD in 2100 under the A2 scenario. All simulations are from the IPSL-CM4 coupled global climate model.
B1 2100 A2 2100
2000–2009

456
Tuna are not only sensitive to surface currents; they are also affected by the stratification of the water column resulting from the effects of ocean circulation, water temperature and density (Chapter 3). Each species swims and forages to a different depth, depending on optimal or threshold temperature and dissolved O2 values (Sections 8.4.1 and 8.4.2). However, the area of suitable habitat for each species changes with seasons and interannual climate variability. For example, the deepening of the thermocline in the eastern Pacific and shoaling of the thermocline in the west during El Niño events (Chapters 2 and 3), changes the area of habitat available for yellowfin tuna because this species occupies the entire mixed layer.
Potential impact and adaptive capacity
The projected decreases in the strength of major currents in the tropical Pacific Ocean, changes in the formation of eddies around islands, and warmer and more stable surface waters extending further eastwards, are likely to affect the location of spawning grounds of tuna, and the survival rates of larvae. As a result, tuna are expected to move from the western to central, and central to eastern, equatorial and subequatorial regions to spawn (unless there is a severe decrease in O2 concentration in the eastern Pacific). Spawning areas may also shift or expand to higher latitudes. Any selection of new spawning grounds would be expected to differ among tuna species because they have different optimal temperature ranges for spawning. For example, bigeye tuna and albacore spawn where SST is > 24–25°C, i.e. in water cooler than the temperatures preferred by skipjack tuna (> 28–29°C).
Although tuna larvae have the ability to swim, they can be considered to be transported passively by currents at the large to mesoscales over which the life histories of tuna occur. Thus, larvae presumably have little adaptive capacity for selecting or moving to more favourable habitat if new spawning areas place them in zones with a reduced supply of food. Any such impact would have implications for recruitment.
The effects of changes to circulation, in combination with warmer water temperatures, which alter the stratification of the water column, are expected to affect the catch of some tuna species. This is foreshadowed by variation in catch of yellowfin tuna due to ENSO events. As outlined above, higher catches of yellowfin tuna are made by the surface fishery in the Warm Pool during El Niño episodes due to the contraction of the vertical habitat for this species there at such times84. Changes in circulation may also indirectly affect the distribution of favourable foraging areas for tuna across the region, as discussed in Section 8.5.
Vulnerability
The four species of tuna in the tropical Pacific are considered to have low vulnerability to the direct effects of changes in ocean currents, and the associated effects due to eddies and stratification, because they presently have extensive spawning grounds, spawning seasons and high fecundity. In addition, they have considerable capacity

457
CHAPTER 8
to adapt their behaviour and life strategies to spawn effectively. Whether the effects of altered currents are likely to be amplified through interactions with increases in temperature and decreases in primary productivity remains to be determined.
Knowledge is also limited concerning the interaction of tuna with their environment at fine spatial scales. For example, we do not know the effects of turbulence on the predation success of tuna larvae, or the energy advantage offered to adult tuna by easily detectable eddies that concentrate their forage species. The increasing use of electronic tags to investigate movements of individual fish should help reveal whether the reduced currents and increased stratification projected under climate change scenarios have consequences for recruitment and growth of tuna.
8.4.4 Ocean acidification
Exposure and sensitivity
As explained in Chapter 3, anthropogenic emissions of carbon dioxide (CO2) are leading to long-term perturbations of the ocean carbon cycle. Uptake of this CO2 by the ocean results in a decrease of carbonate ions and an increase in hydrogen ions (H+) in sea water. As a result, the pH of the ocean is decreasing – it has already been reduced by 0.1 units since 175085 – and is now decreasing at about 0.02 units per decade. Accordingly, the pH of the tropical Pacific Ocean is projected to decline by a further 0.2 to 0.3 units under the B1 and A2 scenarios by 2100 (Figure 8.8). This translates into an increase of 60–100% in the concentration of H+ ions86, and represents the fastest rate of change in ocean pH over the past 300 million years87,88. The decreases projected for equatorial regions, which are the prime habitat of tropical tuna are lower, however, than for other areas of the Pacific Ocean (Chapter 3).
The main species of tuna in the tropical Pacific are expected to be sensitive to the projected changes in pH in at least four ways. First, an increase in carbonic acid in the body fluids (acidosis) is likely to cause lower blood pH levels. Although most fish tolerate a wide range of dissolved CO2 and pH89,90, there may be associated physiological costs, especially for species or life stages with high metabolic demands89.
Higher metabolic demands at elevated temperatures may compound these costs34.
Second, there is the possibility that the growth and formation of the ear bones (otoliths) of tuna may be susceptible to lower pH because they are composed of aragonite. Contrary to expectation, the very limited research on this subject shows that a marine fish reared under elevated CO2 levels had otoliths that were significantly larger than those in individuals of the same size/age grown under control conditions91. Although the effects of abnormally large otoliths are still unknown, they could be significant because otoliths are important for orientation and hearing, especially during the larval stage92 (Chapter 9). The effects of ocean acidification on otolith formation may depend on species-specific capacity for acid-base regulation in the tissues surrounding the otoliths93.

458
2000 B1 2100
Figure 8.8 (a) The acidity (pH) of the tropical Pacific Ocean in 2000; and (b) the projected decrease in pH by 2100 for the B1 scenario (source: Iliyna et al. 2010)95.
Third, the effects of decreased pH on reducing the availability of calcium carbonate (Chapter 3) can be expected to have indirect effects on the distribution and abundance of tuna by changing the availability of species of calcifying phytoplankton and zooplankton within the lower trophic levels of the food webs that support tuna (Section 8.5, Chapter 4).
The fourth possible effect of ocean acidification on tuna may occur due to the influence of pH on acoustics in the ocean. Sound attenuation under water is driven mainly by absorption due to the viscosity of sea water, and to chemical resonances of some of the constituents of sea water (e.g. magnesium sulphate and the boric acid/carbonate system). Contribution of these two mechanisms is frequency-dependent, and attenuation of sound in the range between ~ 100 and 10,000 Hz is driven mainly by chemical absorption due to relaxation of boron species. Because of the contribution of boric acid to the alkalinity of sea water, changes in pH also alter sound absorption underwater. Ambient salinity, temperature and hydrostatic pressure also affect sound attenuation. In particular, decreases in pH and increases in temperature of sea water lower the sound absorption coefficient94. The projected changes in pH and temperature are expected to reduce the sound absorption coefficient by 20–60% in the upper few hundred meters of the Pacific Ocean by 2100, making it more transparent to low-frequency noise95 (Figure 8.9). This is expected to create a noisier environment, and possibly propagate sound further.
Relatively little work has been done on the sensitivity of tuna to the sound waves that propagate well underwater, compared with the echo-location systems used by marine mammals96, although yellowfin tuna are sensitive to sounds between 200 and 800 Hz at least97. These frequencies are within the low range of sounds produced by the false killer whales that prey on tuna. False killer whales produce sounds for echo-location with peak frequencies around 40 kHz98 and use lower frequencies for communication.
140°E 180° 140°W
7.8 7.9 8.0 8.1 8.2 8.3pH units pH units
-0.3 -0.25 -0.2 -0.15 -0.1 -0.05
140°E 180° 140°W
20°N
0°
20°S
b)a)

459
CHAPTER 8
Percentage decline in sound absorption
Thus, although tuna may detect killer whales at long distances during low frequency communication phases, they are unlikely to hear the high frequencies used by these top predators when being chased by them.
Furthermore, because tuna and dolphins in the eastern Pacific Ocean feed on similar fish species, natural selection could have occurred to enable tuna to detect the sounds made by dolphins as an aid to finding food99,100. Experimental measurements of low-frequency sounds produced by dolphins indicate that tuna can detect dolphin jaw pops and breaches at a range of 340–840 m and 660–1040 m, respectively101. In addition, it is possible that tuna use sound propagation to detect schools of prey directly, or to recognise special topographic features (e.g. seamounts, reefs and islands) where prey are likely to be found53.
A1B 2035 A1B 2100
Figure 8.9 Percentage decline in sound absorption coefficient projected under the A1B emissions scenario (similar to A2) in (a) 2035; and (b) 2100 (source: Ilyina et al. 2010)95.
Potential impact and adaptive capacity
Acidosis could lead to a narrowing of the optimal thermal performance window and, consequently, altered resistance, metabolic rate and behaviour of tuna90. In particular, the additional energy required to compensate for acidosis could lead to lower rates of growth and egg production.
Given the demonstrated effects of reduced pH on the behaviour of the larvae of coral reef fish92,102 (Chapter 9), there is concern that similar effects may affect the survival of tuna larvae. Any consistent changes in survival of tuna larvae are likely to have significant effects on the recruitment of juveniles, so the effects of reduced pH on larval behaviour must be a priority for research.
The possible effects of ocean acidification on the productivity of calcifying organisms in the oceanic food webs that support tuna are likely to be minor. For example, in PEQD such organisms represent only 1–5% of the phytoplankton, 6.1% of the
140°E 180° 140°W
0 10 20 30 40 50
140°E 180° 140°W
20°N
0°
20°S
b)a)
460
microzooplankton and mesozooplankton, and 2.2% of the micronekton (Chapter 4). Furthermore, because tuna are opportunistic predators feeding on a diverse range of micronekton103, they are expected to be able to adapt by switching to micronekton that do not depend heavily on calcifying organisms lower in the food chain, provided that nutrients are adequate to maintain overall productivity (Chapter 4).
The projected changes in sound absorption and propagation could be significant and impair the ability of tuna to assess their physical and biological environment, including the detection of their prey and predator species. Assessing the vulnerability of tuna to these changes requires laboratory experiments and in situ observations.
Vulnerability
On the basis of the very limited existing knowledge, juvenile and adult tuna in the tropical Pacific could have a low vulnerability to projected changes in pH. Nevertheless, ocean acidification may exacerbate thermal stress and restrict tuna to narrower thermal ranges, and affect the processes of growth or maturation. Acidification may also indirectly affect productivity of tuna stocks, and changes in sound absorption due to reduced pH may have possible implications for detection of both predators and prey by tuna.
8.5 Vulnerability of oceanic fisheries to the indirect effects of climate change
Global warming is expected to have profound indirect effects on tuna by altering the productivity of the lower- and mid-trophic levels of the food webs that support them (Chapter 4). In this section, we assess the exposure, sensitivity, potential impact, adaptive capacity and vulnerability of tuna to changes in the lower- and mid-trophic levels of the ecosystems in the five ecological provinces of the tropical Pacific Ocean described in Chapter 4.
8.5.1 Lower levels of the food web
Exposure and sensitivity
As outlined in Chapter 3, the increase in the temperature of the tropical Pacific Ocean is expected to result in greater stratification of the upper water column. Stratification reduces the supply of nutrients from deeper layers, but can increase light availability due to lower turbulence in the mixed layer81. Such changes can have opposing effects on phytoplankton but, overall, there are likely to be changes in primary production and zooplankton in the lower trophic levels of the food web.
The overall effects of global warming on primary productivity are also projected to vary among the five provinces of the tropical Pacific Ocean. For example, simulations using IPSL-CM4 indicate that there is likely to be a 9% decrease in net primary

461
CHAPTER 8
productivity in the Warm Pool by 2100 under the B1 and A2 scenarios, and a 20–33% decrease in the adjacent Archipelagic Deep Basins province (Chapter 4) (Figure 8.10). The modelling also shows that the biomass of zooplankton in these two provinces is expected to decrease by 9–10%, and 17–26%, respectively, in 2100 (Chapter 4). Substantial increases in the surface area of the oligotrophic Warm Pool and South Pacific Tropical Gyre, and decreases in the nutrient-rich PEQD, are also projected104,105 (Chapter 4). Taken together, significant changes in the production of phytoplankton and zooplankton are expected across the region.
The degree to which primary production may be reduced further due to the effects of ocean acidification is yet to be determined because of the wide range of responses of these organisms to reduced pH106–110. As mentioned earlier, however, the proportion of phytoplankton and zooplankton composed of calcifying organisms is relatively low (Chapter 4).
Oceanic fisheries are acutely sensitive to alterations in primary productivity. Any changes in nutrient supply in the photic zone cascade down the food web through their effects on productivity of phytoplankton and, in turn, on microzooplankton, zooplankton and micronekton (Chapter 4). Ultimately, the abundance of larvae and juveniles, and the number of fish available to harvest, are affected.
In reality, the match/mismatch of periods of high primary productivity with spawning events often causes much of the variability in survival of larvae and subsequent recruitment success among pelagic fish111,112. For tuna, the presence or absence of the predators of their larvae also plays an important role. Indeed, exceptional peaks of larval recruitment occur when ample food for larvae, and absence of predators, coincide. Such favourable events have been observed during transition from El Niño to La Niña phases in the equatorial Pacific7.
140°E 180° 140°W
-100 -60 -20 0 20 60 100
140°E 180° 140°W
20°N
0°
20°S
Percentage
b)a) A2 2035 A2 2100
Figure 8.10 Percentage changes in primary production for different provinces of the tropical Pacific Ocean projected by the IPSL-CM4 model under the A2 emissions scenario in (a) 2035; and (b) 2100; relative to 2000–2009 (see Chapter 4 for location of provinces).

462
The response of skipjack tuna to the strong ENSO events of 1997–1998 demonstrated the sensitivity of the link between primary production and tuna recruitment. An exceptionally high catch of skipjack tuna was made in the second half of 1998 after the onset of a La Niña phase that immediately followed a powerful El Niño event. The catch was concentrated in a small area (0°–5°N, 160°–170°E) at the convergence of the Warm Pool and the cold tongue waters of PEQD (Figure 8.11). This episode followed an exceptional phytoplankton bloom that occurred in the same location 6 to 9 months earlier, which was clearly visible on satellite images (Figure 8.11). Length frequency data for skipjack tuna catches for the last two quarters of 1998 showed an unusually high proportion of small-sized fish (20–35 cm), with estimated ages of 5–9 months. Evidently, the bloom of phytoplankton and subsequent production of zooplankton led to an increase in survival rates of larval and juvenile skipjack tuna. These fish produced a strong cohort that recruited to the fishery 6–12 months later.
Potential impact and adaptive capacity
The projected changes to productivity of the lower levels of the food web could have two potential impacts on the distribution and abundance of tuna, over and above those known to be due to ENSO events. First, lower primary productivity in the western-central tropical Pacific Ocean may result in a decrease in survival of larvae there. This would increase the representation in the population of individuals that spawn in more favourable areas towards the eastern equatorial region, where the primary productivity is projected to remain relatively high (Chapter 4).
Second, the projected shift eastwards of the convergence between the Warm Pool and PEQD, from its present average longitudinal position of 180°–170°W in 2035 and 160°–150°W in 2100 (Chapters 3 and 4), would be expected to change the location of the best feeding grounds for skipjack tuna. This species is presently able to thrive within the resource-poor warm waters of the western Pacific partly because of the high productivity of this convergence zone. It seems inevitable, therefore, that if the location of the convergence changes, the fish will move as well.
Two other processes could also help maintain the productivity of tuna in the western Pacific. The subsurface density barrier layer of the Warm Pool is also expected to move eastward, reducing stratification in the western Pacific (Chapter 3). This should allow better mixing of surface waters with deeper nutrient-rich water, enhancing primary production. In addition, increases in rainfall of 5–15% in 2035 and 10–20% by 2100 (Chapter 2) are expected to increase the supply of nutrients to archipelagic waters in PNG through greater flows from the Sepik-Ramu River system (Chapter 7).
Vulnerability
Tuna larvae are expected to have moderate to high vulnerability to reduced primary productivity because of the possible higher risk of starvation resulting from the mismatch of spawning events and suitable food supply. However, this risk may be

463
CHAPTER 8
0.1 0.3 0.5 0.7 0.9
120°E 140°E 160°E 180° 160°W 140°W
120°E 140°E 160°E 180° 160°W 140°W
Chlorophyll pigment concentration (mg per m3)
Skipjack tuna Yellowfin tuna
20°N
10°N
0°
10°S
20°S
offset partially in some locations due to (1) the relocation of the subsurface density layer associated with the Warm Pool; and (2) the greater availability of nutrients through increased levels of runoff, particularly in the archipelagic waters of PNG.
The vulnerability of adult tuna to reduced rates of growth and reproduction due to the reduced area of the nutrient-rich PEQD is difficult to assess because the productivity within PEDQ is projected to change little, and much of the feeding occurs at the convergence of the Warm Pool and PEQD.
b)
a)20°N
10°N
0°
10°S
20°S
Figure 8.11 Recruitment of skipjack tuna associated with a phytoplankton bloom in the tropical Pacific Ocean: (a) satellite image showing a large phytoplankton bloom following the termination of the El Niño event of 1997–1998 and the onset of the La Niña event of 1998–1999 on the equator at 165°E (SeaWiFS composite image: April–May 1998); (b) distribution of the purse-seine catch of skipjack and yellowfin tuna in the last quarter of 1998 (source: Lehodey 2000)84.
10,000
5000
1000
Catch (tonnes)

464
8.5.2 Mid levels of the food web
Exposure and sensitivity
Due to the direct link between production of lower- and mid-trophic levels in the food webs that support tuna (Chapter 4), the exposure of the lower-trophic levels described in Section 8.5.1 also applies to the micronekton that comprise the mid-trophic level. However, the temperature increase of the surface layer associated with increased stratification could result in a greater production to biomass (P:B) ratio, and more pronounced differences between micronekton at the surface and in the deeper layers in equatorial regions. In addition to a change in biomass, the pathways between these different components of the pelagic food web are likely to be reorganised because new environmental conditions may become detrimental for some species, or groups of species, and advantageous for others. The nature of these pathways may ultimately affect the relationships between top predators and the rest of the food web through bottom-up and top-down cascades.
Tuna are expected to be particularly sensitive to any decrease in the productivity of the micronekton they feed on due to their energy requirements for rapid growth, high rates of egg production, and constant and fast swimming activity. Early research indicated that yellowfin tuna have an average daily ration between 3.9% and 6.7% of their body weight, and the energetic cost of swimming accounts for 33–50% of their energy budget113.
A more recent bioenergetics approach, to identify how energy acquired from food is allocated to maintenance metabolism, growth, reproduction and movement, has produced annual consumption to biomass (Q:B) ratios of 32.4, 19.8, and 13.4 for skipjack tuna, yellowfin tuna, and albacore, respectively114. Such ratios are substantially higher than estimates for other species of fish and reflect the high metabolic demands of tuna. This approach also estimated that skipjack and yellowfin tuna allocate 20–24% of consumed energy to somatic and gonad growth, compared with only 6% for albacore. As a general rule, adults of tuna species that develop a swim bladder after the juvenile phase (e.g. yellowfin and bigeye tuna) need less energy than skipjack tuna to maintain themselves in the water column.
Because much of the micronekton migrates to the surface at sunset to feed on zooplankton at night and returns to the deeper layers at sunrise (Chapter 4), tuna and other large pelagic predatory fish have morphological and physiological features allowing them to chase prey in the dark and cold deep layers of the water column. These attributes enable the predators to take advantage of the large biomass of mesopelagic and bathypelagic micronekton in the tropical Pacific Ocean. The specialised morphological and physiological features of predators include the ‘rete mirabile’ in tuna, which allows them to maintain body heat in cold water, olfaction in sharks, and enhanced vision in bigeye tuna and swordfish. The range of micronekton

465
CHAPTER 8
prey captured by tuna in the deep layers differs among species. It also varies within tuna species, once individuals reach a size where they can access the deeper, colder and often less-oxygenated layers.
Potential impact and adaptive capacity
A decrease in productivity of micronekton forage organisms in the tropical Pacific Ocean is likely to increase the risk of natural mortality and, therefore, lower overall production of tuna from the region. These risks vary among the five ecological provinces, but are substantial for the Warm Pool, where tuna currently occur in abundance and where the primary productivity is relatively low. In addition, access to micronekton in the deeper layers of the Warm Pool by adult tuna could become more difficult due to increased stratification and decreased O2 concentrations. The eastward shift of the mean position of the eastern edge of the Warm Pool, and the associated density barrier layer would, however, allow more efficient mixing of nutrients in the surface layer and easier access to mesopelagic prey.
Where there are no physiological constraints to movement of tuna within and among provinces, the highly mobile nature of these fish is expected to assist them to adapt to changes in the availability of micronekton prey by moving to more favourable (new) foraging grounds where concentrations of prey are more accessible. However, the reorganisation of feeding and spawning grounds may lead to differences in the use of energy. For example, higher allocations may be needed for maintenance metabolism or locomotory activity, leading to a reduction in energy available for growth and reproduction, especially in the context of decreasing production of prey.
Vulnerability
The vulnerability of tuna to alterations in the mid-trophic level of ocean food webs is considered to be low if new, favourable feeding grounds replace the existing but declining grounds. Any changes in species composition of micronekton prey are not expected to reduce the food available for tuna in general because interactions among prey species are weak – a situation that helps to maintain the general resilience and stability of micronekton communities115. This resilience, together with the mobility and specialised morphology and physiology of the majority of tropical tuna species that permits them to feed in the deeper layers of the ocean, should assist tuna to continue to find suitable food within the Pacific Basin.
Such resilience is likely to break down locally, however, especially in the Warm Pool and the subtropical gyres. In particular, the location of prime feeding areas in these provinces is expected to change. Tuna may also become more vulnerable to a reduced supply of their micronekton prey in the face of a large increase in populations of gelatinous organisms or voracious competitors, such as large squid. These outcomes are unlikely in the deep tropical ocean but could occur as a result of warm anoxic waters developing in coastal regions and on the continental slopes.

466
8.6 Integrated vulnerability assessment
The relationships between tuna and their biophysical environment described in Sections 8.3 to 8.5, combined with the relationships between species, and among life stages within species, can lead to complex interactions, feedback loops and nonlinear effects (Figure 8.12). For example, simultaneous shifts in temperature, and in O2 and CO2 levels, may enhance vulnerability of larvae relative to a change in just one of these variables. Such synergies could lead to significant basin-scale redistribution of tuna stocks with important consequences for domestic tuna fisheries and the revenue from fishing agreements with distant water fishing nations (Chapter 12).
To integrate these processes and to assess the vulnerability of tuna to climate change, a modelling framework is needed that simultaneously evaluates interactions between environmental changes, the main biological functions of tuna, and the
Figure 8.12 Interactions between the biological functions of tuna species, their spatial population dynamics, and key features of the tropical Pacific Ocean.

467
CHAPTER 8
spatial dynamics of the fish populations. SEAPODYM (Spatial Ecosystem and Population Dynamics Model) (Box 8.2) is such a modelling tool. Here, we outline how SEAPODYM works, and how it has been applied to provide preliminary assessments of the vulnerability of skipjack and bigeye tuna in the tropical Pacific to climate change.
8.6.1 Ecosystem-tuna simulations
8.6.1.1 SEAPODYM model
SEAPODYM describes the spatial dynamics of tuna and tuna-like species at basin and global scales, under the influence of both fishing and environmental effects. This model is being improved continuously to provide a general framework that allows integration of the biological and ecological knowledge of tuna species, and other large oceanic predators, within a comprehensive description of the pelagic ecosystem7,29,56,116–119. Together, the mechanisms included in SEAPODYM describe most of the recognised interactions between tuna and the oceanic environment. However, the impact of ocean acidification is not yet included in the model.
8.6.1.2 Projected effects on skipjack and bigeye tuna in 2035 and 2100 under B1 and A2 emissions scenarios
Preliminary simulations of the potential impact of global warming on tuna populations using SEAPODYM are presently available only for skipjack and bigeye tuna. These simulations are based on atmospheric CO2 concentrations reaching850 ppm in 2100, and historical data between 1860 and 2000, which enables the effects on both species of tuna to be projected under the A2 scenario. Because the projected effects on the physical and chemical properties of the tropical Pacific Ocean are quite similar under the B1 and A2 scenarios in 2035 (Chapter 3), we also consider that our simulations for A2 in 2035 approximate those for B1 in 2035. After 2035, the two scenarios start to diverge, and the conditions projected at the end of this century for the B1 scenario are close to those of the A2 scenario in the middle of this century. Therefore, we use the results of the A2 simulation for 2050 as a surrogate for B1 in 2100v.
These simulations are driven by physical-biogeochemical fields obtained from a global Earth system simulation120. The simulations cover the Pacific basin at a geographic resolution of 2 × 2 degrees121. An initial optimisation of parameters for the model for bigeye and skipjack tuna was done using historical catch data for the last 50 years, and a hindcast from a coupled physical-biogeochemical model driven by the NCEP (National Centers for Environmental Prediction) atmospheric reanalysis. The
v It is important to note that while CO2 emissions are similar for B1 in 2100 and A2 in 2050, the multi-model mean of sea surface temperature is 0.18 (+0.23)°C higher under B1 in 2100 than A2 in 2050 (Chapter 1).
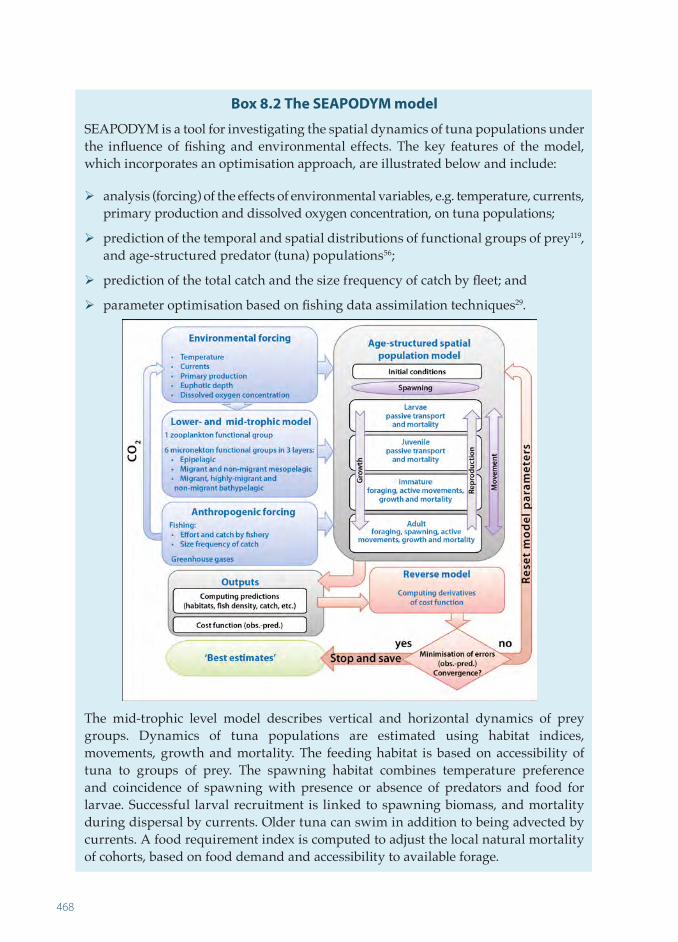
468
Box 8.2 The SEAPODYM model
SEAPODYM is a tool for investigating the spatial dynamics of tuna populations under the influence of fishing and environmental effects. The key features of the model, which incorporates an optimisation approach, are illustrated below and include:
¾ analysis (forcing) of the effects of environmental variables, e.g. temperature, currents, primary production and dissolved oxygen concentration, on tuna populations;
¾ prediction of the temporal and spatial distributions of functional groups of prey119, and age-structured predator (tuna) populations56;
¾ prediction of the total catch and the size frequency of catch by fleet; and
¾ parameter optimisation based on fishing data assimilation techniques29.
The mid-trophic level model describes vertical and horizontal dynamics of prey groups. Dynamics of tuna populations are estimated using habitat indices, movements, growth and mortality. The feeding habitat is based on accessibility of tuna to groups of prey. The spawning habitat combines temperature preference and coincidence of spawning with presence or absence of predators and food for larvae. Successful larval recruitment is linked to spawning biomass, and mortality during dispersal by currents. Older tuna can swim in addition to being advected by currents. A food requirement index is computed to adjust the local natural mortality of cohorts, based on food demand and accessibility to available forage.
469
CHAPTER 8
parameterisation based on the IPSL projections from 1985 to 2000 was used for the whole climate simulation (1860–2100), to investigate the general trends of biomass and spatial distributions associated with environmental changes under the increasing forcing of atmospheric CO2. Fishing effort and catch for the historical period(1960–2000) were used for the optimisation of parameters and the validation. For future projected effort, we used the average fishing effort for the 20 years from 1980 to 2000.
8.6.1.3 Skipjack tuna
To put the preliminary projections for the effects of climate change on skipjack tuna into context, it is important to remember that, based on observations of larval abundance80, the present spawning grounds of this species are mainly in the Warm Pool and in the Philippines and Indonesia. However, spawning activity and larvae have been observed in the eastern Pacific Ocean80,122. Also, the average distribution of spawning fish is influenced by ENSO. During El Niño episodes, skipjack favour spawning grounds in the central and eastern equatorial Pacific. Conversely, the core habitat of the entire population in the WCPO is the Warm Pool but the fish extend into the mid latitudes (40°N–40°S) in summer when the water warms. There are also substantial longitudinal displacements of skipjack associated with ENSO events (Section 8.3).
Under the B1 and A2 scenarios in 2035, the average density of skipjack larvae is projected to increase slightly in the present-day spawning grounds, and more spawning is expected to occur in the central Pacific (Figure 8.13). For the entire population of skipjack tuna, the projections are that density will decrease in the waters of PNG and Solomon Islands, and increase in the eastern equatorial Pacific. A clear long-term trend in total biomass for the entire WCPO under B1 and A2 in 2035 is difficult to differentiate from the natural long-term variability (Figure 8.14).
In 2100 under the B1 scenario, more significant changes in the location of spawning areas for skipjack tuna are projected, with the favoured spawning grounds extending to higher latitudes, and also to the central Pacific (Figure 8.13). For the skipjack tuna population as a whole, the western equatorial Pacific is expected to become much less suitable on average, and the highest biomass of fish is projected to occur in the central Pacific instead (Figure 8.13). The change in total biomass of skipjack tuna over time becomes conspicuous under B1 in 2100 (and under A2 in 2050) in the WCPO, especially in light of the opposite trend occurring in the eastern Pacific (Figure 8.14).
In 2100 under the A2 scenario, the greatest density of skipjack is projected to move further to the east and the biomass of adults to decrease significantly in the WCPO (Figure 8.13). This is due to projected higher natural mortality associated with less suitable habitat conditions (less food and higher temperatures), and to displacement of fish to the more favourable central and eastern regions. Under A2, the present-day dominance of the WCPO over the eastern Pacific Ocean as habitat for skipjack is reversed (Figure 8.14).
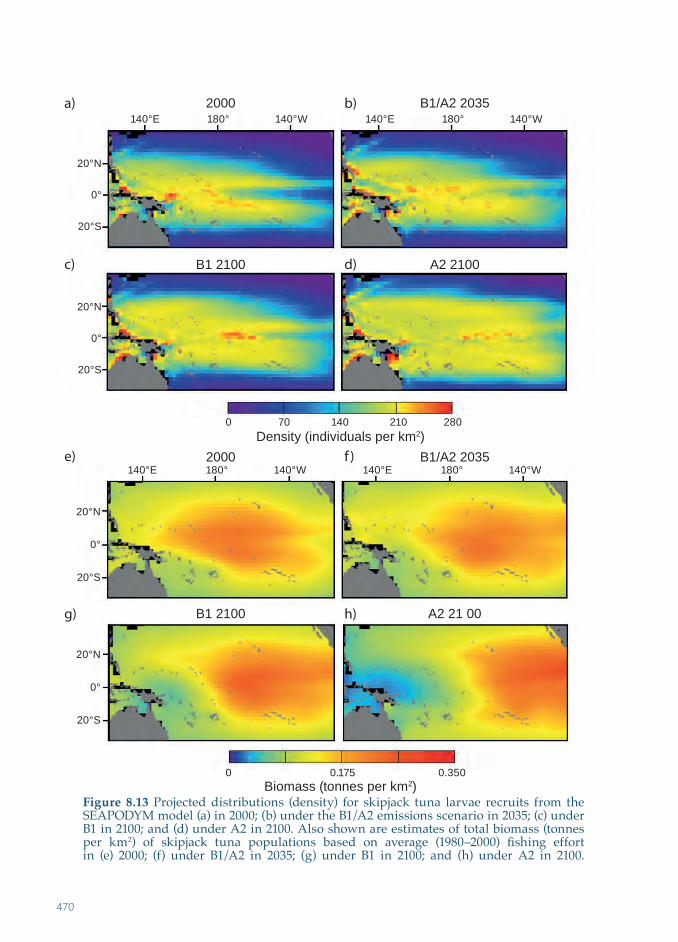
470
140°E 180° 140°W 140°E 180° 140°W
0 70 140 210 280Density (individuals per km2)
Biomass (tonnes per km2)0 0.175 0.350
140°E 180° 140°W 140°E 180° 140°W
20°N
0°
20°S
20°N
0°
20°S
b) 2000 B1/A2 2035
f ) 2000 B1/A2 2035
d) B1 2100 A2 2100
h) B1 2100 A2 21 00
Figure 8.13 Projected distributions (density) for skipjack tuna larvae recruits from the SEAPODYM model (a) in 2000; (b) under the B1/A2 emissions scenario in 2035; (c) under B1 in 2100; and (d) under A2 in 2100. Also shown are estimates of total biomass (tonnes per km2) of skipjack tuna populations based on average (1980–2000) fishing effort in (e) 2000; (f) under B1/A2 in 2035; (g) under B1 in 2100; and (h) under A2 in 2100.
c)
a)
e)
g)
20°N
0°
20°S
20°N
0°
20°S

471
CHAPTER 8
Figure 8.14 Projected changes in the biomass and abundance of larval and adult skipjack and bigeye tuna in the Eastern Pacific Ocean (EPO) and Western and Central Pacific Ocean (WCPO) under the A2 emissions scenario until 2100. Abundance of tuna larvae (total number of larvae recruited in the juvenile cohort) of (a) skipjack; and (b) bigeye tuna, and total biomass of adults of (c) skipjack; and (d) bigeye tuna. Note that the A2 scenario in 2050 can be used as a proxy for the B1 scenario in 2100. Simulations are based on average fishing effort for the period 1980–2000.
Summary of vulnerability of skipjack tuna
Based on this preliminary simulation, and the anticipated responses of skipjack tuna to the direct and indirect effects of climate change described in Sections 8.4 and 8.5, the overall vulnerability of skipjack to the projected changes in the physical and chemical properties of the tropical Pacific Ocean (Chapter 3) and the oceanic food web (Chapter 4) under the B1 and A2 scenarios by 2035 is considered to be low (Table 8.3). Indeed, any changes by 2035 will be difficult to differentiate from natural variability, particularly the effects of ENSO.
By 2100, the population of skipjack tuna in the WCPO is likely to have a moderate vulnerability to climate change under the B1 scenario, increasing to a high vulnerability under the A2 scenario (Table 8.3) due to expected major changes in temperature, productivity at lower- and mid-trophic levels, and currents. Note, however, that the projections for A2 in 2100 have a lower confidence due to the large uncertainty of projected changes in dissolved O2 concentration, and the impact of circulation and ocean acidification. Assuming a level of fishing effort equivalent to
EPO WCPO
EPO WCPO
1950 1980 2010 2040 2070 2100 1950 1980 2010 2040 2070 2100
Skipjack larvae
Abu
ndan
ce(x
109 i
ndiv
idua
ls)
Bio
mas
s(x
106 t
onne
s)
Skipjack adult
Bigeye larvae
Bigeye adult
20
15
10
5
0
10
8
6
4
2
0
0.8
0.6
0.4
0.2
0
160
120
80
40
0
Year Year
a) b)
c) d)
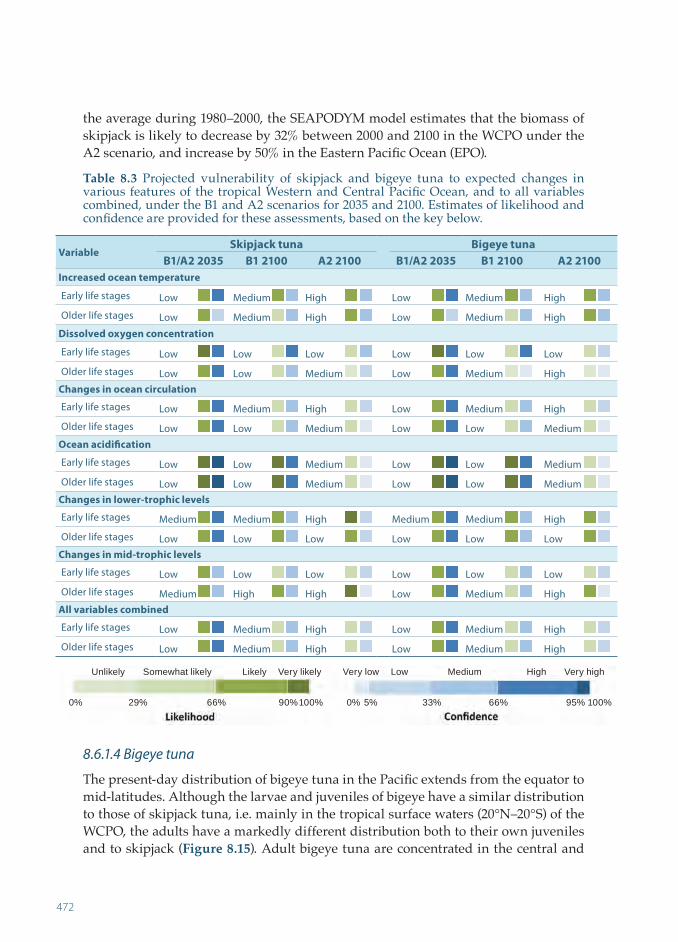
472
the average during 1980–2000, the SEAPODYM model estimates that the biomass of skipjack is likely to decrease by 32% between 2000 and 2100 in the WCPO under the A2 scenario, and increase by 50% in the Eastern Pacific Ocean (EPO).
8.6.1.4 Bigeye tuna
The present-day distribution of bigeye tuna in the Pacific extends from the equator to mid-latitudes. Although the larvae and juveniles of bigeye have a similar distribution to those of skipjack tuna, i.e. mainly in the tropical surface waters (20°N–20°S) of the WCPO, the adults have a markedly different distribution both to their own juveniles and to skipjack (Figure 8.15). Adult bigeye tuna are concentrated in the central and
VariableSkipjack tuna Bigeye tuna
B1/A2 2035 B1 2100 A2 2100 B1/A2 2035 B1 2100 A2 2100Increased ocean temperature
Early life stages Low Medium High Low Medium High
Older life stages Low Medium High Low Medium High
Dissolved oxygen concentration
Early life stages Low Low Low Low Low Low
Older life stages Low Low Medium Low Medium High Changes in ocean circulation
Early life stages Low Medium High Low Medium High
Older life stages Low Low Medium Low Low Medium Ocean acidification
Early life stages Low Low Medium Low Low Medium
Older life stages Low Low Medium Low Low Medium Changes in lower-trophic levels
Early life stages Medium Medium High Medium Medium High
Older life stages Low Low Low Low Low Low Changes in mid-trophic levels
Early life stages Low Low Low Low Low Low
Older life stages Medium High High Low Medium High All variables combined
Early life stages Low Medium High Low Medium High
Older life stages Low Medium High Low Medium High
Table 8.3 Projected vulnerability of skipjack and bigeye tuna to expected changes in various features of the tropical Western and Central Pacific Ocean, and to all variables combined, under the B1 and A2 scenarios for 2035 and 2100. Estimates of likelihood and confidence are provided for these assessments, based on the key below.
Unlikely Somewhat likely Likely Very likely Very low Low Medium High Very high
0% 29% 66% 90% 100% 0% 5% 33% 66% 95% 100%
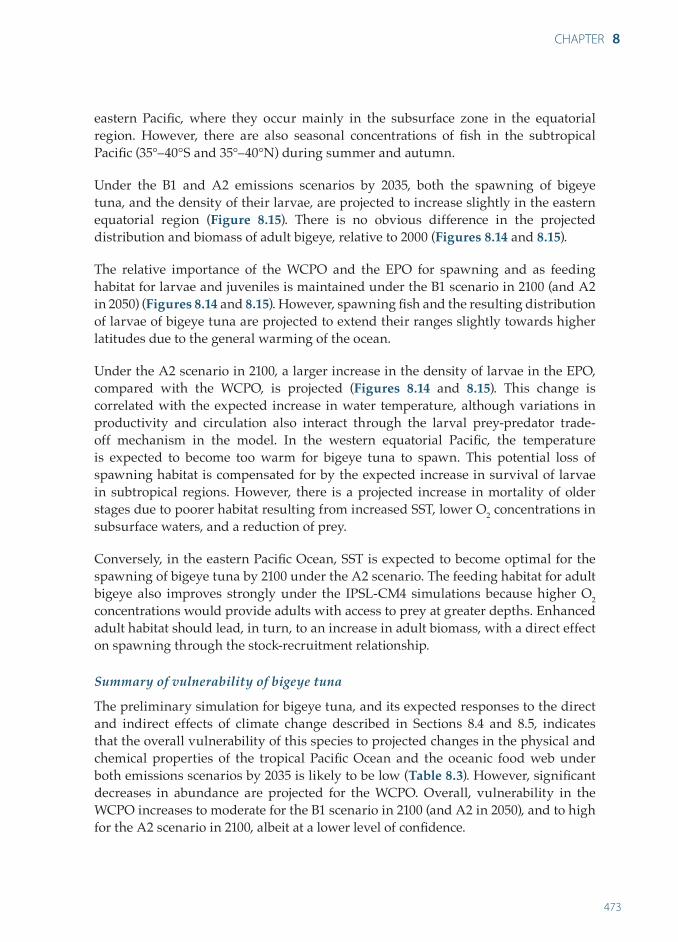
473
CHAPTER 8
eastern Pacific, where they occur mainly in the subsurface zone in the equatorial region. However, there are also seasonal concentrations of fish in the subtropical Pacific (35°–40°S and 35°–40°N) during summer and autumn.
Under the B1 and A2 emissions scenarios by 2035, both the spawning of bigeye tuna, and the density of their larvae, are projected to increase slightly in the eastern equatorial region (Figure 8.15). There is no obvious difference in the projected distribution and biomass of adult bigeye, relative to 2000 (Figures 8.14 and 8.15).
The relative importance of the WCPO and the EPO for spawning and as feeding habitat for larvae and juveniles is maintained under the B1 scenario in 2100 (and A2 in 2050) (Figures 8.14 and 8.15). However, spawning fish and the resulting distribution of larvae of bigeye tuna are projected to extend their ranges slightly towards higher latitudes due to the general warming of the ocean.
Under the A2 scenario in 2100, a larger increase in the density of larvae in the EPO, compared with the WCPO, is projected (Figures 8.14 and 8.15). This change is correlated with the expected increase in water temperature, although variations in productivity and circulation also interact through the larval prey-predator trade-off mechanism in the model. In the western equatorial Pacific, the temperature is expected to become too warm for bigeye tuna to spawn. This potential loss of spawning habitat is compensated for by the expected increase in survival of larvae in subtropical regions. However, there is a projected increase in mortality of older stages due to poorer habitat resulting from increased SST, lower O2 concentrations in subsurface waters, and a reduction of prey.
Conversely, in the eastern Pacific Ocean, SST is expected to become optimal for the spawning of bigeye tuna by 2100 under the A2 scenario. The feeding habitat for adult bigeye also improves strongly under the IPSL-CM4 simulations because higher O2 concentrations would provide adults with access to prey at greater depths. Enhanced adult habitat should lead, in turn, to an increase in adult biomass, with a direct effect on spawning through the stock-recruitment relationship.
Summary of vulnerability of bigeye tuna
The preliminary simulation for bigeye tuna, and its expected responses to the direct and indirect effects of climate change described in Sections 8.4 and 8.5, indicates that the overall vulnerability of this species to projected changes in the physical and chemical properties of the tropical Pacific Ocean and the oceanic food web under both emissions scenarios by 2035 is likely to be low (Table 8.3). However, significant decreases in abundance are projected for the WCPO. Overall, vulnerability in the WCPO increases to moderate for the B1 scenario in 2100 (and A2 in 2050), and to high for the A2 scenario in 2100, albeit at a lower level of confidence.
Unlikely Somewhat likely Likely Very likely Very low Low Medium High Very high
0% 29% 66% 90% 100% 0% 5% 33% 66% 95% 100%

474
Figure 8.15 Projected distributions (density) for bigeye tuna larvae recruits from the SEAPODYM model in (a) 2000; (b) under the B1/A2 emissions scenario in 2035; (c) under B1 in 2100; and (d) under A2 in 2100. Also shown are estimates of total biomass (tonnes per km2) of bigeye tuna populations based on average(1980–2000) fishing effort in (e) 2000; (f) under B1/A2 in 2035; (g) under B1 in 2100; and (h) under A2 in 2100.
140°E 180° 140°W
140°E 180° 140°W
140°E 180° 140°W
140°E 180° 140°W
0 0.175 0.350Density (individuals per km2)
Biomass (tonnes per km2)0 0.015 0.030
20°N
0°
20°S
20°N
0°
20°S
20°N
0°
20°S
20°N
0°
20°S
2000 b) B1/A2 2035
2000 f ) B1/A2 2035
B1 2100 h) A2 2100
B1 2100 d) A2 2100
g)
e)
c)
a)

475
CHAPTER 8
8.6.1.5 Potential impact on yellowfin tuna and albacore
The biology and ecology of yellowfin tuna can be considered to lie between those of skipjack and bigeye tuna. Therefore, the effects of climate change on yellowfin tuna should be similar to those already described for these two species. In particular, there is expected to be a progressive extension of spawning grounds towards mid-latitudes and the central equatorial Pacific, and deterioration of foraging habitat in the WCPO. These changes are projected to result in a decrease in total biomass of yellowfin tuna in the WCPO, and an increase in the EPO. However, such projections depend strongly on the future concentrations of dissolved O2. Given the general decrease in primary productivity projected for the tropical Pacific Ocean, the overall abundance of yellowfin tuna in the entire Pacific basin is also expected to decrease.
The situation is different for albacore in the southern Pacific Ocean, which spawn in tropical waters and then move seasonally to the subtropical convergence zones to feed. Because albacore are particularly sensitive to low levels of dissolved O2, the main projected effects of climate change are expected to be a poleward shift in distribution as fish avoid the decreasing O2 concentrations in the equatorial subsurface waters of the western Pacific. The projected increases in primary production at mid-latitudes in the southern Pacific Ocean are also expected to improve the feeding habitat of albacore that migrate there, leading to a higher biomass of this species at the edges of the South Pacific Subtropical Gyre province.
8.7 Projected changes in the catch of skipjack and bigeye tuna
The SEAPODYM model was used to make preliminary assessments for projected percentage changes in catches of skipjack and bigeye tuna within the EEZs of PICTs, relative to the 20-year average catch for 1980 to 2000, for the B1 and A2 emissions scenarios by 2035 and 2100.
For skipjack tuna, this preliminary modelling indicates that catches are likely to increase across the region in 2035, although the increases are expected to be greater for PICTs in the eastern than in the western Pacific (Table 8.4). By 2100 under the B1 scenario, catches for the western Pacific are then projected to decrease and return to the average levels for this region in 1980 to 2000, although catches in Solomon Islands and PNG are actually projected to decrease by 5% and 10%, respectively. In contrast, catches in the eastern Pacific are projected to increase on average by > 40% (Table 8.4).
Under the A2 scenario in 2100, catches of skipjack tuna for the western Pacific are estimated to decline further, by an average of > 20%, and by as much as 30% for PNG (Table 8.4). Although catches in the eastern Pacific are still substantially greater compared to 1980 to 2000 levels, they are expected to decrease relative to the projections for the B1 scenario. Across the entire region, total catch is projected to decrease by 7.5% under the A2 scenario by 2100 (Table 8.4).

476
For bigeye tuna, small decreases in catch (usually < 5%) are projected to occur in 17 of the 22 PICTs by 2035 (Table 8.4). The magnitude of the reduced catches is projected to increase to 5–10% in most PICTs under the B1 scenario by 2100, and 10–30% for many PICTs under the A2 scenario in 2100 (Table 8.4).
Table 8.4 Projected percentage changes in catches of skipjack and bigeye tuna, relative to recent catches (20-year average 1980–2000), under the B1 and A2 emissions scenarios in 2035 and 2100, derived from the SEAPODYM model. Likelihood and confidence values for all estimates for each scenario are also provided.
* Equivalent to A2 2050; ** 15°N–20°S and 130°–170°E; *** 15°N–15°S and 170°E–150°W; nea = no estimate available.
We emphasise that the preliminary nature of the modelling for skipjack and bigeye tuna means that the projected changes in catch for PICTs should be regarded as indicative only, although we have higher confidence in the general trend that catches
PICTSkipjack tuna Bigeye tuna
B1/A2 2035 B1 2100* A2 2100 B1/A2 2035 B1 2100* A2 2100MelanesiaFiji 25.8 24.0 33.1 0.8 0.7 -1.4New Caledonia 22.5 18.7 39.4 1.1 1.2 6.0PNG 3.1 -10.6 -30.2 -4.5 -13 -27.9Solomon Islands 3.2 -5.5 -15.4 0.1 -2.9 -7.3Vanuatu 18.4 15.1 26.1 -3.0 -6.1 -9.7MicronesiaFSM 14.0 4.8 -15.8 -3.5 -11.5 -32.5Guam 15.8 10.5 -7.7 -6.7 -12.7 -32.7Kiribati 36.8 43.1 24.1 -0.7 -5.4 -16.6Marshall Islands 24.0 24.2 9.8 -3.1 -9.6 -26.9Nauru 25.1 19.7 -1.2 -1.4 -6.6 -19.5CNMI 23.0 21.7 13.2 -0.3 -4.9 -22.6Palau 10.2 1.7 -26.9 -3.9 -11.2 -45.2PolynesiaAmerican Samoa 41.1 47.8 57.8 -4.7 -7.9 -17.9Cook Islands 40.4 50.2 47.4 -3.0 -7.8 -15.5French Polynesia 40.8 48.9 76.9 -1.6 -7.7 -12.5Niue nea nea nea -5.4 -7.8 -14.7Pitcairn Islands nea nea nea -2.3 -4.5 -4.1Samoa 44.0 49.2 54.9 1.4 1.4 -4.2Tokelau 60.8 69.0 63.2 -3.1 -6.5 -16.1Tonga 47.0 50.2 58.5 -4.0 -5.1 -10.3Tuvalu 36.8 40.9 25.0 2.9 2.2 -6.2Wallis and Futuna 44.2 48.7 46.4 0.4 -0.4 -6.9RegionalTotal fishery 18.9 12.4 -7.5 0.33 -8.8 -26.7Western fishery** 10.7 -0.2 -21.5 -2.03 -12.3 -33.8Eastern fishery*** 36.9 43.2 26.8 3.3 -4.53 -17.8
Unlikely Somewhat likely Likely Very likely Very low Low Medium High Very high
0% 29% 66% 90% 100% 0% 5% 33% 66% 95% 100%
477
CHAPTER 8
in the western Pacific will decrease and those in the eastern Pacific will increase. It is also likely that the effects on catches estimated in this analysis are likely to be amplified by future changes in fishing effort because, as catch per unit effort (CPUE) in an area changes, the relative profitability of fishing also changes (Chapter 12). As a result, fishing effort increases in areas where CPUE improves, and decreases where CPUE declines. However, the model can be run to separate the effects of climate change and fishing where this information is required.
8.8 Uncertainty and gaps in knowledge
As indicated above, the projected effects of climate change on the oceanic environment and ecosystems that support tuna (Chapters 3 and 4), and on the population dynamics of tuna, are highly uncertain. The main sources of uncertainty are (1) the modelling of the global climate system, the coarse resolution of physical models and the lack of clear understanding of future ENSO patterns (Chapters 1–3); (2) the gaps in knowledge on the physiology, biology and ecology of tuna species; (3) the modelling of the food webs in the tropical Pacific Ocean, and the spatial distribution of tuna in relation to changes in their environment; and (4) the quality of fishing data.
The global climate models simulate changes in the Earth’s climate by coupling the atmosphere, ocean, land surface and ice regions, with the exchanges and interactions between them, based on physical laws (Chapter 1). The domain of a global climate model is divided into small spatial cells, with multiple layers from the top of the atmosphere to the bottom of the ocean. The reductions in the resolutions of global climate models required to enable them to run on the present generations of computers result in some biases (Chapter 1). These biases do not seriously impede the simulations of surface climate and changes to the physical and chemical nature of the tropical Pacific Ocean due to increased emissions of greenhouse gases. However, they do have larger consequences for assessing the effects on ecosystems and the biology of key species. For example, an error in projecting water temperature of 1°C or 2°C could significantly misrepresent the location of suitable spawning habitat for a tuna species. One method of compensating for such biases is to recalibrate the model parameters for environmental variables that are thought to be biased by the climate model simulations.
For the lower levels of the food webs in the ocean, such problems can be overcome by coupling biogeochemical models to global climate models, to project the carbon cycle and the interactions between physics and the biology of the organisms. These particular coupled models are known as ‘Earth’s climate models’. Progress in the development of these models has been substantial, and their main projections (e.g. simulations for decreasing biological production in the tropical regions due to higher stratification) are considered to be quite robust. However, a crucial gap in knowledge is the uncertainty about projected dissolved O2 concentrations in the ocean associated with the C/N ratio of organic matter.
Unlikely Somewhat likely Likely Very likely Very low Low Medium High Very high
0% 29% 66% 90% 100% 0% 5% 33% 66% 95% 100%
478
Much still also needs to be learned about the physiological responses of tuna to the changes in the major physical and chemical properties of the tropical Pacific Ocean summarised in this chapter. In particular, the responses of the fish to temperature and dissolved O2 are still only partially understood, and they are virtually unknown for pH. Our understanding of the basic energy requirements of the four species of tuna, and the different life stages of each species, is also limited. Furthermore, knowledge on the potential non-linear interactions, feedbacks and thresholds for the different effects of climate change on the energetic balance of tuna species is almost completely lacking.
Substantial improvements to the modelling of marine ecosystems and the spatial population dynamics of tuna are also required. At present, the uncertainties in physical and biogeochemical models are simply transferred to the simulations of the mid-trophic levels of the food webs that support tuna, and the simulations of tuna population dynamics. To limit this uncertainty, the SEAPODYM model uses relative rather than absolute parameterisation as much as possible. For example, all projected movements of fish are based on habitat gradients and habitat index values. Likewise, the parameterisation of spawning habitat uses the ratio between primary production and mid-trophic levels to represent the trade-off between density of prey and predators of larvae. The feeding habitat index combines accessibility to mid-trophic level components and their biomass, but does not depend on absolute consumption.
This approach reduces the impacts of biases in primary production estimates and mid-trophic levels considerably. On the other hand, parameterisation leading to absolute biomass of tuna populations is achieved with a rigorous mathematical approach based on assimilation of all historical fishing data (effort, catch and size of catch) in the model (Box 8.2).
8.9 Future research
The gaps in knowledge outlined above frame the priorities for research on the effects of climate change on tuna in the tropical Pacific. Given the great importance of tuna to the economies of PICTs (Chapters 1 and 12), urgent priorities for research are more robust projections of catches of the main species of tuna within the EEZs of PICTs. This analysis will depend on the development of global climate models at higher resolutions, combined with dynamical or statistical downscaling techniques123 at the scale of national EEZsvi, to improve the environmental forcing of ecosystem models.
Much research is also needed to improve the biogeochemical ecosystem models, and the estimates of future fishing effort, which need to be coupled to the global
vi This work is now being done for the tropical Pacific by the Australian Bureau of Meteorology, CSIRO and partners, under the Pacific Climate Change Science Programme; see www.cawcr.gov.au/projects/PCCSP

479
CHAPTER 8
climate models to estimate catches of the four species of tuna under various climate change scenarios. The main research required to further develop and parameterise the biogeochemical models is summarised below.
¾ Assessment of the effects of higher atmospheric concentrations of CO2 on the C/N ratio of organic matter in the ocean through laboratory experiments and networks of in situ observations.
¾ Definition of the optimal range and thresholds of temperature and dissolved O2 concentrations for the four species of tuna, and for their different life history stages. This will require both laboratory experiments and the use of internal and external electronic tags with multiple sensors.
¾ Evaluation of the potential impacts of increased acidification of the tropical Pacific Ocean on the production of gametes, fertilisation, embryonic development, hatching and larval behaviour and ecology of tuna. Experiments would be restricted to yellowfin tuna in the first instance because this is presently the only species of tropical tuna from the region that can be propagated in captivity.
¾ Investigation of other important physiological mechanisms in tuna that may also be affected by elevated levels of CO2/ocean acidification, including interactions with variability in water temperature and dissolved O2, and the effects of altered acoustics.
¾ Estimation of (1) the energy transfer efficiency between all levels of the food web, but particularly from the lower levels to the mid-trophic level (micronekton), which constitutes the prey of tuna; and (2) the spatial and temporal variation in the diversity, distribution and abundance of micronekton across the region. Such research is needed to help define the carrying capacity of the pelagic ecosystem in the tropical Pacific Ocean for tuna more realistically. It is also needed to assess whether productivity of tuna stocks is controlled directly by food abundance, or if there are non-linear relationships such as changes in food assimilation rates in relation to prey density or threshold limits. The research will require investment in extensive sampling programmes, including development and validation of new acoustic methods for quantifying micronekton, and routine use of these methods by merchant vessels of opportunity (see Chapter 4 for details).
¾ Ongoing tagging programmes, both with conventional and electronic tags, for all four species of tuna to verify whether the projected changes in their distributions, in response to altered water temperatures, currents and O2 levels, occur.
¾ Description of the diets of the four species of tuna in more detail to evaluate competition between these species more accurately.
¾ Identification of the socio-economic scenarios likely to drive future fishing effort in the region3, taking into account, for example, the increasing demand for tuna, the changing demography of the region, the likelihood of spatial changes in fishing effort, and increasing fuel costs.

480
8.10 Management implications and recommendations
As described in Section 8.1, overall management of tuna fisheries in the western and central Pacific is the responsibility of the WCPFC. Its primary role is to ensure that stock-wide exploitation of tuna and related species in its convention area is undertaken in a responsible and sustainable way. Within these overall constraints, PICTs are seeking opportunities to maximise the economic benefits from tuna fisheries in their EEZs arising from onshore handling and processing of the catch, and local support industries. For many PICTs, these objectives and the strategies to achieve them are laid down in their ‘National Tuna Management and Development Plan’. These plans have a high level of political support. Members of the Pacific Islands Forum also pursue coordinated policy approaches to maximise the benefits from tuna through the Forum Fisheries Agency. Increasingly, however, hands-on management is being pursued through subregional groupings of PICTs, such as the PNA in the case of the tropical surface fishery for tuna, and the members of the Te Vaka Moana Arrangement focusing on longline fisheries targeting albacore and swordfish in southern subtropical waters.
Within this overall management framework, the implications of the projected effects of climate change on tuna need to be integrated into strategies that will mitigate negative effects and take advantage of increased abundances of fish where they are projected to occur. Clearly, this process will need to evolve over time as the uncertainties and knowledge gaps outlined in Section 8.8 are addressed. However, based on the information presented in this chapter, management authorities can begin to position themselves to deal with the potential future changes. The main management implications and measures that need to be considered are outlined below.
¾ The WCPFC should explicitly consider the implications of climate change as it develops its management objectives and strategies over the coming years. With the eventual possibility of reduced overall abundance of skipjack, yellowfin and bigeye tuna in the WCPO, the WCPFC will need to continue to (1) strengthen the mechanisms to manage overall fishing effort or catches (or both) in its convention area; and (2) develop the necessary tools to monitor and enforce its conservation and management measures, in order to anticipate any large change in the fundamental biological parameters of exploited stocks.
¾ The eastern boundary of the WCPFC convention area is 150°W north of 4°S and 130°W south of 4°S, while the western boundary of the organisation charged with tuna fisheries management in the EPO, the Inter-American Tropical Tuna Commission (IATTC), is 150°W. These boundaries neatly separate the historical high-volume purse-seine catches into their western and eastern components (Figure 8.16). However, the projections described in Section 8.6.1 indicate that the distributions of skipjack and bigeye tuna (and by extension yellowfin tuna) are likely to shift progressively towards the central and eastern Pacific during the

481
CHAPTER 8
21st century. Because both the surface and longline fisheries are likely to respond to these shifts, a much more even distribution of catch across the tropical Pacific (than historically) is plausible. This would require cooperation in all aspects of tuna fisheries management between the WCPFC and the IATTC. A merger of these organisations, creating a pan-Pacific tuna fisheries management body, is something that may eventually require serious consideration, on the proviso that the present relative levels of effort in the WCPO and EPO are maintained.
¾ A major re-distribution of tuna fishing activity towards the central Pacific would clearly alter the current distribution of the fisheries among the EEZs of PICTs, and associated economic benefits (Chapter 12). This would create challenges for some PICTs and opportunities for others. It will be important that the various layers of management, but particularly the PNA in whose EEZs a significant portion of the regional tuna catch occurs, further develop their management systems to ensure flexibility to cope with a potentially changing spatial distribution of fishing effort.
¾ Notwithstanding the results from the preliminary modelling, indicating an eastward re-distribution of tropical tuna stocks, there may well be subregional effects that run counter to this trend. For example, projections of a 10–20% increase in rainfall for the Sepik-Ramu and other large river systems under the A2 emissions scenario by 2100 could increase nutrient flows into the Bismarck Sea and more generally through the Indonesia-PNG archipelagos, retaining concentrations of tuna in these areas. Any such persistent subregional concentrations of tuna would heighten the need for regionally-responsible, spatially-explicit management in these archipelagic areas, which are currently beyond the mandate of WCPFC because of the sovereign status of archipelagic waters.
30°N
20°N
10°N
0°
10°S
20°S
30°S
120°E 140°E 160°E 180° 160°W 140°W 120°W 100°W 80°W
Skipjack Yellowfin Bigeye
Figure 8.16 Distribution of purse-seine catches of skipjack (dark blue), yellowfin (blue) and bigeye tuna (light blue) in the tropical Pacific Ocean from 1980 to 2009. The convention area of the Western and Central Pacific Fisheries Commission lies to the west of the solid orange line. The Inter-American Tropical Tuna Commission convention area lies to the east of the solid line north of 4°S and the dashed line south of 4°S. Circles indicate relative differences in the sizes of aggregated catches of all species.

482
¾ PNA has implemented a vessel day scheme (VDS)vii for the purse-seine fishery in the EEZs of its members, and recently taken steps to develop a similar scheme for the longline fishery. Essentially, these schemes allocate fishing effort among the EEZs according to agreed criteria and allow for transferability of these rights among members. The transferability aspect of the VDS has recently come into effect, and will need to be implemented and adjusted in the future if changing distributions of fishing effort are to be managed in an orderly fashion.
The VDS has the potential to operate in a similar way to the ‘cap and trade’ systems being considered by many countries worldwide to limit their emissions of CO2
124. Indeed, a key advantage of the VDS is that it can hold total fishing effort for PNA members constant, yet allow them to trade fishing days when the fish are concentrated either in the west or east due to ENSO events. For the VDS to work efficiently, however, PNA members will need to ensure that fishing effort conforms to the levels specified. The allocation of effort among members will also need to be adjusted periodically as the stocks of tuna move progressively east. Periodic adjustment will still allow the transfer of effort during ENSO events but avoid the need for PNA members further to the east to continually purchase vessel days from those in the west, based on present-day catches.
¾ Eastward re-distribution of tuna and their associated fisheries could have major consequences for the vulnerability of stocks to exploitation, particularly bigeye tuna. In recent years, the purse-seine catch of bigeye tuna has been concentrated in the western Pacific (Figure 8.17a), in line with the distribution of effort by purse-seine vessels. However, catch per unit effort of bigeye tuna by purse-seine is much higher in the central and eastern Pacific (Figure 8.17b), possibly as a result of greater abundance or greater vulnerability of this species to purse-seining in the region due to the shallower depth of the mixed layer there23. Thus, any large-scale shift of the purse-seine fishery towards the central Pacific is likely to increase the exploitation rates of bigeye tuna and place the stock under even greater pressure than is currently the case. Management authorities would, therefore, need to give high priority to developing further measures to mitigate the capture of bigeye tuna by purse-seine.
¾ Albacore in southern subtropical areas are caught mainly by longline, with considerable fishing activity based out of PICTs located in this part of the region. The initial interpretations from the modelling discussed in Section 8.6.1 are that increases in productivity at the edges of the South Pacific Subtropical Gyre province may have a positive impact on the abundance of albacore, although some poleward displacement in the distribution of the stock is also possible. Such potential changes in distribution of the fish and the fleet may create a need for spatial management arrangements for albacore similar to the VDS for the tropical species of tuna. Strategies to develop the fishery for albacore may also need to
vii For a description of the vessel day scheme, see Attachment C of WCPFC Conservation and Management Measure for Bigeye and Yellowfin Tuna in the Western and Central Pacific Ocean (CMM 2008-01) www.wcpfc.int/doc/cmm-2008-01/conservation-and-management-measure-bigeye-and-yellowfin-tuna-western-and-central-pa
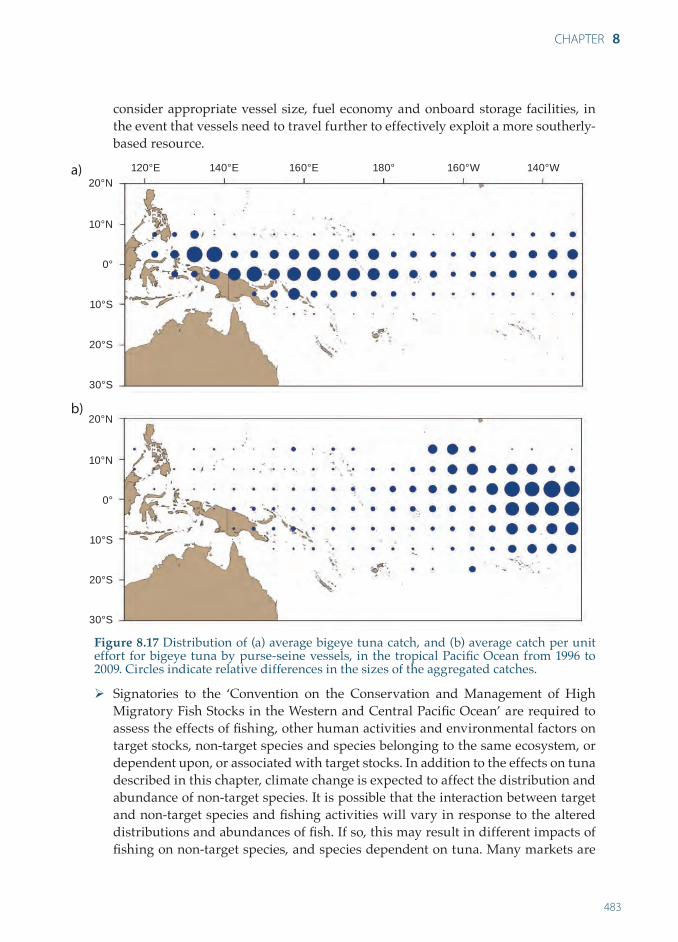
483
CHAPTER 8
consider appropriate vessel size, fuel economy and onboard storage facilities, in the event that vessels need to travel further to effectively exploit a more southerly-based resource.
Figure 8.17 Distribution of (a) average bigeye tuna catch, and (b) average catch per unit effort for bigeye tuna by purse-seine vessels, in the tropical Pacific Ocean from 1996 to 2009. Circles indicate relative differences in the sizes of the aggregated catches.
¾ Signatories to the ‘Convention on the Conservation and Management of High Migratory Fish Stocks in the Western and Central Pacific Ocean’ are required to assess the effects of fishing, other human activities and environmental factors on target stocks, non-target species and species belonging to the same ecosystem, or dependent upon, or associated with target stocks. In addition to the effects on tuna described in this chapter, climate change is expected to affect the distribution and abundance of non-target species. It is possible that the interaction between target and non-target species and fishing activities will vary in response to the altered distributions and abundances of fish. If so, this may result in different impacts of fishing on non-target species, and species dependent on tuna. Many markets are
120°E 140°E 160°E 180° 160°W 140°W
10°N
0°
10°S
20°S
30°S
20°Na)
10°N
0°
10°S
20°S
30°S
20°Nb)

484
now adopting certification schemes that require the impacts of tuna fishing on non-target and dependent species to be minimised. The potential for such impacts under a changing climate need to be evaluated, and fishing practices modified if necessary, to ensure that the demands of the market are satisfied.
Although there are still several uncertainties associated with the projected future distributions of tuna in the tropical Pacific, the likely trends in distribution and catches reported here have a reasonable basis. Pacific Island countries and territories, and the tuna management institutions acting in their interests, would be wise to begin deciding how to adapt to these trends. They should also commission the science needed to improve confidence in these projections so that the necessary adaptations can be progressively fine-tuned.

485
CHAPTER 8
References
1. Gillett R, McCoy M, Rodwell R and Tamate J (2001) Tuna: A Key Economic Resource in the Pacific Islands. Pacific Studies Series, Asian Development Bank, Manila, Philippines.
2. Gillett R (2009) Fisheries in the Economies of Pacific Island Countries and Territories. Pacific Studies Series, Asian Development Bank, Manila, Philippines.
3. Gillett R and Cartwright I (2010) The Future of Pacific Island Fisheries. Secretariat of the Pacific Community, Noumea, New Caledonia.
4. Williams P and Terawasi P (2010) Overview of Tuna Fisheries in the Western and Central Pacific Ocean, Including Economic Conditions – 2009. WCPFC-SC6-2010-GN-WP-01, Western and Central Pacific Fisheries Commission Scientific Committee, Sixth Regular Session, 10–19 August 2010, Nuku’alofa, Kingdom of Tonga.
5. Bell JD, Kronen M, Vunisea A, Nash WJ and others (2009) Planning the use of fish for food security in the Pacific. Marine Policy 33, 64–76.
6. Lehodey P, Bertignac M, Hampton J, Lewis T and Picaut J (1997) El Niño-Southern Oscillation and tuna in the western Pacific. Nature 389, 715–718.
7. Lehodey P (2001) The pelagic ecosystem of the tropical Pacific Ocean: Dynamic spatial modelling and biological consequences of ENSO. Progress in Oceanography 49, 439–468.
8. Nakicenovic N, Alcamo J, Davis G, de Vries B and others (2000) Special Report on Emissions Scenarios: A Special Report of Working Group III of the Intergovernmental Panel on Climate Change. PNNL-SA-39650, Cambridge University Press, New York, United States of America.
9. Harley S, Williams P, Nicol S and Hampton J (2010) The Western and Central Pacific Tuna Fishery: 2007–2008 Overview and Status of Stocks. Secretariat of the Pacific Community Oceanic Fisheries Programme Tuna Fisheries Assessment Report 9, Noumea, New Caledonia.
10. Hoyle S, Kleiber P, Davies N, Harley S and Hampton J (2010) Stock Assessment of Skipjack Tuna in the Western and Central Pacific Ocean, Rev.1. WCPFC-SC6-2010/SA-WP-10, Western and Central Pacific Fisheries Commission Scientific Committee, Sixth Regular Session, 10–19 August 2010, Nuku’alofa, Kingdom of Tonga.
11. WCPFC (2010) Summary Report. Western and Central Pacific Fisheries Commission Scientific Committee, Sixth Regular Session, 10–19 August 2010, Nuku’alofa, Kingdom of Tonga.
12. Hampton J and Fournier D (2001) A spatially disaggregated, length-based, age-structured population model of yellowfin tuna (Thunnus albacares) in the western and central Pacific Ocean. Marine and Freshwater Research 52, 937–963.
13. Langley A, Wright A, Hurry G, Hampton J and others (2009) Slow steps towards management of the world’s largest tuna fishery. Marine Policy 33, 271–279.
14. Hoyle S, Langley A and Hampton J (2008) Stock Assessment of Albacore Tuna in the South Pacific Ocean. WCPFC-SC4-2008/SA-WP-8, Western and Central Pacific Fisheries Commission Scientific Committee, Fourth Regular Session, 11–22 August 2008, Port Moresby, Papua New Guinea.
15. Langley A, Harley S, Hoyle S, Davies N and others (2009) Stock Assessment of Yellowfin Tuna in the Western and Central Pacific Ocean. WCPFC–SC5-2007/SA-WP-3, Western and Central Pacific Fisheries Commission Scientific Committee, Fifth Regular Session, 10–21 August 2009, Port Vila, Vanuatu.

486
16. Harley S, Hoyle S, Williams P, Hampton J and Kleiber P (2010) Stock Assessment of Bigeye Tuna in the Western and Central Pacific Ocean. WCPFC-SC6-2010/SA-WP-4, Western and Central Pacific Fisheries Commission Scientific Committee, Sixth Regular Session, 10–19 August 2010, Nuku’alofa, Kingdom of Tonga.
17. Hilborn R (2009) Pretty good yield and exploited fishes. Marine Policy 34, 193–196.18. Hilborn R and Walters CJ (1992) Quantitative Fisheries Stock Assessment: Choice, Dynamics
and Uncertainty. Chapman and Hall, New York, United States of America.19. Lehodey P, Alheit J, Barange M, Baumgartner T and others (2006) Climate variability, fish
and fisheries. Journal of Climate 19, 5009–5030.20. Hampton J and Harley S (2009) Assessment of the Potential Implications of Application of
CMM-2008-01 for Bigeye and Yellowfin Tuna. WCPFC-SC5 GN-WP-17, Western and Central Pacific Fisheries Commission Scientific Committee, Fifth Regular Session, 10–21 August 2010, Port Vila, Vanuatu.
21. Brander KM (2010) Impacts of climate change on fisheries. Journal of Marine Systems 79, 389–402.
22. Drinkwater K, Hunt G, Lehodey P, Lluch-Cota S and others (2010) Climate forcing on marine ecosystems. In: M Barange, JG Field, RP Harris, EE Hofmann, IR Perry and FE Werner (eds) Marine Ecosystems and Global Change. Oxford University Press, Oxford, United Kingdom, pp. 11–39.
23. Longhurst AR (2006) Ecological Geography of the Sea. Academic Press, New York, United States of America.
24. Delcroix T and McPhaden M (2002) Interannual sea surface salinity and temperature changes in the western Pacific warm pool during 1992–2000. Journal of GeophysicalResearch 107, 8002–8019.
25. Lehodey P (2004) Climate and fisheries: An insight from the Pacific Ocean. In: NC Stenseth, G Ottersen, J Hurrel and A Belgrano (eds) Ecological Effects of Climate Variations in the North Atlantic. Oxford University press, Oxford, United Kingdom, pp. 137–146.
26. Lu HJ, Lee KT, Lin HL and Liao CH (2001) Spatio-temporal distribution of yellowfin tuna Thunnus albacares and bigeye tuna Thunnus obesus in the tropical Pacific Ocean in relation to large-scale temperature fluctuation during ENSO episodes. Fisheries Science 67,1046–1052.
27. Lu HJ, Lee KT and Liao HL (1998) On the relationship between El Niño-Southern Oscillation and South Pacific albacore. Fisheries Research 39, 1–7.
28. Briand K (2005) Effets des Variabilités Climatiques Saisonnières et Interannuelles sur l’Habitat et les Captures de Thons dans la ZEE de Nouvelle-Calédonie. ZoNéCo, Rapport final, Programme d’Évaluation des Ressources Marines de la Zone Économique de Nouvelle-Calédonie, Nouméa, Nouvelle-Calédonie.
29. Senina I, Sibert J and Lehodey P (2008) Parameter estimation for basin-scale ecosystem-linked population models of large pelagic predators: Application to skipjack tuna. Progress in Oceanography 78, 319–335.
30. Sund PN, Blackburn M and Williams F (1981) Tunas and their environment in the Pacific Ocean: A review. Oceanography Marine Biology: An Annual Review 19, 443–512.
31. Pörtner HO (2006) Climate dependent evolution of Antarctic ectotherms: An integrative analysis (EASIZ, SCAR). Deep-Sea Research II 53, 1071–1104.
32. Pörtner HO (2002) Environmental and functional limits to muscular exercise and body size in marine invertebrate athletes. Comparative Biochemistry and Physiology 133A,303–321.

487
CHAPTER 8
33. Peck LS, Clark MS, Morley SA, Massey A and Rossetti H (2009) Animal temperature limits and ecological relevance: Effects of size, activity and rates of change. Functional Ecology 23, 248–256.
34. Pörtner HO and Farrell AP (2008) Physiology and climate change. Science 322, 690–692.35. IPCC (2007) Climate Change 2007: Synthesis Report. Contribution of Working Groups I, II and III
to the Fourth Assessment. Report of the Intergovernmental Panel on Climate Change Core Writing Team, Geneva, Switzerland.
36. Guilyardi E (2006) 2006: El Niño-mean state-seasonal cycle interactions in a multi-model ensemble. Climate Dynamics 26, 329–348.
37. Barrett I and Hester FJ (1964) Body temperature of yellowfin and skipjack tunas in relation to sea surface temperature. Nature 203, 96–97.
38. Carey FG and Teal JM (1966) Heat conservation in tuna fish muscle. Proceedings of the National Academy of Science of the USA 56, 1464–1469.
39. Neill WH, Chang RKC and Dizon AE (1976) Magnitude and ecological implications of thermal inertia in skipjack tuna Katsuwonus pelamis. Environmental Biology of Fishes 1,61–80.
40. Block BA and Finnerty JR (1994) Endothermy in fishes: A phylogenetic analysis of constraints, predispositions, and selection pressures. Environmental Biology of Fishes 40, 283–302.
41. Brill RW (1996) Selective advantages conferred by the high performance physiology of tunas, billfishes, and dolphin fish. Comparative Biochemistry and Physiology 113A, 3–15.
42. Graham JB and Dickson KA (2001) Anatomical and physiological specializations for endothermy. In: BA Block and ED Stevens (eds) Tuna: Physiology, Ecology and Evolution Volume 19. Academic Press, San Diego, United States of America, pp. 121–165.
43. Dickson KA and Graham JB (2004) Evolution and consequences of endothermy in fishes. Physiological and Biochemical Zoology 77, 998–1018.
44. Barkley RA, Neill WH and Gooding RM (1978) Skipjack tuna, Katsuwonus pelamis, habitat based on temperature and oxygen requirements. Fishery Bulletin US 76, 653–662.
45. Sharp GD and Vlymen WJ (1978) The relationship between heat generation, conservation, and the swimming energetics of tunas. In: GD Sharp and AW Dizon (eds) The Physiological Ecology of Tunas. Academic Press, New York, United States of America, pp. 213–232.
46. Dizon AE and Brill RW (1979) Thermoregulation in tuna. American Zoologist 19, 249–265.47. Graham JB and Dickson KA (1981) Physiological thermoregulation in the albacore
Thunnus alalunga. Physiological Zoology 54, 470–486.48. Holland N, Brill RW, Chang RK, Sibert JR and Fournier DA (1992) Physiological and
behavioral thermoregulation in bigeye tuna (Thunnus obesus). Nature 358, 110–112.49. Dewar H, Graham JB and Brill RW (1994) Studies of tropical tuna swimming performance
in a large water tunnel II: Thermoregulation. Journal of Experimental Biology 192, 33–44.50. Malte HC, Larsen MK, Musyl and Brill RW (2007) Differential heating and cooling rates
in bigeye tuna (Thunnus obesus); a model of non-steady state heat exchange. Journal of Experimental Biology 210, 2618–2626.
51. Schaefer KM and Fuller DW (2007) Vertical movement patterns of skipjack tuna (Katsuwonus pelamis) in the eastern equatorial Pacific Ocean, as revealed with archival tags. Fishery Bulletin US 105, 379–389.
52. Schaefer KM, Fuller DW and Block BA (2007) Movements, behaviour, and habitat utilization of yellowfin tuna (Thunnus albacares) in the northeastern Pacific Ocean, ascertained through archival tag data. Marine Biology 152, 503–525.

488
53. Musyl MK, Brill RW, Boggs CH, Curran DS and others (2003) Vertical movements of bigeye tuna (Thunnus obesus) associated with islands, buoys, and seamounts of the Hawaiian Archipelago from archival tagging data. Fisheries Oceanography 12,152–169.
54. Domokos R, Seki MP, Polovina JJ and Hawn DR (2007) Oceanographic investigations of the American Samoa albacore (Thunnus alalunga) habitat and longline fishing grounds. Fisheries Oceanography 16, 555–572.
55. Brill RW (1994) A review of temperature and O2 tolerance studies of tunas pertinent to fisheries oceanography, movement models and stock assessments. Fisheries Oceanography 3, 204–216.
56. Lehodey P, Senina I and Murtugudde R (2008) A spatial ecosystem and populations dynamics model (SEAPODYM) – Modelling of tuna and tuna-like populations. Progress in Oceanography 78, 304–318.
57. Warrant EJ (2000) The eyes of deep-sea fish and the changing nature of visual scenes with depth. Philosophical Transactions of the Royal Society of London B 355, 1155–1159.
58. Fritches KA, Marshall NJ and Warrant EJ (2003) Retinal specializations in the blue marlin: Eye designed for sensitivity to low light levels. Marine and Freshwater Research 54, 333–341.
59. Brill RW, Bigelow KA, Musyl MK, Fritsches KA and Warrant EJ (2005) Bigeye tuna (Thunnus obesus) behavior and physiology and their relevance to stock assessments and fishery biology. Collective Volume of Scientific Papers International Commission for the Conservation of Atlantic Tunas 57, 142–161.
60. Pörtner HO and Knust R (2007) Climate change affects marine fishes through the oxygen limitation of thermal tolerance. Science 315, 95–97.
61. Oschlies A, Schulz KG, Riebesell U and Schmittner A (2008) Simulated 21st Century's increase in oceanic suboxia by CO2- enhanced biotic carbon export. Global Biogeochemical Cycles 22, GB4008, doi:10.1029/2007GB003147
62. Heath AG (1995) Water Pollution and Fish Physiology. CRC Press, Boca Raton, Florida, United States of America.
63. Dizon AE (1977) Effect of dissolved oxygen concentrations and salinity on swimming speed of two species of tunas. Fishery Bulletin US 75, 649–653.
64. Bushnell PG, Brill RW and Bourke RE (1990) Cardiorespiratory responses of skipjack tuna Katsuwonus pelamis; yellowfin tuna Thunnus albacares and bigeye tuna T. obesus, to acute reductions in ambient oxygen. Canadian Journal of Zoology 68, 1857–1865.
65. Bushnell PG and Brill RW (1991) Responses of swimming skipjack (Katsuwonus pelamis) and yellowfin (Thunnus albacares) tunas exposed to acute hypoxia, and a model of their cardiorespiratory function. Physiological Zoology 64, 787–811.
66. Bushnell PG and Brill RW (1992) Oxygen transport and cardiovascular responses in skipjack tuna (Katsuwonus pelamis) and yellowfin tuna (Thunnus albacares) exposed to acute hypoxia. Journal of Comparative Physiology B 162, 131–143.
67. Korsmeyer KE, Dewar H, Lai NC and Graham JB (1996) Tuna aerobic swimming performance: Physiological and environmental limits based on oxygen supply and demand. Comparative Biochemistry and Physiology 113B, 45–56.
68. Cayré P (1991) Behavior of yellowfin tuna (Thunnus albacares) and skipjack tuna (Katsuwonus pelamis) around fish aggregating devices (FADs) in the Comoros Island as determined by ultrasonic tagging. Aquatic Living Resources 4, 1–12.
69. Cayré PF and Marsac F (1993) Modelling the yellowfin tuna (Thunnus albacares) vertical distribution using sonic tagging results and local environmental parameters. Aquatic Living Resources 6, 1–14.
489
CHAPTER 8
70. Sharp GD (1978) Behavioural and physiological properties of tunas and their effects on vulnerability to fishing gear. In: GD Sharp and AW Dizon (eds) The Physiological Ecology of Tunas. Academic Press, New York, United States of America, pp. 397–449.
71. Graham JB, Lowell RW, Lai NC and Laurs RM (1989) O2 tension, swimming velocity, and thermal effects on the metabolic rate of the Pacific albacore, Thunnus alalunga. Experimental Biology 48, 89–94.
72. Hanamoto E (1987) Effect of oceanographic environment on bigeye tuna distribution. Bulletin of the Japanese Society of Fishery Oceanography 51, 203–216.
73. Josse E, Bach P and Dagorn L (1998) Simultaneous observations of tuna movements and their prey by sonic tracking and acoustic surveys. Hydrobiologia 371/372, 61–69.
74. Dagorn L, Bach P and Josse E (2000) Movement patterns of large bigeye tuna (Thunnus obesus) in the open ocean determined using ultrasonic telemetry. Marine Biology 136,361–371.
75. Lowe TE, Brill RW and Cousins KL (2000) Low blood oxygen-binding characteristics of bigeye tuna (Thunnus obesus), a high-energy-demand teleost that is tolerant of low ambient oxygen. Marine Biology 136, 1087–1098.
76. Garcia HE, Locarnini RA, TP Boyer, Antonov JI and others (2010) World Ocean Atlas 2009, Volume 3: Dissolved Oxygen, Apparent Oxygen Utilization, and Oxygen Saturation. National Oceanic and Atmospheric Administration Atlas NESDIS 70, U.S. Government Printing Office, Washington, United States of America.
77. Ingham MC, Cook SK and Hausknecht KA (1977) Oxycline characteristics and skipjack tuna distribution in the southeastern tropical Atlantic. Fishery Bulletin US 75, 857–865.
78. Gooding RG, Neill WH and Dizon AE (1981) Respiration rates and low-oxygen tolerance limits in skipjack tuna, Katsuwonus pelamis. Fishery Bulletin US 79, 31–47.
79. Bigelow K, Hampton J and Miyabe N (2002) Application of a habitat-based model to estimate effective longline fishing effort and relative abundance of Pacific bigeye tuna (Thunnus obesus). Fisheries Oceanography 11, 143–155.
80. Nishikawa Y, Honma M, Ueyenagi S and Kikawa S (1985) Average distribution of larvae of oceanic species of scombrid fishes, 1951–1981. Contribution of the Far Seas Fisheries Research Laboratory, Fishery Agency of Japan 236, 1–99.
81. Sarmiento JL, Slater R, Barber R, Bopp L and others (2004) Response of ocean ecosystems to climate warming. Global Biogeochemical Cycles 18, GB3003, doi:10.1029/2003GB002134
82. Humston R, Ault JS, Lutcavage M and Olson DB (2000) Schooling and migration of large pelagic fishes relative to environmental cues. Fisheries Oceanography 9, 136–146.
83. Newlands N and Lutcavage M (2001) From individuals to local population densities: Movements of North Atlantic bluefin tuna (Thunnus thynnus) in the Gulf of Maine/Northwestern Atlantic. In: JR Sibert and JL Nielsen (eds) Electronic Tagging and Tracking in Marine Fisheries. Kluwer Academic Press, Boston, United States of America, pp. 421–441.
84. Lehodey P (2000) Impacts of the El Niño-Southern Oscillation on Tuna Populations and Fisheries in the Tropical Pacific Ocean. 13th Standing Committee on Tuna and Billfish, Noumea, 5–12 July 2000, Working Paper RG-1, Secretariat of the Pacific Community, Noumea, New Caledonia.
85. Sabine CL, Feely RA, Gruber N, Key RM and others (2004) The oceanic sink for CO2. Science 305, 367–371.
86. Orr JC, Fabry VJ, Aumont O, Bopp L and others (2005) Anthropogenic ocean acidification over the twenty-first century and its impact on calcifying organisms. Nature 437, 681–686.
87. Caldeira K and Wickett ME (2003) Anthropogenic carbon and ocean pH. Nature 425, 365.

490
88. Zeebe R, Zachos J, Caldeira K and Tyrrell T (2008) Carbon emissions and acidification. Science 321, 51–52.
89. Pörtner HO, Langenbuch M and Reipschlager A (2004) Biological impact of elevated ocean CO2 concentrations: Lessons from animal physiology and earth history. Journal of Oceanography 60, 705–718.
90. Pörtner HO, Storch D and Heilmayer O (2005) Constraints and trade-offs in climate dependent adaptation: Energy budgets and growth in a latitudinal cline. Scientia Marina 69, 271–285.
91. Checkley DM Jr, Dickson AG, Takahashi M, Radich JA and others (2009) Elevated CO2 enhances growth in young fish. Science 324, 1683.
92. Munday PL, Dixson DL, Donelson JM, Jones GP and others (2009) Ocean acidification impairs olfactory discrimination and homing ability of a marine fish. Proceedings of the National Academy of Sciences of the USA 106, 1848–1852.
93. Fabry VJ, Seibel BA, Feely RA and Orr JC (2008) Impacts of ocean acidification on marine fauna and ecosystem processes. ICES Journal of Marine Science 65, 414–432.
94. Hester KC, Peltzer ET, Kirkwood WJ and Brewer PG (2008) Unanticipated consequences of ocean acidification: A noisier ocean at lower pH. Geophysical Research Letters 35(19), L19601.
95. Ilyina T, Zeebe RE and Brewer PG (2010) Future ocean increasingly transparent to low-frequency sound owing to carbon dioxide emissions. Nature Geoscience 3, 18–22.
96. Au WWL, Popper AN and Fay RR (2000) Hearing by Whales and Dolphins. Springer-Verlag, Berlin, Germany.
97. Iverson RTB (1967) Responses of yellowfin tuna (Thunnus albacares) to underwater sound. Marine Bio-acoustics 2, 105–121.
98. Madsen PT, Kerr I and Payne R (2004) Echolocation clicks of two free-ranging, oceanic delphinids with different food preferences: False killer whales Pseudorca crassidens and Risso’s dolphins Grampus griseus. The Journal of Experimental Biology 207, 1811–1823.
99. Nachtigall PE, Au WWL, Pawloski JL, Andrews K and Oliver CW (1998) Measurements of the Low Frequency Components of Active and Passive Sounds Produced by Dolphins. Southwest Fisheries Science Center Administrative Report LJ -00-07C, National Oceanic and Atmospheric Administration, National Marine Fisheries Service, La Jolla, California, United States of America.
100. Wartzog D and Ketten DR (1999) Marine mammal sensory systems. In: JE Reynolds III and SA Rommel (eds) Biology of Marine Mammals. Smithsonian Institution Press, Herndon, Virginia, United States of America, pp. 117–175.
101. Finneran JJ, Oliver CW and Schaefer KM (2000) Source levels and estimated yellowfin tuna (Thunnus albacares) detection ranges for dolphin jaw pops, breaches, and tail slaps. Journal of the Acoustical Society of America 107, 649–656.
102. Munday PL, Donelson JM, Dixson DL and Endo GGK (2009) Effects of ocean acidification on the early life history of a tropical marine fish. Proceedings of the Royal Society London B 276, 3275–3283.
103. Allain V (2005) Ecopath Model of the Pelagic Ecosystem of the Western and Central Pacific Ocean. WCPFC-SC1 EB-WP-10, Western and Central Pacific Fisheries Commission Scientific Committee, First Regular Session, 8–19 August 2005, Noumea, New Caledonia.
104. Bopp L, Monfray P, Aumont O, Dufresne JL and others (2001) Potential impact of climate change on marine export production. Global Biogeochemical Cycles 15, 81–99.
105. Behrenfeld MJ, O'Malley R, Siegel D, McClain C and others (2006) Climate-driven trends in contemporary ocean productivity. Nature 444, 752–755.

491
CHAPTER 8
106. Riebesell U, Zondervan I, Rost B, Tortell PD and others (2000) Reduced calcification of marine plankton in response to increased atmospheric CO2. Nature 407, 364–367.
107. Tyrrell T and Merico A (2004) Emiliania huxleyi: Bloom observations and the conditions that induce them. In: HR Thierstein and JR Young (eds) Coccolithophores: From Molecular Processes to Global Impact. Springer-Verlag, Berlin, Germany, pp. 75–97.
108. Langdon C, Takahashi T, Sweeney C, Chipman D and others (2000) Effect of calcium carbonate saturation state on the calcification rate of an experimental coral reef. Global Biogeochemical Cycles 14, 639–654.
109. Langer G, Gussone N, Nehrke G, Riebesell U and others (2006) Coccolith strontium to calcium ratios in Emiliania huxleyi: The dependence on seawater strontium and calcium concentrations. Limnology and Oceanography 51, 310–320.
110. Gazeau F, Quiblier C, Jansen JM, Gattuso JP and others (2007) Impact of elevated CO2 on shellfish calcification. Geophysical Research Letters 34(7), L07603.
111. Hjort J (1914) Fluctuations in the great fisheries of northern Europe viewed in the light of biological research. Rapports et Procès-verbaux des Réunions du Conseil International pour l’Exploration de la Mer 20, 1–228.
112. Cushing DH (1975) Marine Ecology and Fisheries. Cambridge University Press, Cambridge, United Kingdom.
113. Olson RJ and Boggs CH (1986) Apex predation by yellowfin tuna (Thunnus albacares): Independent estimates from gastric evacuation and stomach contents, bioenergetics, and cesium concentrations. Canadian Journal of Fisheries and Aquatic Sciences 43, 1760–1775.
114. Essington TE (2003) Development and sensitivity analysis of bioenergetics models for skipjack tuna and albacore: A comparison of alternative life histories. Transactions of the American Fisheries Society 132, 759–770.
115. Ciannelli L, Hjermann DØ, Lehodey P, Ottersen G and others (2005) Climate forcing, food web structure and community dynamics in pelagic marine ecosystems. In: A Belgrano, U Scharler, J Dunne and B Ulanowicz (eds) Aquatic Food Webs: An Ecosystem Approach. Oxford University Press, Oxford, United Kingdom, pp. 143–169.
116. Bertignac M, Lehodey P and Hampton J (1998). A spatial population dynamics simulation model of tropical tunas using a habitat index based on environmental parameters. Fisheries Oceanography 7, 326–334.
117. Lehodey P, André JM, Bertignac M, Hampton J and others (1998) Predicting skipjack tuna forage distributions in the equatorial Pacific using a coupled dynamical bio-geochemical model. Fisheries Oceanography 7, 317–325.
118. Lehodey P, Chai F and Hampton J (2003) Modelling climate-related variability of tuna populations from a coupled ocean-biogeochemical-populations dynamics model. Fisheries Oceanography 12, 483–494.
119. Lehodey P, Murtugudde R and Senina I (2010) Bridging the gap from ocean models to population dynamics of large marine predators: A model of mid-trophic functional groups. Progress in Oceanography 84, 69–74.
120. Marti O, Braconnot P, Bellier J, Benshila R and others (2006) The New IPSL Climate System Model: IPSL-CM4. Note du Pôle de Modélisation n°26 ISSN 1288-1619.
121. Lehodey P, Senina I, Sibert J, Bopp L and others (2010) Preliminary forecasts of population trends for Pacific bigeye tuna under the A2 IPCC scenario. Progress in Oceanography 86, 302–315.
122. Schaefer KM (2001) Assessment of skipjack tuna (Katsuwonus pelamis) spawning activity in the eastern Pacific Ocean. Fishery Bulletin US 99, 343–350.

492
123. Stock CA, Alexander MA, Bond NA, Brander KM and others (2010) On the use of IPCC-class models to assess the impact of climate on living marine resources. Progress in Oceanography 88, 1–27.
124. Dawson B and Spannagle M (2009) The Complete Guide to Climate Change. Routledge, New York, United States of America.