vulnerability and adaptation to dengue fever: a socioeconomic scenario
DESCRIPTION
Vulnerability and Adaptation to Dengue Fever: A Socioeconomic Scenario. Charmaine Heslop-Thomas and Wilma-Bailey*. AIM. - PowerPoint PPT PresentationTRANSCRIPT

Vulnerability and Vulnerability and Adaptation to Dengue Adaptation to Dengue
Fever: A Fever: A Socioeconomic Socioeconomic
ScenarioScenarioCharmaine Heslop-Thomas Charmaine Heslop-Thomas
and Wilma-Bailey*and Wilma-Bailey*

AIMAIM
To develop socioeconomic scenarios To develop socioeconomic scenarios to analyse the vulnerability of to analyse the vulnerability of communities in Jamaica to possible communities in Jamaica to possible increase in the transmission of increase in the transmission of dengue and to propose actions that dengue and to propose actions that can mitigate the effectscan mitigate the effects

RESEARCH QUESTIONSRESEARCH QUESTIONS What areas of the country are vulnerable?What areas of the country are vulnerable? What are the characteristics of the What are the characteristics of the
individuals and households that are individuals and households that are vulnerable?vulnerable?
What are the factors that are associated What are the factors that are associated with vulnerability?with vulnerability?
How will climate change impact on How will climate change impact on transmission?transmission?
What modifications can effect change?What modifications can effect change? How can community based interventions How can community based interventions
be encouraged and supported?be encouraged and supported?

SCENARIO DEVELOPMENTSCENARIO DEVELOPMENT
Proceed from macro to micro scale:Proceed from macro to micro scale: Identify key sectors and current Identify key sectors and current
conditionsconditions Identify data for dimensions of Identify data for dimensions of
current and future vulnerabilitycurrent and future vulnerability

Macro highlightsMacro highlights More than three decades of economic difficulties More than three decades of economic difficulties
with few sectors showing growth trends.with few sectors showing growth trends. Market problems for traditional exports. Inability Market problems for traditional exports. Inability
of domestic agriculture to compete with imported of domestic agriculture to compete with imported products.products.
Manufacturing sector buffeted by high interest Manufacturing sector buffeted by high interest rate policy and inability to retool.rate policy and inability to retool.
Social environment and international Social environment and international developments present challenges to tourism. developments present challenges to tourism. Large numbers but discounted rooms.Large numbers but discounted rooms.
High levels of unemployment is the most High levels of unemployment is the most significant and persistent labour market trends significant and persistent labour market trends (between 15 and 16 percent).(between 15 and 16 percent).

Macro Cont’dMacro Cont’d
High levels of inflation with High levels of inflation with devaluation and these have their devaluation and these have their greatest impact on the poor.greatest impact on the poor.
Poor performance of the economy Poor performance of the economy reflected in movements in the GDP.reflected in movements in the GDP.
High percentage of GDP (42 percent) High percentage of GDP (42 percent) goes toward debt repayment.goes toward debt repayment.

MOVEMENT IN GDP - JAMAICA
-2
-1
0
1
2
3
1991 1992 1993 1994 1995 1996 1997 1998 1999 2000 2001 2002
Years
GD
P

FOOD SECURITY AND POVERTYFOOD SECURITY AND POVERTY
There is a very sensitive and immediate There is a very sensitive and immediate relationship between economic shocks and relationship between economic shocks and food security (Table 1)food security (Table 1)

Table 1. Clinical Undernutrition (0 to 35 months) and Minimum Table 1. Clinical Undernutrition (0 to 35 months) and Minimum WageWage
YearYear Min. Wage as % of Min. Wage as % of Basket of FoodBasket of Food
Admission for Admission for undernutritionundernutrition
19781978 110110 140140
19801980 9898 168168
19821982 6262 170170
1984*1984* 3838 230230
1986*1986* 3636 380380
1988*1988* 5050 145145
19901990 4848 190190
1992**1992** 2020 310310
*removal of food *removal of food subsidiessubsidies
**devaluation**devaluation

•Despite unfavourable economic trends the level of poverty Despite unfavourable economic trends the level of poverty is decliningis declining
Figure 2: Percentage of persons in poverty in Jamaica, 1989 to 2001
05
101520253035404550
1989 1990 1991 1992 1993 1994 1995 1996 1997 1998 1999 2000 2001
year
%

Table 2 – Percentage below the poverty line -Table 2 – Percentage below the poverty line -JamaicaJamaica
Absolute poverty focuses on the ability of households to purchase the basket of food.Absolute poverty focuses on the ability of households to purchase the basket of food. The role of welfare provisions and remittances.The role of welfare provisions and remittances.
AreaArea 20002000 20012001
JamaicaJamaica 18.718.7 16.816.8
RuralRural 25.125.1 24.124.1
KMAKMA 7.67.6 9.99.9
Other TownsOther Towns 13.313.3 16.616.6

REMITTANCES 1990-2001 JAMAICA
0100200300400500600700800900
1990 1991 1992 1993 1994 1995 1996 1997 1998 1999 2000 2001 2002
Years

Vulnerability Data :Vulnerability Data :
-occupation-occupation
-lack of skills-lack of skills
-livelihoods at risk-livelihoods at risk
-welfare/remittances-welfare/remittances
-consumption patterns (food and non--consumption patterns (food and non-food)food)
-agricultural practices-agricultural practices
-marketing arrangements-marketing arrangements

HousingHousing
Unemployment and low wage affect Unemployment and low wage affect access to a range of basic services-access to a range of basic services-housing for example.housing for example.
The discrepancy between the growth in The discrepancy between the growth in the number of new households in the the number of new households in the period 1991 to 2000 (79, 700) and the period 1991 to 2000 (79, 700) and the growth in the housing stock (30, 308).growth in the housing stock (30, 308).
The cost of basic housing units puts them The cost of basic housing units puts them outside of the reach of the poor (Table 3)outside of the reach of the poor (Table 3)

Table 3-NHT Income Bands-Jamaica 1999 Table 3-NHT Income Bands-Jamaica 1999 (J$)(J$)
Nearly 82% earn less than J$3,000 per weekNearly 82% earn less than J$3,000 per week
Weekly Weekly incomeincome
<1, 100<1, 100 1, 1001 1, 1001 to to 2,0002,000
2,001 to 2,001 to 3, 0003, 000
3001 to 3001 to 4,0004,000
4001 to 4001 to 50005000
5001 to 5001 to 6,0006,000
>6000>6000
EmployedEmployed 257,907257,907 228,215228,215 121,780121,780 54,81254,812 31,75331,753 15,60215,602 25,11725,117
%% 34.634.6 30.630.6 16.316.3 7.47.4 4.34.3 2.12.1 4.74.7

Cost Profile of NHT Studio Unit (January 2001)Cost Profile of NHT Studio Unit (January 2001)NHT/Building Society Mortgage (J$)NHT/Building Society Mortgage (J$)
Purchase PricePurchase Price 1, 100,0001, 100,000Less Down-Payment Less Down-Payment 110,000 110,000
NHT Pari PassuNHT Pari Passu 990,000 990,000Building Society Loan 150, 000Building Society Loan 150, 000
Monthly RepaymentMonthly RepaymentNHT Loan (2% per annum) 3, 560.38NHT Loan (2% per annum) 3, 560.38Building Society Loan (14%) per annumBuilding Society Loan (14%) per annum 1, 805.65 1, 805.65Building InsuranceBuilding Insurance 363.97 363.97TotalTotal 5, 730.00 5, 730.00
Required Income Required Income 19, 100.00 per month19, 100.00 per month

Cont’dCont’d
The growth of informal housing and The growth of informal housing and associated unacceptable practices.associated unacceptable practices.
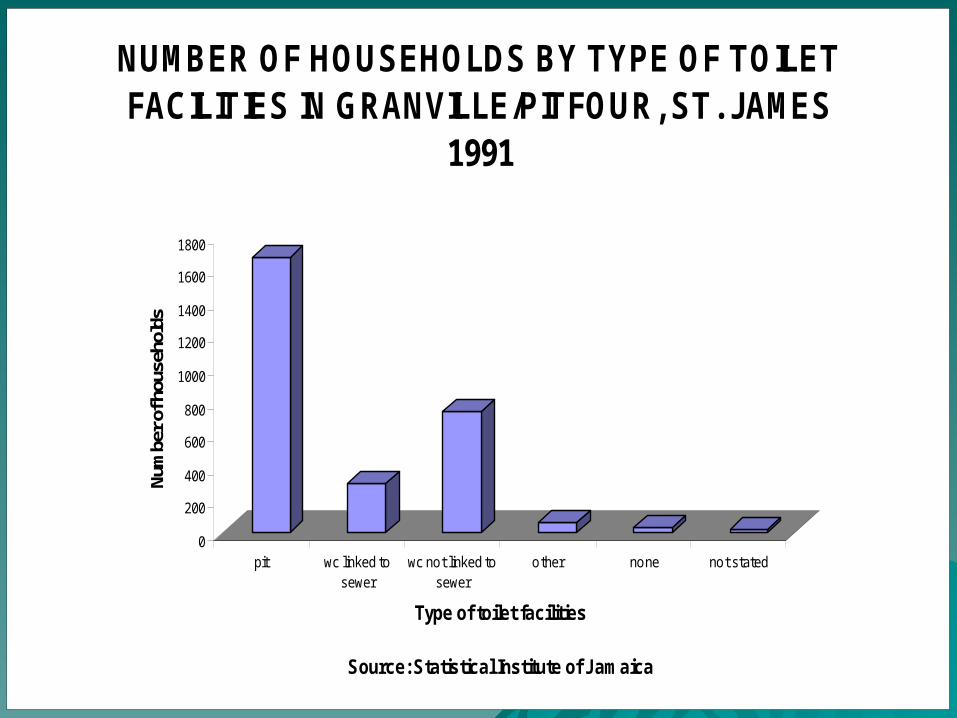
Fifty percent of households in the Fifty percent of households in the island have access to flush toiletsisland have access to flush toilets
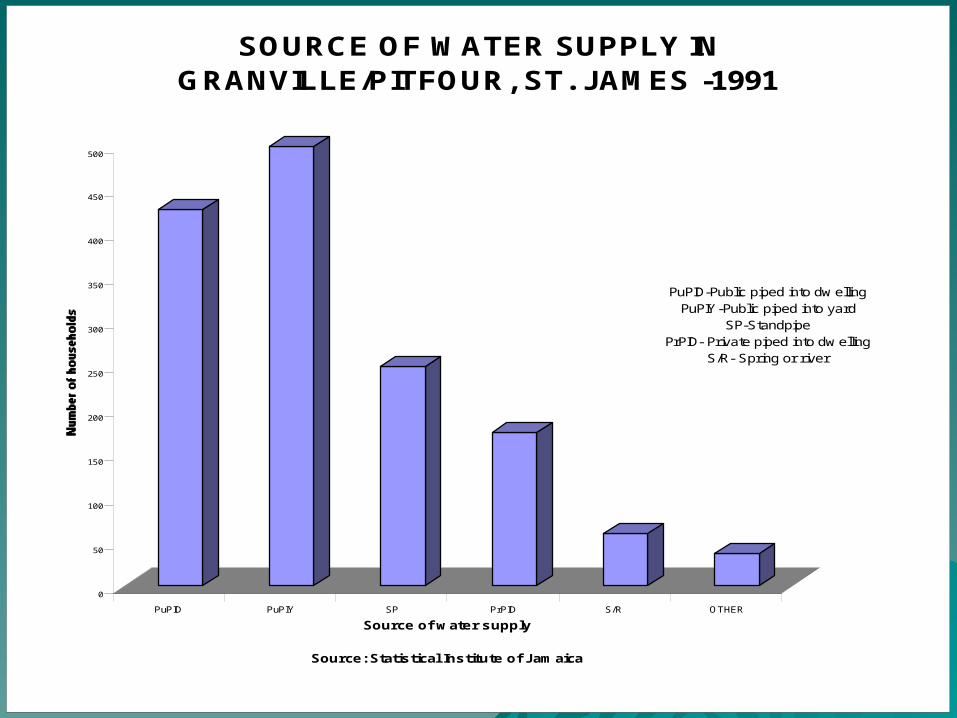
Seventy –one percent have access to Seventy –one percent have access to piped water (urban and rural piped water (urban and rural disparities) but in many cases, water disparities) but in many cases, water is piped into a common yard is piped into a common yard necessitating storagenecessitating storage

Vulnerability dataVulnerability data
-measure: access to piped water-measure: access to piped water
-types of storage-types of storage
-sewage disposal facilities-sewage disposal facilities
-household waste-household waste
-overcrowding-overcrowding

SETTING THE BOUNDARIES OF THE SETTING THE BOUNDARIES OF THE AREA TO BE STUDIEDAREA TO BE STUDIED
Inadequacy of data – numerical and Inadequacy of data – numerical and spatial.spatial.
Mapping of outbreaks to identify Mapping of outbreaks to identify spatial patterns.spatial patterns.
Selection of the parish of St. James Selection of the parish of St. James with 88 out of a reported 224 cases with 88 out of a reported 224 cases in 1998.in 1998.
Setting the boundariesSetting the boundaries


0100200
300400500600
700800900
shared not shared no facilities not stated
Number of households
Source: Statistical Institute of Jamaica
NUMBER OF HOUSEHOLDS BY AVAILABILITY OF TOILET FACILITIES IN GRANVILLE/PITFOUR, ST.
JAMES -1991
0
200
400
600
800
1000
1200
1400
1600
1800
Num
ber o
f hou
seho
lds
pit wc linked tosewer
wc not linked tosewer
other none not stated
Type of toilet facilities
Source: Statistical Institute of Jamaica
NUMBER OF HOUSEHOLDS BY TYPE OF TOILET FACILITIES IN GRANVILLE/PITFOUR, ST. JAMES
1991
0
50
100
150
200
250
300
350
400
450
500
PuPID PuPIY SP PrPID S/R OTHER
Source of water supply
Source: Statistical Institute of Jamaica
SOURCE OF WATER SUPPLY IN GRANVILLE/PITFOUR, ST. JAMES -1991
PuPID-Public piped into dw ellingPuPIY-Public piped into yard
SP-StandpipePrPID- Private piped into dw elling
S/R- Spring or river

0
50
100
150
200
250
300
350
400
shared not shared no facilities not stated
Number of households
Source: Statistical Institute of Jamaica
NUMBER OF HOUSEHOLDS BY AVAILABILITY OF TOILET FACILITIES IN JOHN'S HALL, ST. JAMES -
1991

0
100
200
300
400
500
600
700
1 2 3 4 5 6 7 andover
Notstated
Number of rooms
Source: Statistical Institute of J amaica
NUMBER OF HOUSEHOLDS BY NUMBER OF ROOMS OCCUPIED IN GRANVILLE/PITFOUR, ST.
JAMES -1991

050
100150200250300350400450500
Nu
mb
er
of
ho
us
eh
old
s
P it wc linkedto sewer
wc notlinked to
sewer
none notstated
Type of toilet facility
NUMBER OF HOUSEHOLDS BY TYPE OF TOILET FACILITIES IN JOHN'S HALL, ST.
JAMES - 1991

0
50
100
150
200
250
300
350
Num
ber
of
hous
ehol
ds
Stand P ipe P iped intodwelling
Spring or riverP iped into yard
Source of water supply
Source: Statistical Institute of Jamaica
SOURCE OF WATER SUPPLY IN JOHN'S HALL, ST. JAMES - 1991

0
50
100
150
200
250Nu
mbe
r of
ho
useh
olds
1 2 3 4 5 6 7 andover
Notstated
Number of rooms
Source: Statistical Institute of Jamaica
NUMBER OF ROOMS OCCUPIED BY HOUSEHOLDS IN JOHN'S HALL, ST. JAMES - 1991

ENDEND