vtscada operation & configuration · 2016-08-31 · exercise3-4practicewithalignmenttools 35...
TRANSCRIPT


Operation and Configuration Student WorkbookCopyright Trihedral Engineering Limited, 09/01/2014All rights reserved.
Printed in Canada
Trihedral Engineering Limited
HeadOffice1160 Bedford Highway, Suite 400Bedford, Nova ScotiaCanadaB4A 1C1
Phone: 902-835-1575Toll Free: 800-463-2783Fax: 902-835-0369
Support: [email protected]: [email protected]
Trihedral UK Limited
Glover Pavilion, Campus 3Aberdeen Science ParkBalgownie Drive, AberdeenUK, AB22 8GW
Phone: +44 (0) 1224 258910Fax: +44 (0) 1224 258911
Trihedral Inc.
Suite 1607380 Sand Lake RoadOrlando, FloridaUSA32819
Phone: 407-888-8203Fax: 407-888-8213
Contents
Preface viiCourse Objectives vii
1 An Introduction to VTScada 1A Historical Perspective 1Application Structure 2VTScada Connectivity Support 2Licensing 3Installing VTScada 4
2 Fundamentals 5Starting VTScada 5The VTScada Application Manager (VAM) 6Pages 8Page navigation 9
Tags 11Security 12Alarms 12Logged Data 13Historical Data Viewer (HDV) 13
Network Configuration 14Internet and Mobile Features 15Stopping an application 15Finding License and Version Information 16Getting Help 18
3 Developing VTScada Applications 20Adding New Applications 20
Exercise 3-1 Create a New Application 21Basic Navigation 22
Exercise 3-2 Navigate 22The Idea Studio 24
Exercise 3-3 Open the Idea Studio, Create a Page 26Drawing Objects 28Alignment Tools (While Drawing) 29Selection Tools 30Alignment Tools (After Placing) 33Change Size & Position by Dragging 34Match Sizes 34

Exercise 3-4 Practice with Alignment Tools 35Format and Properties 37Advanced Formatting. The Properties Dialog 39
Exercise 3-5 Experiment with the format tools. 41Images 41
Exercise 3-6 Create a background and highlight. 42Exercise 3-7 Import an Image 44
Widgets 45The Widgets Palette 46
4 Preparation for the Class Project 47OEM Layers - New Applications From Old 47The Communications Chain 48The Application 49
Exercise 4-1 Install the Simulator Layer 50Exercise 4-2 Create the Project Application. 51
5 Pages 53Page Properties 53
Exercise 5-1 Modify Page Properties 56Exercise 5-2 Create Pop-up Control Pages 57
Menu Customization 58Exercise 5-3 Add a New Menu Folder 60
Page Source Files 616 Tags 63Building the Communications Chain 63Ports 63Drivers 64The Polling Driver 64Monitoring Polling Drivers 65Site Pages for Polling Drivers 65How Long Since the Last Poll? 65Number of Stations Being Polled 65Fast versus Normal Polling 65
The Tag Browser 66Using the Tag Browser 66Add and Configure Tags 68
Exercise 6-1 Add Communication Tags 70Update Type 73
Context Tags 74Exercise 6-2 Create a Context Tag 75Exercise 6-3 Add a Polling Driver 76
Read Analog Values 77Exercise 6-4 Create Analog I/O Tags 78
Draw Widgets & Link to Tags 80

Exercise 6-5 Draw a Widget 81Exercise 6-6 Show Unlinked Widget Indicators. 82Exercise 6-7 Link a Widget to a Tag 82Exercise 6-8 Provide Context for a Widget 82Exercise 6-9 Practice with Widgets and Linking 83Exercise 6-10 Polling Drivers Reprise 83
Manual & Questionable Data 85Reusable Tags 86Simple Expressions 86
Exercise 6-11 Create a Context Tag with a Property 87Exercise 6-12 Monitor Well Depth 89Exercise 6-13 Draw the well 91
Define Your Own Animations 91Exercise 6-14 Animate Text Position 91
Exporting and Importing Tags 94Tags to Write Values 95Analog Control 95
Exercise 6-15 Write Alarm Setpoints 96Widgets for Analog Output 97
Exercise 6-16 Operator Controls for the Alarm Setpoints 98Exercise 6-17 Add Visual Feedback 100
Tags for Digital Values 102Widgets and Styles for Digital Tags 102
Exercise 6-18 Add a Valve to the Water Tower 103Create New Tag Types 107
Exercise 6-19 Define the Pump 108From Context to Type 112
Exercise 6-20 Turn the SupplyPump into a New Tag Type 112Exercise 6-21 Create a Second Pump 112Exercise 6-22 Add a Start Condition 113Exercise 6-23 Add a Second Well 113
7 CustomWidgets and Parametrized Pages 115Exercise 7-1 Create a New Widget 115
Linked Tag Properties 117Exercise 7-2 Use a Linked Tag Property 118
Parametrized Pages 119Exercise 7-3 Create a Parametrized Page 119Exercise 7-4 Create Pages for Pump Overview & Control 121
Pages Versus Widgets 124Exercise 7-5 Test Your Knowledge: The Pump Controls 125Exercise 7-6 Links to Control the Three Pumps 127
8 Alarms 130Guide to the Alarm Page 130

Add Alarms to Tags 132Trip Alarms vs. Level Alarms 135
Exercise 8-1 Create an Alarm Tag 135Exercise 8-2 Configure Alarms Built Into Tags 137
Add Alarm Management to Pages 139Exercise 8-3 Adding Alarm Management 140
9 The Alarm Notification System 142Roster Configuration 142Email and SMS-Text Notification 144Modems 145Setting Dialer Pronunciation 146Configuring Alarm Notification Options 146
Notification System Configuration 147Configuring a Modem Tag 148Configuring a Modem for Tag I/O 149Modem Diagnostics 150
9 Record Data From Tags 151Choosing What to Record 151Other Tags That Collect Data 153Totalizer Tags 153
Exercise 9-1 Logging Data 154Counter Tags 155
Exercise 9-2 Count Start/Stop Cycles 155History Statistics Tags 156
Exercise 9-3 Statistics from the Supply Valve 15710 System Monitoring Tools 159The Historical Data Viewer (HDV) 159Add a Mini HDV to a Page 161
11 Report Features 162Report Types: 162Output Formats 163Report Contents - Selecting Tags 163Setting the Report Time Period 164The Report Tag 164
12 The Privilege and Security System 166Activating Security 166Roles 168
Exercise 12-1 Activate Security and Create Accounts 169Save Time by Copying 169
Security Rules 170Application Privileges 170
Exercise 12-2 Application privileges and scope-limited rules 17213 VTScada on Multiple Workstations 175

Primary and Backup Servers 175Get an Application From a Workstation 176
Exercise 13-1 Get an Application From Another Workstation 178Distributing Services 178
14 VTScada and the Internet 181Configure a VTScada Internet Server 181Connecting as an Internet Client 185Using the Connection 186Security 187
Monitoring Connections 187Connect Using the Mobile Client 188
15 Version Control 190Automatic versus Manual Version Deployment 190Reviewing Version Changes 191Restore Versions 192Import File Changes 193ChangeSets. An Application in a File 194Create a Full ChangeSet 195Advanced ChangeSet Types 196
Maintain the File Manifest 19716 Sites and Site Maps 198
Exercise 16-1 View a Sites Page 19817 Bonus Topics 201More Tags to Know 201Glossary 206Index 208Notes 210Notes 211Notes 212

PrefaceWelcome to Trihedral’s VTScada training program.This workbook will follow the course topics, providing reference information andexercises. Space has been left for you to add notes; please feel comfortableabout writing in this book.Throughout the course, you will have an opportunity to practice each topic as it istaught. The exercises are intended to give you a feel for the capabilities ofVTScada and how its features can be applied to real-life situations.Please ask questions. It often turns out that the best parts of a course are the dis-cussions that follow on from a good question. Don’t be shy about asking yours.
Course Objectives
Given the size andpower of VTScada, it canbe difficult to cover allthe features within thetime available for thiscourse.Bonus topics have beenincluded at the end ofthis workbook to provideextra coverage ofadvanced topics.Depending on studentinterest, some of thesetopics may be discussedduring the course, orthey may be left for thosewho are interested tostudy at a later date.
This course is designed for VTScada developers. Atthe end of the week you will know how to build aVTScada application from start to finish.A good application is one that not only does whatit’s supposed to, but is also intuitive for operators touse. With that in mind, the course begins with anoverview of VTScada from an operator’s point ofview.
While many developers never move on to writingVTScada script code, some of the tools designed forprogrammers do prove to be quite handy for applic-ation development. The course will finish with anoverview of VTScada programming so that youlearn how to enhance your applications with expres-sions and calculation tags.Experience has shown that people learn best bydoing. Most of the course will be conducted byexample and exercise. These notes are provided togive you a reference to the various topics covered inclass and to add additional background information where useful.
A few notes about this course:A folder named “Students” should have been copied to your computer at thebeginning of the course. Several exercises will require files that have been

provided here. Take a moment now to locate this folder, which will be found eitheron your desktop, or under C:\Students.
You will be given a full copy of the latest version of VTScada and a license keythat has all features enabled. This is a "trial" license - good only for a limited num-ber of days. It will also cause VTScada to shut down after a few hours. You canre-start immediately and continue from where you left off. The automatic shutdownonly ensures that the trial license cannot be used for anything but a trial.
Exercise instructions are numbered. Where the course notes describe the steps ina process, letters are used instead of numbers, so as to avoid confusion with exer-cises.

1 An Introduction to VTScadaBefore learning how to create VTScada applications, it’s helpful to understandjust what VTScada is, where it came from and what it can be used for.
VTScada was created to provide a set of robust monitoring and control tools thatare used in offshore drilling platforms, water treatment plants, ships, breweries,hydro electric power generation plants, etc. around the world.
Inside VTScada you will find easy-to-use tools for application developers and apowerful scripting language for programmers.With these, you can represent the equipment in your operation in whatever waymakes sense to you. Alarms can be configured, data logged for use in reports,and statistics collected. Remote operators can view equipment status and canacknowledge alarms via telephone, email or SMS text message.You can use the built-in station tags to add new Multitrode® or MPE® stations inminutes instead of hours. You can also create your own station tags comprisingdozens or hundreds of I/O addresses, alarms, data loggers, etc., then re-use theseto add and commission new equipment almost automatically.
A Historical PerspectiveThe program now known as VTScada was originally named WEB. This wasprimarily a scripting program with fairly basic graphics capabilities. Tags, pages,and all the SCADA features of an application were built using the scripting lan-guage.As the program grew and acquired a graphical user interface to make applicationdevelopment easier, it was renamed to Visual Tag System (VTS).In 2001, a layer named VTScada was added, for water and wastewater applic-ations. VTScada was designed specifically to communicate with telemetry sys-tems. With the release of Version 11 at the beginning of 2014, VTS and VTScadahave been fully merged into a single product, known as VTScada.
What all of this means to you is that, for all the graphical user interface featuresthat have been added, VTScada is still very much based on a scripting program.In fact, we’re rather proud of the fact that VTScada is written primarily in the
1

Chapter 1
VTScada language. If you learn how to program in this language, you will havethe ability to modify and expand applications to work to your liking.
Application StructureVTScada is based on a system of layers. Your applications can be built on top ofthe VTScada library layer, or on top of another application (referred to as an OEMlayer or OEM application). Layers are applications and applications are layers,but it's easier to refer to the top-most layer as the application that you run, and theunderlying applications as the layers that your application is built upon.
Each layer can add new tags, pages, drivers, reports or other customized featuresto enhance later applications. Note that, while features from underlying layers arevisible in, and can be used in your application, their code remains in the under-lying layer. This means two things to you:
l Changes must be made in the layer where the code defining the feature isfound. (Certain exceptions apply.)
l If you distribute your application to another location, you must also send theunderlying layers.
VTScada Connectivity SupportBuilt-in Communication DriversVTScada is able to communicate with a large number of I/O devices. Trihedralhas developed over 100 I/O drivers that enable VTScada to interface with I/Odevices. Standard with VTScada are the following drivers:
Allen-Bradley CalAmp Diagnostic
DDE DNP3
MDS Diagnostic Modbus Compatible
Omron OPC Client and Server
Siemens S7 SNMP
Serial PortsSerial ports enable you to connect an I/O device to your PC to share data. Theseare most often used for modems, but may also be used to connect a controller toyour workstation.
-
2 • Operation and Configuration Student Workbook

1 An Introduction to VTScada
TCP/IP and UDPVTScada uses TCP/IP extensively for networked systems and remote con-figuration. UDP is also available.
ODBCOpen Database Connectivity - Enables access to the data within any application,regardless of which database management system is handling the data. If yourdatabase is ODBC-compliant, VTScada can link to it.
DLLsDynamic Link Libraries – In short, DLLs allow VTScada to access functions writ-ten in another programming language.
DDEDynamic Data Exchange – Allows data exchange between two different applic-ations. For example, you can input a value into a cell of an Excel spreadsheet,and the value will be transmitted to a tag specified in a VTScada application. Con-versely, you can write the value of a tag to a cell of an Excel spreadsheet.
LicensingThere are a variety of VTScada license levels available. Customers can choosewhichever version and options best meet their needs. Note that the developmentlicense includes the features Application Version Control, the OPC server, theODBC server and WEB services.
l Full Development version (varying tag limits available)l Run Time only versionl Number of allowed Internet Client connectionsl VTScada Alarm Notification Systeml ODBC Serverl WAP Serverl Web Servicesl OPC Serverl Application Version Control (Not available with the Run Time license)l Remote Configurationl Redundancy Capabilityl Server Capability
Operation and Configuration Student Workbook • 3

Chapter 1
Installing VTScadaThere are two versions of the VTScada installation program. Customers whohave purchased the Alarm Notification System option must run the full installation,which includes the IVONA™ voice module. Others may install the basic version.While the full installation's file size is considerably larger than the basic version's,the only difference is the presence or absence of the IVONA™ engine.
The installation program requires a 25-character key that will control your tagcount and which options of VTScada will be available in the installation.
You may install VTScada into any directory, but C:\VTScada is recommended.You must be logged in with administrative privileges on your computer in order tosuccessfully run the installation program.
-
4 • Operation and Configuration Student Workbook

2 Fundamentals
2 FundamentalsWhile your main concern as a developer will be to create an application thatworks, you should also take care to design it to be easy for an operator to use.Ideally, the screen display should resemble the actual system, with clear andeasy-to-read controls.
Visual Design Goals:
Avoid confusionGroup related elementsProvide clear navigationVerify control actions
Figure 2-1 Station monitoring screen
VTScada provides all the tools you need to build good control and monitoringapplications.
Starting VTScada
Place the VTScada short-cut in your Startup folderso the program startsautomatically.
The initial animation iscontrolled by a Setup.INIproperty: NoSplash.
VTScada is normally started either from the StartMenu, or from a shortcut on the desktop.
You have the option to configure your application sothat it starts immediately whenever VTScada is star-ted. This can be very useful in a situation where thecomputer is to be used only for monitoring yourapplication and you don’t want to give the operator achance to play solitaire.
Operation and Configuration Student Workbook • 5

Chapter 2
The VTScada Application Manager (VAM)The VTScada Application Manager (VAM) is your starting point. After creating anapplication, you may want to configure VTScada to start that application auto-matically, without needing to use the VAM.
Figure 2-2 The VAM
Many operators will neversee the VAM.
All of the tools here are forthe creation and generalconfiguration of applic-ations.
Plus, a few utility apps. forVTScada programmers
The Application ListThese are the applications that you may want torun. There is no need to include all of the applic-ations that exist on your workstation. For example,many of utility applications that come withVTScada are not shown in the list.
You can do the following with the list:l Re-organize the list by dragging the bars upand down.
l Access the application's controls by clickingonce on a bar.
l At a glance, see which applications are running by noting the color of theassociated running light.
-
6 • Operation and Configuration Student Workbook

2 Fundamentals
The Application ControlsClick once on an application to expand it in the VAM. This will give you access tothe buttons used to control that application. From left to right, these are:
RemoveRemove the application from the list. Deleting it altogether isoptional.
ApplicationConfiguration
Access to large range of configuration options.
Import FileChanges
Allows you to bring the changes that you have made to sourcefiles into the application's set of working files.
RunStarts an application. Note that you can also start an applic-ation by double-clicking on its bar in the VAM.
Stop Stops an application.
The VTScada ControlsThe 6 buttons along the base of the VAM are for tasks that don't (necessarily)relate to any particular application. From left to right, these are:
Add ApplicationWizard
You can start from scratch or add an existing applicationto the VAM's list.
VTScada InternetClient / Server Setup
For configuring the VTScada Internet Server(VTScada/IS), to allow VIC connections.
HelpOpens the main portal to the VTScada user guide. Userscan also press F1 at any time for context-sensitive help.
Color ThemesChange the appearance of the VAM. This will carry intoany application that does not have its own color theme.
About VTScadaDisplay the version number and the list of featuresincluded in your VTScada license.
ExitEnd all running applications and terminate the VTScadasession.
Organize the Application ListYou can organize the list of applications to suit yourself. Four useful techniqueswill help you with this:
Operation and Configuration Student Workbook • 7

Chapter 2
Drag and drop. To re-order the list, drag applications up or down to new loc-ations.Hide applications. Use the trash can icon to hide applications that you are notusing. You don't have to delete them.Add place-holder applications. Developers who have many applications tokeep track of will create a few with names such as "---------". These are never run;their only purpose is to serve as a visible divider in the list.Change the icon and color theme. Adjust the application's properties so that ithas its own theme color and representative image.
PagesThe screens, upon which information is shown, are called pages. The whole pointof a page is to display information from the system, to the operator, in a way that isclear and concise.
Figure 2-3 Example Page
A wide variety of tools are available to display system information. The exampleshown here includes a numeric display of run-time hours, a visual indicator ofwhich pump is running and a set of page-change buttons. This is a very smallsampling of the display tools available.
From an operator’s perspective, one of the most important things about an applic-ation is how easy it is to find the important bits. Careful selection of the mostappropriate indicators and clear, uncluttered spacing can make the differencebetween whether the application is usable or not.By linking to analog or digital outputs, an application can also control a system,allowing manual control of pumps, valves, motor speeds, etc.
VTScada provides a number of tools to help you build your pages:l Page configuration. This is the name, color, background image, size, titlebar, etc.
-
8 • Operation and Configuration Student Workbook

2 Fundamentals
l Static display components. Images of pipes, equipment, geometric shapes.Anything that provides context to the information being displayed on thescreen so that operators easily understand what they're looking at and howit connects to the system.
l Dynamic display components. Lights and color-codes to indicate whetherequipment is on or off. Numeric readouts. Animated level fluid levels, turn-ing motors, changing text, etc.
l Operator control elements. Buttons, switches, selection lists, etc.
Page navigationMost applications are far too complicated to be shown on a single page.VTScada allows you to build multi-page applications, with controls groupedtogether in whatever way makes the most sense. A water treatment system, forexample, might include a page showing an overview, a page for a booster sys-tem, a page for a chlorination system, etc.VTScada provides several ways to move from one page to another:
l A menu in list format, (which you create and organize) can list all the pagesin one place, grouped by use.
Figure 2-4 List Menu
l A tiled menu. Matching the organization of the list menu, this shows pre-views of pages.
Operation and Configuration Student Workbook • 9

Chapter 2
Figure 2-5 Tiled Menu
By using folders, you can create displays that show mini-versions of severalpages simultaneously. Previews are live or not, depending on how much inform-ation there is to show on one screen. Control tools do not operate within tiles, buta click on the tile will navigate to that page, where the controls tools will work (sub-ject to security privileges).
l Page names may be pinned to the Page Navigation Bar, across the bottomof the screen. This makes it possible to find and open frequently-usedpages with a single click.
Figure 2-6 Pinned page-links
l Hot boxes and Hot buttons may be placed within a page, providing quicklinks to other, related pages. Two common uses for hotboxes are to providea link to a detail page from an overview page, and to open a dialog box-style page containing the controls for equipment.
Figure 2-7 Page Hotbox
-
10 • Operation and Configuration Student Workbook

2 Fundamentals
l A shortcut for stepping backward or forward through the history of pages youhave viewed, is provided in the upper left corner of the screen. The left andright arrows step back or forward through your page viewing history.
Figure 2-8 Recent page list
TagsTags are the SCADA representation of physical objects.They provide configuration options so that one type of tag, perhaps an AnalogStatus, can be used to represent many different types of objects in the real world:a temperature reading, pressure in a tank, speed of a motor, etc.
Figure 2-9 Communication details
In many systems, consistency is crucial to save time and money. By using com-mon equipment, and configuring the equipment in a consistent way from one siteto another, you reduce installation, training and maintenance costs.The same is true of the tags in your SCADA system. Having designed a tag struc-ture to represent equipment in one installation, you should be able to re-use thatstructure for another with minimal effort for configuration, and without having to re-draw all of the screen components from scratch.
Operation and Configuration Student Workbook • 11
Chapter 2
VTScada allows you to build your tags in structures that represent real-worldassets. This makes it easy to add new assets, since you can copy existing tagstructures.
Security
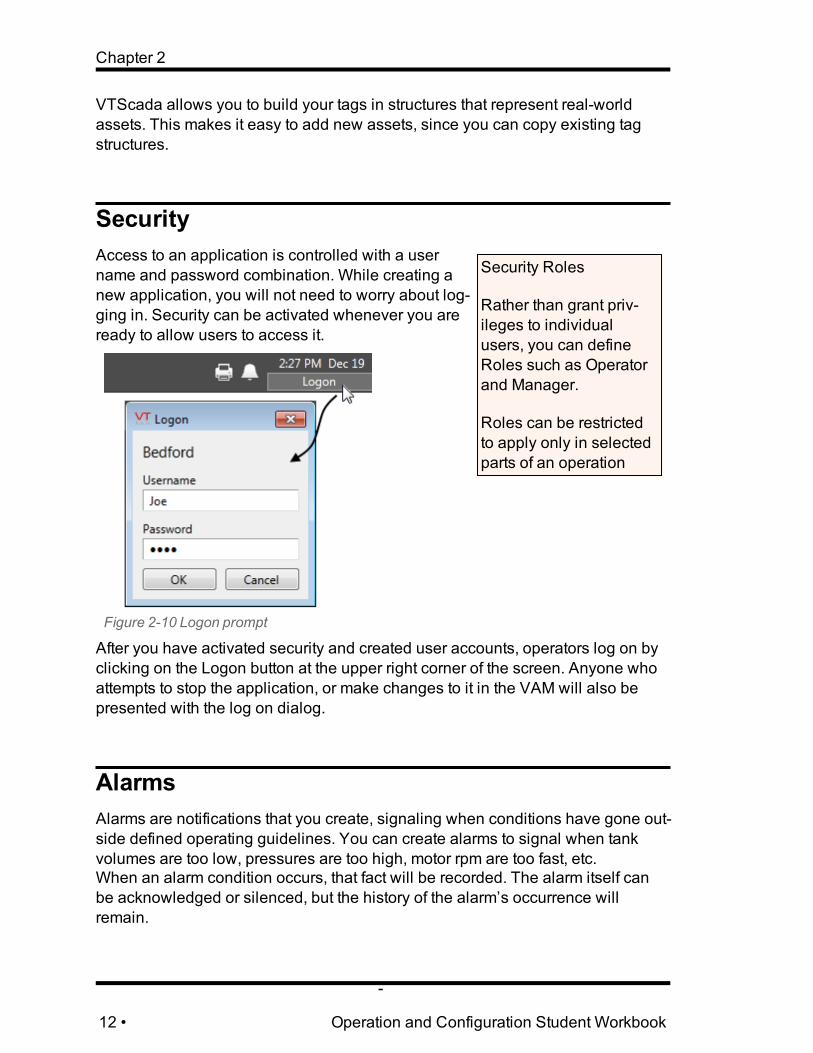
Security Roles
Rather than grant priv-ileges to individualusers, you can defineRoles such as Operatorand Manager.
Roles can be restrictedto apply only in selectedparts of an operation
Access to an application is controlled with a username and password combination. While creating anew application, you will not need to worry about log-ging in. Security can be activated whenever you areready to allow users to access it.
Figure 2-10 Logon prompt
After you have activated security and created user accounts, operators log on byclicking on the Logon button at the upper right corner of the screen. Anyone whoattempts to stop the application, or make changes to it in the VAM will also bepresented with the log on dialog.
AlarmsAlarms are notifications that you create, signaling when conditions have gone out-side defined operating guidelines. You can create alarms to signal when tankvolumes are too low, pressures are too high, motor rpm are too fast, etc.When an alarm condition occurs, that fact will be recorded. The alarm itself canbe acknowledged or silenced, but the history of the alarm’s occurrence willremain.
-
12 • Operation and Configuration Student Workbook

2 Fundamentals
Alarm notifications are primarily displayed in the upper right corner of the screen.A flashing red icon and an audible two-tone warning are the first indications thatan alarm has occurred. In addition, you can create visible indicators that will dis-play within the page to indicate where in the system an alarm is occurring. Pop-ups can be created to force operators to acknowledge critical alarms.Also, the alarm history can be displayed within any page, showing the details ofany alarms that occur. VTScada also provides an alarm dial-out feature thatallows the system to send spoken alarm message to the telephone of an off-siteoperator.Alarms are managed with the Alarm Page – a standard page in any VTScadaapplication. On this page, any operator (possessing sufficient security rights) mayreview, acknowledge or silence alarms.
Figure 2-11 Alarm page detail
Logged DataInformation can be collected from tags and saved. This logged data can then beused to create trend graphs and reports.VTScada stores information using a proprietary data storage format, which hasbeen designed for maximum reliability. You have the option of using a third partdatabase such as Oracle® or MS SQL Server®, but you should be cautious aboutthe extra system requirements. The VTScada storage format has the advantage ofhaving been designed for a single purpose: the storage and retrieval of VTScadadata.
Historical Data Viewer (HDV)The main tool for reviewing data is the Historical Data Viewer. You can adjusteither axis of the graph to suit your needs, whether that’s to decrease the verticalrange being displayed or altering the amount of time visible on the graph at anymoment.
Operation and Configuration Student Workbook • 13
Chapter 2
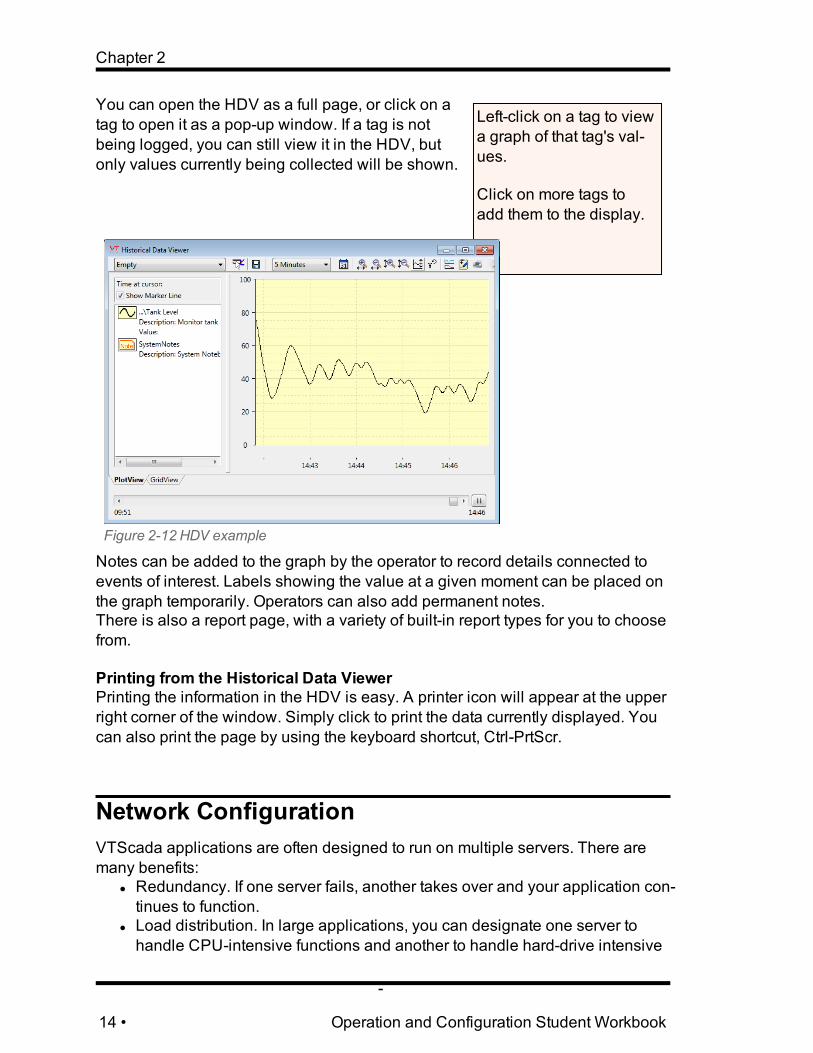
Left-click on a tag to viewa graph of that tag's val-ues.
Click on more tags toadd them to the display.
You can open the HDV as a full page, or click on atag to open it as a pop-up window. If a tag is notbeing logged, you can still view it in the HDV, butonly values currently being collected will be shown.
Figure 2-12 HDV example
Notes can be added to the graph by the operator to record details connected toevents of interest. Labels showing the value at a given moment can be placed onthe graph temporarily. Operators can also add permanent notes.There is also a report page, with a variety of built-in report types for you to choosefrom.
Printing from the Historical Data ViewerPrinting the information in the HDV is easy. A printer icon will appear at the upperright corner of the window. Simply click to print the data currently displayed. Youcan also print the page by using the keyboard shortcut, Ctrl-PrtScr.
Network ConfigurationVTScada applications are often designed to run on multiple servers. There aremany benefits:
l Redundancy. If one server fails, another takes over and your application con-tinues to function.
l Load distribution. In large applications, you can designate one server tohandle CPU-intensive functions and another to handle hard-drive intensive
-
14 • Operation and Configuration Student Workbook

2 Fundamentals
operations. You can even spread one function, such as data logging, acrossmultiple servers.
l Continuous, automatic backups. This refers to both configuration and data.Rather than creating a backup at set intervals, you can simply leaveVTScada to do the work of continuously maintaining copies of your applic-ation design and logged data across multiple servers. If one server fails, oth-ers continue to collect and maintain data. When you bring a failed serverback online, there is no need to manually restore data from an old backuptape - VTScada will automatically synchronize with it.
While VTScada’s networking features are both powerful and robust, it is sur-prisingly simple to configure a basic structure.
A. Install a licensed copy of VTScada on another computer on your network.B. Tell that computer to get the application from an existing server.C. Add the new computer's name to the list of servers.D. Done.
Internet and Mobile FeaturesOperators are not always at a desk when they need to monitor a system, acknow-ledge alarms or perform control actions. With VTScada, you can configure aninternet server thereby:
Proper port configurationis important for these fea-tures, especially if yourserver is also used forother internet services,such as a web-server orSkype™
l Allowing operators to use the application overan Internet connection, without needing toinstall VTScada at the remote computer.
l Allow operators to see a simplified version ofthe application on a mobile device, viewingdata, acknowledging alarms and issuing con-trol actions.
l Receive and acknowledge alarms via email.l Receive and acknowledge alarms via SMStext message.
Stopping an applicationUse the red stop button in the VAM to stop a VTScada application – you’ll find theVAM still running in the background behind your application. After security hasbeen enabled, only authorized operators may stop a running application.
Operation and Configuration Student Workbook • 15
Chapter 2
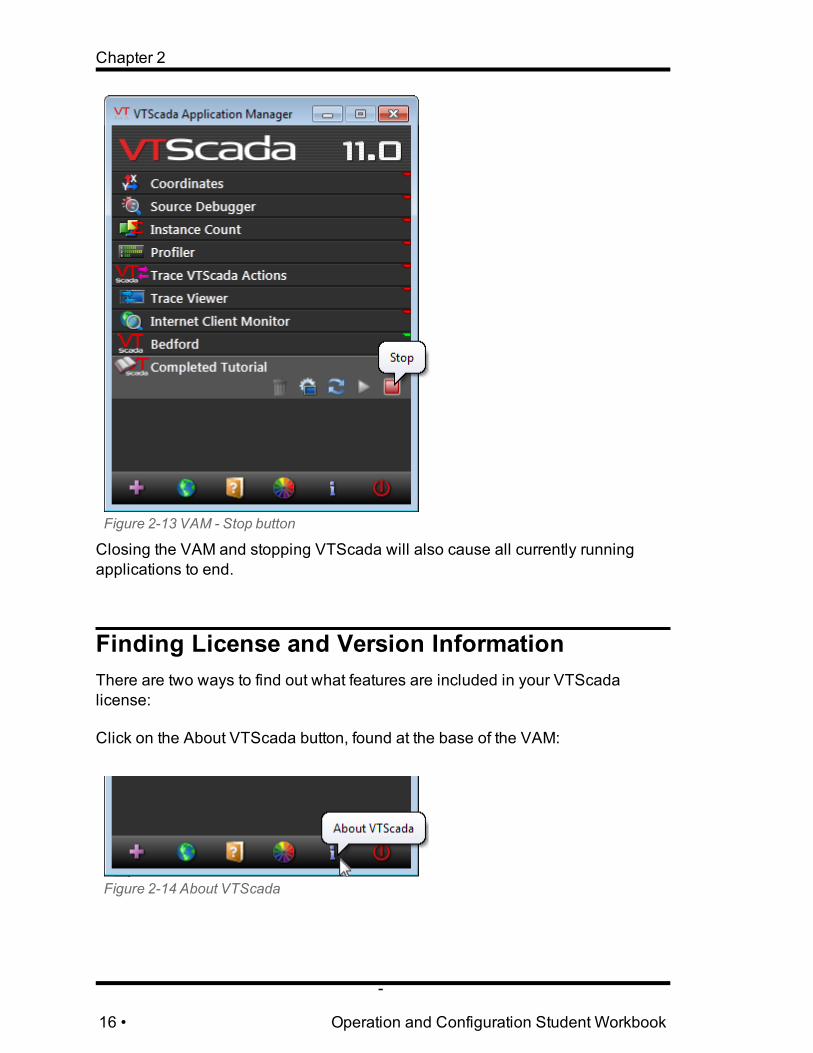
Figure 2-13 VAM - Stop button
Closing the VAM and stopping VTScada will also cause all currently runningapplications to end.
Finding License and Version InformationThere are two ways to find out what features are included in your VTScadalicense:
Click on the About VTScada button, found at the base of the VAM:
Figure 2-14 About VTScada
-
16 • Operation and Configuration Student Workbook
2 Fundamentals
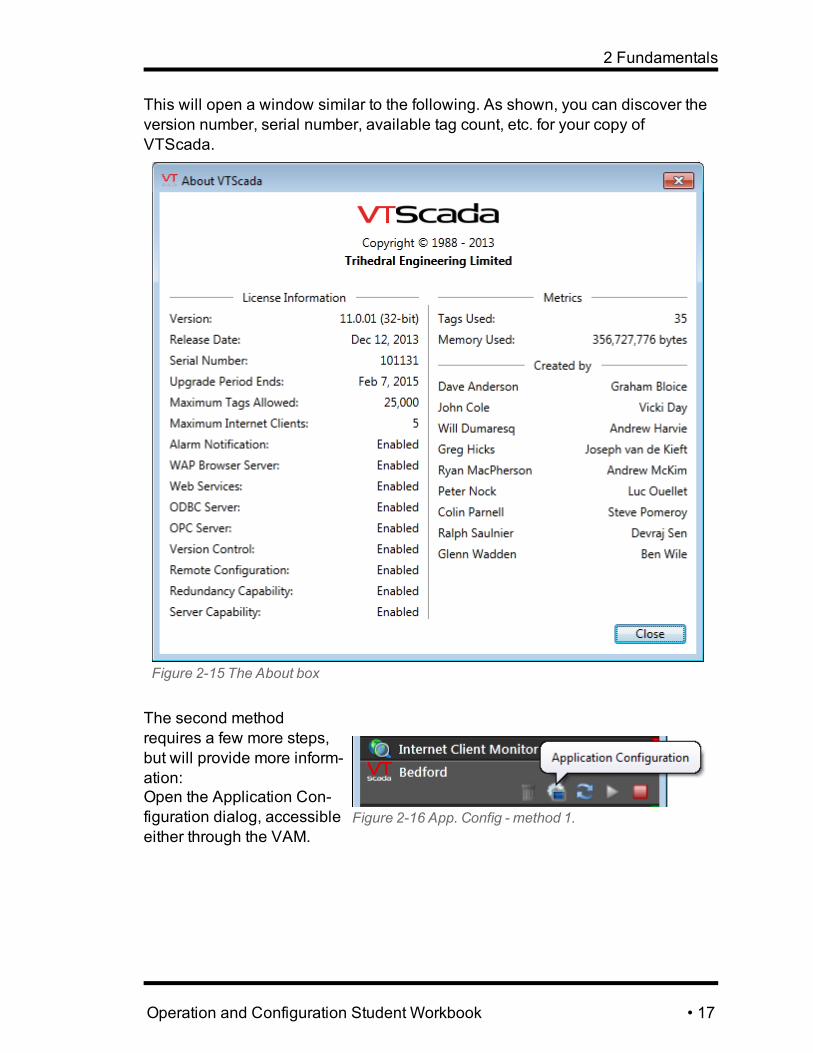
This will open a window similar to the following. As shown, you can discover theversion number, serial number, available tag count, etc. for your copy ofVTScada.
Figure 2-15 The About box
Figure 2-16 App. Config - method 1.
The second methodrequires a few more steps,but will provide more inform-ation:Open the Application Con-figuration dialog, accessibleeither through the VAM.
Operation and Configuration Student Workbook • 17
Chapter 2
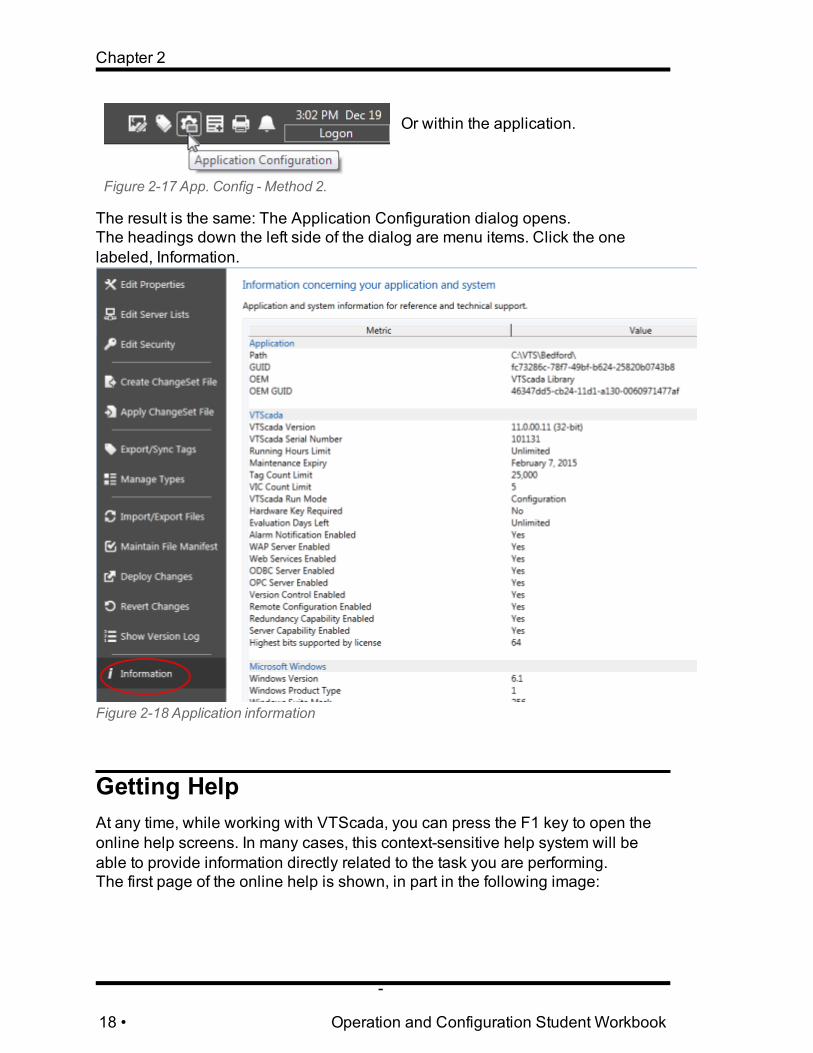
Figure 2-17 App. Config - Method 2.
Or within the application.
The result is the same: The Application Configuration dialog opens.The headings down the left side of the dialog are menu items. Click the onelabeled, Information.
Figure 2-18 Application information
Getting HelpAt any time, while working with VTScada, you can press the F1 key to open theonline help screens. In many cases, this context-sensitive help system will beable to provide information directly related to the task you are performing.The first page of the online help is shown, in part in the following image:
-
18 • Operation and Configuration Student Workbook

2 Fundamentals
Figure 2-19 The VTScada help files
The chapters are organized by role for operators, administrators, developers andprogrammers.
The search will find all instances of a term, returning the results in the order thatseems most likely. Snippets from each topic are included in each search result tohelp you decide which topic to view.
Operation and Configuration Student Workbook • 19

3 Developing VTScada Applications
3 Developing VTScada ApplicationsAs with everything, the better the plan, the better the result. When starting out tobuild a VTScada application, take time to consider the following:
l Do you have a list of the hardware specifications including the networkdetails, the communications protocol that will be used, and the list of I/Oaddresses?
l Do you have a list of what information needs to be logged for reporting?l What will constitute an alarm condition? Who should be notified in the eventof one?
l Have you made a set of sketches, to plan what you want the application tolook like?
l Do you have access to an OEM layer (VTScada application) that providesindustry-specific tags, drivers and other tools?
l Will you use primary and backup servers to ensure that the applicationnever stops? Running an application on multiple workstations is also thebest way to ensure that your data is continuously backed-up.
l In a very large application, you may want to designate different servers fordifferent VTScada services.
l Will you allow operators to connect from remote locations, using an Internetbrowser, or a mobile device?
Once your plan is in place, the next step is to add a new application to the VAM.
Adding New ApplicationsThe button for creating new applications is named Add Application Wizard. Itdoes more than that though: you can also use it to add existing applications to theVAM, whether they come from an application directory, a ChangeSet file, or aworkstation.
Figure 3-1 Add ApplicationWizard
Operation and Configuration Student Workbook • 20
Chapter 3
The first decision after clicking the Add button is whether to use the Quick Addoption, or the advanced option set. If you don't have an OEM layer to build upon,and are not getting an existing application from a workstation or ChangeSet file,then use the Quick Add. It will give you a chance to create a name for your newapplication, then build it using the VTScada library layer as the foundation.The following exercise will take you through the process.
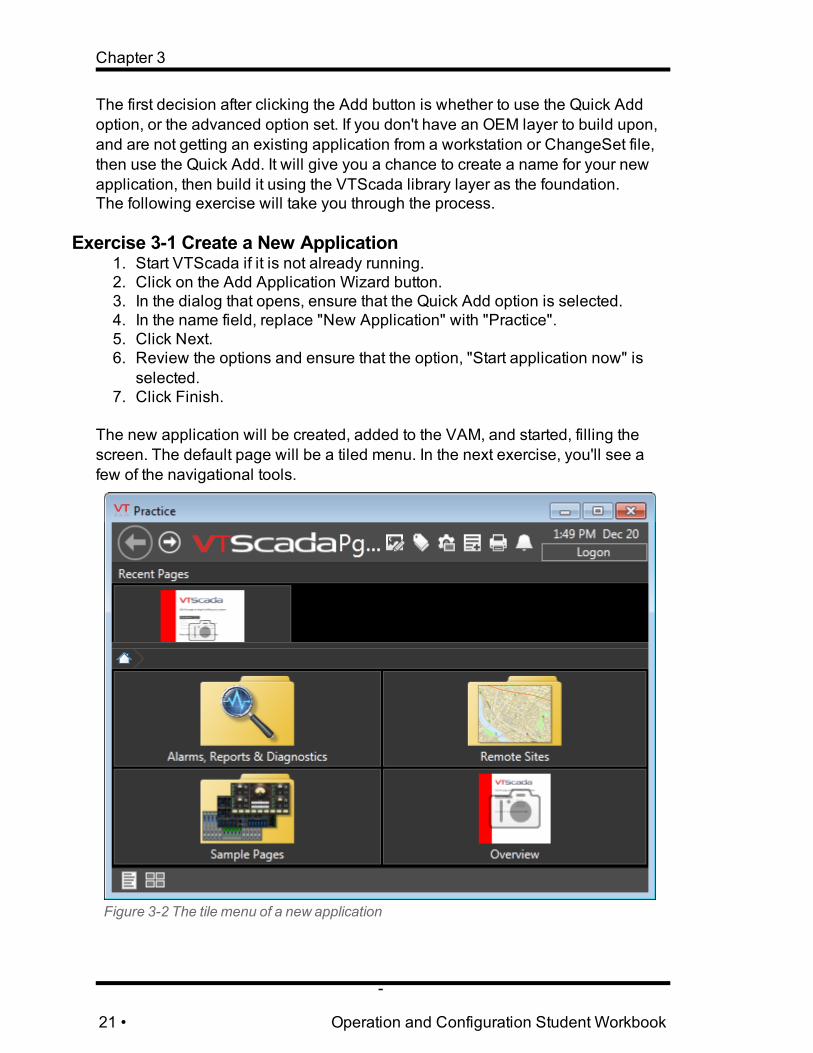
Exercise 3-1 Create a New Application1. Start VTScada if it is not already running.2. Click on the Add Application Wizard button.3. In the dialog that opens, ensure that the Quick Add option is selected.4. In the name field, replace "New Application" with "Practice".5. Click Next.6. Review the options and ensure that the option, "Start application now" is
selected.7. Click Finish.
The new application will be created, added to the VAM, and started, filling thescreen. The default page will be a tiled menu. In the next exercise, you'll see afew of the navigational tools.
Figure 3-2 The tile menu of a new application
-
21 • Operation and Configuration Student Workbook

3 Developing VTScada Applications
Basic NavigationThe initial tile menu presents several interesting options to explore. Until youhave built the application, there will be no alarms to acknowledge, reports to reador remote sites to visit, but you can still make use of the pages that exist in orderto learn how to use the navigational tools in VTScada.
In this chapter, you will learn by doing. By the end of the following exercise, youwill know how to use the list menu, tile menu, page history, and pinned page but-tons.
The application created in the last exercise should be running, and you should belooking at the tile menu, showing three folders and the Overview page.
Exercise 3-2 Navigate1. Click the Overview page. (Look for the red edge and VTScada logo.)
The Overview page opens, filling the screen.2. Click the Previous Page button.
Figure 3-3 Previous Page button - top left of the screen
You are returned to the tile menu, but now Overview shows up in the list ofrecent pages.
3. Click the Sample Pages tile.It will take a moment for these to load, since the sample pages have a lot ofgraphics. The dials and gauges move because they are linked to a built-insimulator that generates a sine wave. This gives widgets a realistic lookuntil you're ready to link them to real tags.
4. Open Dashboard 1.
Figure 3-4 ShowUnlinkedWidgets
Note the blinking "broken link" symbol in thetitle bar. This is both an indicator and a buttonthat you can click. As a blinking orange indic-ator, it warns you that the display contains wid-gets that are not currently linked to any tag otherthan the simulator, and therefore are not show-
ing real data. You can click this button to toggle between the general warn-ing and a specific warning shown on each unlinked tag.
5. Click the Show Unlinked Widgets button.6. Click Yes in the dialog that opens, to confirm the action.
Now, a warning is shown on every tag that doesn't have a link. As you build
Operation and Configuration Student Workbook • 22
Chapter 3
your application, this will be useful in helping you spot unlinked widgets. Atthe moment, nothing has a link, therefore you will change the warning backto the way it was.
7. Click the Show Unlinked Widgets button a second time, and confirm theaction.
8. Explore the other two Dashboard pages.You will learn everything you need to create user interface displays likethese during this course.
9. Click the Page Menu button (list menu), at the bottom left corner of thescreen.
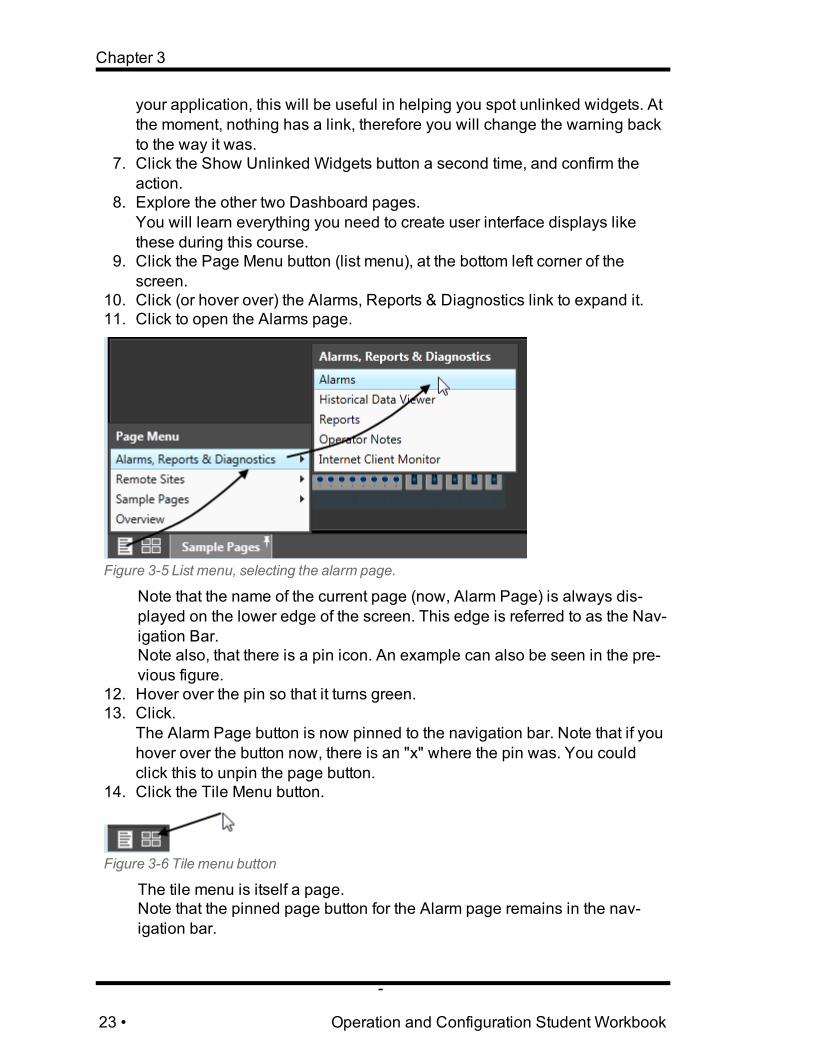
10. Click (or hover over) the Alarms, Reports & Diagnostics link to expand it.11. Click to open the Alarms page.
Figure 3-5 List menu, selecting the alarm page.
Note that the name of the current page (now, Alarm Page) is always dis-played on the lower edge of the screen. This edge is referred to as the Nav-igation Bar.Note also, that there is a pin icon. An example can also be seen in the pre-vious figure.
12. Hover over the pin so that it turns green.13. Click.
The Alarm Page button is now pinned to the navigation bar. Note that if youhover over the button now, there is an "x" where the pin was. You couldclick this to unpin the page button.
14. Click the Tile Menu button.
Figure 3-6 Tile menu button
The tile menu is itself a page.Note that the pinned page button for the Alarm page remains in the nav-igation bar.
-
23 • Operation and Configuration Student Workbook
3 Developing VTScada Applications
15. On your own, add a pinned page button to the navigation bar for the Over-view page.
The Alarm Page is one of the most important in any application, thereforeVTScada gives you a permanent link to it.16. Click the alarm icon in the title bar.
The alarm page reopens.17. Click and hold the Previous Page button in the title bar.
A list opens of recently-visited pages. This differs from the "Recent Pages"list in the tile view because it contains a history of recent pages, includingrepeat visits.
18. Click the Overview Page entry in the list of previous pages.
This concludes the exercise. You should now be able to find your way from onepage to another, given the name of a page to open.
The Idea StudioApplications are built using a combination of tags, widgets and graphic elements.
l Tags are the VTScada representation of physical objects, as monitored orcontrolled by your PLC or RTU.
l Widgets are the animated representations of those objects.l Graphic elements are the images and shapes that provide context for thewidgets.
Tags are created using the Tag Browser, which you will see in a later chapter.Everything else is created using the Idea Studio.
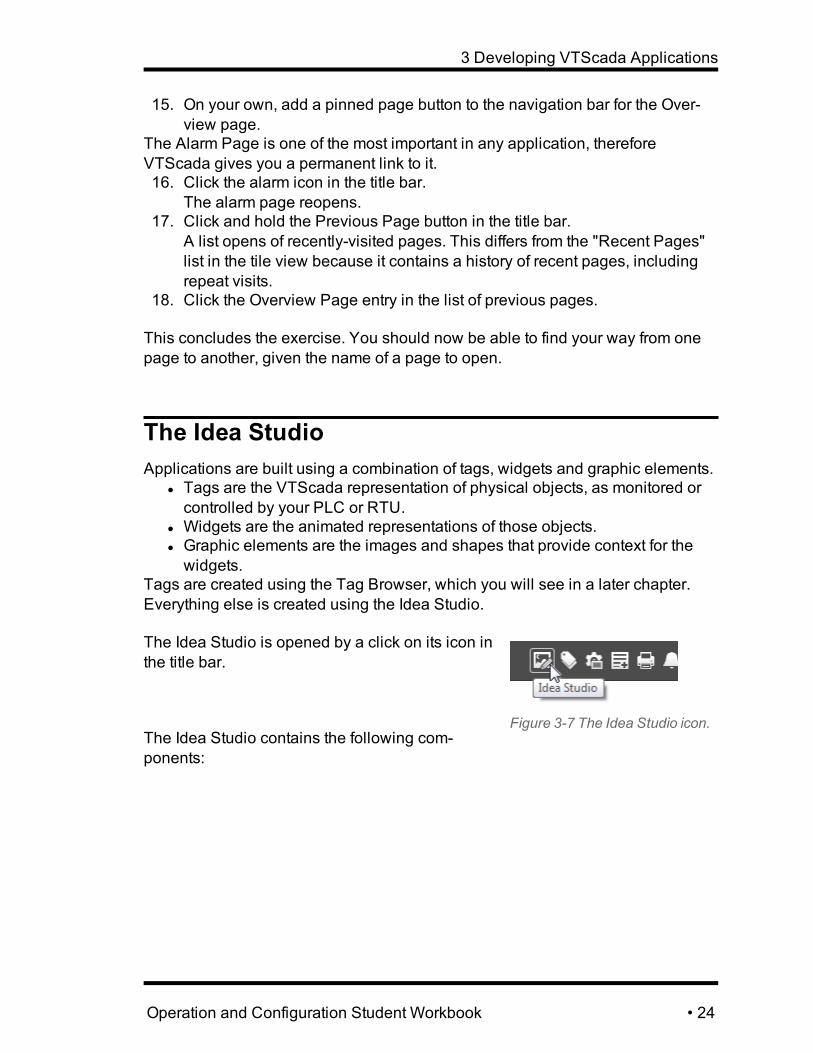
Figure 3-7 The Idea Studio icon.
The Idea Studio is opened by a click on its icon inthe title bar.
The Idea Studio contains the following com-ponents:
Operation and Configuration Student Workbook • 24
Chapter 3
Note: For many tools inthe Idea Studio, there ismore than one way to dothings.
You may be able to findthe same command inmore than one location.
The RibbonsOne ribbon, several versions, depending on the act-ive command or selection set. When more than oneribbon might apply, you will find tabs across the topof the Idea Studio that can be used to switch fromone ribbon to another.Some drawing tools, and all formatting tools, areaccessed using the ribbons.
The File MenuWhether this menu shows the word "File" or only an icon depends entirely onwhich version of Microsoft Windows you are using. Within the drop-down filemenu, you will find commands to open or create or import new pages and wid-gets.
The Quick Access Toolbar.Across the very top edge of the Idea Studio. Initially, there are very few tools inthis toolbar, but you can add your favorites at will. Also contains Undo and Redobuttons, a Quick view button (closes the Idea Studio and opens the page that youwere last working on,) and a Deploy button, which is only relevant if you haveturned off Auto-Deploy.
The PalettesCovering the left side of the Idea Studio, these three palettes are where you willfind all widgets, images and shapes to add to your pages. Palettes are organizedinto folders and, for the widgets palette at least, you will find the same items in sev-eral folders for ease of searching.From top to bottom, the palettes are organized as follows:
l Three tabs for switching between the three palettes.l A Recent Items list, with a separate list for each palette.l A navigation bar, to help you keep track of which folder you are viewingwithin a palette.
l The tools and folders that make up each palette.
Navigation Buttons and Zoom ControlsAcross the bottom of the Idea Studio, all the currently-open pages and widgetswill be listed. You can click any page or widget's tab to open it for editing. Youcan also click the (+) sign to the right of the tabs to either open a currently closedpage or widget, or to create a new one.Below these are display controls. You can change the display scale in order to'zoom-in' to better see detail in your work. You an also change the display scaleof the palettes, in order to better see which tool you are choosing or to see moretools at a smaller scale.
-
25 • Operation and Configuration Student Workbook
3 Developing VTScada Applications
Exercise 3-3 Open the Idea Studio, Create a PageThe practice application should still be open from the last exercise. If not, reopenit now.1. Navigate to the page, Overview.2. Click the Idea Studio button.
The Idea Studio opens. The text on the Overview page is there to help newusers get started. You will start by clearing the page.
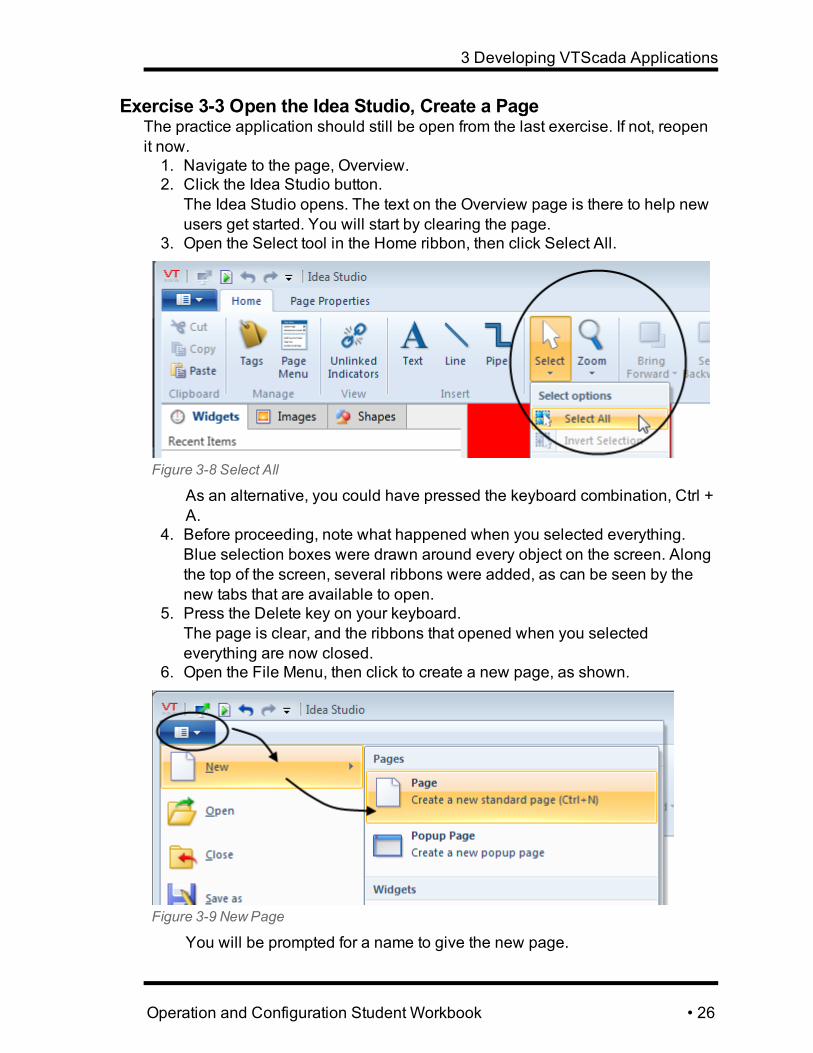
3. Open the Select tool in the Home ribbon, then click Select All.
Figure 3-8 Select All
As an alternative, you could have pressed the keyboard combination, Ctrl +A.
4. Before proceeding, note what happened when you selected everything.Blue selection boxes were drawn around every object on the screen. Alongthe top of the screen, several ribbons were added, as can be seen by thenew tabs that are available to open.
5. Press the Delete key on your keyboard.The page is clear, and the ribbons that opened when you selectedeverything are now closed.
6. Open the File Menu, then click to create a new page, as shown.
Figure 3-9 NewPage
You will be prompted for a name to give the new page.
Operation and Configuration Student Workbook • 26

Chapter 3
Figure 3-10 The NewPage Title prompt
7. Name the page, ControlDetails.
8. When prompted to add thepage to the menu, click 'Yes'.The page will be created andopened for editing. In the listof tabs across the bottom ofthe Idea Studio, you shouldnow see both Overview andControl Details.
Simply for the sake of showing how the controls work, the next few steps will haveyou close, then reopen Control Details in the studio.9. Click the x in the Control Details tab.
Figure 3-11 Close page
The page still exists, buthas been closed in theIdea Studio.
To delete a page, usethe Delete button inthe Page Propertiestoolbar.Note that the file name, where the page's source code
can be found, is shown when you hover over the tab.Since nothing prevents you from giving two pages thesame name, it is helpful to know that the file names willalways be different, and can be used to tell one pagefrom another.
10. Click the plus sign.
Figure 3-12 NewTab button
The New Tab dialog opens, with a selection ofoptions.
11. Click, Open.12. Click, Control Details, then click the OK button.
The page reopens.
-
27 • Operation and Configuration Student Workbook

3 Developing VTScada Applications
The Open and New com-mands can be found inthe file menu, in the NewTab dialog, and as key-board shortcuts (Ctrl+Oand Ctrl+N.)
As the number of pages in an application increases,it is not convenient to keep each open as a tab in theIdea Studio. Knowing how to close and open pageswill make your work in larger applications more effi-cient.
You will continue with the tools in the Idea Studio inthe next exercise.
Drawing ObjectsThis is the easy part. There are two ways to draw objects on a page that you areediting in the Idea Studio. Both start by using the palettes to find an object thatyou want to add to your page. Once you can see the object in the palette, you caneither:
l Click and drag that object onto the page, releasing the mouse button whenthe object is in position.
l Click once on the object. An instance will attach itself to the cursor, and youcan click anywhere on the page to drop the object onto that location.
Figure 3-13 Drag and place
There are three drawing commands that are found in the Home ribbon instead ofwithin one of the palettes: Line, Pipe and Text. These are used so commonly that
Operation and Configuration Student Workbook • 28
Chapter 3
it makes sense to keep them in a location that's easy to find, rather than tuckedaway into a palette.
Draw Lines or Pipes:A. Click the Line or the Pipe tool in the Home toolbar.B. Left-click on screen where you want to start drawing the line.C. Continue to left-click for each vertex.D. Right-click after you have drawn the last endpoint.
Once drawn, both lines and pipes will have endpoint grips and midpoint grips.l Drag an endpoint grip to reposition a corner.l Drag a midpoint grip to add a new endpoint between two existing endpoints.l Drag a segment between two grips to move that complete segment.
Draw TextA. Click the Text tool in the Home toolbar.B. Click on the page where the text is to be placed (lower left corner of the
text).A dialog will open.
C. Type one (1) line of text.The dialog will allow you to enter multiple lines, but all line breaks will beignored. A different tool exists for creating multi-line text.
D. Click OK to close the dialog and save the text.You can double-click the text to reopen the editing dialog.
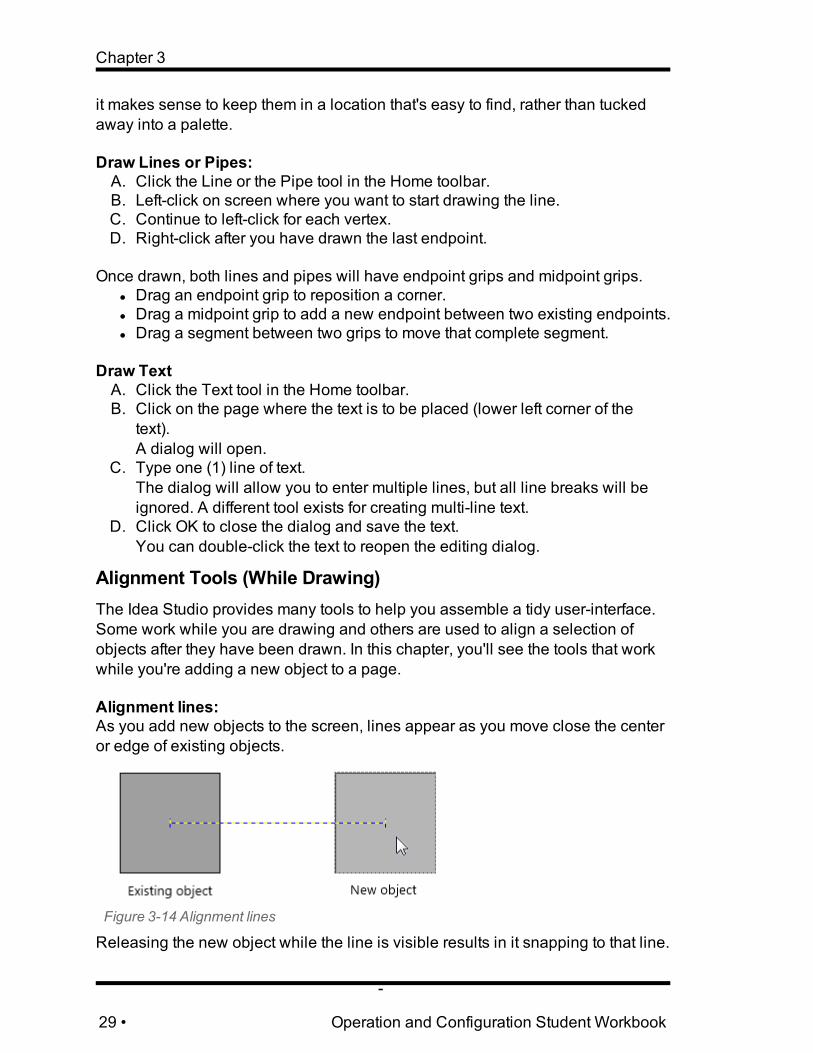
Alignment Tools (While Drawing)The Idea Studio provides many tools to help you assemble a tidy user-interface.Some work while you are drawing and others are used to align a selection ofobjects after they have been drawn. In this chapter, you'll see the tools that workwhile you're adding a new object to a page.
Alignment lines:As you add new objects to the screen, lines appear as you move close the centeror edge of existing objects.
Figure 3-14 Alignment lines
Releasing the new object while the line is visible results in it snapping to that line.
-
29 • Operation and Configuration Student Workbook

3 Developing VTScada Applications
You can tell VTScada toignore alignment snapsof all types by holdingthe Ctrl key down whiledrawing. The alignmentlines will still be dis-played, but the newobject won't snap tothem.
Red Distance ArrowThe red distance arrow has a preset (in code) dis-tance. As you add new objects to the page and placethem approximately this distance from an existingobject, the arrow will help you to place the newobject exactly that far from the old object.
Figure 3-15 Red alignment snap arrow
Blue Distance ArrowsGiven two objects in a row, as you add a third object approximately the same dis-tance from one as it is from the other, blue distance arrows will let you maintainequal spacing between each object. There is no pre-set distance for the bluearrows.
Figure 3-16 Blue alignment snap arrows
Proximity SnapWhen a new object is drawn "close" to an existing one, it will snap to the nearestedge of that object. This makes it easy to make objects connect.
Selection ToolsIn the next section, Alignment Tools (After Placing) you will see how to organizeobjects that you've already drawn. But, to do that, you need to select whichobjects should be organized.When you click on an object, it is selected. You can tell, because a border isadded around the object, with grips that you can click and drag.
Operation and Configuration Student Workbook • 30

Chapter 3
Figure 3-17 One selected object
If you click on a different object, the first is deselected and the next is selected inits place.
If you hold down the Shift key or the Ctrl key while clicking a second object, it willbe added to the selection set. Clicking a selected object while holding downeither key will deselect the object.
When two or more objects are selected, a different type of selection border isdrawn. All selected objects get a blue border with no grips, but the most recentlyselected object gets a thick border. This indicates that it is the anchor object. Theoverall set has a border with grips that can be moved to stretch everything thatwas selected.
Figure 3-18 Multiple selection with anchor object.
The anchor object is theone that stays the sameand does not move whileyou apply alignment com-mands to the selection set.Everything else will bealigned with the anchor.
You can also select mul-tiple objects by dragging awindow around them. Clickon an empty location in thepage, then drag the mouseto open a window that sur-rounds the objects that youwant to select. If you drag
-
31 • Operation and Configuration Student Workbook
3 Developing VTScada Applications
from left to right, every object that the window touches will be selected. If you dragfrom right to left, only the objects that are fully within the window will be selected.
To deselect everything, click once on an empty location on the page.
In a crowded page, it can be difficult to select just and only the objects that youwant. One way to solve that problem is to use the display scale slider at the bot-tom of the Idea Studio to zoom in on a region of interest.
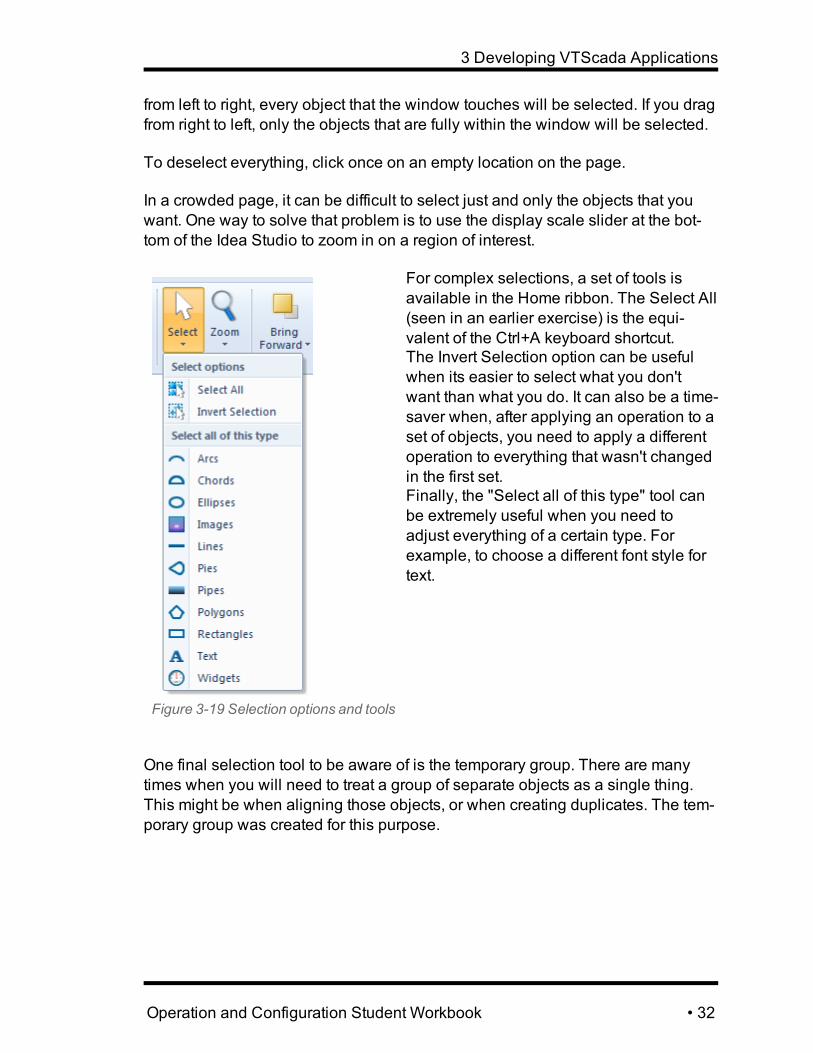
Figure 3-19 Selection options and tools
For complex selections, a set of tools isavailable in the Home ribbon. The Select All(seen in an earlier exercise) is the equi-valent of the Ctrl+A keyboard shortcut.The Invert Selection option can be usefulwhen its easier to select what you don'twant than what you do. It can also be a time-saver when, after applying an operation to aset of objects, you need to apply a differentoperation to everything that wasn't changedin the first set.Finally, the "Select all of this type" tool canbe extremely useful when you need toadjust everything of a certain type. Forexample, to choose a different font style fortext.
One final selection tool to be aware of is the temporary group. There are manytimes when you will need to treat a group of separate objects as a single thing.This might be when aligning those objects, or when creating duplicates. The tem-porary group was created for this purpose.
Operation and Configuration Student Workbook • 32

Chapter 3
Figure 3-20 Temporary group tool
This command can be used only when at least two objects are currently selected.After grouping, everything that was in the selection set will be treated as a singleobject. When you need to work with the individual pieces again, use the Ungroupcommand (shown gray in menu of the previous figure) to break the group apart.
Alignment Tools (After Placing)Given two or more objects on a page, you can use any of the following tools tobring them into alignment.
l Note 1: Everything that follows assumes that you have selected at least twoobjects in a page.
l Note 2: Everything will use the anchor object (dark blue border in the selec-tion set) as the basis for alignment.
Figure 3-21 Alignment and distribution tools
Align Midpoints is especially handywhen working with concentric objects,such as user-created meters andgauges.There are three alignment options forboth horizontal and vertical and verticaldirections.Finally, this menu contains two dis-tribution tools. Rather than align theselected objects on a common axis,these spread the objects apart equally,either horizontally or vertically. Dis-tribution is the exception to the rule ofthe anchor determining how everythingelse moves. When distributing theobjects in a set, the outer-most two stayput, and everything between them moves to fit.Note that every object in the selection set counts. You may need to create tem-porary groups in order to achieve the alignment that you want.
-
33 • Operation and Configuration Student Workbook
3 Developing VTScada Applications
Change Size & Position by DraggingWhen you click in the middle of a selected object or group of objects, then dragthe mouse, the selection set moves with the pointer.
Figure 3-22 Dragging a corner grip
Click and drag a corner grip, and the object willscale in size. It will retain its aspect ratio unlessyou hold down the shift key while dragging.
If you click and drag an edge grip, you stretch the object by moving that edge in orout.
Keyboard Modifiers:l Shift Key: release aspect ratio lock.l Ctrl Key: release alignment tools and proximity snap.
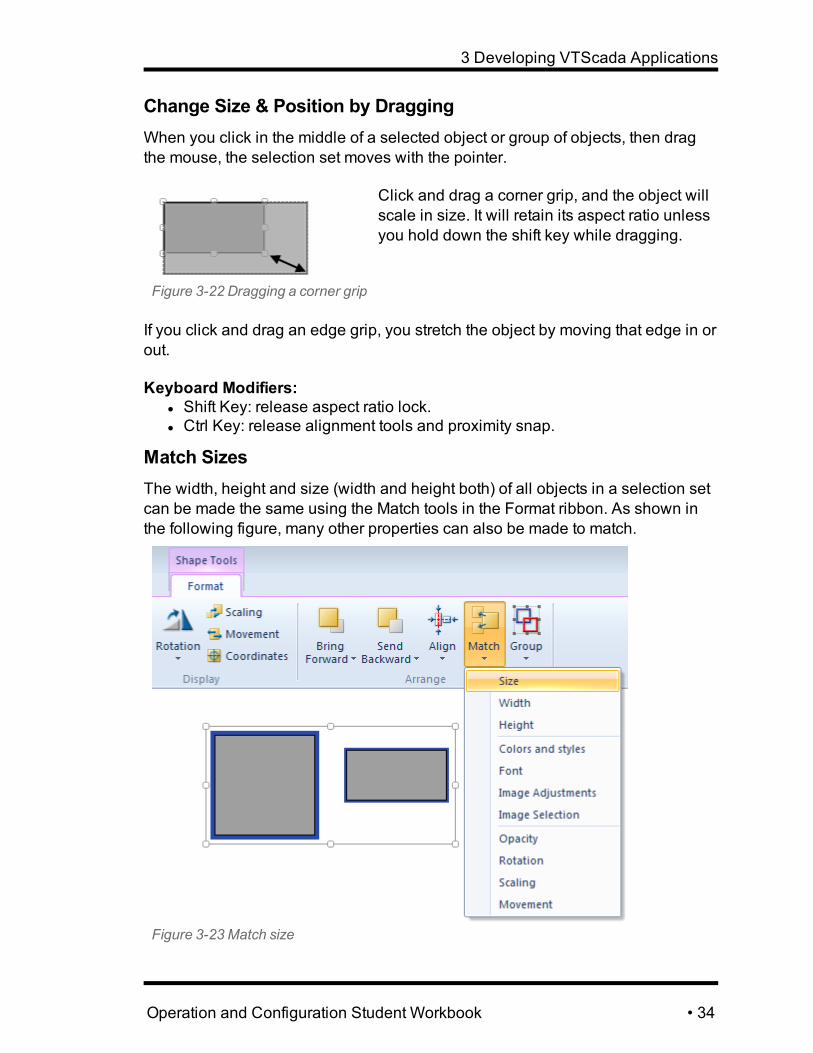
Match SizesThe width, height and size (width and height both) of all objects in a selection setcan be made the same using the Match tools in the Format ribbon. As shown inthe following figure, many other properties can also be made to match.
Figure 3-23 Match size
Operation and Configuration Student Workbook • 34

Chapter 3
As with the alignment tools, the anchor object in the selection set is the one thatall other objects will match after using the command. For each object thatchanges dimension, the top, left corner will remain fixed while the right edge orlower edge moves to match the new dimension.
Exercise 3-4 Practice with Alignment ToolsYour task is to build the screen as shown in following figure. The steps willprovide guidance for using the various tools in the Display Manager. The applic-ation that you created earlier, Practice, should still be running. If not, restart it now.
1. Open the Idea Studio and ensure that the currently selected page is Over-view.
2. Open the Shapes palette.
Figure 3-24 Opening the shapes palette
3. Drag a rectangle from the palette to the page.
-
35 • Operation and Configuration Student Workbook

3 Developing VTScada Applications
Figure 3-25 Dragging a rectangle
4. Drag a circle onto the rectangle.
Figure 3-26 Circle on top of rectangle.
Figure 3-27 Re-sized circle
5. Drag the lower, right corner of the circle up andleft until it snaps to the upper edge of the rect-angle.
6. Move the circle slightly forward, then align it andthe rectangle on a common vertical midpoint.
Figure 3-28 Aligned circle
7. Draw a short line from the midpoint of the right edge of the rectangle, asshown.
Figure 3-29 Added line
Operation and Configuration Student Workbook • 36

Chapter 3
Figure 3-30 Aligned tabs with connecting wire
8. Repeat to create a set of fiveidentical, and aligned tabs asshown. Add a line to represent aconnecting wire.Note that there is a shortcut, asdescribed in the earlier notes forthe various alignment tools.
Format and PropertiesHaving drawn a shape, line, image or widget, you can change its appearance.The options available will depend on the type of object you are modifying.The short version of the instructions is as follows:A. Select one or more objects.B. Examine the toolbar that opens automatically.
The available tools reflect your options for changing the format of the selec-ted objects.
Note that, if you have selected several types of objects, several toolbars will beavailable as tabs. Some formatting options, such as color, can be applied glob-ally, and others can be applied only to a particular type of object in the selectionset.
-
37 • Operation and Configuration Student Workbook

3 Developing VTScada Applications
Figure 3-31 Format ribbon for a shape
For example, given ashape such as a rect-angle, you can change itsfill color (and pattern), andits outline color (and pat-tern and thickness). Youcan change its opacity tomake it semi-transparent,and you can rotate it.(Note that only shapes canrotate. Images and widgets cannot.)Each of the tools shown in this ribbon example has its own set of controls.
Fill
Figure 3-32 The fill menu
The Fill tool provides an option to select froma range of preselected colors, or you canexpand the options to work with the full colorselector, or to change the pattern used withinthe fill.If you expand the Pattern option, you canchoose from a variety of cross-hatches, zig-zags, waves and other patterns. Havingchosen a pattern, you can apply a new colorto the background portion of that pattern.
The More Colors... option will open the full Select Color dialog. This tool givesyou an enormous range of options for choosing a color.
Operation and Configuration Student Workbook • 38

Chapter 3
Figure 3-33 The Select Color dialog.
You can use one of the color chips or pick from the full color target (note thesliders for setting the saturation and luminosity of any hue chosen in the target.)You can provide RGB or HSL values. Or, you can use the screen picker to selectany color in any VTScada window or title bar. The last option is especially handywhen trying to match an existing color that is no longer listed in the set ofRecently Used Colors.
OutlineNot all shapes will have a fill, but all will have an outline. This also applies tolines and pipes.Properties that can be changed for an outline include color and width. Except forpipes, it is also possible to apply a line style to an outline, making a dashed or dot-ted line or edge.
Advanced Formatting. The Properties DialogThose who have used older versions of VTScada are familiar with the graphiceditor (VGE), a dialog that opened as each new object was drawn on the screen,and which could be used to adjust the appearance of that object. While ribbonshave largely replaced the VGE, it still exists but is now called the Properties dia-log.
-
39 • Operation and Configuration Student Workbook

3 Developing VTScada Applications
Figure 3-34 Properties dialog for a rectangle
A properties dialog can be opened for only one object at a time. If several objectswere included in selection set, then the anchor object will be the only one affectedby the change in properties.
The Properties dialog has the following controls to know:Menu
Figure 3-35 Properties menu
Attributes of the object that have been changed aremarked with a green dot. Select each attribute asneeded, to access the properties that you canchange for that attribute.
Mode selection
Figure 3-36 Mode selection
Most properties will have a choice ofNone or Advanced. A few, includingboth Fill and Outline, also have asimple mode, which usually offerscontrol over only color. You shouldmake a habit of checking the modeto see whether an advanced set of options is available.
Data source
Operation and Configuration Student Workbook • 40
Chapter 3
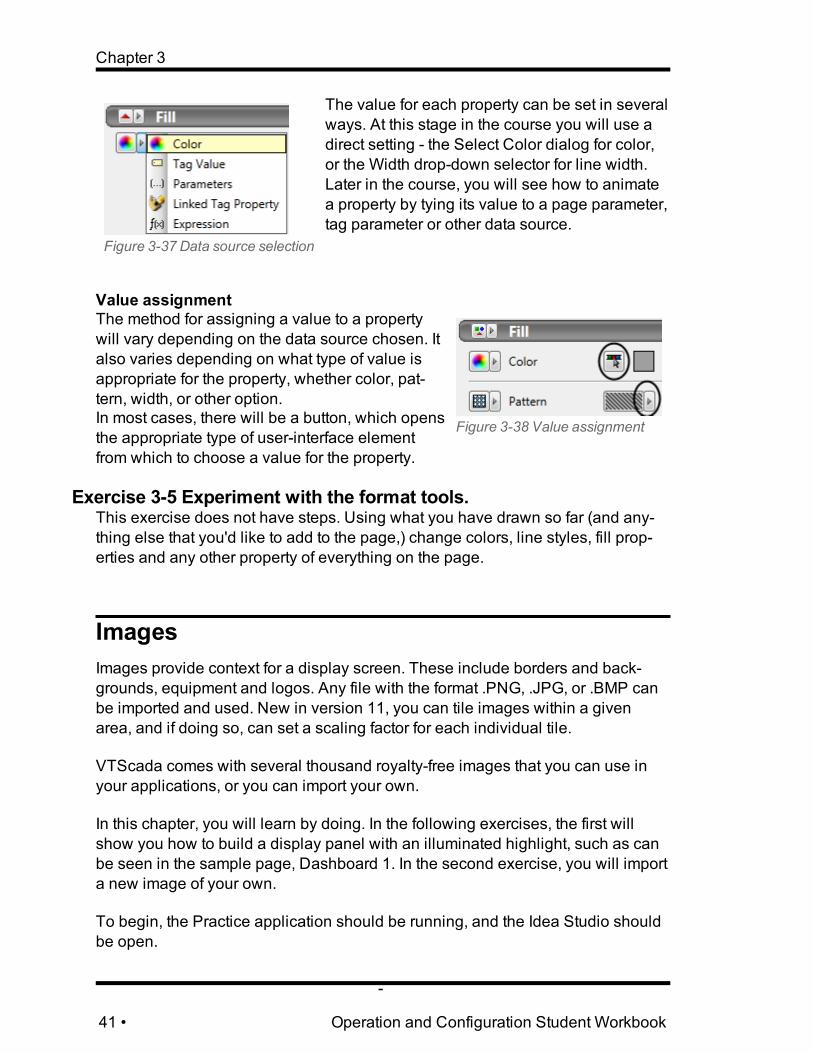
Figure 3-37 Data source selection
The value for each property can be set in severalways. At this stage in the course you will use adirect setting - the Select Color dialog for color,or the Width drop-down selector for line width.Later in the course, you will see how to animatea property by tying its value to a page parameter,tag parameter or other data source.
Value assignment
Figure 3-38 Value assignment
The method for assigning a value to a propertywill vary depending on the data source chosen. Italso varies depending on what type of value isappropriate for the property, whether color, pat-tern, width, or other option.In most cases, there will be a button, which opensthe appropriate type of user-interface elementfrom which to choose a value for the property.
Exercise 3-5 Experiment with the format tools.This exercise does not have steps. Using what you have drawn so far (and any-thing else that you'd like to add to the page,) change colors, line styles, fill prop-erties and any other property of everything on the page.
ImagesImages provide context for a display screen. These include borders and back-grounds, equipment and logos. Any file with the format .PNG, .JPG, or .BMP canbe imported and used. New in version 11, you can tile images within a givenarea, and if doing so, can set a scaling factor for each individual tile.
VTScada comes with several thousand royalty-free images that you can use inyour applications, or you can import your own.
In this chapter, you will learn by doing. In the following exercises, the first willshow you how to build a display panel with an illuminated highlight, such as canbe seen in the sample page, Dashboard 1. In the second exercise, you will importa new image of your own.
To begin, the Practice application should be running, and the Idea Studio shouldbe open.
-
41 • Operation and Configuration Student Workbook
3 Developing VTScada Applications
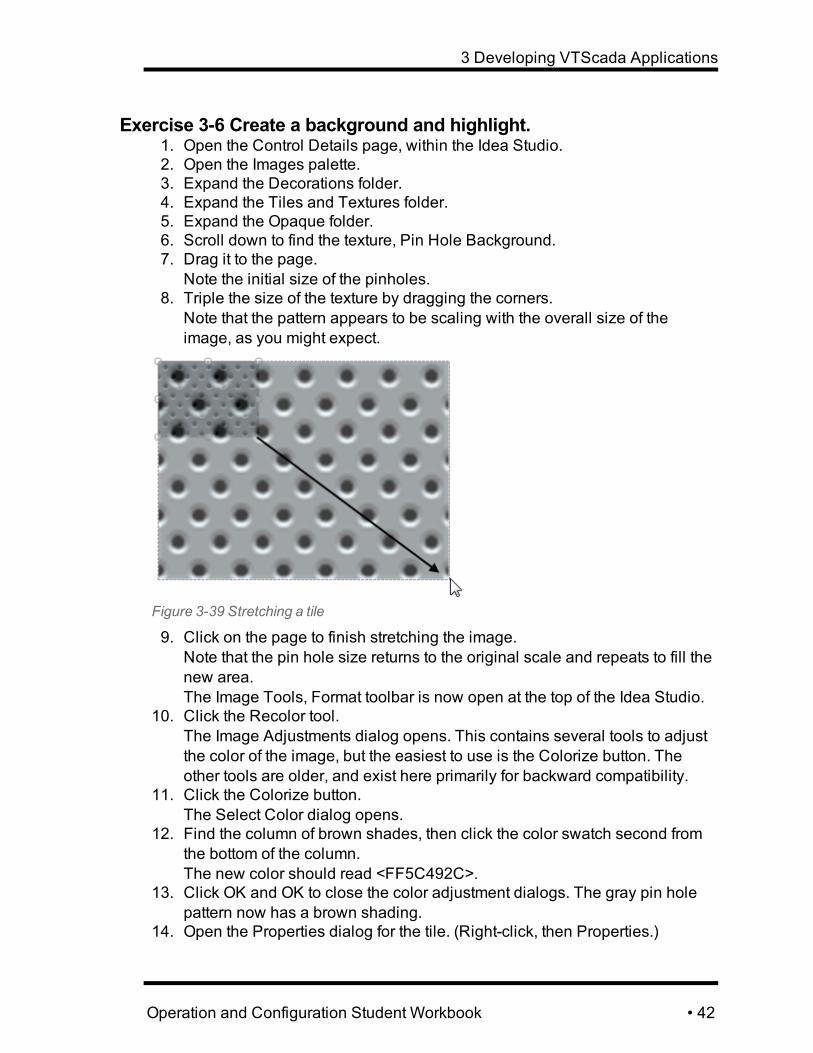
Exercise 3-6 Create a background and highlight.1. Open the Control Details page, within the Idea Studio.2. Open the Images palette.3. Expand the Decorations folder.4. Expand the Tiles and Textures folder.5. Expand the Opaque folder.6. Scroll down to find the texture, Pin Hole Background.7. Drag it to the page.
Note the initial size of the pinholes.8. Triple the size of the texture by dragging the corners.
Note that the pattern appears to be scaling with the overall size of theimage, as you might expect.
Figure 3-39 Stretching a tile
9. Click on the page to finish stretching the image.Note that the pin hole size returns to the original scale and repeats to fill thenew area.The Image Tools, Format toolbar is now open at the top of the Idea Studio.
10. Click the Recolor tool.The Image Adjustments dialog opens. This contains several tools to adjustthe color of the image, but the easiest to use is the Colorize button. Theother tools are older, and exist here primarily for backward compatibility.
11. Click the Colorize button.The Select Color dialog opens.
12. Find the column of brown shades, then click the color swatch second fromthe bottom of the column.The new color should read <FF5C492C>.
13. Click OK and OK to close the color adjustment dialogs. The gray pin holepattern now has a brown shading.
14. Open the Properties dialog for the tile. (Right-click, then Properties.)
Operation and Configuration Student Workbook • 42

Chapter 3
15. Note that the option Tile Image is selected, and that the scale factor is cur-rently at a default value of 0.5.
16. Change the scale factor to 0.3 and click OK.
Figure 3-40 Scaled image scale factor
17. Click the Home button in the Images palette to return to the top-level folder.
Figure 3-41 The home button.
Since widgets haven't yet been covered in the course, you will add a motor imageinstead of the gauge that was used in the sample page.
18. Expand the Motors folder.19. Find the Inverter Drive motor and drag it onto the tiled background.20. With the motor selected, click the Recolor tool in the Format toolbar.21. Change the color of the motor to a steel gray by setting its Red - Green -
Blue values to 191, 212, and 240 respectively.
Figure 3-42 Steel blue
22. Click OK to save and close the dialogs.23. Return the Images palette to the Home folder.24. Expand the Decorations folder.25. Expand the Lighting Overlays folder.26. Expand the Transparent folder.27. Find the Spot Light Fade image and drag it to the page, placing it at the top,
center of the tile.Lighting overlays are most effective above a dark background.
-
43 • Operation and Configuration Student Workbook

3 Developing VTScada Applications
Figure 3-43 The result
Exercise 3-7 Import an ImageWhen images are imported, they are added to whichever folder is currently open.A folder named, "Imported Images" exists, but this is as a courtesy. If you wantyour imported images to end up there, you must ensure that it is the currentlyopen folder before beginning.
1. The Idea Studio should be open, and the Images palette open.2. Click the Home button to ensure that you are starting at the top level of the
Images palette.3. Expand the Imported Images folder.
The folder should be empty.4. Click the Add New button at the bottom of the palette.
Figure 3-44 Add New ... item to the palette.
The New Menu Item Properties dialog opens. Note that you could use thisto create new folders for your imported images, if you wished.
Figure 3-45 NewMenu Item dialog
Operation and Configuration Student Workbook • 44

Chapter 3
5. Click the option, Image.The Import Image dialog opens.
6. Navigate to the course folder, as directed by the instructor. This should havebeen created at the beginning of the course.
7. Select the file, SmallTower.png and click Open.Details about the image will be displayed in the New Menu Item Propertiesdialog. You could change your mind at this point and select a differentimage to import.
8. Click OK.The image is now available in the Imported Images folder.Drag it to the page.
WidgetsYou might not see much difference between images and widgets at first, but thereis one very important difference to keep in mind. Widgets are designed to belinked to tags, and either display monitored values in some animated fashion, orprovide operator controls that can write values to equipment. Images are static pic-tures, used to enhance or provide context to an operator display.
Since the whole purpose of a widget is to be linked to a tag, we will wait untilthose have been described before seeing how to work with widgets. Rest assuredhowever, that you already know most of what you will need to know, as a result oflearning how to add images to a page.
-
45 • Operation and Configuration Student Workbook

3 Developing VTScada Applications
The Widgets Palette
Figure 3-46 TheWidget palette
Widgets are organized both by the type of animation they provide and by the typeof tag to which they can be linked. The widgets palette does contain a number ofstatic images, most of which will be found in the Decorations folder, and some ofwhich will be found in the Tools folder.For those who have used versions of VTS prior to the release of VTScada 11,what used to be the Library dialog is now the Tools folder.When searching for a given widget, you can follow either path: starting with thetype of thing you want to draw (perhaps an equipment indicator) then open thematching folder. Or, start with the type of tag you intend to represent with the wid-get, then open the Tag Types folder and navigate from there.
Operation and Configuration Student Workbook • 46
4 Preparation for the Class Project
4 Preparation for the Class ProjectMost of the exercises for the next few chapters will build towards the creation ofone application - the class project.The class project will be based on an existing layer: WellSimulator. This is donefor a number of reasons:
The project is designedto teach you aboutVTScada concepts, onestep at a time. After basicconcepts have been prac-ticed and new featureslearned, don't be sur-prised at instructions thattell you to erase earlierwork, so that a com-ponent can be re-createdin a different way.
l Building on top of an existing intermediatelayer is a realistic thing to do
l The classroom computers are not actually con-nected to a water distribution system.
l The driver in the simulator layer, "WellSim"provides data as if you were connected to aphysical system.
OEM Layers - New Applications From OldYou have already seen that VTScada applications are built on layers. You areabout to create a new application based on an intermediate layer, also referred toas an "OEM layer".
Any application can bean OEM layer for anotherapplication.
OEM layers allow you tore-use your work insteadof re-creating com-ponents for each newproject.
The OEM layer contributes application propertiesand tag type definitions to the new layer. In otherwords, VTScada does not make of copy of the OEMlayer, to use as the new application, but rather, itallows the new application to see drivers, tag types,application settings, etc. that are in the underlyingOEM layer. This means:
l Application properties must be copied from theOEM layer to the current application if you wantto change their values.
Operation and Configuration Student Workbook • 47

Chapter 4
l Tags are copied to the new application from the OEM layer.l Pages in the OEM layer can be seen and added to the new application'smenu, but the page cannot be edited in the current application and none ofthe tags that were drawn on it in the OEM layer will be seen in the newapplication.
If you want instances of pages and application properties to be copied into newapplications, then you can add the items you want into a template in the OEMlayer.
The Communications ChainBefore creating I/O tags, it is necessary to establish what hardware the applic-ation will be communicating with and how that communication will be handled.This is the role of the tags in the communications chain.There are either 3 or 4 links in the chain, depending on whether or not telemetry isa part of your system:A. Create a port connection tag. This can be a Serial port, a TCP/IP port or a
UDP/IP port.B. Create a device driver tag. Options include Allen Bradley drivers, Modbus-
compatible, Siemens and over 100 others.C. [optional step for telemetry applications] Create a polling driver.D. Create the I/O connections. These include input, output and status tags for
analog or digital communications
Figure 4-1 The communication chain
-
48 • Operation and Configuration Student Workbook
4 Preparation for the Class Project
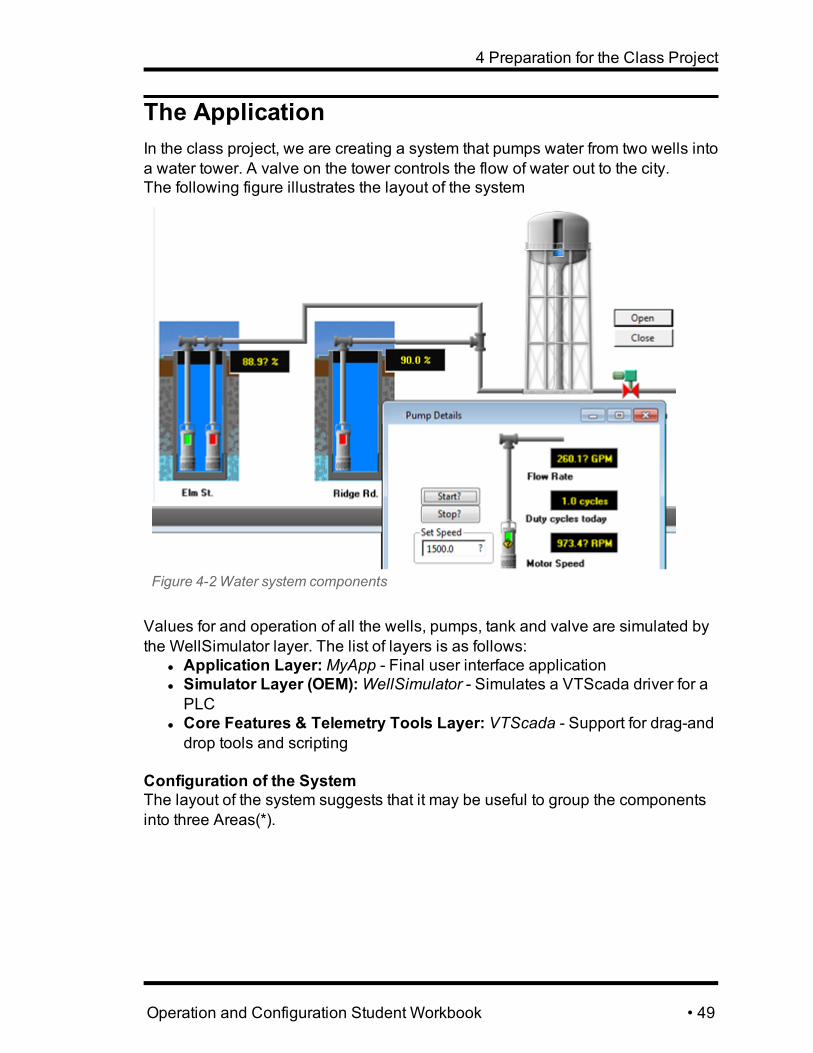
The ApplicationIn the class project, we are creating a system that pumps water from two wells intoa water tower. A valve on the tower controls the flow of water out to the city.The following figure illustrates the layout of the system
Figure 4-2Water system components
Values for and operation of all the wells, pumps, tank and valve are simulated bythe WellSimulator layer. The list of layers is as follows:
l Application Layer:MyApp - Final user interface applicationl Simulator Layer (OEM):WellSimulator - Simulates a VTScada driver for aPLC
l Core Features & Telemetry Tools Layer: VTScada - Support for drag-anddrop tools and scripting
Configuration of the SystemThe layout of the system suggests that it may be useful to group the componentsinto three Areas(*).
Operation and Configuration Student Workbook • 49

Chapter 4
(*) An “Area” is a labelapplied to tags.By identifying tags asmembers of an Area (orgroup) you can filter lists,control alarm notificationsystem, rosters andmore.
l Zone1 will include all the equipment in the firstwell.
l Zone2 will include all the equipment in thesecond well.
l Zone3 will include the water tower and valve.The System zone exists in every application and willbe used here for system-wide components such asthe communications port and driver.
Summary of the system’s operation:l Pump 1 and Pump 2 pull water from the first well and send it to the watertower.
l Pump 3 pulls water from the second (slower-filling) well and sends it to thewater tower.
l The tower is drained by the control valve.l You will need control systems to turn the pumps on and off and to open andclose the valve.
l Monitoring systems will be required on pumps, wells and valve.l Alarms will be needed to alert us when well levels are too low, and whenthe water tower's level is low or pressure is high.
l Reports will be required for such things as well and water tower levels overtime.
While the instructions will direct you to use certain bitmaps for the pumps, tanksand valves, you are free to experiment with other choices.As you design your application keep the overall layout of the system in mind. Youwill need to fit many of the components into one overview page, so it will not workvery well if your first pump takes up half the screen. Note also the various textlabels that exist to help an operator monitor the system. You will need to leavespace around each component for these.
Exercise 4-1 Install the Simulator LayerPreparation: If the application from the last set of exercises is still running, stop itnow. The following exercise assumes that your starting point is the VAM, with noother applications running.
1. Click the Add Application Wizard button in the VAM.The wizard opens.
2. Select the Advanced option, then click Next.3. Select the option, Get from ChangeSet, then click Next.4. Click the Browse button,5. Browse to the course folder (usually, C:\COURSE) and locate the file
-
50 • Operation and Configuration Student Workbook

4 Preparation for the Class Project
WellSimulator.ChangeSet.6. Select WellSimulator.ChangeSet and click Open.
Figure 4-3 Get from ChangeSet
7. If your screen matches the previous figure, click Next.8. Deselect the Start application now option.
You are adding the Well Simulator to serve as an OEM layer. You will notrun this application.
9. Click, Finish.
Exercise 4-2 Create the Project Application.
1. Click the Add Application Wizard button in the VAM.The wizard opens.
2. Select the Advanced option, then click Next.The Create new option should be selected by default.
3. Click Next.4. Change the name to "Well_" followed by your initials.
For example, the author of this exercise named the application, "Well_AJH".5. Change the Type to WellSimulator.
Operation and Configuration Student Workbook • 51

Chapter 4
Figure 4-4 Newapplication based on an OEM layer
1. If, and only if you have set the type to WellSimulator as shown, click Next.2. Review the information in the final screen of the wizard.3. Check the option, Start application now.4. Click, Finish.
The application folder will be created and the name will show up in the VAM. Thenew application will fill the screen.
These notes will refer to your new application as the "Well application".
-
52 • Operation and Configuration Student Workbook
5 Pages
5 PagesA page is the canvas on which you draw your application. There are two types:the full screen page used to provide an overview of part or all of a system, and thepop-up page, used to provide detail or control for some small part. You may cre-ate as many pages as required to build your application.Every VTScada application starts with a set of built-in pages. Most of these can-not be edited. For example, the Alarm page, Reports page and Historical DataViewer all exist to be used, but not changed. The tiled menu, "Page Menu" is alsoa type of page. Pages that you cannot edit are referred to as "system pages".
A few built-in pages can be edited, or even deleted. Of note is the Overview page;a starter page to help you begin building your application. Pages that you can cre-ate and change are referred to as "application pages".
As with most other parts of the application, pages are created and modified withinthe Idea Studio. You saw how to create a new page in the exercise, Open theIdea Studio, Create a Page, on page 26. In this chapter, you'll learn about defin-ing page properties and building the menu.
Page PropertiesWhen creating a new page, you will be prompted to choose whether to create itas a full page, or as a pop-up page. The only difference between the two is a prop-erty setting, which you can easily change after the page has been created.
Operation and Configuration Student Workbook • 53

Chapter 5
Figure 5-1 Newpage or new pop-up page
Page properties are accessible through the Idea Studio ribbons.
Figure 5-2 Page properties
Taking these one at a time, you can do the following:Color: Opens the Select Color dialog, from which you can choose anycolor you like for the page background. Some developers will set a colortheme for certain groups of pages, as a visual guide for operators. Whilehelpful in some cases, it does little good for operators who are color blind.In general, if setting a background color, always choose a pale, neutral
shade so as to not cause eye-strain and to not distract operators.
Image: Opens the Select Image dialog, with which you can select a back-ground image. This might be an image of the equipment being monitoredor controlled by the widgets on the page, or it might be a company logo.You can import any image to use as a background.
Title: Pages are (apparently) identified by their title. There is no rule to saythat two pages cannot have the same title, so it is helpful to know thatpages are really identified by their file name, which is easily discovered.
Size: Important to set for pop-up pages, and possibly useful to set for stand-ard pages. The size dialog includes options to set the default position ofpop-up pages (top and left), the default size, and both or either the min-imum size and maximum size.
-
54 • Operation and Configuration Student Workbook

5 Pages
When editing a page in the Idea Studio for which a size has been set, a markingrectangle will indicate where the borders of that page are. This can be extremelyhelpful when designing a page for a smaller screen than the one you are using.
Pop-up Behavior: Controls how the page opens. Can be set toalways open as a standard page, filling the application area,
always as a pop-up page, or as "no restrictions". The last option is useful to beaware of, since most of the system pages are configured using this option. A left-click to open such a page will result in a standard page. A right-click will result ina pop-up. This gives flexibility, and also allows you to have two pages open atonce.The "no restrictions" option is not appropriate for every page.
Bar Items: This has nothing to do with beverages. Controls the con-tents of the title bar and the footer bar of a page. You can limit oper-
ator control by limiting the contents of these bars.
Scale Page Content: When selected, the contents of thepage will scale to fit the available area. This gives flexibility
to your pages when they are viewed on varying screen sizes, but may result insome deformation.
Security: Available only after security has been enabled, and applicationproperties have been created. Developer-defined application propertiescan be applied to a page to restrict access to authorized operators only.
Parameter Values: Available only after parameters have been createdusing the Manage Parameters tool.
Manage Parameters: Added to a page so that one page can bereused. If your application has several identical stations, you can cre-ate one generic page, then provide a separate menu link to it fromeach station, handing a different set of tags to the parameters fromeach link. Widgets and expressions within the page can be linked to
the parameters so that they display the values from the appropriate station whenthe page is opened.
View Source: Every page is stored as a .SRC file in the Pages folder ofyour application. The exception to this rule is on runtime-only install-ations, where source code is not included. Advanced developers oftenfind it useful to work directly with a page's source code for certain tasks.
Operation and Configuration Student Workbook • 55

Chapter 5
Thumbnail: Rather than use a snapshot of the page in previews, selectand use an image of your choice.
Tag Types: Allows a page to be linked directly to one or more tagtypes, as is done with widgets.
Delete Page: As it says.
The system you are creating for the class exercise will have three stations provid-ing water for a town: two wells and a water tower.To monitor the system, you will make use of a VTScada Site Page. This will bedesigned so that an operator can click on any station and open a detail view ofthat site. For the sake of seeing all available options, you will also make use ofthe overview page, giving it a simple background map and using page hotboxesto open the control pages. After learning how to use both options, you can choosewhich you prefer for your own applications.
Pages will be required for the detail and control views. Since there is only onewater tower, you will need to create one page for it. The wells present a differentopportunity. There are two, nearly identical wells. Rather than build two pages,you will build one parametrized page that can be used by either.
You cannot use the built-in site map pages until you have created a properly con-figured Context tag, Station tag or Polling Driver tag, therefore those will have towait for a later chapter.
Exercise 5-1 Modify Page PropertiesPreparation: The well application should be running.
1. Open the Idea Studio.The Overview page will load automatically, since no other application pagehas been created yet.
2. Select all, then press the delete key.You could use the select tool in the ribbon, or you could press Ctrl + A.
3. Open the Page Properties ribbon.4. Change the title to "Supply Map", then click OK to close the Rename dialog.5. Click the Image tool, then Select Image.
The Select Image dialog opens.
-
56 • Operation and Configuration Student Workbook
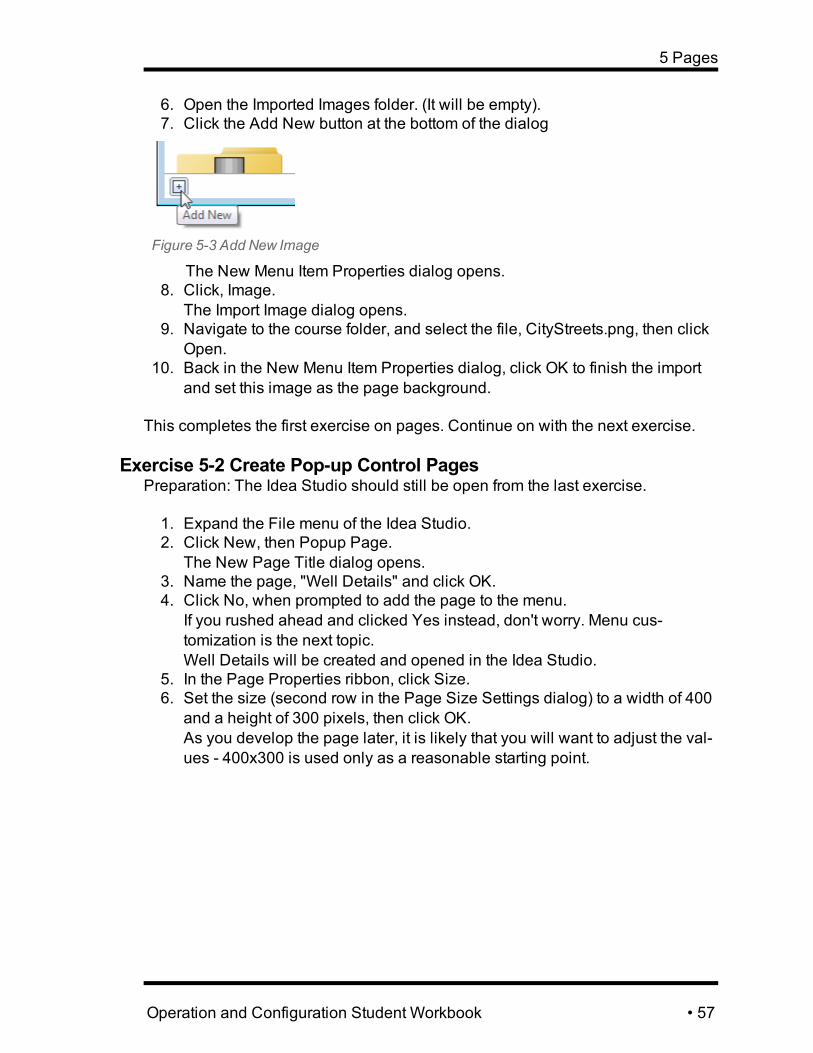
5 Pages
6. Open the Imported Images folder. (It will be empty).7. Click the Add New button at the bottom of the dialog
Figure 5-3 Add New Image
The New Menu Item Properties dialog opens.8. Click, Image.
The Import Image dialog opens.9. Navigate to the course folder, and select the file, CityStreets.png, then click
Open.10. Back in the New Menu Item Properties dialog, click OK to finish the import
and set this image as the page background.
This completes the first exercise on pages. Continue on with the next exercise.
Exercise 5-2 Create Pop-up Control PagesPreparation: The Idea Studio should still be open from the last exercise.
1. Expand the File menu of the Idea Studio.2. Click New, then Popup Page.
The New Page Title dialog opens.3. Name the page, "Well Details" and click OK.4. Click No, when prompted to add the page to the menu.
If you rushed ahead and clicked Yes instead, don't worry. Menu cus-tomization is the next topic.Well Details will be created and opened in the Idea Studio.
5. In the Page Properties ribbon, click Size.6. Set the size (second row in the Page Size Settings dialog) to a width of 400
and a height of 300 pixels, then click OK.As you develop the page later, it is likely that you will want to adjust the val-ues - 400x300 is used only as a reasonable starting point.
Operation and Configuration Student Workbook • 57

Chapter 5
Figure 5-4 Setting the minimum page size.
7. Click the Add New Tab button at the bottom of the Idea Studio.
8. Click "Popup" in the New Page section.9. Name this page, "Tower Details" and click OK.10. Click, Yes when prompted to add the page to the menu.11. Set the size to a width of 600 and a height of 400 pixels, then click OK.
Leave all three pages open in the Idea Studio. As you continue with the followingexercises, you will need to be careful of which page you are currently working on.
Menu CustomizationThe content and structure of the menu are yours to control. You may add as manyor as few pages to it as you wish, and you can group the pages in whatever man-ner makes sense.For example, as shown in following figure, the control pages of the class projecthave been grouped within a sub-folder.
-
58 • Operation and Configuration Student Workbook

5 Pages
Figure 5-5 Grouped control pages in the menu.
Menus are edited, not just to add the new pages that create, but to remove unne-cessary pages (such as the Sample Pages) and to organize pages so that oper-ators can find the ones they need without spending time searching.
To make these changes to your menu, open the Page Menu from the Home tool-bar of the Idea Studio.
Figure 5-6 The PageMenu tool
The Page Menu is in fact the Tag Browser. Menu items, including the contents ofall three palettes, are stored as Menu Item tags, and organized within the browser.
Figure 5-7 The pagemenu
Operation and Configuration Student Workbook • 59
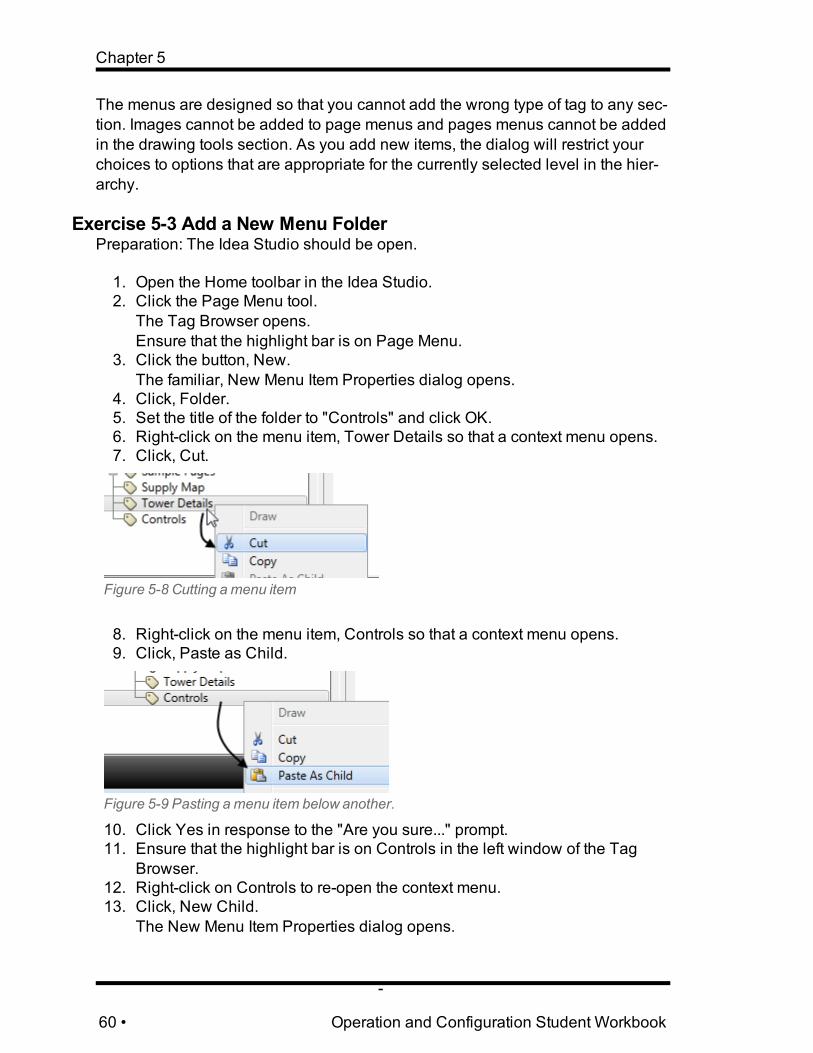
Chapter 5
The menus are designed so that you cannot add the wrong type of tag to any sec-tion. Images cannot be added to page menus and pages menus cannot be addedin the drawing tools section. As you add new items, the dialog will restrict yourchoices to options that are appropriate for the currently selected level in the hier-archy.
Exercise 5-3 Add a New Menu FolderPreparation: The Idea Studio should be open.
1. Open the Home toolbar in the Idea Studio.2. Click the Page Menu tool.
The Tag Browser opens.Ensure that the highlight bar is on Page Menu.
3. Click the button, New.The familiar, New Menu Item Properties dialog opens.
4. Click, Folder.5. Set the title of the folder to "Controls" and click OK.6. Right-click on the menu item, Tower Details so that a context menu opens.7. Click, Cut.
Figure 5-8 Cutting a menu item
8. Right-click on the menu item, Controls so that a context menu opens.9. Click, Paste as Child.
Figure 5-9 Pasting a menu item below another.
10. Click Yes in response to the "Are you sure..." prompt.11. Ensure that the highlight bar is on Controls in the left window of the Tag
Browser.12. Right-click on Controls to re-open the context menu.13. Click, New Child.
The New Menu Item Properties dialog opens.
-
60 • Operation and Configuration Student Workbook

5 Pages
14. Click, Page.A dialog showing all the pages in the application opens.
15. Select the page, Well Details, then click OK.16. Click OK to confirm and close the properties dialog.
Finally, tidy up the menu by removing the sample pages:17. Right-click on Sample Pages, then click Delete.
Confirm the action when prompted.
The contents of the Tag Browser should now look like the following figure. If yoursdoes not, use the tools you have seen in this exercise to adjust it.
Figure 5-10 Tag browser at the end of the exercise
Close the Tag Browser and the Idea Studio, then open the menu. Note how thelist menu and tiled menu have the same structure, but a different appearance. Ifyou open the Controls folder in the tiled menu, you will be able to see a previewof both control pages. (Currently blank in both cases.)
Page Source FilesPages are stored as text files in a sub-folder of your application named, "Pages".These are user-editable that you can easily modify. You can also create newpages by copying existing files and editing key lines within them.
While VTScada provides all the tools you will need to create and configurepages, it can be very handy to know how to make changes at the code level aswell. For example, suppose that after you created 50 control pages in an applic-ation, the operators have demanded that you not use bright purple as a back-ground color. It is far faster to change the color code (expressed as an RGBvalue) in a series of files than to open the Select Color dialog for every page.(38, 380, 780, 0)[ Title = "Tower Details"; PageMinWidth = 800;
Operation and Configuration Student Workbook • 61

Chapter 5
PageMinHeight = 400; WinFlag = 1; Color = "<FCD48E>";
]
Note that any change to a user-file in your application must be imported before itwill become part of the set of working files. This is a security feature of VTScada.Only authorized users may import file changes and they can easily compare thetwo versions to determine what was changed before the new is imported.The easiest way to import user files that you have modified is to use the ImportFile Changes button in the VAM.
-
62 • Operation and Configuration Student Workbook

6 Tags
6 TagsTags are the software representation of a discrete part of a physical system. A tagmight represent the status of a pump, the level of a tank, a control switch to open avalve, etc.The Tag Browser is the primary tool for creating, modifying and deleting tags.With it, you can easily add tags and change the information in the tag propertiesdatabase. Your other option is to export tags to a spreadsheet, then importchanges back to the application. This is far less user-friendly, but can be a time-saver when creating a large number of similar tags.
Tags can be organized into a hierarchy, so that it is easy to see which tags relateto which components in the system. Besides making it much easier to find a giventag, this system makes it easy to expand the application by copying entire struc-tures. You have seen this structure at work in the last exercise when you modifiedthe menu by adding a folder for your control pages.
Building the Communications ChainBefore creating I/O tags, you must configure the connection between VTScada onyour computer and the hardware at the remote site. This is the role of the tags inthe communications chain.There are three links in the chain:
l The port (serial, TCP or UDP)l The driver (communication protocol for your device)l The I/O (addresses on the PLC or RTU)
Some application also have one or more of the following optional links:l Polling driver - Groups I/O at a station and controls the timing of com-munication.
l Driver Multiplexer - Allows I/O to switch between alternate routes of com-munication as needed.
PortsPort tags are used to enable communication between VTScada and the physicalhardware. If the hardware is connected to your server via a serial port, you will
Operation and Configuration Student Workbook • 63

Chapter 6
need a Serial Port tag, specifying the COM Port to use, the baud rate, parity, stop-bits, etc.If the connection is made over an Ethernet network, you will need a TCP/IP orUDP/IP port, configured to use the correct IP address or DNS name, and otherconnection parameters.
DriversDriver tags are used to ensure that VTScada sends and receives data using thecorrect protocol for your hardware. Drivers that ship with VTScada include the fol-lowing (many more are available on special request).
Allen-Bradley CIP
Data Flow RTU DNP3
CalAmp Diagnostic DDE
Modbus Compatible Device Omron Host Link
OPC Siemens S7
SNMP
The VTScada Help reference includes a guide to I/O address formats to use foreach type of device driver.
The Polling DriverThe polling driver is an optional part of the communication chain. Its original pur-pose was to control the frequency of communications in telemetry applicationswhere communication links are expensive and therefore should be polled at a setinterval rather than left open continuously.Extra benefits that come with the polling driver, such as site pages, have leadmany developers to add a Polling Driver tag into their systems even when theyare not using telemetry and do not want to limit communications to a polled inter-val.
-
64 • Operation and Configuration Student Workbook

6 Tags
Monitoring Polling Drivers
Figure 6-1 The site legend
The SiteDraw drawing method provides a way to mon-itor communications to the RTU. This is drawn as twocircles – the outer one indicating the health of the com-munication link and the inner one showing the state ofthe data transferred.A legend for the SiteDraw is available in the DrawingTools menu. (Site Tools Library).
Site Pages for Polling Drivers
Clicking on a site draw symbol opens a Site Detailspage. These automatically-created pages will displaystatistics relevant to that Polling driver as well as a listof all the I/O tags linked to that driver.
How Long Since the Last Poll?
You can find the time since the last poll by drawing a DataAge display for aPolling driver. This numeric display in clock format (hours : minutes : seconds)simply shows the length of time elapsed since the last successful communicationthrough the driver.
Number of Stations Being Polled
One other drawing method specialized for polling drivers is the Polled Station.When added to a page, this numeric display will tell you how many RTU’s are cur-rently being polled by your application. An asterisk (*) indicates that none areavailable to count (this is most often seen during configuration but may indicate aserious communications failure).
Fast versus Normal Polling
A draw method available to each polling driver is the Fast Scan Button. Whenadded to a page, this allows operators to switch the system into a rapid pollingmode. Options available to the fast scan mode include:
l Rate of polling. Given in seconds, this allows you to poll the driver at anyrate required while in fast scan mode.
l Active time. Also provided in seconds, this provides security against for-getful operators by setting a maximum time for the driver to remain in fastpolling mode.
You can tell the system to stop fast scanning when the page containing this but-ton is not currently displayed. For example, if the button to enable fast scanning ispart of a pop-up window and this option is selected, then as soon as the windowcloses, polling will return to normal.
Operation and Configuration Student Workbook • 65

Chapter 6
The Tag BrowserAll tags are created and configured using the Tag Browser. You can open thistool from within the Idea Studio, or directly from the title bar of your application.
Figure 6-2 Opening the Tag Browser
Figure 6-3 Parts of the Tag Browser
Using the Tag BrowserTag CountThe numbers at the top of the tag browser tell you many things.
Figure 6-4 The Tag Browser title
Matches: The number of tags displayed in the main window. This is a function ofthe selected parent (left window) and any filters you may be using.Running: Total count of tags that are not currently disabled. Includes every wid-get, image, shape, page menu, etc.
-
66 • Operation and Configuration Student Workbook
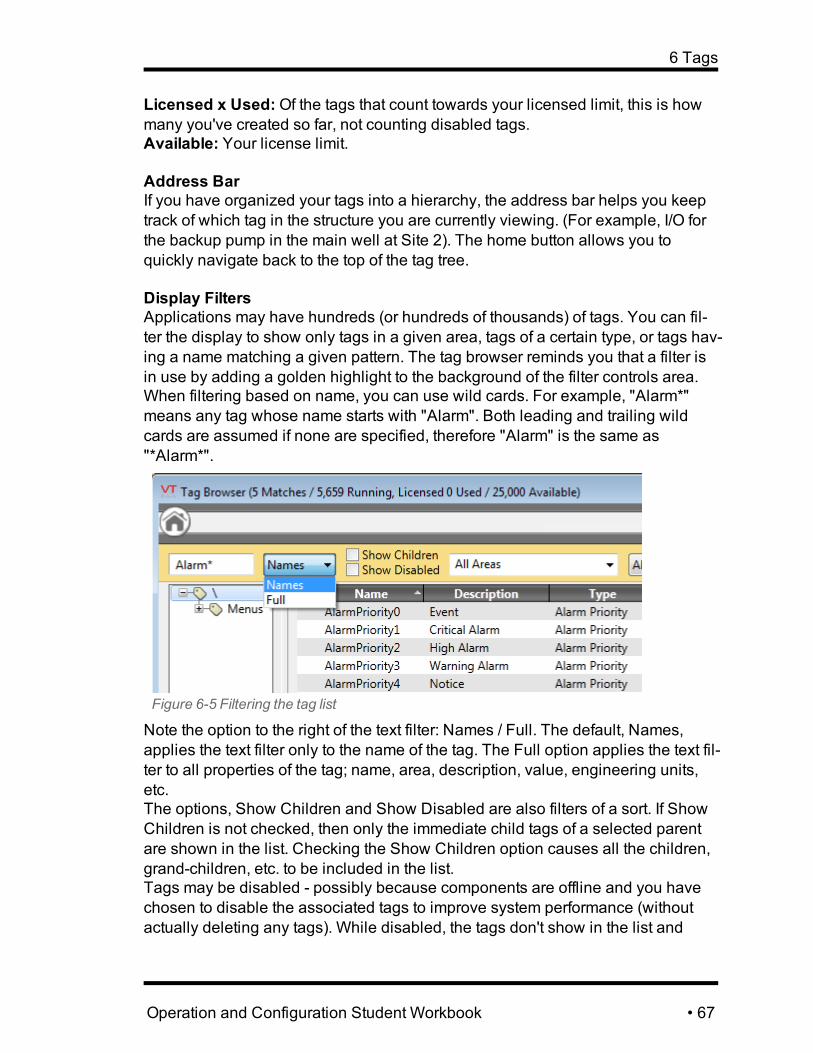
6 Tags
Licensed x Used:Of the tags that count towards your licensed limit, this is howmany you've created so far, not counting disabled tags.Available: Your license limit.
Address BarIf you have organized your tags into a hierarchy, the address bar helps you keeptrack of which tag in the structure you are currently viewing. (For example, I/O forthe backup pump in the main well at Site 2). The home button allows you toquickly navigate back to the top of the tag tree.
Display FiltersApplications may have hundreds (or hundreds of thousands) of tags. You can fil-ter the display to show only tags in a given area, tags of a certain type, or tags hav-ing a name matching a given pattern. The tag browser reminds you that a filter isin use by adding a golden highlight to the background of the filter controls area.When filtering based on name, you can use wild cards. For example, "Alarm*"means any tag whose name starts with "Alarm". Both leading and trailing wildcards are assumed if none are specified, therefore "Alarm" is the same as"*Alarm*".
Figure 6-5 Filtering the tag list
Note the option to the right of the text filter: Names / Full. The default, Names,applies the text filter only to the name of the tag. The Full option applies the text fil-ter to all properties of the tag; name, area, description, value, engineering units,etc.The options, Show Children and Show Disabled are also filters of a sort. If ShowChildren is not checked, then only the immediate child tags of a selected parentare shown in the list. Checking the Show Children option causes all the children,grand-children, etc. to be included in the list.Tags may be disabled - possibly because components are offline and you havechosen to disable the associated tags to improve system performance (withoutactually deleting any tags). While disabled, the tags don't show in the list and
Operation and Configuration Student Workbook • 67

Chapter 6
don't count towards you license limit. To see them (subject to other filters beingactive), check the Show Disabled option.
List SortingYou can sort the display by any of the column headings, Name, Description,Type, or Area. Just click on the column header to sort in ascending order, or clickagain to sort in descending order. The first column is unlabeled and is used toshow descriptive symbols that may provide extra information about tags. You canalso sort by these.
Tag TreeThe window on the left shows the tag tree structure, including only the parenttags. This can be used to quickly navigate to components of interest. You canhide this section of the screen if necessary by double-clicking on the vertical bardividing it from the main list.
Tag List and Control ButtonsThe largest area of the Tag Browser is taken up by the tag list. As noted, this listcan be sorted and filtered as required. Note the value column - this is con-tinuously updated, giving you a very handy way to see current tag values. (Espe-cially if the list has been sorted to show only tags in an area of interest.)
Add and Configure TagsTo add a new tag at the currently selected level of the tag tree, click the buttonlabeled, "New".
Figure 6-6 Adding a new tag
You can also add a new tag directlyunder any level of the tag tree, includ-ing the root, by right-clicking andselecting "New Child" from the menuthat opens.
Unless you are adding a type to themenu section, the Select Type dialogwill open. If the list is currently filteredby type, then that type will be shownas the default choice in the list, butyou are still able to choose any othertype. (Be careful of that: if you create atype that the display isn't filtered toshow, then you won't see what you create until the filter is removed.)
-
68 • Operation and Configuration Student Workbook
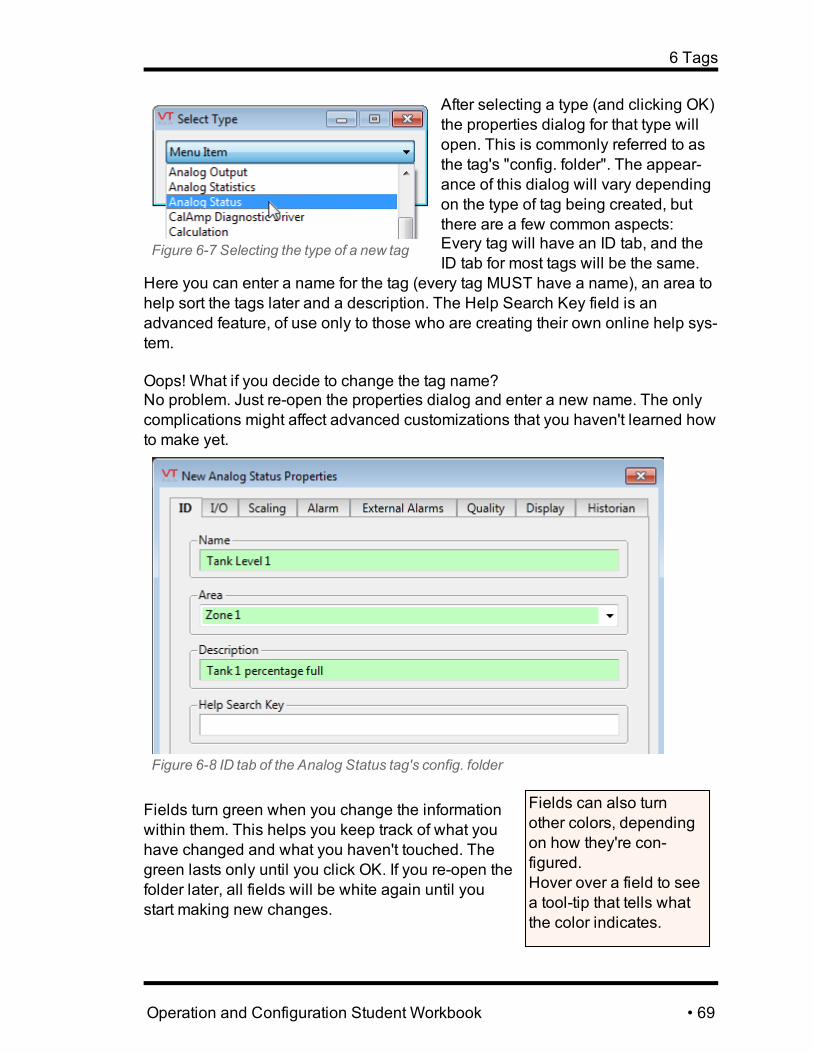
6 Tags
Figure 6-7 Selecting the type of a new tag
After selecting a type (and clicking OK)the properties dialog for that type willopen. This is commonly referred to asthe tag's "config. folder". The appear-ance of this dialog will vary dependingon the type of tag being created, butthere are a few common aspects:Every tag will have an ID tab, and theID tab for most tags will be the same.
Here you can enter a name for the tag (every tag MUST have a name), an area tohelp sort the tags later and a description. The Help Search Key field is anadvanced feature, of use only to those who are creating their own online help sys-tem.
Oops! What if you decide to change the tag name?No problem. Just re-open the properties dialog and enter a new name. The onlycomplications might affect advanced customizations that you haven't learned howto make yet.
Figure 6-8 ID tab of the Analog Status tag's config. folder
Fields can also turnother colors, dependingon how they're con-figured.Hover over a field to seea tool-tip that tells whatthe color indicates.
Fields turn green when you change the informationwithin them. This helps you keep track of what youhave changed and what you haven't touched. Thegreen lasts only until you click OK. If you re-open thefolder later, all fields will be white again until youstart making new changes.
Operation and Configuration Student Workbook • 69
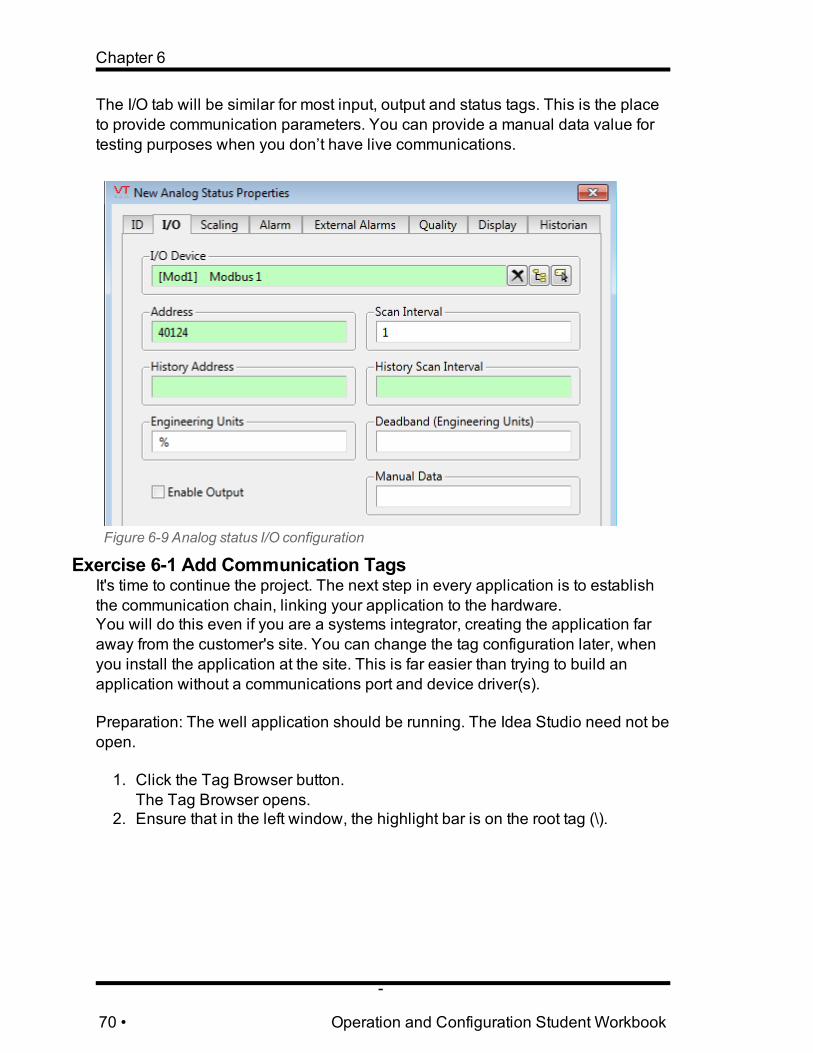
Chapter 6
The I/O tab will be similar for most input, output and status tags. This is the placeto provide communication parameters. You can provide a manual data value fortesting purposes when you don’t have live communications.
Figure 6-9 Analog status I/O configuration
Exercise 6-1 Add Communication TagsIt's time to continue the project. The next step in every application is to establishthe communication chain, linking your application to the hardware.You will do this even if you are a systems integrator, creating the application faraway from the customer's site. You can change the tag configuration later, whenyou install the application at the site. This is far easier than trying to build anapplication without a communications port and device driver(s).
Preparation: The well application should be running. The Idea Studio need not beopen.
1. Click the Tag Browser button.The Tag Browser opens.
2. Ensure that in the left window, the highlight bar is on the root tag (\).
-
70 • Operation and Configuration Student Workbook

6 Tags
Figure 6-10 New tags are added below the selected parent
3. Click the button labeled "New".The Select Type dialog opens.
4. Find and select the type, TCP/IP Port.The list is sorted alphabetically.
5. Click OK.The New TCP/IP Port Properties dialog opens. Since this exercise uses asimulator, you will configure this tag so that your computer talks only toitself.
6. In the name field, type, "T_Port1".7. In the Area field, use the drop-down selector to choose "System".8. In the Description field, type, "Local TCP Port".
Figure 6-11 TCP Port ID properties
9. Click the Connection tab to open that page of the config. folder.10. Set the TCP/IP address to "localhost".11. Set the port number to "502".12. Click OK to close and save this tag configuration
In the next set of steps, you will link a device driver to this port. But, rather thanadding it at the same level in the tag tree, you will add it as a child of the TCP/IPPort tag.Note that the tag you just created shows in the main window, but not in the left win-dow of the Tag Browser.
Operation and Configuration Student Workbook • 71

Chapter 6
1. Find T_Port1 in the tag list and right-click on it.2. Click on New Child from the menu that opens.3. Select the type, WellSim, then click OK.
The properties dialog opens. Note the name field. The name of the parenttag will be part of the name of the child tag.
4. Enter, "PLCSim" as the name of the WellSim driver.5. There is no need to change the Area in this case - it will inherit the same
area value as the parent tag's6. Enter "PLC Simulator" as the description.7. Click on the Serial tab.8. Note that the port is already configured. This is one of the benefits of organ-
izing tags in a tree structure. Where appropriate, child tags will look to theirparents to take configuration information. If you were to later create a newport and then copied this tag to become a child of that other port, youwouldn't have to change the port configuration - the new child would auto-matically use the new parent.
9. Click OK to save and close the configuration.
Move the pointer overthe tag browser symbolsto see a tool-tip describ-ing each symbol.
Note the tag browser. In the tag list, the T_Port1 tagnow has a symbol indicating that it is a parent tag.The tag tree window also shows the T_Port1. If youclick on that tag in the tree, you will see only its child,PLCSim, in the tag list. The symbol beside it indic-ates that it's a tag you created. At the top of the tagbrowser, the address bar now shows that you are viewing only the child tags ofT_Port1.The count of 1 used (Tag Browser title bar) is interesting. Ports and drivers do notcount against your licensed limit, but user-created tags do. The simulator is auser-created tag, therefore PLCSim is counted even though it is also a driver.
-
72 • Operation and Configuration Student Workbook

6 Tags
Figure 6-12 The Tag Browser at the end of the last exercise
Update TypeIt is very convenient to configure your tags in a hierarchy. As you saw in the lastexercise, tags will look to their parents to configure linkages (I/O tags look for par-ent drivers, driver tags look for parent ports.) Certain configuration informationsuch as Area is automatically inherited. Tag hierarchies are tidy when your applic-ation grows to have hundreds, thousands, or hundreds of thousands of tags.
But, there is one thing to be cautious of: Update Type.
Figure 6-13 The Update Type command
Operation and Configuration Student Workbook • 73
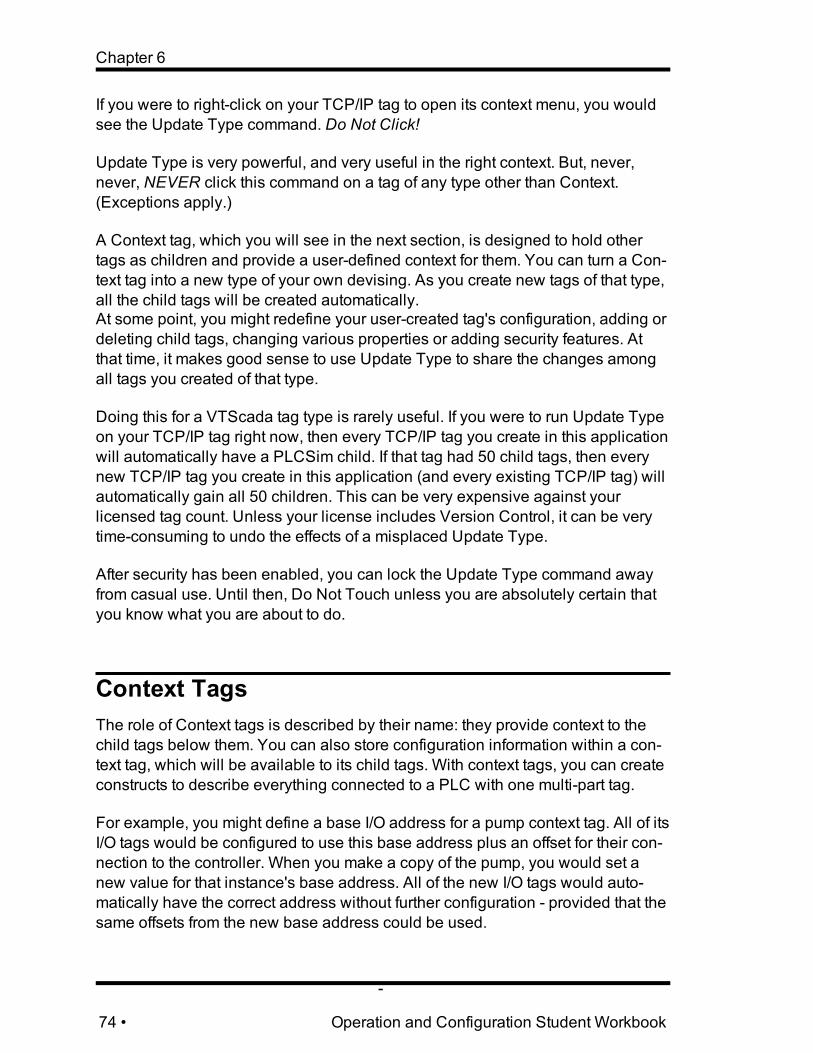
Chapter 6
If you were to right-click on your TCP/IP tag to open its context menu, you wouldsee the Update Type command. Do Not Click!
Update Type is very powerful, and very useful in the right context. But, never,never, NEVER click this command on a tag of any type other than Context.(Exceptions apply.)
A Context tag, which you will see in the next section, is designed to hold othertags as children and provide a user-defined context for them. You can turn a Con-text tag into a new type of your own devising. As you create new tags of that type,all the child tags will be created automatically.At some point, you might redefine your user-created tag's configuration, adding ordeleting child tags, changing various properties or adding security features. Atthat time, it makes good sense to use Update Type to share the changes amongall tags you created of that type.
Doing this for a VTScada tag type is rarely useful. If you were to run Update Typeon your TCP/IP tag right now, then every TCP/IP tag you create in this applicationwill automatically have a PLCSim child. If that tag had 50 child tags, then everynew TCP/IP tag you create in this application (and every existing TCP/IP tag) willautomatically gain all 50 children. This can be very expensive against yourlicensed tag count. Unless your license includes Version Control, it can be verytime-consuming to undo the effects of a misplaced Update Type.
After security has been enabled, you can lock the Update Type command awayfrom casual use. Until then, Do Not Touch unless you are absolutely certain thatyou know what you are about to do.
Context TagsThe role of Context tags is described by their name: they provide context to thechild tags below them. You can also store configuration information within a con-text tag, which will be available to its child tags. With context tags, you can createconstructs to describe everything connected to a PLC with one multi-part tag.
For example, you might define a base I/O address for a pump context tag. All of itsI/O tags would be configured to use this base address plus an offset for their con-nection to the controller. When you make a copy of the pump, you would set anew value for that instance's base address. All of the new I/O tags would auto-matically have the correct address without further configuration - provided that thesame offsets from the new base address could be used.
-
74 • Operation and Configuration Student Workbook

6 Tags
When you copy a contexttag, you get copies of allthe child tags.
If you delete a contexttag, you also delete all ofits children.
Context tags can be turned into new tag types.You can then create new Pumps, Motors, Wells,etc. directly, using your new tag types. You canalso create your own tag drawing methods,designed specifically for your new tag types. Com-plete new stations can then be created and drawn- with extensive monitoring, control and alarm con-figuration - without needing to laboriously createand draw every single tag within the station.
Exercise 6-2 Create a Context TagYou will create a Context tag for the water tower. Later exercises will add theI/O for the sensors in the tower.
1. If the Tag Browser is not currently open, open it now.2. Right-click on Root tag, (\) and select New Child from the menu that
opens.3. Set the Type to Context and click OK.
The properties dialog opens.4. Set the name to "Tower1".5. Set the area to "Tufts".6. Set the description to "Water Tower".
This tag will not be turned into a new type, therefore the Type field is notrequired.
7. Click OK to save and close.
Operation and Configuration Student Workbook • 75

Chapter 6
Figure 6-14 The Tufts water tower Context tag.
Exercise 6-3 Add a Polling DriverA Polling Driver is being created, simply for the sake of giving you a chance tosee how one works and is used. Only one will be created.
1. Right-click on Tower1 and select New Child.2. Set the type to Polling Driver and click OK.3. Set the name to "Tufts Stn.".4. The area will be pre-filled from the parent tag.5. Set the description to "Tufts Station".6. Open the I/O tab of the Polling driver's properties folder.
The I/O Device shows "Missing". This is because you are not creating thistag as a child of a driver. You will need to select one instead of using theautomatic configuration feature.
7. Click the Tag Browser button.
-
76 • Operation and Configuration Student Workbook

6 Tags
Figure 6-15 The Tag Browser button within a properties dialog.
8. Find and select PLCSim, below T_Port1.9. Change the Scan Interval to 2 seconds from 60.10. Open the Display tab.11. Below Latitude, click the check box "Constant".12. Set the latitude to 45.09113. Below Longitude, click the check box "Constant".14. Set the longitude value to -64.374
Yes, there is a much easier way to set latitude and longitude.15. Click OK to save your work and close the properties dialog.
Read Analog ValuesVTScada provides two types of tag for reading analog values. These are the Ana-log Input tag and the Analog Status tag.An Analog Input tag will read values from a specified address on a PLC, applyingthe scaling factor that you specify to turn raw values into something that's mean-ingful in human terms.An Analog Status tag will do exactly the same thing. But, it also provides for twopossible alarms (high and low), built-in data logging, and the ability to read historyvalues from a second address if this feature is available on the equipment.
In order to perform these extra functions, the Analog Status tag has more codeand therefore uses slightly more system resources. If all you need is a display ofthe values being read from equipment, choose the Analog Input tag for the sake ofefficiency. Should you decide later that the data needs to be logged or that alarmsshould be activated when the value goes out of range, you can easily attach aLogger tag and Alarm tags to the Analog Input. Keep in mind that logger tags andalarm tags do not count against your licensed tag limit, so the only cost is the con-figuration time.
Much the same is true of the following tag pairs:
Operation and Configuration Student Workbook • 77

Chapter 6
Basic tag Full-featured versionAnalog Input Analog Status
Digital Input Digital Status
Analog Output Analog Control
Digital Output Digital Control
One more tag deserves mention in this list: The Pump Status tag is nearlyidentical to the Digital Status tag, but includes extra features for report generationthat are not part of the more generic Digital Status tag.
Both the Analog Input and the Analog Status share the following configurationproperties to enable them to read values from the hardware:
l They must be told what device driver tag to use. You can't read data from aSiemens device using an Allen Bradley driver, and you can't read from anydevice without the appropriate driver. Oddly, the most common mistakeseen in courses is to leave the driver field blank.
l They must be told the I/O address to use in the controller or RTU. Addressformats will vary by driver.
l They must know the scaling factor required to convert raw numbers from thesensors into values that are meaningful in human terms.
Exercise 6-4 Create Analog I/O TagsThe overall configuration of the water tower is as follows: Two analog sensorshave been installed. The first measures the height of the water in the tower as apercentage of the overall capacity. The second measures the air pressure abovethe water in the tower, (just because that's how the simulator was programmed).Two addresses on the programmable logic controller at this location are used toallow the operator to write set points for two alarms: Water level too high andwater level too low. In addition, the controller is configured so that the values setat these addresses are written back via another address for the purpose of con-firming that the signal was received correctly.
In this exercise, you will create four analog tags for reading values from the con-troller: water level, water pressure, low alarm set point confirmation and highalarm set point confirmation.The first two should be logged and will therefore be created as Analog Statustags. There is no need to log the set point confirmations, so Analog Input tagscould be used for those, but common practice is to pick one (input or status) andstay with it, so that is what will be done here, with logging switched off.
All of the following should be created as children of the Context tag, "Tower 1".
-
78 • Operation and Configuration Student Workbook

6 Tags
Tag 1 - Water level in the tower1. If the Tag Browser is not open, reopen it now.2. Expand the tag tree so that you can see the context tag, Tower 1.3. Right-click on Tower1 and click Add New Child from the menu.4. Select Analog Status as the type.
Careful! It's easy to choose Alarm Status by mistake.5. Type, "Level" as the name.6. Type, "Percentage full" as the description.
The Area will already be the same as the parent tag's.7. Click on the I/O tab.8. Click the Tag Browser button, to the right of the I/O Device field.9. Select the Polling Driver, Tufts Stn.10. Set the address to 40050.11. Ensure that the Engineering Units are set to "%".12. Set the Deadband value to 0.1.13. Click the Scaling tab.14. Ensure that the Scaled Process Data Min is 0 and that the Scaled Process
Data Max is 100.15. Click OK to save your work.
The value column should show a very small amount, usually 1.7. This is an arti-fact of the simulator code.
Tag 2 - Water pressure in the tower.1. Repeat the previous steps to create another Analog Status tag, except
change the following parameter's values:
Name Pressure
Description Water pressure
Address 40051
Eng. Units psi
Scaled Process Data Min 15
Scaled Process Data Max 200
2. Click OK to save your work.
Tag 3 - Low alarm set point feedback.1. Create another Analog Status tag using the following values:
Name AlmLowVerify
Operation and Configuration Student Workbook • 79

Chapter 6
Description Verify low alarm set point
Address 40053
Eng. Units %
Scaled Process Data Min 0
Scaled Process Data Max 100
2. Open the Historian tab of the properties dialog.3. Click the X to remove the historian.
This prevents logging of the tag's values. Always log what will be needed ina future report, and don't log anything that you are absolutely certain willnever be needed in a report. Keep in mind that there is no way to recreatehistorical values if you haven't logged them.
4. Click OK to save your work.
Tag 4 - High alarm set point feedback.1. Create another Analog Status tag using the following values:
Name AlmHighVerify
Description Verify high alarm set point
Address 40054
Eng. Units %
Scaled Process Data Min 0
Scaled Process Data Max 100
2. Ensure that no historian is attached to this tag.3. Click OK to save your work.
Draw Widgets & Link to TagsTags are represented by widgets. Some developers like to create pages and wid-gets first, laying out the entire design of the system before creating tags. Othersprefer to create their tags first, then draw the widgets to represent those tags.You can use which ever method you prefer, or a combination of the two.There is no rule that every tag must be shown, nor is there a limit on how manytimes widgets can be linked to the same tag. For instance, you might wish to dis-play the current level of fluid in a tank using both a vertical bar and a numericvalue.
-
80 • Operation and Configuration Student Workbook

6 Tags
Widgets that are not linked to tags will display a value (based on a sine-wave gen-erator built into VTScada ,) so that they look realistic. They will also display a veryclear indicator so that you know the value isn't coming from an actual tag.
Figure 6-16 The unlinked widget indicator
Figure 6-17 The global unlinked widget indicator
Note that this indicator is sup-pressed by default for individual wid-gets, replaced by a global indicatorin the title bar. One of the first thingsyou should do in every new projectis click this indicator in the title bar to show the individual indicators. You won't beable to do this until there is at least one unlinked widget in a currently open page.
Exercise 6-5 Draw a WidgetPreparation: If the Tag Browser is open, close it now.
1. Open the Idea Studio.2. Select the page, Tower Details.
Note that the white area does not fill the screen (depending on how largethe Idea Studio is on your computer). The white rectangle marks the pagesize that you set when you created this page. You can draw outside thatarea, but should try not to. Increase the values for the page size instead ifmore room is required.
3. Open the Widget palette if it is not already open.4. Open the Basic Components folder, within the Widget palette.5. Open the Bars folder.6. Drag the Color Fill to the page, placing it relatively near the upper-left
corner.The Widget tools - Format toolbar should now be open. If you were todeselect the Color Fill that you just drew, then that toolbar would close.Don't do that. Ensure that the widget remains selected on the page for thenext step.
7. Click the Properties button in the Format toolbar.A Color Fill has three colors. You are about to change the Unfilled Colorand the Bar Color.
8. Click the Unfilled Color button.The Select Color dialog opens.
9. Select black, then click OK to close the dialog.10. Click the Bar Color button.
Operation and Configuration Student Workbook • 81

Chapter 6
11. Select a shade of blue to represent water, then click OK to close the dialog.12. Close the Idea Studio13. Open the Tower Details page.
The widget should be visible and display a fluctuating water level.
Exercise 6-6 Show Unlinked Widget Indicators.1. Click the unlinked widget indicator / button in the title bar.
A prompt will open, warning you that this change will affect all operators andasking for confirmation that you want to continue.
2. Click, Yes.The Color Fill should now have a blinking indicator, showing that it has notyet been linked to any tag. This is a very helpful indicator as you build yourapplications.
Exercise 6-7 Link a Widget to a Tag
1. Reopen the Idea Studio.2. Select the Color Fill in the Tower Details page.3. Click the Link tool in the Format ribbon.
You could also right-click on the Color Fill and find the Link command in themenu that opens.
4. Select the tag, Level, below Tower 1.The bar stops changing, and shows a nearly empty (black) region. Since thetower is only +/- 1.7 % full, this is correct.
Exercise 6-8 Provide Context for a WidgetThe Color Fill that is linked to the tower's water level is useful so far as it goes, butit's not obvious what the bar height represents. For that, images are useful, inorder to provide context.
1. Open the Images palette.2. Open the Imported Images folder.3. Click the Add New button.4. Select Image in the dialog that opens.5. Browse to the Course folder if it does not reopen automatically.6. Find and select the image, SmallTower.png7. Click Open.
A preview of the tower appears in the New Menu Item Properties dialog.8. Click OK.9. Drag the tower to the page.10. Select the Color Fill.
If the Color Fill is behind the tower, you will need to click twice to changethe selection from the image in front to the Color Fill in back.
-
82 • Operation and Configuration Student Workbook

6 Tags
11. Adjust the size of the Color Fill by doing the next three steps sim-ultaneously:a. Click on one of the corner grips of the Color Fill and continue to hold
the left mouse button down.b. Press and hold both the Shift key and the Ctrl key on the keyboard
with your other hand.Shift releases the aspect ratio lock. Ctrl releases alignment snap.
c. Drag the corner until it aligns with the matching corner of the windowcut into the tower.
Figure 6-18 Adjustingthe corner location
12. Repeat for the opposite corner of the Color Fill.Remember that it is possible to adjust the scale of the Idea Studio if you need tozoom in for a closer view. Always reset the scale to 100% later, so that you seethe screen full-sized as it will appear to operators.
With the tower in place and the Color Fill bar widget shown only in the cut-awaywindow, it is now obvious to operators what this widget represents.
Exercise 6-9 Practice with Widgets and LinkingThis exercise provides minimal instructions, so that you will have a chance topractice what you have learned so far.
1. Place a Numeric Value widget beside the tower. (This widget can be foundin the Widgets palette, Basic Components >> Text folder).
2. Link the Numeric Value to the Level tag.3. Repeat for the tag, Pressure.
Figure 6-19 Three widgets, two showing the tank's level
Exercise 6-10 Polling Drivers Reprise
Operation and Configuration Student Workbook • 83

Chapter 6
Now that your Polling Driver has I/O tags attached, its time to see one of the bene-fits of using this type of driver tag. You will draw a Site Draw widget on the supplymap, and link it to the driver. Then, you can click the Site Draw to open a sitepage.
1. Open the Idea Studio.2. Open the Supply Map page.3. Select the Widgets palette.4. Open the Tag Types folder.5. Open the I/O Devices (Drivers) folder.6. Open the Link Management folder.7. Open the Polling Driver folder.8. Drag a Site Draw widget to the Supply Map page, putting it close to Robie
Tufts Drive.
Figure 6-20 Robie Tufts Drive
9. Link the Site Draw to the Polling Driver, Tufts Stn.10. Return to the top-level folder in the Widgets palette.11. Open the Tools folder.12. Open the Site Tools Library folder.13. Drag the Site Legend to the empty space left and above Robie Tufts Drive.
The Site Legend is an image, not a widget, but for historical reasons it isincluded in this library.
14. Close the Idea Studio.15. Open the Supply Map page.16. Click the Site Draw.
A Site Page opens, showing driver status and statistics, and all I/O tags thatare using that driver.
-
84 • Operation and Configuration Student Workbook
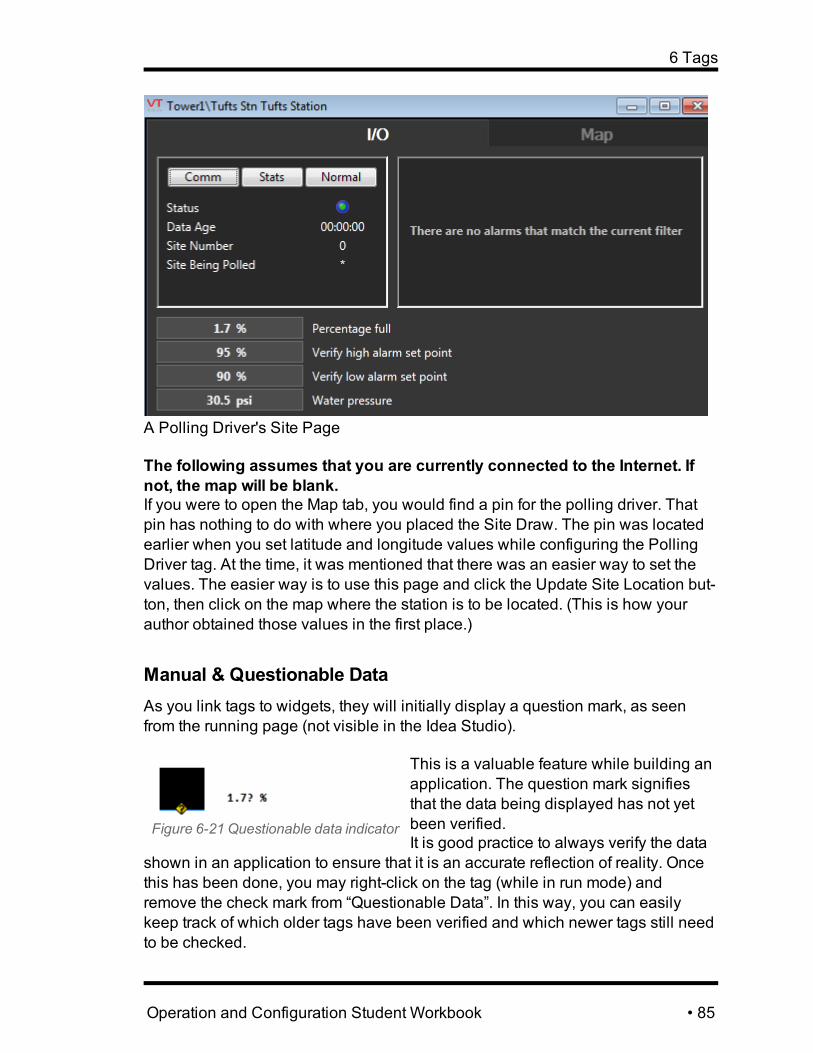
6 Tags
A Polling Driver's Site Page
The following assumes that you are currently connected to the Internet. Ifnot, the map will be blank.If you were to open the Map tab, you would find a pin for the polling driver. Thatpin has nothing to do with where you placed the Site Draw. The pin was locatedearlier when you set latitude and longitude values while configuring the PollingDriver tag. At the time, it was mentioned that there was an easier way to set thevalues. The easier way is to use this page and click the Update Site Location but-ton, then click on the map where the station is to be located. (This is how yourauthor obtained those values in the first place.)
Manual & Questionable DataAs you link tags to widgets, they will initially display a question mark, as seenfrom the running page (not visible in the Idea Studio).
Figure 6-21 Questionable data indicator
This is a valuable feature while building anapplication. The question mark signifiesthat the data being displayed has not yetbeen verified.It is good practice to always verify the data
shown in an application to ensure that it is an accurate reflection of reality. Oncethis has been done, you may right-click on the tag (while in run mode) andremove the check mark from “Questionable Data”. In this way, you can easilykeep track of which older tags have been verified and which newer tags still needto be checked.
Operation and Configuration Student Workbook • 85

Chapter 6
Manual data allows you to set a constant value for a tag. This can be useful to testa system before it is connected to a live data source. By experimenting with arange of manual data values you can verify that alarms and other features of a tagare working as expected as you continue to build the system.When manual data is set, an exclamation mark will appear on the tag’s drawingmethod.
As you create tags in the following exercises, none of the steps will tell you toswitch off the Questionable flag, but feel free to do so.
Reusable TagsThe Tufts water tower is being created using the simplest possible configuration.This is a tried and true method of building an application, but it doesn't offer thetime-savers possible in VTScada. By way of contrast, the wells will be created touse as much automation as possible. First, you will need to learn a little about theVTScada expression language.
Simple Expressions
In the introduction to Context tags, you read that they could be configured withconfiguration properties that would be accessible to their child tags. An examplewas offered for using a base address for the PLC and calculated offsets foraddresses within the PLC in order to automate configuration. In this topic, you'lllearn how to build this using the VTScada expression language.
An expression is anything that can be calculated to find a value. For example, "2+ 2" is an expression. It returns 4. There is no need to include an equals sign "=",it is enough just to provide operands such as "2" and operators such as "+".The operands can be named. For example, the expression might be written as "X+ X". Now, all that's needed is a way to put a value into X and you can calculateanything.
That's as complex as expressions need to be in order to continue with the applic-ation that you're building. But, rest assured that the VTScada expression lan-guage allows you to build far more complicated and powerful calculations.
Suppose that you have many pumps as part of water system. The I/O addressesfor three are as follows (using a Modicon addressing format):
Sensor Pump 1 Pump 2 Pump 3Speed 41001 42001 43001
Temperature 41002 42002 43002
Flow Rate 41003 42003 43003
-
86 • Operation and Configuration Student Workbook

6 Tags
Note that, from one pump to the next, the second digit is the one that changes.Speed is always xx001 Temperature is xx002 and Flow Rate is always xx003.
A system where addresses are defined as a base value plus an offset could beused here. For example, the address expression for the speed sensor would be"Base Address + 001". The expression for the temperature would be "BaseAddress + 002". Now, all that's required is a way to hand a suitable base addressto each pump: 41000 for pump 1, 42000 for pump 2, and so on. Returning to theapplication that you're building, the base address will be stored within a propertythat you will add to a Context tag.
Exercise 6-11 Create a Context Tag with a PropertyThis tag will make use of parent-child inheritance.
1. Open the Tag Browser if it is not already open.2. Right-click on PLCSim and select New Child from the menu that opens.3. Select the Context type.4. In the properties dialog, set the name to "ElmWell".
Spaces are being left out of the name for the sake of making a later exerciseeasier.
5. Set the area to "Elm".6. Set the description to "Primary water supply".7. Type "Well" in the Type field.
Operation and Configuration Student Workbook • 87
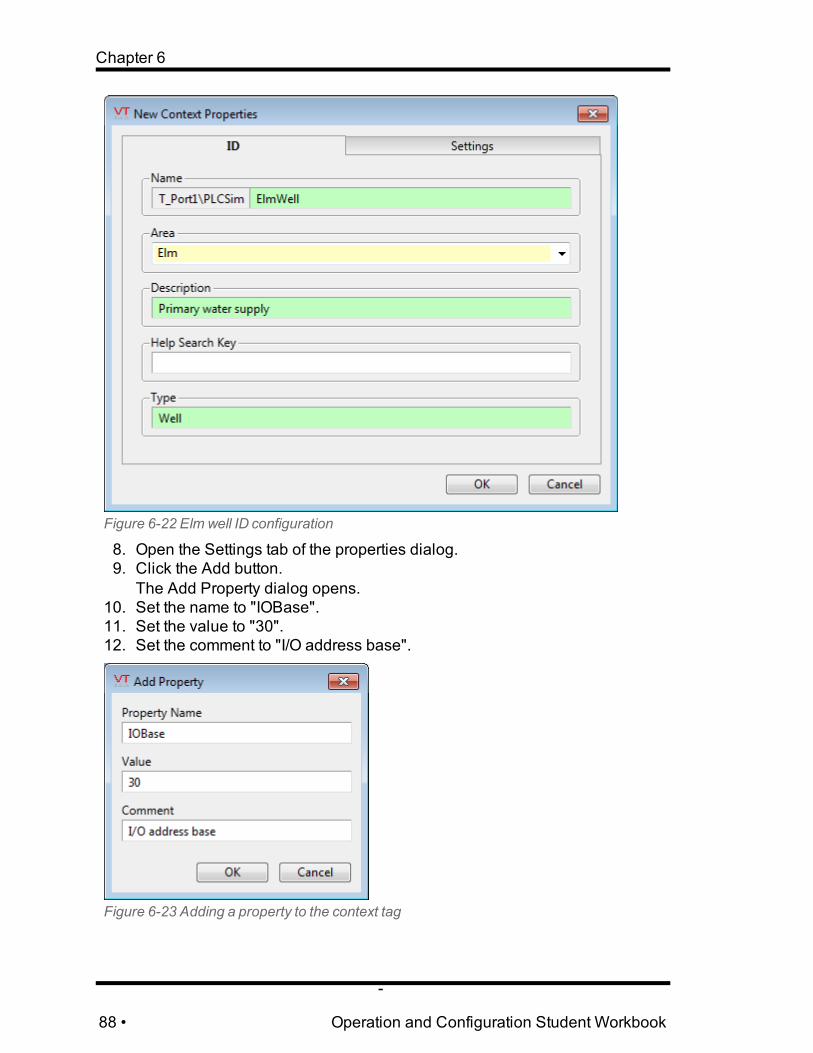
Chapter 6
Figure 6-22 Elm well ID configuration
8. Open the Settings tab of the properties dialog.9. Click the Add button.
The Add Property dialog opens.10. Set the name to "IOBase".11. Set the value to "30".12. Set the comment to "I/O address base".
Figure 6-23 Adding a property to the context tag
-
88 • Operation and Configuration Student Workbook

6 Tags
13. Click OK.14. Add two more properties, Latitude and Longitude.
Do not set values. The comment can be copied from the name in each case.Be careful to spell the words correctly, otherwise you won't be able to drawthis tag on a map.
Figure 6-24 The configured tag
15. Click OK to save your work and close the properties dialog.
There is no need to repeat this for the second well. Remember that the plan is touse automation to save work. But, there's more configuration to do first.
Exercise 6-12 Monitor Well Depthl Sensors in the well will record water depth as percentage full.l An alarm will be configured to warn when the value goes too low.l The operator will be able to control the alarm setpoint.l The controller is configured to provide feedback confirmation of that setpointvia a separate address.
Preparation: If the Idea Studio is open, close it. Open the Tag Browser.
1. Expand the tag tree so that you can see the Context tag, ElmWell.2. Right-click on ElmWell and click Add New Child from the menu.3. Select Analog Status as the type.4. Type, "Level" as the name.5. Type, "Percentage full" as the description.
The Area will already be the same as the parent tag's.
Operation and Configuration Student Workbook • 89

Chapter 6
6. Click on the I/O tab.Note that the driver field is probably pre-filled with the same driver (TuftsStn) used in the last Analog Status tag you created. This will not be correct.
7. Click the Tag Browser button to the right of the I/O Device field, then findand select PLC Simulator.The field should read, [*Driver] PLC Simulator. The portion in square brack-ets tells you that VTScada is using code to link to the first driver foundabove this tag, and the description tells you which tag that is..
In the next few steps, you will set the I/O address of the level sensor. But, ratherthan simply typing in the value, you will use an expression that calculates theaddress from the base I/O address defined in the parent Context tag. This is beingdone so that, when you add a new well, you will only need to change the base I/Oaddress in the new parent.8. Right-click in the Address field.9. Select, Add Snapshot Expression from the menu that opens.
Figure 6-25 Add Snapshot Expression
10. The Snapshot Expression editor opens.11. Type "..\IOBase + 40000".
Figure 6-26 A snapshot expression
12. Click the OK button to save the expression.The address field should show 40030, against a blue background.
13. Set a value of 0.1 in the Deadband field.14. Click on the Scaling tab to open that panel.
Raw data from the sensors ranges from 0 to 4095, so the two unscaled pro-cess values are correct. A percentage range is from 0 to 100.
15. Ensure that the Scaled Process values are 0 and 100, respectively.This is all that you will configure in the Analog Status tag for now.
16. Click OK to save your work.
-
90 • Operation and Configuration Student Workbook

6 Tags
You should expect the value to read approximately 90%. Since we have not yetadded a pump to extract water from the well, the simulator has it nearly full.
Exercise 6-13 Draw the wellYou will need both an image of a well and an Analog Status drawing method thatwill dynamically display the fluid level.
1. Close the Tag Browser.2. Open the Idea Studio to the page, Well Details.3. Open the Widgets palette, ensuring that the top level folder is open.4. Open the Basic Components folder, within the Widget palette.5. Open the Bars folder.6. Drag the Color Fill to the page, placing it relatively near the center of the
page.7. Click the Properties button in the Format toolbar.8. Click the Unfilled Color button.
The Select Color dialog opens.9. Select black, then click OK to close the dialog.10. Click the Bar Color button.11. Select a shade of blue to represent water, then click OK to close the dialog.12. Link the widget to the Level tag under ElmWell.13. Open the Images palette.14. Find and open the Water & WW folder.15. Drag WetWell 4 to the page.16. Re-size the Color Fill until it matches the interior of the well.
Recall the use of the shift and Ctrl keys to release the various snaps.
Define Your Own AnimationsIf you were to stop the application and re-start it, you would see the well filling.The Color Fill drawing method is designed to display the value of the tag attachedto it as an animated bar.
You can animate any property of any object (widget, image, shape) by linking atag value to the property. The tag must have a value that is appropriate to the para-meter value, so if animating color, you might need to create an expression thattranslates tag values to VTScada color values.
To see how to animate a property, you will draw the well level as a numeric valueand animate its vertical position so that it stays close to the top of the water level.
Exercise 6-14 Animate Text Position
Operation and Configuration Student Workbook • 91

Chapter 6
The coordinate 0,0 is atthe top-left of the page.Numbers increase as youmove down and right.
When animating an object to move or scale, youmust know the range of motion that you will allowfor it. You can use the (X, Y) values at the bottomof the Idea Studio to discover this.
1. Hover the pointer near the top of the well and note the coordinates shownat the bottom of the Idea Studio. Move the pointer to the bottom of the welland note the coordinates there. Subtracting one from the other shows thatthe well has a vertical rise of about 177 pixels. (Perfect accuracy is notrequired.)
Figure 6-27 Y-coordinate at the top of the well.
-
92 • Operation and Configuration Student Workbook

6 Tags
Figure 6-28 Y-coordinate at the bottom of the well.
2. Place a Numeric Value widget near the bottom, right edge of the well.(Even with an empty well, not the bottom of the concrete.)
3. Link the widget to the tag, Level, below ElmWell.
Figure 6-29 Numeric Value placement.
4. Open the Properties dialog for the Numeric Value.5. Expand the menu entry, Vertical Movement.
Figure 6-30 Vertical movement menu
6. Click the Tag Browser button beside the field that says "No tag selected".7. Find and select, ElmWell\Level.8. Set the distance that it will move Up to a maximum of 177 pixels.9. Click OK to save your work.
Operation and Configuration Student Workbook • 93

Chapter 6
The text will now be beside the top of the water level. If you were to stop theapplication and restart it to watch the simulator filling the well, you would see thetext rise from its original location as the well fills.
Exporting and Importing TagsTag configuration data is stored inside each application's controlled version repos-itory. The files cannot be edited there, but tags can be exported to a format thatyou are able to edit. Upon importing that file back into the application, VTScadawill merge all changes found, adding, deleting and changing tags as appropriate.
Note: The application version control system will be covered later in the course,but it is important to be aware of it when importing tag files. Because of applic-ation version control, you cannot do the following:
A. ExportB. Edit the exported file.C. Import. (Synchronize)D. Edit the exported file some more.E. Import again.
If further edits are required, Step D must be: "Repeat steps A through C".The import operation is actually a synchronize operation ("Sync"). This is animport followed immediately by either a fresh write, or by the deletion of the file.This helps you avoid working in a tag file that is out of date, but the best policyremains, "Repeat steps A through C".
The user interface to export and synchronize tags can be found in the ApplicationConfiguration dialog.If you are configuring large numbers of similar tags, it is much faster to createthem in Excel or Access than one-at-a-time in the Tag Browser.
The proper procedure is as follows:A. Create and configure at least one instance of each type of tag that you plan
to use in your application.You must have an example to follow when working in the exported file. Thisinitial tag will show you what configuration details are expected to look like.If you miss one or more tag types, you can repeat the procedure later.
B. Export the tags to Excel or Access.Excel is generally preferred since it allows you to duplicate a group of tags,then go back and edit the names. In Access, every new tag must imme-diately be given a unique name.
-
94 • Operation and Configuration Student Workbook

6 Tags
C. For each type, which will be stored in a separate worksheet or table, makecopies of the example tag row. Edit each new row to have a blank ExportInfo column, its own name, I/O address and other configuration values.
D. You can also edit or delete tags.E. Save your work.F. Using the same tool in VTScada, import the file back into your application
by clicking the Sync button.This can be done while the application is running.
G. If further changes are required, export again and repeat.
Note that the first column for each tag is its unique identifier. If copying a tag to cre-ate more tags, do not copy the contents of the Export Info column. Doing so willcause an error when you synchronize the file back into your application.
Tags to Write ValuesIn many systems, it is the job of the Programmable Logic Controller to look aftercontrol actions such as opening and closing valves, or starting pumps. Even inthese situations, the SCADA system may still be used for some control actions,such as setting alarm levels, and writing values for certain control actions. In thischapter, you will learn about tags that can be used to write to the controller.
Analog Status tags (and Analog Input, Digital Status and Digital Input) can all beconfigured to write as well as read. However, VTScada provides a set of tags thatare expressly designed for writing, and that give you far more control over con-figuration than simply writing using an input tag type. These are the Output andControl tags.
Analog ControlJust as there were two types of tag for reading analog values, Analog Input andAnalog Status, there are two types for writing values: Analog Output and AnalogControl. The difference between the two is not as marked as between AnalogInput and Analog Status, but in general, Control tags (Analog Control and DigitalControl) have more built-in features that Output tags (Analog Output and DigitalOutput).Analog Output and Control tags have the option of being given a data source.This can be used to update the display (if the output is drawn on a page) or it canprovide a value to be written by the tag. If control is done at the PLC, then it is use-ful to have the SCADA display update to show the value most recently written. Ifprogramming exists in the SCADA system to adjust output values in response tooperating conditions, then an expression or a calculation tag might be used as thedata source.
Operation and Configuration Student Workbook • 95
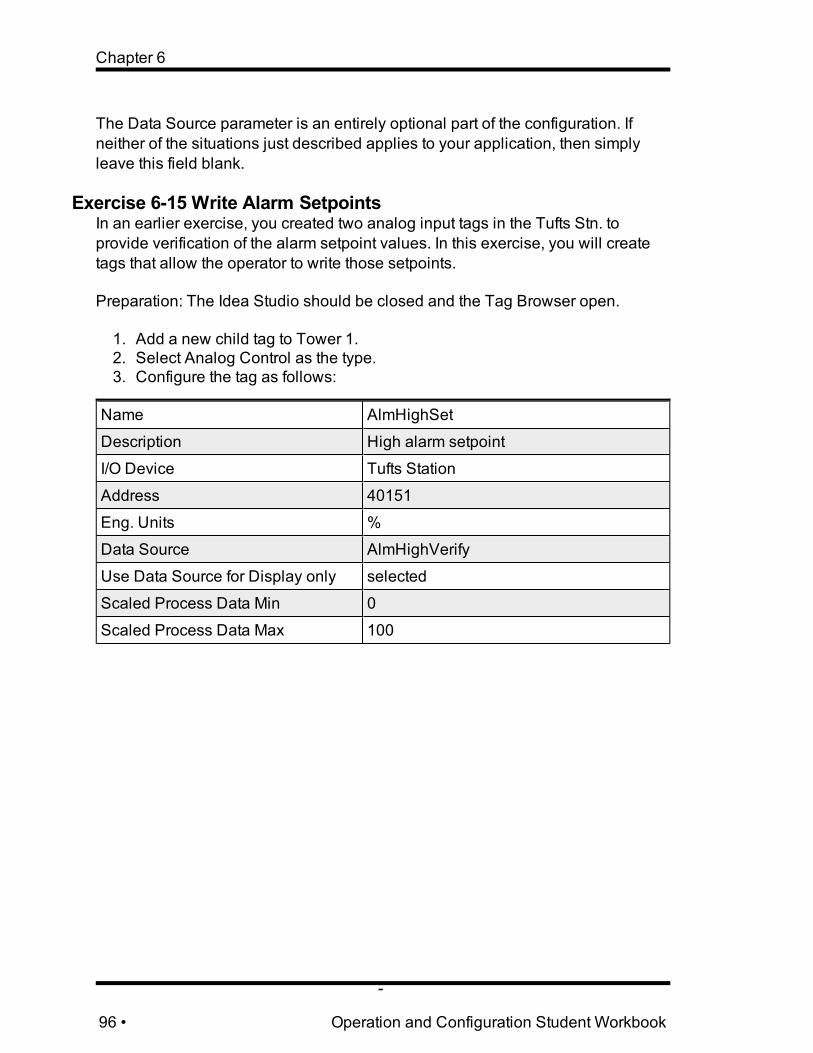
Chapter 6
The Data Source parameter is an entirely optional part of the configuration. Ifneither of the situations just described applies to your application, then simplyleave this field blank.
Exercise 6-15 Write Alarm SetpointsIn an earlier exercise, you created two analog input tags in the Tufts Stn. toprovide verification of the alarm setpoint values. In this exercise, you will createtags that allow the operator to write those setpoints.
Preparation: The Idea Studio should be closed and the Tag Browser open.
1. Add a new child tag to Tower 1.2. Select Analog Control as the type.3. Configure the tag as follows:
Name AlmHighSet
Description High alarm setpoint
I/O Device Tufts Station
Address 40151
Eng. Units %
Data Source AlmHighVerify
Use Data Source for Display only selected
Scaled Process Data Min 0
Scaled Process Data Max 100
-
96 • Operation and Configuration Student Workbook
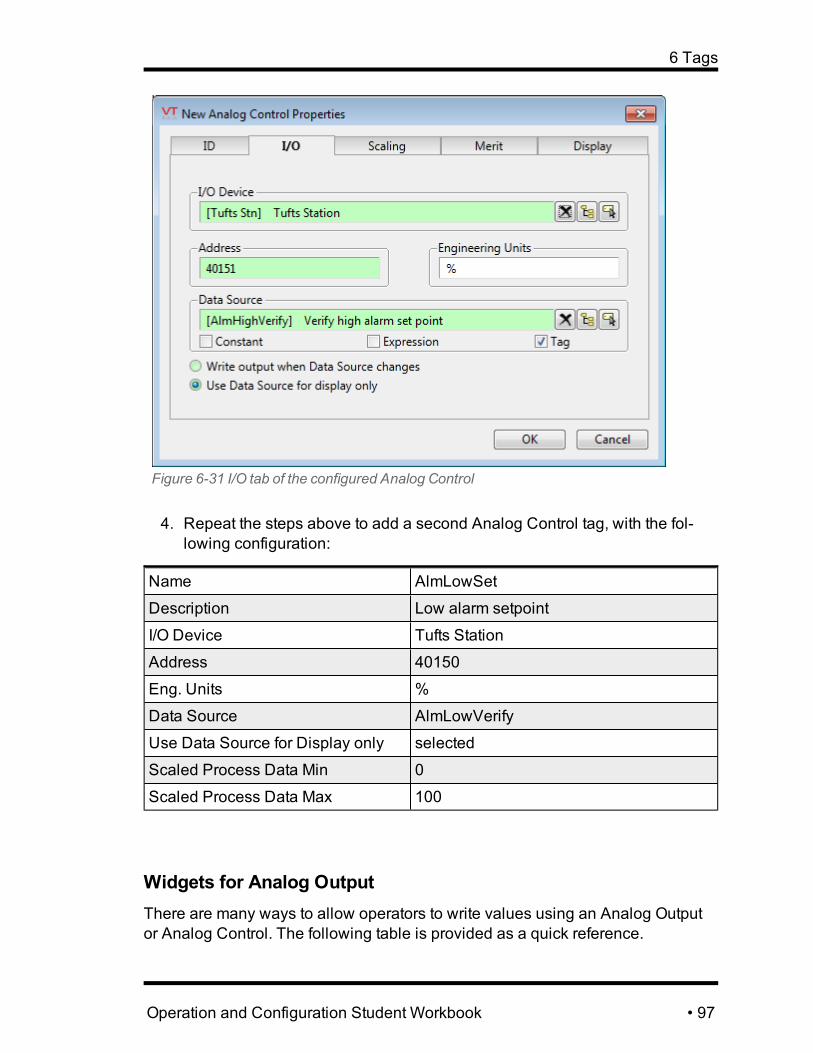
6 Tags
Figure 6-31 I/O tab of the configured Analog Control
4. Repeat the steps above to add a second Analog Control tag, with the fol-lowing configuration:
Name AlmLowSet
Description Low alarm setpoint
I/O Device Tufts Station
Address 40150
Eng. Units %
Data Source AlmLowVerify
Use Data Source for Display only selected
Scaled Process Data Min 0
Scaled Process Data Max 100
Widgets for Analog OutputThere are many ways to allow operators to write values using an Analog Outputor Analog Control. The following table is provided as a quick reference.
Operation and Configuration Student Workbook • 97
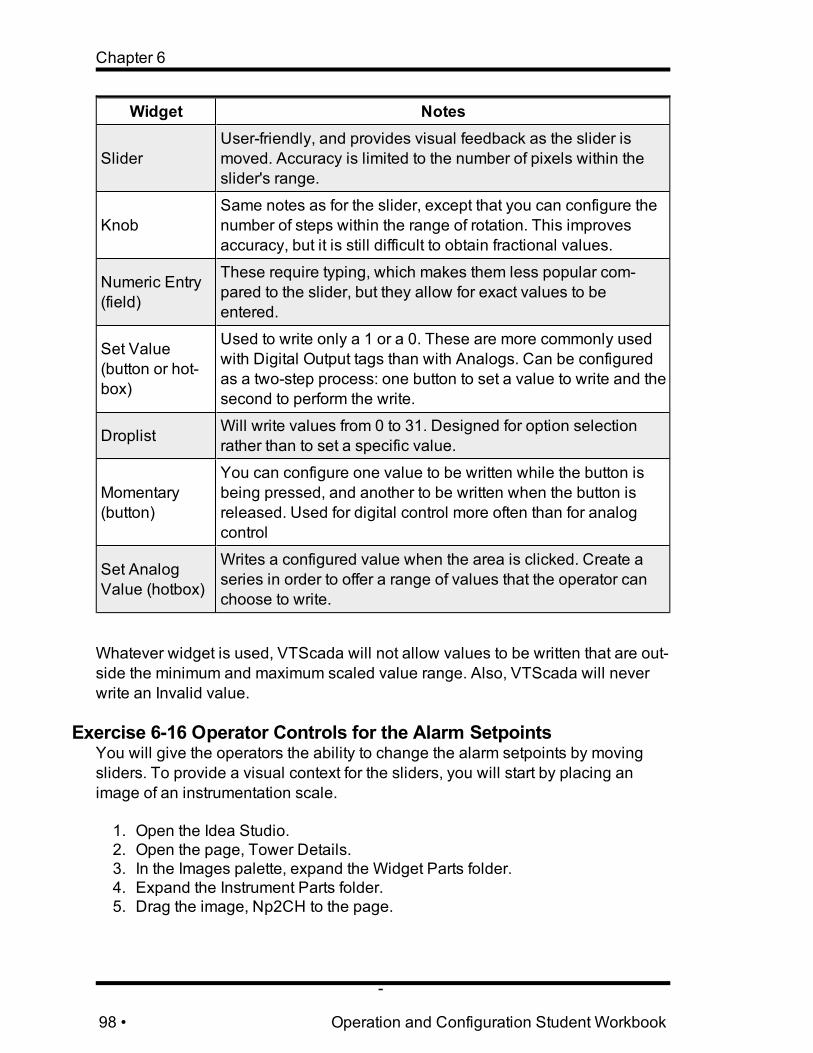
Chapter 6
Widget Notes
SliderUser-friendly, and provides visual feedback as the slider ismoved. Accuracy is limited to the number of pixels within theslider's range.
KnobSame notes as for the slider, except that you can configure thenumber of steps within the range of rotation. This improvesaccuracy, but it is still difficult to obtain fractional values.
Numeric Entry(field)
These require typing, which makes them less popular com-pared to the slider, but they allow for exact values to beentered.
Set Value(button or hot-box)
Used to write only a 1 or a 0. These are more commonly usedwith Digital Output tags than with Analogs. Can be configuredas a two-step process: one button to set a value to write and thesecond to perform the write.
Droplist Will write values from 0 to 31. Designed for option selectionrather than to set a specific value.
Momentary(button)
You can configure one value to be written while the button isbeing pressed, and another to be written when the button isreleased. Used for digital control more often than for analogcontrol
Set AnalogValue (hotbox)
Writes a configured value when the area is clicked. Create aseries in order to offer a range of values that the operator canchoose to write.
Whatever widget is used, VTScada will not allow values to be written that are out-side the minimum and maximum scaled value range. Also, VTScada will neverwrite an Invalid value.
Exercise 6-16 Operator Controls for the Alarm SetpointsYou will give the operators the ability to change the alarm setpoints by movingsliders. To provide a visual context for the sliders, you will start by placing animage of an instrumentation scale.
1. Open the Idea Studio.2. Open the page, Tower Details.3. In the Images palette, expand the Widget Parts folder.4. Expand the Instrument Parts folder.5. Drag the image, Np2CH to the page.
-
98 • Operation and Configuration Student Workbook

6 Tags
6. Scale it to be approximately 30% larger than its default size.You could do this by dragging a corner, or by setting the Overall Scaling to1.3.
Figure 6-32 Setting the overall scaling
7. In the Widgets palette, expand the Analog Controls folder.8. Drag the widget, Horizontal Slider 1 to the page, placing it just above the
instrumentation image.9. Adjust the size of the slider to match the marked area of the instrumentation
range. You will need to hold the Ctrl key down to release proximity snap-ping.
Figure 6-33 Aligned slider
10. Open the slider's properties dialog.You will not make any changes, but you should be aware of the options.You can select a different image, change the direction of the slider, and dis-able the confirmation dialog. It would be very unusual to set the scaling toanything other than the tag's values, but it is possible.
11. Close the properties dialog.12. Link the widget to AlmHighSet.13. Repeat these instructions to add a slider linked to AlmLowSet below the
instrumentation image.The initial values for the setpoints are coming from the simulator code.Ignore for now - you will use the sliders to change the setpoints soon.
14. Add labels for the high and low alarm sliders as shown in the following fig-ure. Add text for 0 and 100 to the instrumentation image.
Operation and Configuration Student Workbook • 99

Chapter 6
Figure 6-34 Completed alarm setpoint controls
Tips for Adjusting Shapes, Images and WidgetsYou can increase the display scale to see more clearly.Remember the use of Ctrl and Shift to release alignment and proximity snaps.A useful trick for moving an object is to select it then use the following keyboardcontrols to move or scale it:
Arrow key Move one pixel in the direction of the arrow.
Alt + left or rightarrow
Stretch the right edge to the left or right by one pixel, chan-ging the width.
Alt + up or downarrow
Stretch the bottom edge up or down by one pixel, changingthe height.
Exercise 6-17 Add Visual FeedbackOperators will appreciate having something on the screen that confirms their con-trol actions. You will do this here by adding a rectangle on top of the instru-mentation image that uses left and right scaling to adjust its size to match thealarm setpoints.
1. Add a rectangle shape to the page, placing it on top of the instrumentationimage.
2. Change the rectangle's color to red. (A reasonable choice for something thatrelates to alarms.)
3. Adjust the size of the rectangle until it fits within the window area of theinstrumentation image.
Figure 6-35 Added rectangle
4. Open the properties dialog for the rectangle.5. Expand the Scaling option in the menu.6. Select the Right Scaling option.
This will represent the high alarm setpoint.
-
100 • Operation and Configuration Student Workbook

6 Tags
7. For the data source, choose the option Normalized Expression.A normalized expression is one that is scaled.
Figure 6-36 Selecting a data source
8. Delete the 1 from the expression field.9. Click the Tag Browser button.
Figure 6-37 Locating the Tag Browser button
10. Select the tag, AlmHighVerify.11. Click OK to close the properties dialog and save your work.12. Click the Show Operator View button to close the Idea Studio and sim-
ultaneously open the Tower 1 page in operational mode.13. Test your work by moving the top slider left and right. The right edge of the
rectangle should scale to match.14. Adjust the high alarm setpoint to a value slightly greater than 80.15. Adjust the low alarm setpoint to a value slightly less than 20.16. Adjusting the left scaling will require an extra step. The right edge was
straight-forward: When 100%, the right of the rectangle should reach theright of the initial range and when 0%, the right of the rectangle should be atthe left of the range.
17. Left scaling is measured away from the right. Therefore, 100% must indicateno distance from the right and 0% must indicate 100% of the way from theright. This is easily achieved by subtracting the low alarm feedback valuefrom 100.
18. Reopen the Idea Studio.19. Reopen the properties dialog for the rectangle.20. Open the Left Scaling configuration.21. Set the data source to Normalized Expression.22. Change the "1" in the expression field to "100 - ".23. Open the Tag Browser.24. Select the tag, AlmLowVerify.
Operation and Configuration Student Workbook • 101
Chapter 6
25. Click OK to save your work.The left edge of the rectangle should now match the low alarm setpoint youchose earlier.
Alarms will be covered in a future chapter. When they are, the setpoints you havejust created will be ready for you to use in those exercises.
Tags for Digital ValuesDigital Input and Digital Status tags read values that can be either zero or one.Analog tags can do the same, but Digital Tags are designed expressly for situ-ations where the equipment is off (0) or on (1). You can also configure these tagsto read from two addresses, thereby having a value that could range from 0 to 3.
Digital Output and Digital Control tags are used to write either a zero or a one (offor on) to a given address. They include an optional Pulse Duration parameter, foruse if the equipment being controlled requires that the signal be maintained for x-seconds.
Note that the value of Digital Control and Digital Output tags does not reflect thesignal they are writing. This differs from the behavior of Analog output tags. ADigital output's value will always be zero, except while a value is being written,during which time the tag's value will be one. It makes no difference whether thevalue being written is a zero or one.
The difference between the versions of digital tags (Input versus Status and Out-put versus Control) is similar to the case for Analog Input versus Analog Status,Analog Output versus Analog Control. A Digital Status tag has a built-in alarm,and its values will be logged automatically unless otherwise configured.
Widgets and Styles for Digital Tags
Since Digital Status and Digital Input tags usually have a value of either zero orone, it is customary to represent these values with either text that changes accord-ing to the value ("Off" or "On") or to use a color indicator; red or green according tothe value.Another commonly-used method to display a digital tag's value is to use an imagethat changes according to the state. This could be a single picture of the equip-ment with a color box that changes, or the entire image could change to match thestatus.VTScada provides a selection of equipment images that will change color inresponse to the linked tag's value. The color selection is controlled by a con-figuration tag: SystemStyle.
-
102 • Operation and Configuration Student Workbook

6 Tags
SystemStyle sets a color and text for each possible state of a digital tag. It alsoincludes labels and colors for an alarm state, invalid data (broken communication)and for advanced features such as selector switch and LCD meter displays.
The advantage of the SystemStyle is that you can change the configuration of alarge number of widgets in one step. For example, in some industries, the colorred means that equipment is active, while in others green is used. If the colors foreach item of equipment were individually configured, it could take a long time tochange your application over from one system to another. With a SystemStyle tag,the changeover can be done in a moment.
Note that only a selection of widgets will use the style setting tag. You can learnwhich these are by referring to the Widgets chapter of the help system. Widgetsthat can use a style setting are marked.
It is possible to add multiple style settings tags to an application, but this is notcommonly done.
Note: As you continue with the following exercises, you may find that you need toreorganize the layout of the Tower Details page more than once. Creating aclean, well-organized user interface is a skill that requires practice.
Exercise 6-18 Add a Valve to the Water TowerSoon, you will add pumps to the well in order to push water into the tower. Beforedoing that, it will be helpful to have a way to drain water out of the tower.The Valve will have the following features:
l When open, the operator can adjust a setpoint for how far it is to be opened.l This will require an Analog Output tag to write the setpoint and an AnalogInput to read the current value. There is no need to record or alarm on thesevalues, therefore Input and Output types will do.
l The operator can choose to open or close the valve. When re-opened, it willreturn to the last setpoint.
l This requires a Digital Input to report on whether the valve is currently openor closed and a Digital Output to write the open or close signal.
l A sensor measures the rate of fluid flow through the valve.l The flow should be logged, therefore you will use an Analog Status tag.
To keep the Tag Browser tidy, you will add a Context for the tags related to thevalve.
1. Open the Tag Browser .2. Add a new child tag to Tower 1.3. Set the type to Context.4. Set the name to "Valve1".
Operation and Configuration Student Workbook • 103

Chapter 6
5. Set the description to "Water supply from storage tower".6. Click OK to close the dialog. No other configuration is required.7. Add a child tag of type Digital Status to Valve1.8. Configure as follows:
Name OpenCloseStatus
Description Valve open or closed
I/O Device Tufts Station
Bit 0 Address 80
Bit 1 Address not set
Off Text(Display tab) Closed
On Text Open
Note that the style tag selection reads "Missing". This is a somewhat con-fusing message, indicating that in the absence of any particular selection,the default tag, SystemStyle, will be used.
9. Click OK to close the properties dialog.10. Select the tag and click, Draw
The Idea Studio will open. You may need to change the current page to beTower Details.A floating widget palette will open with a selection of all the widgets that canbe linked to a Digital Status tag.
11. Open the Equipment folder.12. Open the Valves folder.13. Drag the widget, Control Valve 11 - Right to the page.
The widget is linked to the tag automatically and you are returned to the TagBrowser.
The next set of steps in this exercise will add a control for the valve.
1. Add a new child tag to Valve1, selecting type Digital Control.2. Configure as follows:
Name OperateValve
Description Open or close valve
I/O Device Tufts Station
Address 180
-
104 • Operation and Configuration Student Workbook
6 Tags
Pulse Duration 0
Off Text Close
On Text Open
3. Click OK to close the properties dialog.4. Click Draw
A dialog of Digital Control Widgets opens.5. Expand the folder, Buttons and Switches.6. Drag Push Button 4 to the Tower Details page, placing it near the valve.7. Close the Tag Browser.
The Idea Studio should remain open.8. Open the properties dialog for the Push Button 4.9. Change the color to green.10. Enter a "1" in the space for the value to write.11. Click OK to close the properties dialog.12. Stretch the image so that it remains the same width, but is half as high.13. Select the button and copy it. (Ctrl + C or right-click and copy from the
menu.)14. Paste the copy immediately below the original.15. Open the copy's properties dialog.16. Change the color to red.17. Change the value to write to "0".18. Click OK.
Close the Idea Studio and test your work so far. You should be able to open andclose the valve using the buttons, seeing the valve's indicator change color. Thesmall amount of water in the tank will drain while the valve is open.
You will now finish the valve by adding a setpoint control and flow monitoring. Totest your knowledge, you will be given the tag configuration tables and an imageof the completed page, but no steps will be provided. The tags are to be createdas children of Valve1. As an extra step, draw a pipe to connect the tower to thevalve.Your page will, no doubt, be better organized than the example provided here.Widgets are suggest for each tag, but you are free to experiment with your ownchoices. If using an LCD display, be aware that these look best against a darkbackground.
Tag 1:
Type Analog Control
Operation and Configuration Student Workbook • 105

Chapter 6
Name Setpoint
Description Control % open setpoint
I/O Device Tufts Station
Address 40180
Data Source None
Scaled Process Data Min 0
Scaled Process Data Max 100
Drawn Using Brass Knob
Tag 2 will be created an Analog Input instead of an Analog Status. Mixing tagtypes between Analog Status and Analog Input is not standard procedure. Youare doing it here simply for the sake of learning the different tools within VTScada,both in this exercise and in a later one.Tag 2:
Type Analog Input
Name Current Position
Description % open
I/O Device Tufts Station
Address 40080
Scaled Process Data Min 0
Scaled Process Data Max 100
Drawn Using Numeric Value
Back to Analog Status for the third tag in this exercise.Tag 3:
Type Analog Status
Name Flow Rate
Description Flow through valve
I/O Device Tufts Station
Address 40081
Deadband 0.1
Engineering Units GPM
-
106 • Operation and Configuration Student Workbook
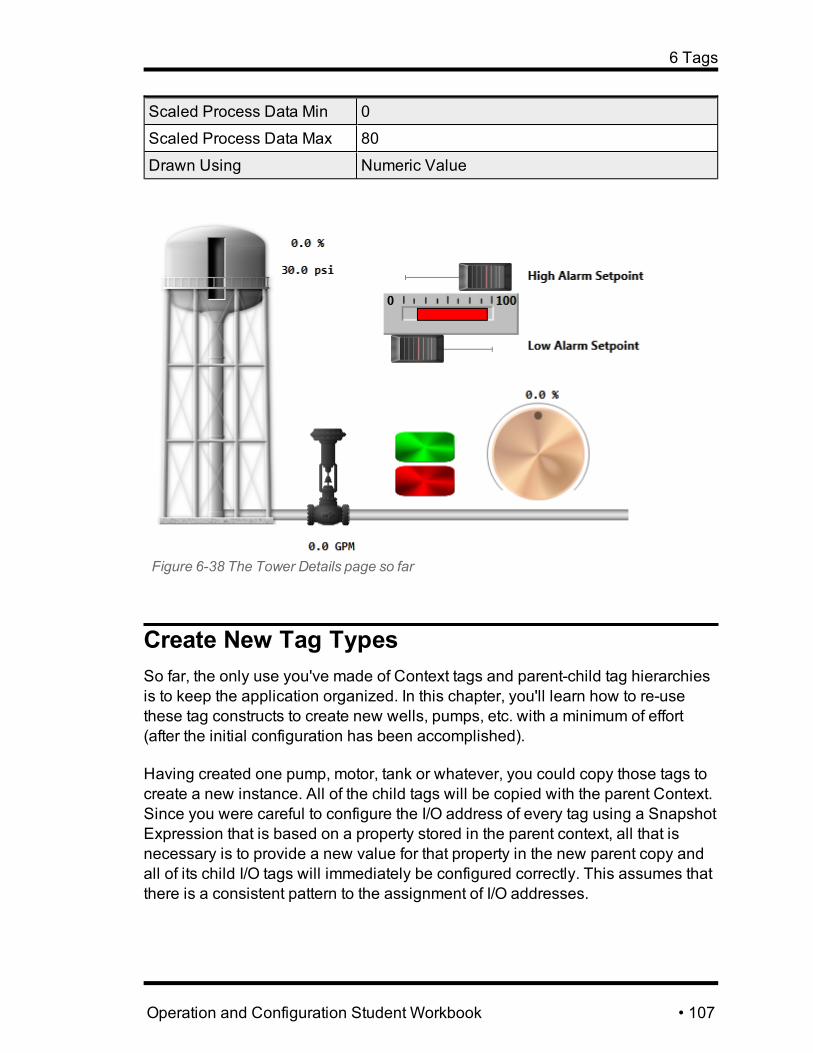
6 Tags
Scaled Process Data Min 0
Scaled Process Data Max 80
Drawn Using Numeric Value
Figure 6-38 The Tower Details page so far
Create New Tag TypesSo far, the only use you've made of Context tags and parent-child tag hierarchiesis to keep the application organized. In this chapter, you'll learn how to re-usethese tag constructs to create new wells, pumps, etc. with a minimum of effort(after the initial configuration has been accomplished).
Having created one pump, motor, tank or whatever, you could copy those tags tocreate a new instance. All of the child tags will be copied with the parent Context.Since you were careful to configure the I/O address of every tag using a SnapshotExpression that is based on a property stored in the parent context, all that isnecessary is to provide a new value for that property in the new parent copy andall of its child I/O tags will immediately be configured correctly. This assumes thatthere is a consistent pattern to the assignment of I/O addresses.
Operation and Configuration Student Workbook • 107
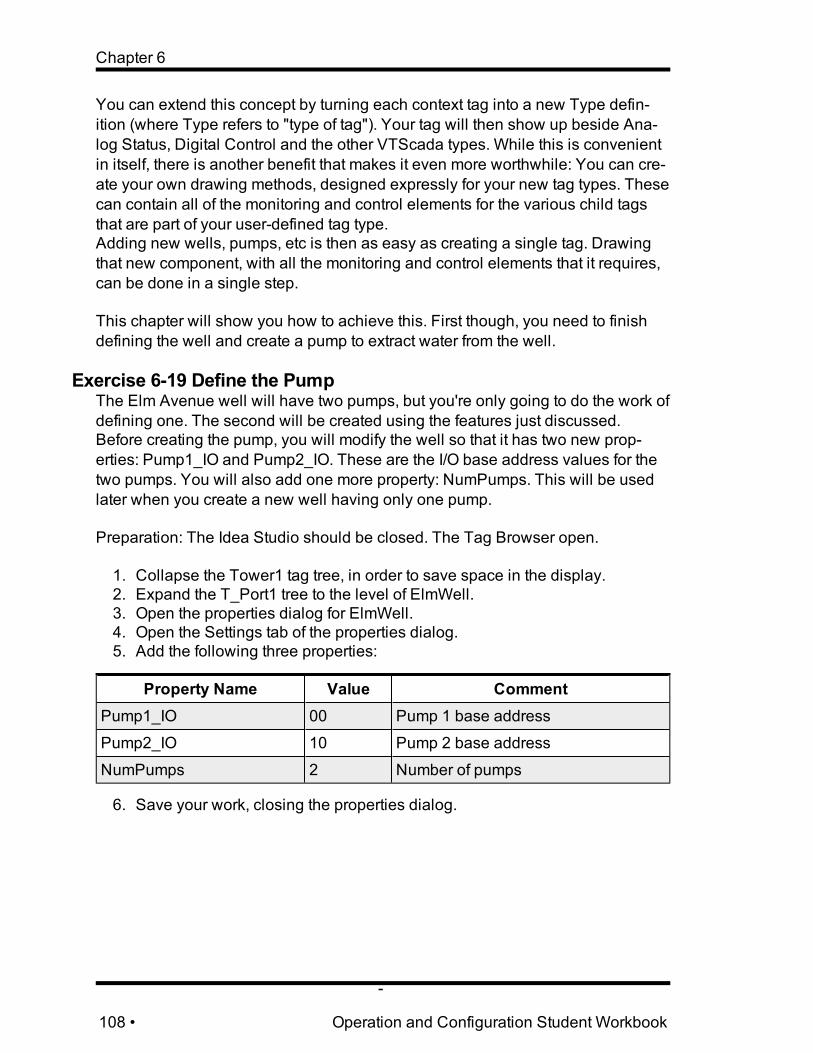
Chapter 6
You can extend this concept by turning each context tag into a new Type defin-ition (where Type refers to "type of tag"). Your tag will then show up beside Ana-log Status, Digital Control and the other VTScada types. While this is convenientin itself, there is another benefit that makes it even more worthwhile: You can cre-ate your own drawing methods, designed expressly for your new tag types. Thesecan contain all of the monitoring and control elements for the various child tagsthat are part of your user-defined tag type.Adding new wells, pumps, etc is then as easy as creating a single tag. Drawingthat new component, with all the monitoring and control elements that it requires,can be done in a single step.
This chapter will show you how to achieve this. First though, you need to finishdefining the well and create a pump to extract water from the well.
Exercise 6-19 Define the PumpThe Elm Avenue well will have two pumps, but you're only going to do the work ofdefining one. The second will be created using the features just discussed.Before creating the pump, you will modify the well so that it has two new prop-erties: Pump1_IO and Pump2_IO. These are the I/O base address values for thetwo pumps. You will also add one more property: NumPumps. This will be usedlater when you create a new well having only one pump.
Preparation: The Idea Studio should be closed. The Tag Browser open.
1. Collapse the Tower1 tag tree, in order to save space in the display.2. Expand the T_Port1 tree to the level of ElmWell.3. Open the properties dialog for ElmWell.4. Open the Settings tab of the properties dialog.5. Add the following three properties:
Property Name Value CommentPump1_IO 00 Pump 1 base address
Pump2_IO 10 Pump 2 base address
NumPumps 2 Number of pumps
6. Save your work, closing the properties dialog.
-
108 • Operation and Configuration Student Workbook

6 Tags
Figure 6-39 Detail view: ElmWell properties list
7. Add a new child tag to ElmWell, of type Context and configured as follows.Note that "SupplyPump" must be one word. Spaces are not allowed in aContext tag's Type field.
Type Context
Name Pump1
Description Primary pump
Type SupplyPump
8. Open the Settings tab of the properties dialog.9. Add two properties, as follows:
Property Name Value CommentIOBase 00 Base for pump I/O
NickName P1 Short display name
10. Click OK to close the properties dialog.
Note: the Property name here is the same as for other context tags. You mightwonder how the expression would know whether to use IOBase from the parentor a grandparent.The answer is that the parameter found in the closest parent is the one used,unless you provide a path to a different tag.
11. Continue by adding the following tags as children of Pump1. A Pump Statustag is almost the same thing as a Digital Status tag, but specialized reportsare available just for it.
Operation and Configuration Student Workbook • 109

Chapter 6
In each case, the I/O device should be auto-configured to "PLC Simulator".If any new tag pre-fills with Tufts Station, take care to re-direct it. The dis-play should read [*Driver] PLC Simulator.
Tag 1:
Child of Pump1
Type Pump Status
Name Status
Description Pump running?
Bit 0 Address..\IOBase + 00(As a snapshot expression. If the field does not turn blue andshow the value 0, you've made a mistake.)
Tag 2:
Child of Pump1
Type Digital Control
Name StartPump
Description Start the pump
Address ..\IOBase + 100(as a snapshot expression)
Pulse Duration 2
Data Source None
Tag 3:
Type Digital Control
Name StopPump
Description Stop the pump
Address ..\IO_Base + 101(as a snapshot expression)
Pulse Duration 2
Tag 4:
Child of Pump1
-
110 • Operation and Configuration Student Workbook

6 Tags
Type Analog Status
Name Speed
Description Pump impeller speed
Address ..\IOBase + 40000(as a snapshot expression)
Engineering Units RPM
Deadband 0.1
Scaled Process Data Min 0
Scaled Process Data Max 1500
Tag 5:
Child of Pump1
Type Analog Control
Name SetSpeed
Description Speed control
Address ..\IOBase + 40100(as a snapshot expression)
Engineering Units RPM
Scaled Process Data Min 0
Scaled Process Data Max 1500
Tag 6:
Type Analog Status
Name Flow
Description Pump flow rate
Address ..\IOBase + 40006(as a snapshot expression)
Engineering Units GPM
Deadband 0.1
Scaled Process Data Min 0
Scaled Process Data Max 400
Operation and Configuration Student Workbook • 111

Chapter 6
From Context to TypeThe process of turning a context tag into a new type is the easiest thing you willdo in this course. The work is in the planning and initial configuration, whichyou've just completed in the last exercise.Once transformed into a new type, it becomes only slightly more difficult to makechanges. Properties can be added or changed, but you will need to use an editorwithin the Application Configuration dialog, rather than simply opening a prop-erties dialog.New child tags can be added and edited, then made part of the type definitionwith the Update Type command. As a rule, if you decide that a change is requiredto the child tags of one of your custom-made tag types, do not make that changeto any of the instances used in the running application. Instead, create a newinstance - a template if you will - and edit the child tags of that. By making a habitof this, you will avoid later confusion and errors with your custom tag types.
Exercise 6-20 Turn the SupplyPump into a New Tag TypeThe Tag Browser should be open.1. Locate the tag, Pump1.2. Right-click to open its context menu.3. Click, Create New Type.
A dialog will open, asking which built-in drawing methods (or widgets) areto be available for this new type.
4. Click OK to accept all.That was the entire procedure
5. Right-click on Pump1 and open its properties dialog.6. Note that the configuration dialog is not that of a Context tag. The settings
you created earlier are now configuration parameters in the tab, Other Para-meters.
7. Right-click on the parameter 00 (Base for pump I/O)8. Add a Snapshot Expression.9. In the expression editor type, "..\Pump1_IO".
The pump will now look to the parent (ElmWell) for the base I/O value.10. Save your work and close the dialogs, leaving the Tag Browser open.
Exercise 6-21 Create a Second PumpYou will be happy to know that you do not need to create seven new tags as youdid when defining Pump1.
1. Right-click on ElmWell and add a new child tag.2. Select SupplyPump as the type.
This is your newly created type.3. Name the tag, "Pump2".4. Set the description to "Secondary supply".
-
112 • Operation and Configuration Student Workbook
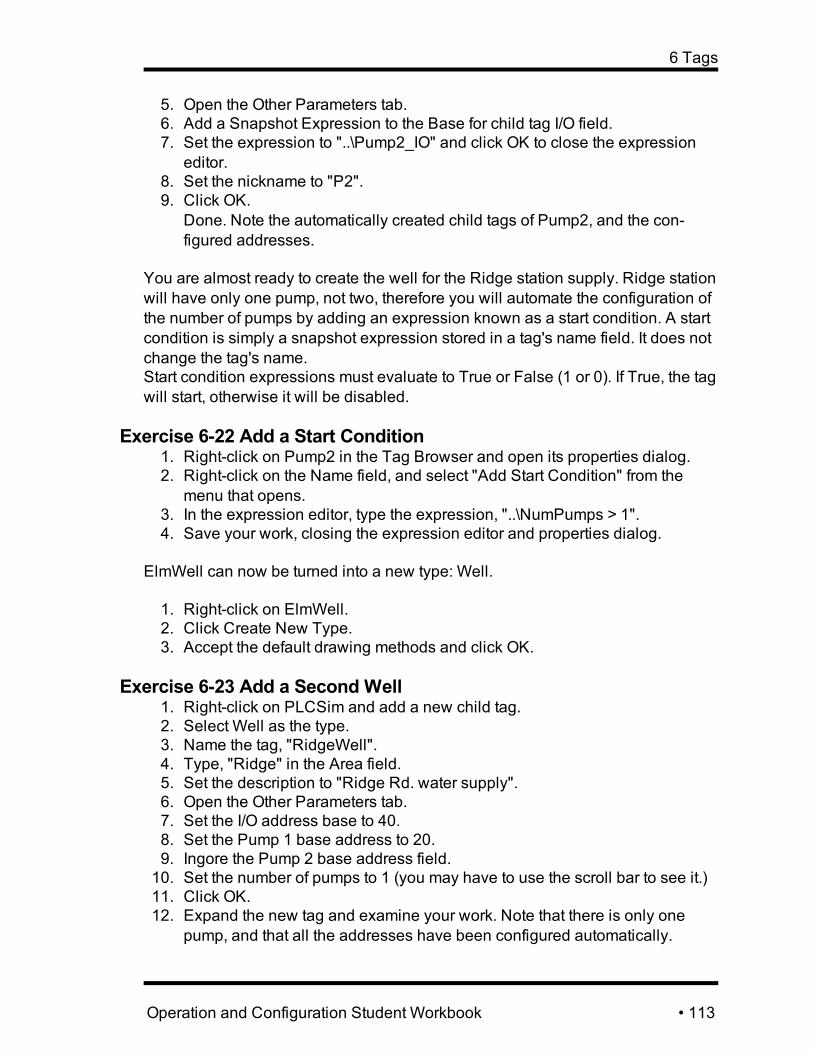
6 Tags
5. Open the Other Parameters tab.6. Add a Snapshot Expression to the Base for child tag I/O field.7. Set the expression to "..\Pump2_IO" and click OK to close the expression
editor.8. Set the nickname to "P2".9. Click OK.
Done. Note the automatically created child tags of Pump2, and the con-figured addresses.
You are almost ready to create the well for the Ridge station supply. Ridge stationwill have only one pump, not two, therefore you will automate the configuration ofthe number of pumps by adding an expression known as a start condition. A startcondition is simply a snapshot expression stored in a tag's name field. It does notchange the tag's name.Start condition expressions must evaluate to True or False (1 or 0). If True, the tagwill start, otherwise it will be disabled.
Exercise 6-22 Add a Start Condition1. Right-click on Pump2 in the Tag Browser and open its properties dialog.2. Right-click on the Name field, and select "Add Start Condition" from the
menu that opens.3. In the expression editor, type the expression, "..\NumPumps > 1".4. Save your work, closing the expression editor and properties dialog.
ElmWell can now be turned into a new type: Well.
1. Right-click on ElmWell.2. Click Create New Type.3. Accept the default drawing methods and click OK.
Exercise 6-23 Add a Second Well1. Right-click on PLCSim and add a new child tag.2. Select Well as the type.3. Name the tag, "RidgeWell".4. Type, "Ridge" in the Area field.5. Set the description to "Ridge Rd. water supply".6. Open the Other Parameters tab.7. Set the I/O address base to 40.8. Set the Pump 1 base address to 20.9. Ingore the Pump 2 base address field.10. Set the number of pumps to 1 (you may have to use the scroll bar to see it.)11. Click OK.12. Expand the new tag and examine your work. Note that there is only one
pump, and that all the addresses have been configured automatically.
Operation and Configuration Student Workbook • 113

Chapter 6
-
114 • Operation and Configuration Student Workbook

7 CustomWidgets and Parametrized Pages
7 Custom Widgets and ParametrizedPagesThis application will have three supply pumps when you are done. Two in theElm Avenue well and one in the well on Ridge Rd.Each well has six I/O tags, all of which must be drawn. Rather than drawing 18tags, you need only do the work once, then re-use it for the other pumps.
You have seen several built-in widgets already. You are about to learn how to cre-ate your own. Further, your widgets will allow you to draw entire pumps and wellsin a single step, rather than one tag at a time.
The concept of a parametrized page will also be covered. These are flexiblepages that can be reused to show different sets of tags depending on how theyare opened. By learning how to do this you will discover how to make a singlecontrol page that can be used by any of the three pumps in the application.
It is interesting to note that at the code level, which you are welcome to examine,a custom widget and a parametrized page are very nearly the same thing.
Exercise 7-1 Create a New WidgetIn an earlier exercise, you created the Well Details page, which shows the depthof water in the Elm Ave. well. Rather than have to re-create this for the Ridge Rd.well, you are going to do a bit of extra work so that the existing well overview canbe re-used for as many wells as you care to create.
Preparation: The Tag Browser should be closed and the Idea Studio open.
1. Open the Well Details page.2. Right-click on the Color Fill widget and open its properties dialog.3. Select all of the Disable Options.
Operation and Configuration Student Workbook • 115

Chapter 7
Figure 7-1 Disabled options
In a later exercise, you will be drawing the pumps within the well area andwill want to be able to click on them. If the well's Trend display and nav-igator menu were enabled, you would get those as well as the informationfor the pumps. You are leaving the options enabled on the Numeric Valuewidget, so operators who want a trend of the well's level can still click thereto open it.
4. Add text below the well, typing "Sample Text" as a placeholder.In a later exercise, you will create an expression so that this will display thename of whichever well a particular instance of your widget represents.
5. Change the text alignment to centered.
Figure 7-2 Text added below the well
6. Select All on the Well Details page.7. In the toolbar, click the Group tool, then New Widget.8. Set the title of the new widget to "Well Overview".9. Ensure that the option New Tag Widget is selected.10. In the Select a Tag area, select ElmWell.
-
116 • Operation and Configuration Student Workbook

7 CustomWidgets and Parametrized Pages
This widget will be for wells in general, not just for the Level within a well.11. Click OK.
Several things just happened.l A yellow blob appeared on the well. This could be used to hold a Ques-tionable data indicator if you chose. You will delete it later.
l The well is now a single object. To make changes to it now, you might right-click and select Edit, which will open the widget in the Idea Studio as if itwere a page.
l Your custom tag widget has just been added to the widgets palette. You willneed to create a folder and reorganize the palette a little later.
If you were to right-click on either well in the Tag Browser (Elm or Ridge) andselect Draw, you would now see this overview as a way to draw it. The waterlevel would be for the correct well.
A few final steps are required to tidy up the new instance of the Widget, which hasreplaced the individual components.
1. Right-click on the new widget and open its properties dialog.2. Select all of the disable options.
This is done for the same reason you disabled the options in the Color Fill.Every widget including the ones you create will have its own set of operatorinterface options.Click OK to close the properties dialog.
3. Right-click on the widget again and select Edit from the menu.The widget's page opens in the Idea Studio.
4. Delete the yellow blob.(Properly referred to as the Tag Icon Indicator.)
5. Return to the Well Details page. The Tag Icon Indicator should be gone.
Linked Tag PropertiesThink for a moment about what makes up a widget. The rectangle you createdearlier to provide feedback for alarm setpoints makes a good example.The rectangle itself is a shape. An image would work just as well. Everything thatyou see in the widgets palette also uses a shape or an image, otherwise youwouldn't see anything.You added an expression to the rectangle to make the edges move in response tothe alarm setpoints. This is very similar to what the Color Fill widget does. Theexpression used the value property of the alarm setpoint tag. It's possible to useany property in an expression, the area, description, engineering units, scaled
Operation and Configuration Student Workbook • 117

Chapter 7
minimum or maximum, etc., but in most cases the tag value is what's most inter-esting.
Widgets also use expression code similar to what you wrote, but usually withextra things like error checking, etc. to make them very robust. Where widgets dif-fer from your rectangle is that your expression named a specific tag to use. Wid-gets will take the value of whatever tag they are linked to. Or, to say that adifferent way, they use the linked tag's value property. You can do the same withyour custom widgets.
Exercise 7-2 Use a Linked Tag PropertyYou will replace the words "Sample Text" in your well overview with the descrip-tion property of whichever well the widget is linked to.
Preparation: The Idea Studio should still be open.
Reopen the Well Details Overview page.Right-click on the words, "Sample Text" and open the properties dialog.Select "Text" from the menu.Expand the data source choices and select, Linked Tag Property.
Figure 7-3 Linked Tag Property data source
Expand the selector of Linked Tag Properties to find and select Description withinthe Parameters folder.
Figure 7-4 Finding the description property
Click OK to save your work.
-
118 • Operation and Configuration Student Workbook

7 CustomWidgets and Parametrized Pages
Note the change to the Sample Text. Now, whenever you draw this Well Over-view, it will be labeled with the description property from whichever well you aredrawing.(You may need to stretch the text a bit to provide more room for the description.)As an optional step, you may decide to add another line of text and repeat this pro-cess to add the area property, thereby providing more context.
Parametrized PagesIf you were to draw the Well Overview widget for the Ridge well, the water levelwould be linked to that well. You can try it in some free space on whatever pagehappens to be open in the Idea Studio. Just be sure to delete it after you try.
The Well Details page contains that widget, drawn for the Elm well. That's fine,but now you should also create a Well Details page for Ridge Rd. Or, you couldturn Well Details into a parametrized page and just create a second menu link toit, specifying a different well to view. That's what you will do in the exercise in thissection.
A parameter, attached to a page, is a way to pass information to the page as it isbeing opened. Anything within the page that could be linked to a tag, could belinked to a parameter instead. Actually, that last sentence could be rewritten a bitshorter: Anything within the page could be linked to a parameter. The menu linkthat opens the page will specify what tags (or other values) to supply for the para-meters in each instance.
Exercise 7-3 Create a Parametrized PagePreparation: The Idea Studio should be open. The Well Details page should beopen within the studio.
1. Open the Page Properties ribbon.2. Click the Manage Parameters tool.
The Manage Parameters dialog opens.3. Click the Add button.
The New Parameter dialog opens.4. Set the name to "WellChoice".5. Set the description to "Choice of well".6. Set the type to "Tag"7. Select the Well type.
Operation and Configuration Student Workbook • 119
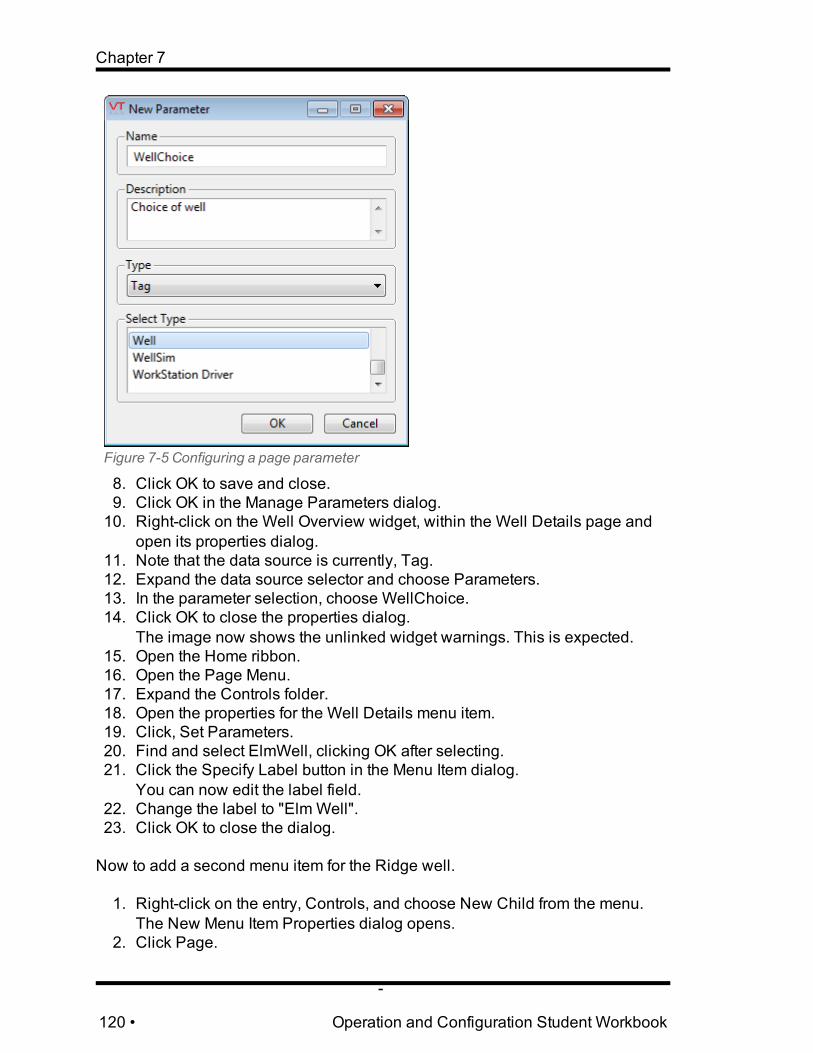
Chapter 7
Figure 7-5 Configuring a page parameter
8. Click OK to save and close.9. Click OK in the Manage Parameters dialog.10. Right-click on the Well Overview widget, within the Well Details page and
open its properties dialog.11. Note that the data source is currently, Tag.12. Expand the data source selector and choose Parameters.13. In the parameter selection, choose WellChoice.14. Click OK to close the properties dialog.
The image now shows the unlinked widget warnings. This is expected.15. Open the Home ribbon.16. Open the Page Menu.17. Expand the Controls folder.18. Open the properties for the Well Details menu item.19. Click, Set Parameters.20. Find and select ElmWell, clicking OK after selecting.21. Click the Specify Label button in the Menu Item dialog.
You can now edit the label field.22. Change the label to "ElmWell".23. Click OK to close the dialog.
Now to add a second menu item for the Ridge well.
1. Right-click on the entry, Controls, and choose New Child from the menu.The New Menu Item Properties dialog opens.
2. Click Page.
-
120 • Operation and Configuration Student Workbook
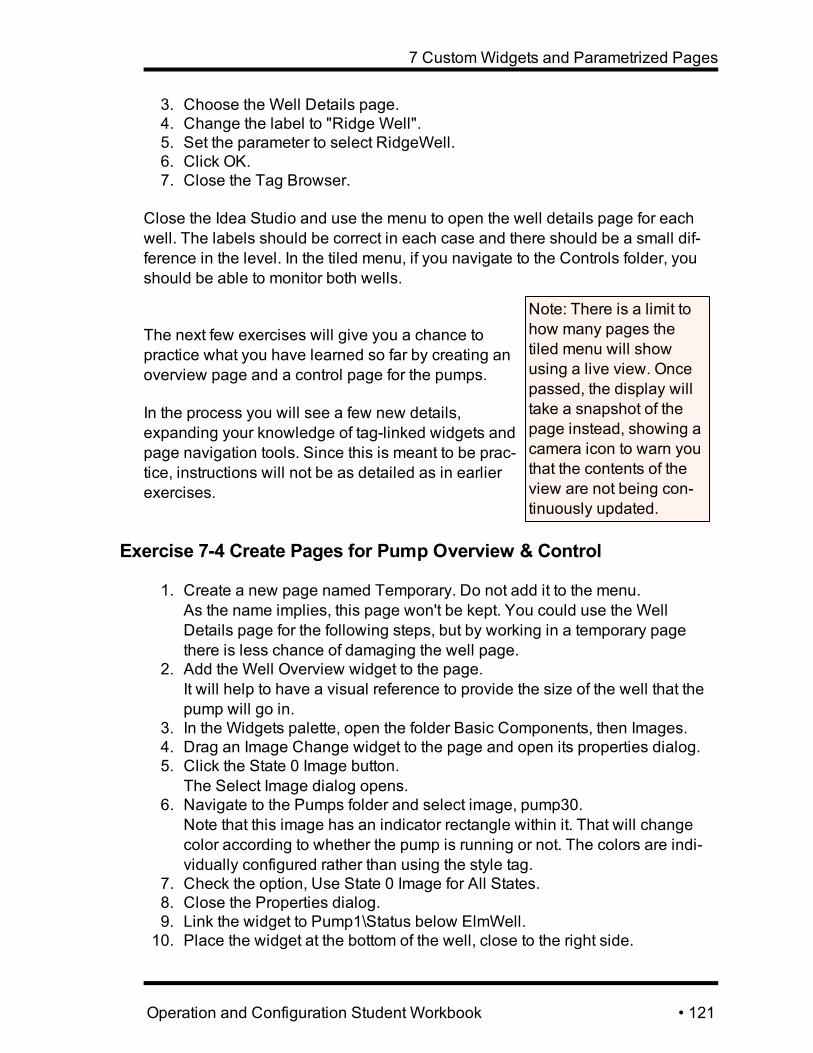
7 CustomWidgets and Parametrized Pages
3. Choose the Well Details page.4. Change the label to "Ridge Well".5. Set the parameter to select RidgeWell.6. Click OK.7. Close the Tag Browser.
Close the Idea Studio and use the menu to open the well details page for eachwell. The labels should be correct in each case and there should be a small dif-ference in the level. In the tiled menu, if you navigate to the Controls folder, youshould be able to monitor both wells.
Note: There is a limit tohow many pages thetiled menu will showusing a live view. Oncepassed, the display willtake a snapshot of thepage instead, showing acamera icon to warn youthat the contents of theview are not being con-tinuously updated.
The next few exercises will give you a chance topractice what you have learned so far by creating anoverview page and a control page for the pumps.
In the process you will see a few new details,expanding your knowledge of tag-linked widgets andpage navigation tools. Since this is meant to be prac-tice, instructions will not be as detailed as in earlierexercises.
Exercise 7-4 Create Pages for Pump Overview & Control
1. Create a new page named Temporary. Do not add it to the menu.As the name implies, this page won't be kept. You could use the WellDetails page for the following steps, but by working in a temporary pagethere is less chance of damaging the well page.
2. Add the Well Overview widget to the page.It will help to have a visual reference to provide the size of the well that thepump will go in.
3. In the Widgets palette, open the folder Basic Components, then Images.4. Drag an Image Change widget to the page and open its properties dialog.5. Click the State 0 Image button.
The Select Image dialog opens.6. Navigate to the Pumps folder and select image, pump30.
Note that this image has an indicator rectangle within it. That will changecolor according to whether the pump is running or not. The colors are indi-vidually configured rather than using the style tag.
7. Check the option, Use State 0 Image for All States.8. Close the Properties dialog.9. Link the widget to Pump1\Status below ElmWell.10. Place the widget at the bottom of the well, close to the right side.
Operation and Configuration Student Workbook • 121
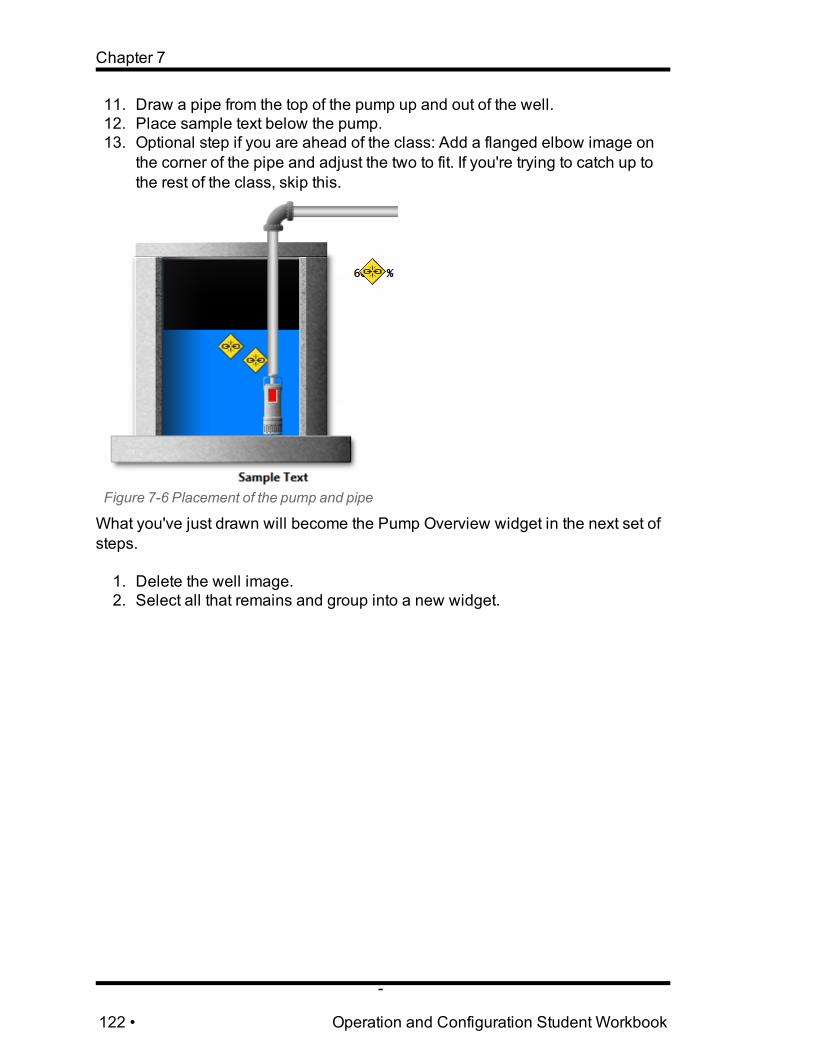
Chapter 7
11. Draw a pipe from the top of the pump up and out of the well.12. Place sample text below the pump.13. Optional step if you are ahead of the class: Add a flanged elbow image on
the corner of the pipe and adjust the two to fit. If you're trying to catch up tothe rest of the class, skip this.
Figure 7-6 Placement of the pump and pipe
What you've just drawn will become the Pump Overview widget in the next set ofsteps.
1. Delete the well image.2. Select all that remains and group into a new widget.
-
122 • Operation and Configuration Student Workbook

7 CustomWidgets and Parametrized Pages
Figure 7-7 Creating the PumpOverviewwidget.
3. Edit the widget to remove the Tag Icon Marker.4. Edit the properties of the Sample Text to use the NickName property of the
linked tag.5. Return to the page, Temporary in the Idea Studio.6. Delete the page.
The delete tool can be found in the Page Properties ribbon.
In the next set of steps, you will add the pump widget you have just created to theWell Overview widget. Widgets can nest within widgets.
1. Open the Well Overview widget in the Idea Studio.2. Navigate to the root level of the Widgets palette. You will find the PumpOver-
view widget that you recently created.3. Drag the PumpOverview to the well.
You may discover that you need to move the well downwards on the pageto make room for the pipe. If so, be sure to move everything in the well over-view.
4. It is necessary to link the PumpOverview to a pump, but the Link tool will notsearch within linked tag properties to find child tags. For that, you must workin the widget's properties dialog.
5. Open the properties dialog for the PumpOverview.6. Check all of the disable options.7. Change the data source to Linked Tag Property.8. Select, Linked Tags >> Child Tags >> Pump1.9. Repeat the last few steps to add a pump overview for Pump2.
Operation and Configuration Student Workbook • 123

Chapter 7
10. You may need to move the label, Primary water supply, down to make roomfor the pump labels.
11. Leave the page open in the Idea Studio. Another set of steps is coming.
Figure 7-8 Pump widgets placed in the well.
The Well Overview widget is nearly complete. There's just one remaining prob-lem to solve. If you were to close the Idea Studio and look at the Controls page inthe tiled menu, you would see an unlinked pump overview widget in the RidgeWell version of the page. In versions of VTScada prior to release 11, an unlinkedwidget would simply not show. Since release 11, it shows with a warning indic-ator. To make the unlinked pump at the Ridge station vanish, you will need to tieits opacity (visibility) property to the pump's start tag expression.
1. Reopen the properties dialog for P2.2. Open the Opacity option in the menu.3. Change the data source to Linked Tag Property.4. Select, Linked Tag (Well) >> Child Tags >> Pump2 >> Parameters >> Tag
Start Condition.5. Click OK to save your work.
P2 will be visible when viewing the Well Overview for the Elm station, butnot for the Ridge station.
Pages Versus WidgetsA parametrized page has much in common with a widget. Although we won't cre-ate one in this course, there are actually two kinds of widgets that you can create.(Three if you count temporary groups.) In the course, you are creating widgets that
-
124 • Operation and Configuration Student Workbook

7 CustomWidgets and Parametrized Pages
are designed to be linked directly to tags, but you could also create a widget thatrelies on parameters for the links to tags, just as a parametrized page does.
Both pages and widgets have their uses. You cannot create a menu link to a wid-get, therefore pages are necessary for navigation. But, widgets with their ability totie into a linked tag (and automatically link to child tags) are often easier to createand work with. In the final exercise for this topic, you will create both, seeing howpages and widgets can work together.
Exercise 7-5 Test Your Knowledge: The Pump ControlsYou have already seen every instruction required to create a control widget andpage for the pump, therefore it's time to practice what you've learned.A set of detailed instructions is provided on the next page, but try to create the wid-get and page using only the basic instructions.
Notes:Widgets used in the example image include:
l Set Valuel Numeric Entryl Numeric Valuel Image Change
The Set Value buttons are both configured to write a 1 when clicked. A set valuebutton has labels for both state 0 and state 1. Since the Digital Control tags cre-ated to start and stop the pump were configured to send a two second pulse, theywill be in state 1 for those two seconds. The state 1 label of the Set Value widgetallows a message to be displayed while writing. Thus, for the Set Value linked toStartPump, the labels will be Start and Starting. For the Set Value linked toStopPump, the labels will be Stop and Stopping. Again, both are configured toWrite 1 Immediately.
Basic Instructions1. Create a pop-up page named "Pump Control". Do not add it to the menu.2. Add widgets for the pump controls.
Link each widget to the tags within Pump1 of ElmWell while drawing.The result should look similar to the following, but you are free to choose dif-ferent widgets.
Operation and Configuration Student Workbook • 125
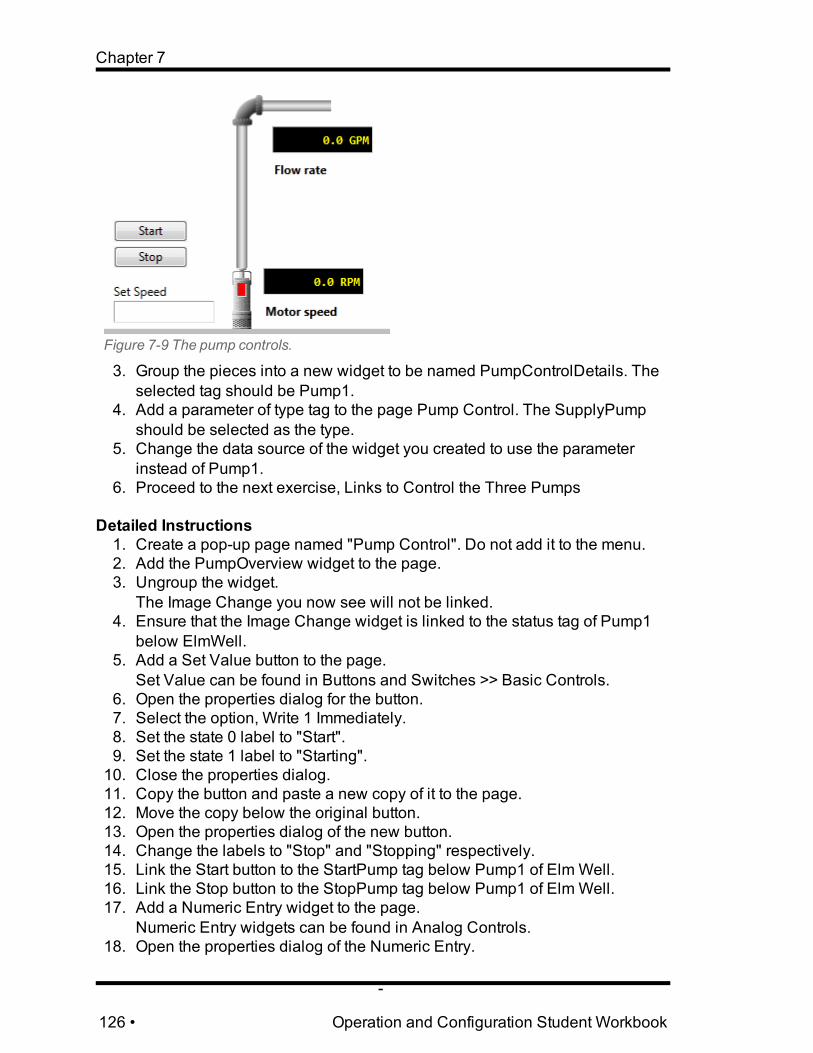
Chapter 7
Figure 7-9 The pump controls.
3. Group the pieces into a new widget to be named PumpControlDetails. Theselected tag should be Pump1.
4. Add a parameter of type tag to the page Pump Control. The SupplyPumpshould be selected as the type.
5. Change the data source of the widget you created to use the parameterinstead of Pump1.
6. Proceed to the next exercise, Links to Control the Three Pumps
Detailed Instructions1. Create a pop-up page named "Pump Control". Do not add it to the menu.2. Add the PumpOverview widget to the page.3. Ungroup the widget.
The Image Change you now see will not be linked.4. Ensure that the Image Change widget is linked to the status tag of Pump1
below ElmWell.5. Add a Set Value button to the page.
Set Value can be found in Buttons and Switches >> Basic Controls.6. Open the properties dialog for the button.7. Select the option, Write 1 Immediately.8. Set the state 0 label to "Start".9. Set the state 1 label to "Starting".10. Close the properties dialog.11. Copy the button and paste a new copy of it to the page.12. Move the copy below the original button.13. Open the properties dialog of the new button.14. Change the labels to "Stop" and "Stopping" respectively.15. Link the Start button to the StartPump tag below Pump1 of ElmWell.16. Link the Stop button to the StopPump tag below Pump1 of ElmWell.17. Add a Numeric Entry widget to the page.
Numeric Entry widgets can be found in Analog Controls.18. Open the properties dialog of the Numeric Entry.
-
126 • Operation and Configuration Student Workbook

7 CustomWidgets and Parametrized Pages
19. Change the text to "Set Speed".20. Close the properties dialog and link the widget to the tag, SetSpeed of
Pump1.21. Add a Numeric Value widget to the page.
The Numeric Value can be found in the folder Gauges >> Basic Analogs.22. Open the properties dialog of the Numeric Value widget.23. Set the horizontal alignment to Align Right.24. Set the type of border to Indented.25. Set the text color to yellow.26. Set the background color to black.27. Close the properties dialog and link the widget to the Speed tag of Pump1.28. Add text below the Numeric Value, to read "Motor speed".29. Copy the Numeric Entry widget and the label and paste a new copy into the
page.30. Place the new copy near the top of the pipe.31. Link the widget to the Flow tag of Pump1.32. Edit the text to read, Flow rate.33. Select All (either Ctrl + A or use the Select tool in the Home Toolbar.)34. Click Group (Home toolbar), then New Widget.35. Set the name to PumpControlDetails.36. Ensure that the Primary Pump tag is selected.
All the child tags and widgets within the group will sort themselves out auto-matically.
37. Click OK.38. Open the Page Properties toolbar.39. Open the Manage Parameters tool.40. Add a parameter, to be named Which Pump.41. Set the parameter type to Tag.42. Select the SupplyPump in the list of Types.43. Click OK.44. Open the properties dialog of the PumpControlDetails widget.45. Change the data source to use the parameter instead of Pump1.46. Proceed to the next exercise, Links to Control the Three Pumps
Exercise 7-6 Links to Control the Three PumpsHaving created one pump control page, you have created all three that arerequired. All that remains is to create navigational links to open the page witheach pump in turn. Rather than editing the menu, this exercise will show you howto create page buttons and page hotboxes.
1. Open the Idea Studio and ensure that the Supply Map page is open.2. Open the Widgets palette and navigate to the Tools folder.3. Open the Standard Library folder.4. Drag a Page Button to the page, placing it near Elm Avenue.
Operation and Configuration Student Workbook • 127

Chapter 7
5. Open the properties dialog of the button.6. Change the label to ElmWell.7. In the Page Title, select Well Details.
A parameter selector will appear.8. Choose the tag, ElmWell.9. Repeat these instructions to add a Page Button to Well Details with
RidgeWell selected.Ridge Road is at the bottom of the screen, so place the button anywhereconvenient that does not require scrolling of the display.
10. Still within the Idea Studio, open the PumpOverview widget.If the pump, P2 is not visible, you may need to temporarily change its opa-city. If so, change the opacity to an expression having a value of 1.You will still be able to select the pump and right-click to open its propertiesmenu even if it cannot be seen in the Idea Studio.
11. Drag a Page Hotbox to the page and place it so that it surrounds the text, P1below pump 1.
Figure 7-10 Placing a Page Hotbox.
12. Open the properties of the hotbox.13. Choose the page, Pump Control14. Change the parameter's data source to Linked Tag.15. Select the child tag, Pump1 under ElmWell.
Figure 7-11 The configured hotbox
16. Repeat to add a hotbox for pump 2.
-
128 • Operation and Configuration Student Workbook

7 CustomWidgets and Parametrized Pages
If you changed the opacity of pump 2's Pump Overview widget, change it backnow.
Close the Idea Studio and operate the system.
Operation and Configuration Student Workbook • 129
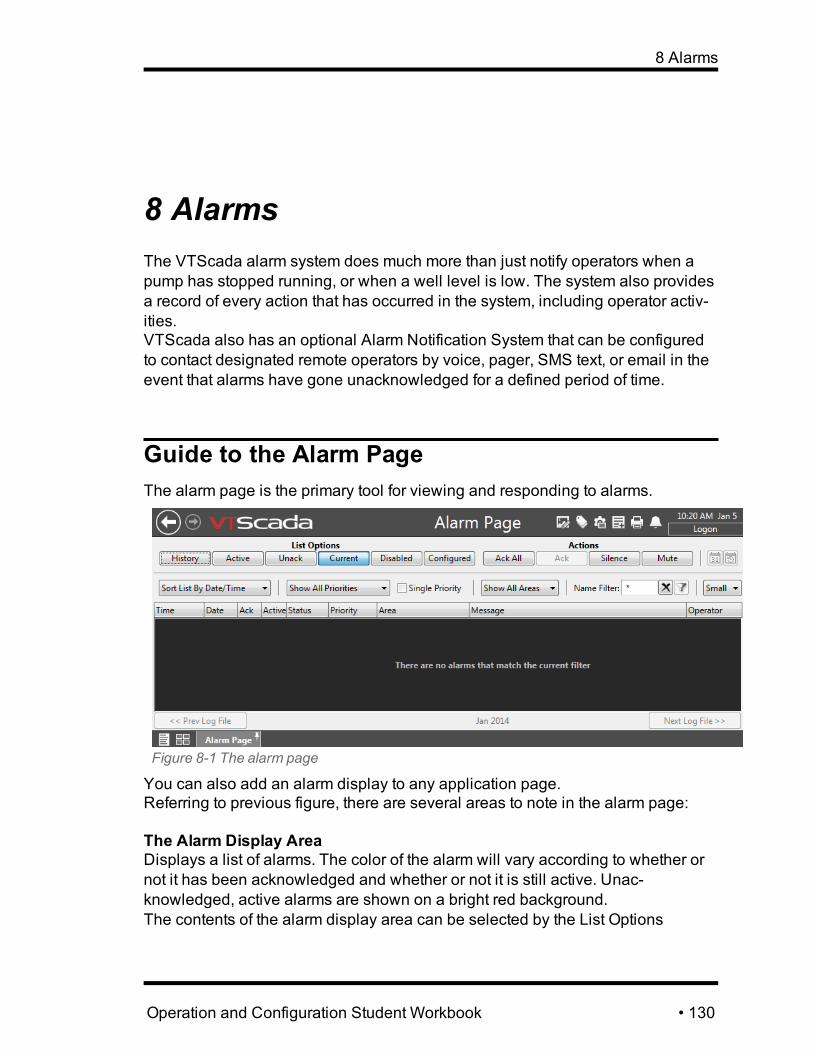
8 Alarms
8 AlarmsThe VTScada alarm system does much more than just notify operators when apump has stopped running, or when a well level is low. The system also providesa record of every action that has occurred in the system, including operator activ-ities.VTScada also has an optional Alarm Notification System that can be configuredto contact designated remote operators by voice, pager, SMS text, or email in theevent that alarms have gone unacknowledged for a defined period of time.
Guide to the Alarm PageThe alarm page is the primary tool for viewing and responding to alarms.
Figure 8-1 The alarm page
You can also add an alarm display to any application page.Referring to previous figure, there are several areas to note in the alarm page:
The Alarm Display AreaDisplays a list of alarms. The color of the alarm will vary according to whether ornot it has been acknowledged and whether or not it is still active. Unac-knowledged, active alarms are shown on a bright red background.The contents of the alarm display area can be selected by the List Options
Operation and Configuration Student Workbook • 130

Chapter 8
The List Optionsl History: Displays all the alarms and other events that have been recorded.Note that the history cannot be edited. This is by design: once recorded,forever stored.
l Active: Displays all alarms that are currently active, meaning that the con-ditions that caused the alarm are still in effect. Active alarms may or may nothave been acknowledged.
l Unack: Unacknowledged alarms are those that have not explicitly beenacknowledged by an operator. The conditions that caused the alarm tooccur may or may not still be active.
l Current: Provides a combination of active and unacknowledged lists. Allalarms that are active or unacknowledged (or both) are considered “current”.
l Disabled: An alarm may be set to be ‘disabled’ as an option of its tag con-figuration. This display gives you a quick list of those alarms that are cur-rently disabled, and which therefore cannot be expected to alert you topossible problems.
l Configured: Provides a complete list of all alarms in an application, showingtheir current status and configured properties.
Filters and Sorting OptionsFor any selected display, the list of alarms may be further filtered by priority andby area. Priorities range from Notice to Critical. Areas are defined as you build theapplication.When a filter is in effect, the entire band containing the filtering options will turnorange.You can sort the display either by name or by priority.
ActionsThe following actions are available to deal with alarms:
Ack All
Acknowledge All – provides a convenient way to quickly mark all unac-knowledged alarms as acknowledged. You should note that marking analarm as acknowledged does not deal with the underlying cause of thealarm: it is simply for the sake of recording that an operator is aware ofthe alarm.
Ack Acknowledge the selected alarm. You should first select an alarm fromthe display before attempting to acknowledge it.
SilenceSilences the alarm sound associated with the most recent unac-knowledged alarm that has occurred in your system. Does not acknow-ledge the alarm.
Mute Ends all alarm sounds until you release the Mute button.
-
131 • Operation and Configuration Student Workbook

8 Alarms
Add Alarms to TagsAlarm tags are used to establish rules for when an alarm should be triggered andwhat actions should occur. Alarms are built into a few types of tags including Ana-log Status, Digital Status and Pump Status. For many other types to be monitored,you must create an alarm tag.You will examine the alarm tag before taking a look at the similarities and dif-ferences with the alarms build into the tags just listed.As usual, alarm tags are created using the tag browser. There are three parts tothe configuration of each: its identity, the rules that will cause the alarm to trigger,and what action should result when the alarm occurs.
Figure 8-2 Alarm tag - ID tab
The description of an alarm tag is especially important if you have the Alarm Noti-fication System option. This is what will be sent to an operator to notify them of acurrent alarm.
The trigger is normally linked to another tag and specifies the setpoint above orbelow which the alarm will be activated. The setpoint can be coded into the tag,or it can link to another tag that allows operator or automatic control. (Recall thatyou created alarm setpoint tags when building Tufts station.)
Operation and Configuration Student Workbook • 132

Chapter 8
Figure 8-3 Alarm tag - Trigger tab
Note the range of options for the function. This allows you to select a comparisonfor the value being watched. Some alarms are triggered when values rise above acertain level, others when values fall below. Eleven different comparison func-tions are available.Two other features on this page are there to help guard against unnecessaryalarms:
l The deadband allows you to specify a range above and below the setpoint,within which values will be ignored.The purpose of this feature is to prevent system noise from repeatedly trig-gering alarms. If the deadband were set to 2 then the alarm in this examplewould still be triggered when the tank pressure reached 95. It would thennot be considered inactive until the level fell below 93. This prevents alarmsfrom being activated and deactivated when the value is close to the triggerpoint.
l The Delay exists to deal with spikes in values.By setting a delay, you indicate that not only must the value reach the set-point; it must stay there for a given length of time before an alarm istriggered.
-
133 • Operation and Configuration Student Workbook
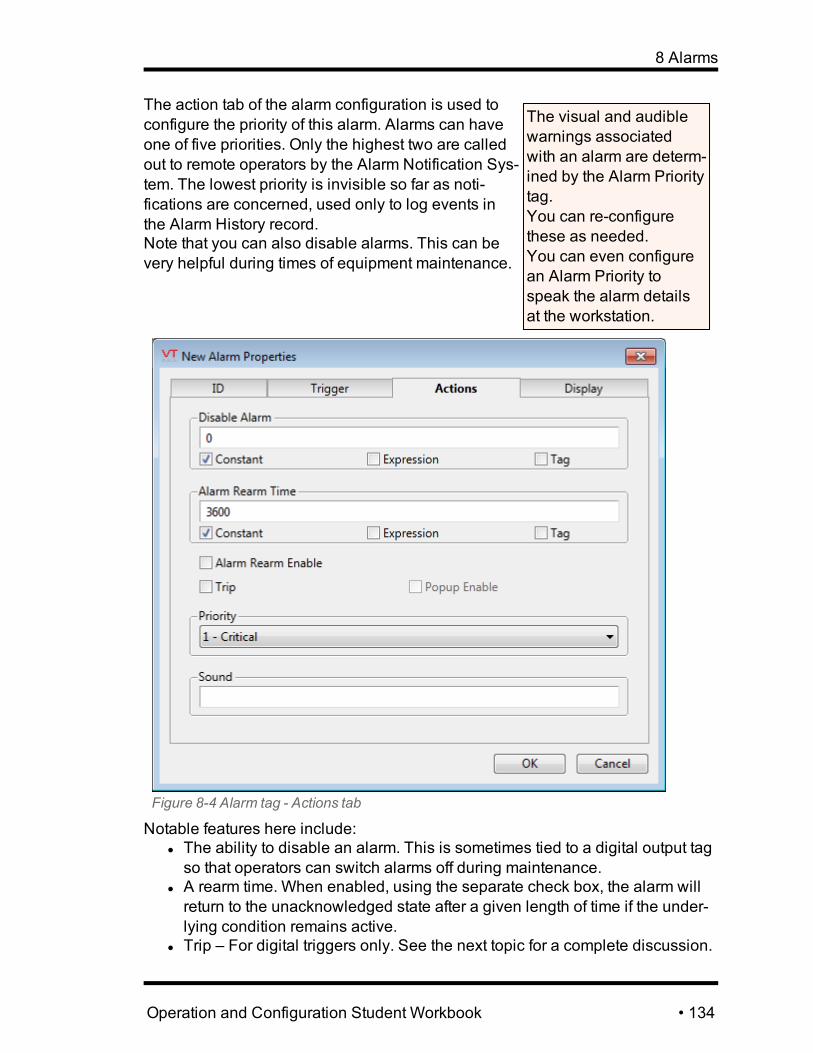
8 Alarms
The visual and audiblewarnings associatedwith an alarm are determ-ined by the Alarm Prioritytag.You can re-configurethese as needed.You can even configurean Alarm Priority tospeak the alarm detailsat the workstation.
The action tab of the alarm configuration is used toconfigure the priority of this alarm. Alarms can haveone of five priorities. Only the highest two are calledout to remote operators by the Alarm Notification Sys-tem. The lowest priority is invisible so far as noti-fications are concerned, used only to log events inthe Alarm History record.Note that you can also disable alarms. This can bevery helpful during times of equipment maintenance.
Figure 8-4 Alarm tag - Actions tab
Notable features here include:l The ability to disable an alarm. This is sometimes tied to a digital output tagso that operators can switch alarms off during maintenance.
l A rearm time. When enabled, using the separate check box, the alarm willreturn to the unacknowledged state after a given length of time if the under-lying condition remains active.
l Trip – For digital triggers only. See the next topic for a complete discussion.
Operation and Configuration Student Workbook • 134

Chapter 8
l The name of a .WAV file may be provided in the sound field if you wouldlike a customized alarm sound such as phasers firing or a warning of a warpcore breach. (The file should be located in the application folder.)
Trip Alarms vs. Level AlarmsThere are two fundamental types of alarms:
“Level” alarms are those that become active after a setpoint value is reached, butwill automatically return to a non-active state if the value of the tag being mon-itored is no longer in violation of the designated setpoint value. For example, if thealarm’s high level setpoint is 100 inches, the alarm will activate when the tankreaches that level. If the level then drops to 99, the alarm will automatically returnto a normal state (note that the alarm must still be acknowledged).
Alarm Status tags.These are true or false ifthere are any alarmsmatching a configuredprofile (priority, area,etc.)They are used for alert-ing operators that thereis an alarm in a givensub-system.
An alarm that has been "tripped" does not count asactive or inactive since the underlying state of theequipment is not relevant to the fact that, at somepoint, the alarm was tripped. They are usually addedto digital input or status tags rather than analogs. Tripalarms do sound and must be acknowledged.For example, if a burglar opens a door, the fact thatthe door goes from an unopened state to an openedstate trips the alarm. In the same way that it is irrel-evant whether or not the burglar then closes thedoor, it is irrelevant whether the underlying state thattripped the alarm remains active. For this reason, tripalarms do not show up in the list of active alarms. The alarm sounds and must beacknowledged (and someone sent to investigate).
Exercise 8-1 Create an Alarm TagIn this exercise, you will create and configure an alarm tag. It will be triggeredwhen the valve downstream of the water tower is more than 90% open. While youcan create an Alarm tag directly from the Tag Browser, it is usually easier to startwith the tag that will be the trigger for the alarm.This particular tag is very far down the tag tree. The exercise begins with a short-cut for finding tags in the hierarchy.
1. Open the Tag Browser.2. Ensure that the root tag is currently selected. (i.e. that the list is not currently
showing tags below one of the wells or menus.)3. Click the All Types selection and choose Analog Input.
-
135 • Operation and Configuration Student Workbook

8 Alarms
4. Select the Show Children option.The Tag Browser now shows all the Analog Input tags in the application.
5. Open the properties dialog of Current Position.6. Open the alarm tab.
The alarm tab of any numeric tag is used to create new alarm tags, pre-con-figured to use the currently-open tag as the trigger.
7. Click Add.The properties dialog for an Alarm tag opens. Note from the name that it willbe created as a child of Current Position.
8. Set the name to "almPosition".9. Set the description to "Valve too far open".10. Open the Trigger tab.
The parent tag has already been selected for you.11. Change the function to "Greater Than or Equal to >=".12. Change the Setpoint to 90.
Figure 8-5 The configured Trigger tab.
13. Open the Actions tab14. Set the Priority to 3 - Warning.
The valve being open does not count as a critical alarm situation.15. Click, OK.16. Close the Tag Browser. If the Idea Studio is open, close that too.17. Open the Tower Details control page.18. Open the valve and change the setpoint to 95.
Operation and Configuration Student Workbook • 136

Chapter 8
19. The alarm will activate.20. Open the Alarm Page and acknowledge the alarm.
It will still be shown in the list of Current Alarms since the trigger condition isstill active.
21. Change the valve setpoint to 60.
Exercise 8-2 Configure Alarms Built Into TagsMost of the monitoring tags in this application use the Analog Status type. Thesehave high and low alarms built in. You can also add alarm tags to them if yourequire more alarm conditions; for example, if the design calls for three high levelalarms: 'High level warning', 'High level danger' and 'High level critical'.
When you built the monitoring page for the water tower, you created a user-inter-face for the high and low level alarm setpoints. In this exercise, you will tie thoseto alarms on the water tower's level.
Preparation: The Tower Details page should be open. Both the Idea Studio andthe Tag Browser should be closed.
1. Right-click on the water level indicator in the tower.A context menu should open.
2. Click, Alarm Settings.3. Configure the alarms as shown in the following figure.
-
137 • Operation and Configuration Student Workbook

8 Alarms
Figure 8-6 Alarm configuration
4. Save your work.
5. Using the pump controls in either of the wells, and the valve control for thetower, raise and lower the water level in the tower to test the alarms.Experiment with the setpoint sliders as well.
The final few steps will give you a chance to see how alarms can be disabled.
6. Right-click on the tower's water level indicator.7. Click, Disable Low Alarm.
Operation and Configuration Student Workbook • 138
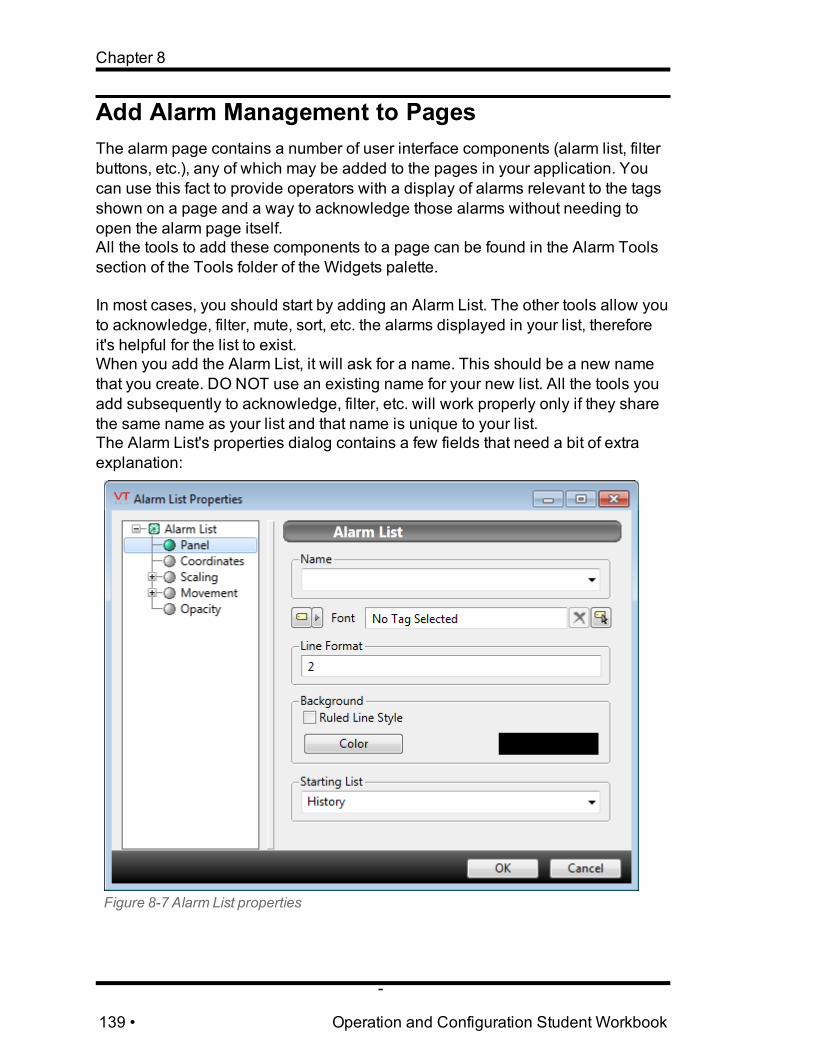
Chapter 8
Add Alarm Management to PagesThe alarm page contains a number of user interface components (alarm list, filterbuttons, etc.), any of which may be added to the pages in your application. Youcan use this fact to provide operators with a display of alarms relevant to the tagsshown on a page and a way to acknowledge those alarms without needing toopen the alarm page itself.All the tools to add these components to a page can be found in the Alarm Toolssection of the Tools folder of the Widgets palette.
In most cases, you should start by adding an Alarm List. The other tools allow youto acknowledge, filter, mute, sort, etc. the alarms displayed in your list, thereforeit's helpful for the list to exist.When you add the Alarm List, it will ask for a name. This should be a new namethat you create. DO NOT use an existing name for your new list. All the tools youadd subsequently to acknowledge, filter, etc. will work properly only if they sharethe same name as your list and that name is unique to your list.The Alarm List's properties dialog contains a few fields that need a bit of extraexplanation:
Figure 8-7 Alarm List properties
-
139 • Operation and Configuration Student Workbook
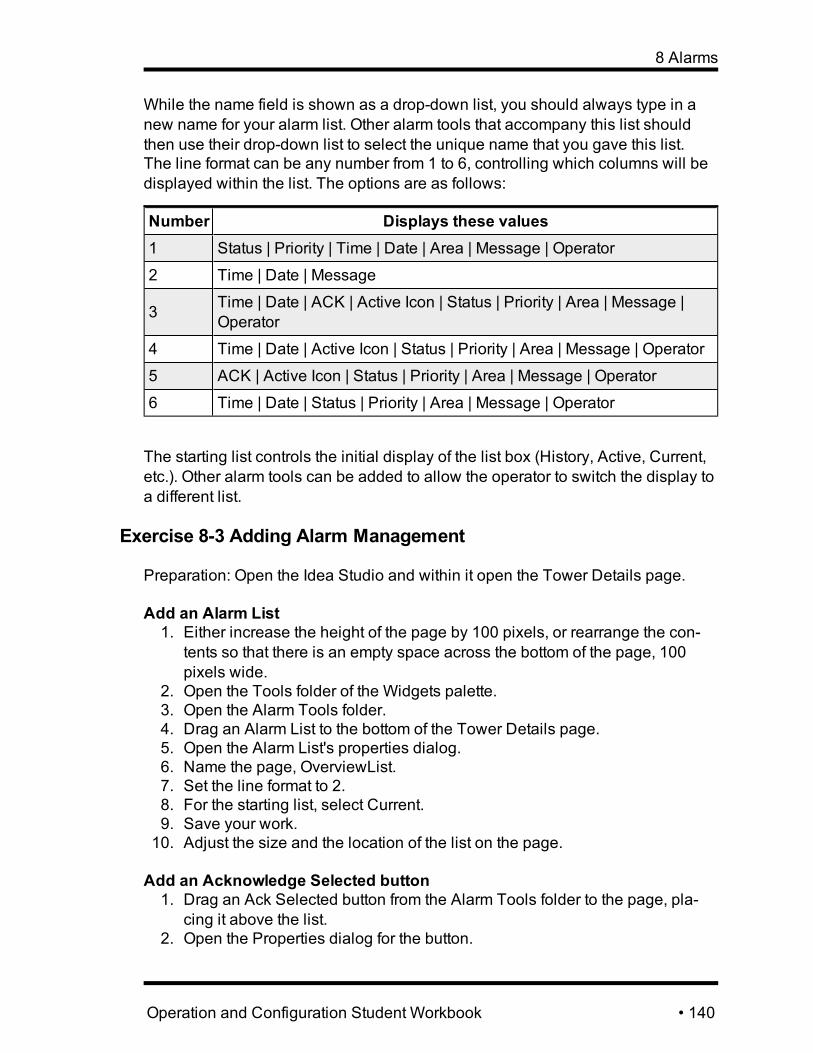
8 Alarms
While the name field is shown as a drop-down list, you should always type in anew name for your alarm list. Other alarm tools that accompany this list shouldthen use their drop-down list to select the unique name that you gave this list.The line format can be any number from 1 to 6, controlling which columns will bedisplayed within the list. The options are as follows:
Number Displays these values1 Status | Priority | Time | Date | Area | Message | Operator
2 Time | Date | Message
3 Time | Date | ACK | Active Icon | Status | Priority | Area | Message |Operator
4 Time | Date | Active Icon | Status | Priority | Area | Message | Operator
5 ACK | Active Icon | Status | Priority | Area | Message | Operator
6 Time | Date | Status | Priority | Area | Message | Operator
The starting list controls the initial display of the list box (History, Active, Current,etc.). Other alarm tools can be added to allow the operator to switch the display toa different list.
Exercise 8-3 Adding Alarm Management
Preparation: Open the Idea Studio and within it open the Tower Details page.
Add an Alarm List1. Either increase the height of the page by 100 pixels, or rearrange the con-
tents so that there is an empty space across the bottom of the page, 100pixels wide.
2. Open the Tools folder of the Widgets palette.3. Open the Alarm Tools folder.4. Drag an Alarm List to the bottom of the Tower Details page.5. Open the Alarm List's properties dialog.6. Name the page, OverviewList.7. Set the line format to 2.8. For the starting list, select Current.9. Save your work.10. Adjust the size and the location of the list on the page.
Add an Acknowledge Selected button1. Drag an Ack Selected button from the Alarm Tools folder to the page, pla-
cing it above the list.2. Open the Properties dialog for the button.
Operation and Configuration Student Workbook • 140

Chapter 8
3. In the name drop-down, select OverviewList.4. Change the label to read, "Ack. Selected".5. Change the tool tip to read, "Acknowledge selected alarms".6. Save your changes, then adjust the size and location of the button if
required.
Add Alarm Filters1. Drag a Filter Field button from the Alarm Tools folder to the page, placing it
beside the Ack Selected button.2. Open the properties dialog.3. For the alarm list, select OverviewList.4. For the button label, type "Tufts".5. Change the tool tip to read, "Filter for Tufts alarms".6. In the field number, select "Area".7. Type "Tufts" as the Field Value.8. Save your work.9. Repeat these steps to create a filter for "Elm".10. Repeat the steps again to create a filter for "Ridge".11. Repeat for one more button, except that this should be labeled, "All". The
tool tip should read "Remove filter" and the field value should be empty.12. Operate the system to trigger a new alarm, then test the tools you have just
created.
-
141 • Operation and Configuration Student Workbook

9 The Alarm Notification System
9 The Alarm Notification SystemIf your VTScada license includes the Alarm Notification System, you can sendalarm notifications out to operators as:
l Spoken alarms via a modem.l Email messages, using a third-part email server.l SMS text messages, using an SMS appliance.
Operators can also acknowledge alarms via any of these mediums.
Roster ConfigurationRosters control who is contacted when an alarm is triggered and how that contactis made. The notification is not sent immediately - a delay (that you can configure)allows on-site operators a chance to acknowledge alarms before any notificationis sent to operators who are off-site.Only Critical and High priority alarms are sent. Lower priority alarms do not triggerremote notification.Rosters are grouped by their Area property. For any given Area, only one rostermay be active at a time. This allows you to configure rosters for separate shifts.Also, one roster in any area must be active at all times. You do not deactivate aroster, you simply make a different one in the Area active.Alarms are sent to the roster with a matching Area property. If there is no roster foran alarm with a particular Area property, then the Area property of the trigger tagis checked. If there is no roster for that either, then a default roster having no Areawill be used. If there is no such roster, then one active roster on the system will bepicked at random
Operation and Configuration Student Workbook • 142

Chapter 9
Figure 9-1 A sample roster
You may add up to 30 contacts to the list. They need not be unique; you can con-tact the same person several times, using a different phone number or com-munication method for each.Phone numbers are cleaned before use. Parentheses, dashes and spaces are allremoved. Email addresses must be correctly formatted.
The Contact User Name field refers to the operator's security account log-inname. This field need not be set if your intention is only to send alarm noti-fications out to an operator; however, if you want to allow the operator to acknow-ledge the alarm remotely, then the Contact User Name is mandatory.For the email and SMS text communication methods, if alarm acknowledgment ispossible (a valid Contact User Name is provided) then a notification code will besent with the notification. The operator acknowledges the alarm by sending thatcode back to VTScada . For voice acknowledgment, a menu is provided -
-
143 • Operation and Configuration Student Workbook

9 The Alarm Notification System
operators can step through the menu and acknowledge alarms by pressing theappropriate buttons on their phone.
Email and SMS-Text NotificationIf you have configured the Roster tag to send alarm notifications by email or SMSmessage, you can also configure it to accept alarm acknowledgments by email.When this feature has been configured, operators will receive an acknow-ledgment code by email for each alarm in the system. They can reply directly tothe message, thereby acknowledging the alarm.After configuring the necessary communications, (an email server or an SMSappliance), alarm notifications may be sent. To also acknowledge alarms via thesame communication method, you must a) include the operator's security accountname in the Roster tag configuration and b) configure the means of com-munication to allow incoming message.
The acknowledgment code is tied to the specific alarm and to the operator's secur-ity account name. The acknowledgment code will not apply to any other alarm,including a later alarm triggered by the same tag, nor will it work for any otheroperator.
To configure your system to acknowledge alarms by email:A. Configure the Incoming and Outgoing Alarm Emails properties. These can
be found in the Application Configuration dialogs, under the Alarms tab ofthe Edit Properties page.The "From" address must be the account by which VTScada will receiveacknowledgments. This is the address that operator replies will be sent to.A POP3 server must be configured with the account that VTScada will useto receive alarm acknowledgments. (See: Email Options, in the VTScadaHelp guide)
B. Configure the Roster tag so that entries that send notifications by email,include the operator's security account user name. (See: Create a RosterTag, in the VTScada Help guide)
C. Configure the application properties AlarmCheckMail and AlarmCheck-MailFastPoll to control the frequency at which VTScada checks for replies,and AlarmEditEmailAck to choose whether the operator must edit the mes-sage before replying.
Note that some email servers will shut down an account that polls too frequently,as a suspected spam source. The default value of 60 seconds for AlarmCheck-MailFastPoll will trigger this on some third-party email servers.
Operation and Configuration Student Workbook • 144

Chapter 9
SMS text configuration is the same, except that you configure an SMS appliancerather than an email server.
The message received by the operator will appear similar to the following. Thealarm code is unique to the operator, the alarm and the time of the alarm, makingit extremely difficult to guess. Codes cannot be reused or given to another oper-ator to use.
From: The VTScada System [mailto:The VTScada System]Sent: December-14-11 10:43 AMTo:Subject: The VTScada System: 1 alarm
12/14/2011, 10:42 AM. Default Default Test Alarm.Code: LPXXTo acknowledge the alarm, reply with ACK*XXXX, where XXXX is thealarm code in this email.A confirmation message will be sent upon successful alarm acknow-ledgment. No reply to the acknowledgment will be sent otherwise.In the Alarm History, the words "by email" will be appended to theoperator's name to indicate that the alarm was acknowledged viaemail.
ModemsIf you have purchased the Alarm Notification System, and have one or moremodems attached to your network, then you can configure VTScada to telephoneoperators when alarms occur. Queues may be created such that if the first oper-ator on the list does not answer, the next will be called. You can also configurethe application such that alarms in one area of the system will be sent to a par-ticular list of operators, while alarms from another area will be sent to a differentlist.
-
145 • Operation and Configuration Student Workbook

9 The Alarm Notification System
Be careful when buyinga modem for use with theAlarm Notification Sys-tem. Not all that advert-ise the required featureset actually provide it.
It's always worthwhile tocheck with Trihedral tech-nical support for recom-mendations.
The ModemManager Service takes care of all thesefeatures and enables modems distributed across anumber of different workstations to be managed as acommon pool.All modem access uses TAPI – the Microsoft tele-phony management layer that enables programs toshare and pass calls. TAPI allows telephonyresources to be shared between multiple applic-ations. It interfaces to a modem driver so VTScadadoesn't have to be configured for the specifics of themodem.Both a modem audio driver and a TAPI Service Pro-vider (TSP) are provided by Trihedral. These havebeen designed to avoid several of the problems associated with the older Unim-odem 5 driver, including its limitation in detecting and switching between voicevs. data calls. The Unimodem 5 Driver is still available, but we recommendagainst using it with the Alarm Notification System.
Setting Dialer PronunciationThe Lexicon dialog, found in the Alarms tab of the Edit Properties page of theApplication Configuration dialog, allows you to adjust how words will be pro-nounced when the Alarm Notification System calls an operator. The default lex-icon is somewhat limited.
You have the ability to add new words that are relevant to your situation, and toadjust how they will be pronounced by the Alarm Notification System for max-imum clarity. When the Alarm Notification System announces an alarm on a tag, itwill read out the tag name and description. It will make its best guess as to the pro-nunciation of each word unless you define them here.Consecutive capital letters are pronounced individually, thus "VTScada" isspoken "Vee Tee Scada".
Configuring Alarm Notification OptionsThe Alarm Notification section of the properties page can be used to set the con-ditions under which registered operators will be contacted by your application'sAlarm Notification System.
Operation and Configuration Student Workbook • 146

Chapter 9
Figure 9-2 Alarm Notification Options
Note the option for selecting the initial section to use of the menu system. In somesituations, it may save the operators time to jump directly to the list of unac-knowledged alarms rather than starting at the main menu. Optional start pointsare as follows:
l Main Menul Unacknowledged Alarmsl Active Alarmsl Controll Station Status
Notification System ConfigurationThe Alarm Notification System requires that the following components be con-figured:
Hardware or 3rd-party programs
-
147 • Operation and Configuration Student Workbook

9 The Alarm Notification System
l If using phone or pager notification, at least one voice modemmust beinstalled.
l If using email notification, an email server must be available.l If using SMS-text notification, an SMS appliance must be installed.
VTScada tag configurationl Two or more Roster tags: the first of which must have no operator contactrecords configured (so that the Alarm Notification System may be disabledwhen not in use), and the subsequent roster tags which can have up to 30operator contact records configured.
l A Modem tag with a blank Area property, if a modem is being used.l An SMS Appliance tag if an SMS Appliance is being used.
Other VTScada configurationl The Call-out List page (One of the pages VTScada adds to all applications)must be configured with the available roster tags drawn as Make Active but-tons. The pressed button selects the group of operators who will be con-tacted when unacknowledged alarms occur.
l User accounts that have been granted at least the Alarm Acknowledge priv-ilege for each operator who is to be on call.
l Alarm Notification System options.l The roster you wish to use must be enabled.l Various properties are available to control the template of the alarm mes-sage, the selection of voice, email configuration, and much more.
Configuring a Modem TagThe Settings tab of the modem tag configuration screen contains properties thatallow you to configure the network and security settings for the modem tag.
Workstation NameThe Workstation Name field enables you to specify the name of the computer towhich the modem is connected. If you do not specify a workstation in the Work-station Name field, VTScada assumes a local modem that is not in the modempool, and which is bound to the first free modem on each machine.Once the workstation name has been specified, the Line Name and Name OrIndex On Workstation drop-down lists will automatically update to display thenames of the serial port tags and modems available on this workstation.
Line NameThe Line Name drop-down list enables you to select the name of an existingphone line to which this modem is attached, or enter a new and unique line name.This name must be unique, and cannot be identified anywhere else in the system.The same line name must be used by modems sharing the same physical phoneline, even if they are on different workstations.
Operation and Configuration Student Workbook • 148
Chapter 9
Name or Index on WorkstationThe Name or Index on Workstation drop-down list enables you to select a modemon the workstation specified in the Workstation Name field, provided that the work-station is available. If the specified workstation is not currently available, you mayenter the name of the modem you wish to use, or can enter a number or text valueas follows:
l If this value is numeric, it is the index into the list of modems shown in theModems Properties dialog box in the Windows Control Panel, starting from1.
l If the value of Index is a text string, it is the name of the modem exactly as itappears in the Modems Properties dialog that is accessed using the Win-dows Control Panel.
Because the index of available modems can change over time, it is recom-mended that you refer to the modem by name rather than by its index in theModem Properties dialog box.
Ring CountThe Ring Count spin box enables you to select the number of rings you wish tooccur before the selected modem answers an incoming call.If the value of Ring Count is 0, the modem will not answer any calls.Regardless of this setting, the modem will not be answered if the Application Prop-erty, AnswerCalls, is set to 0.
Security BitThe Security Bit drop-down list enables you to select an existing application-spe-cific privilege that will restrict output access for this tag. Users who wish to usethis tag to send an outgoing signal to the I/O device or modemmust have the priv-ilege by which this tag is protected granted to their user account.If the Security Bit drop-down list is left blank, there is no security specified for thetag.
Configuring a Modem for Tag I/OModems are not just for alarm notifications. You can also use them as the port fortag I/O. This is done by selecting the Use Modem check box when configuring anew serial port tag.
The phone number is used only if the modem is being used for telemetry com-munications – not for the Alarm Notification System. In very rare cases, yourmodemmay require a specialized initialization string. If using one of the modemsrecommended by Trihedral (see website for a current list), then you will not needto provide an extra initialization string here.
-
149 • Operation and Configuration Student Workbook

9 The Alarm Notification System
Modem DiagnosticsTo help diagnose modem problems, it is helpful to include a Modem Indicatordraw method on the application for each modem in the system. This will quicklytell you that the modem is offline before you spend time examining the con-figuration settings within VTScada.Modem Indicator widgets can be found in the Widgets palette, Analytics >> Dia-gnostics.
In the Tools >> Modem Tools folder you will find other widgets that can help youto diagnose modem problems. These include the Modem Event Log, Modem Stat-istics, and Modem Status. You may wish to consider creating a page just formodem diagnostics.
Finally, in your Windows modem configuration, you should select the option"Append to Log".
Operation and Configuration Student Workbook • 150

Chapter 9
9 Record Data From TagsVTScada uses a proprietary storage system for recording tag data. Tools areprovided with VTScada so that you can extract the data when and how you wish.You could configure VTScada to write to a commercial database such asOracle®, MS SQL Server® or MySQL®. VTScada will use its own data storagesystem within these databases, so you will probably still want to use the VTScadatools for retrieving the data, even if you are using another database for storage.All of the work required to collect and save data is managed by a tag named theSystem Historian. This tag will be present in every VTScada application. You canadd more Historian tags of your own, but this would be an unusual thing to do inmost applications. Extra Historian tags are used for purposes such as load dis-tribution across computers in very large applications.
The System Historian provides only a few configuration options through the userinterface. They are:
l You can choose whether or not to represent system downtime as missingdata.If represented as missing data, a graph showing tag values across a periodof time when the system was down would show an empty gap for that time.The alternative results in a graph that shows flat lines of the last knownvalue across the period of downtime.
l You can choose to limit the storage of data.If there is no need to save data for longer than a month, year or other timeframe, you can configure the Historian tag to automatically delete older val-ues.
This chapter does not cover advanced configuration options of the Historian, suchas sending data to a 3rd party database.
Choosing What to RecordSeveral tag types have a link to the System Historian built in. For example, theAnalog Status tag has a Historian link as shown in the following figure.
Figure 9-3 Typical Historian tab of a tag properties dialog
-
151 • Operation and Configuration Student Workbook

9 Record Data From Tags
Values are recorded on change – subject to a deadband that requires the changeto be of at least a certain amount. The X button allows you to deselect the His-torian, thereby not recording a particular tag's value.
Many tag types do not have a Historian link built in. For these, you must first cre-ate a Logger tag for each tag whose data you wish to record. The Logger tag doeshave a link to the Historian, similar to the Analog Status. It also provides severaloptions to control when data is recorded. You could choose to record on change(with no deadband available) or you could choose to record values at a set fre-quency, or both.The three configuration panels of a Logger tag are shown in the following figure.The first panel provides the link to the data source. In the second panel, the rate oflogging is defined. Finally, the third panel provides the link to the Historian tagthat does the actual work of recording the data.
Figure 9-4 Logger tag configuration
The Logger tag has two advantages over tags that connect directly to a Historian:You can configure it to log on both time and change. You can also link it to a third
Operation and Configuration Student Workbook • 152
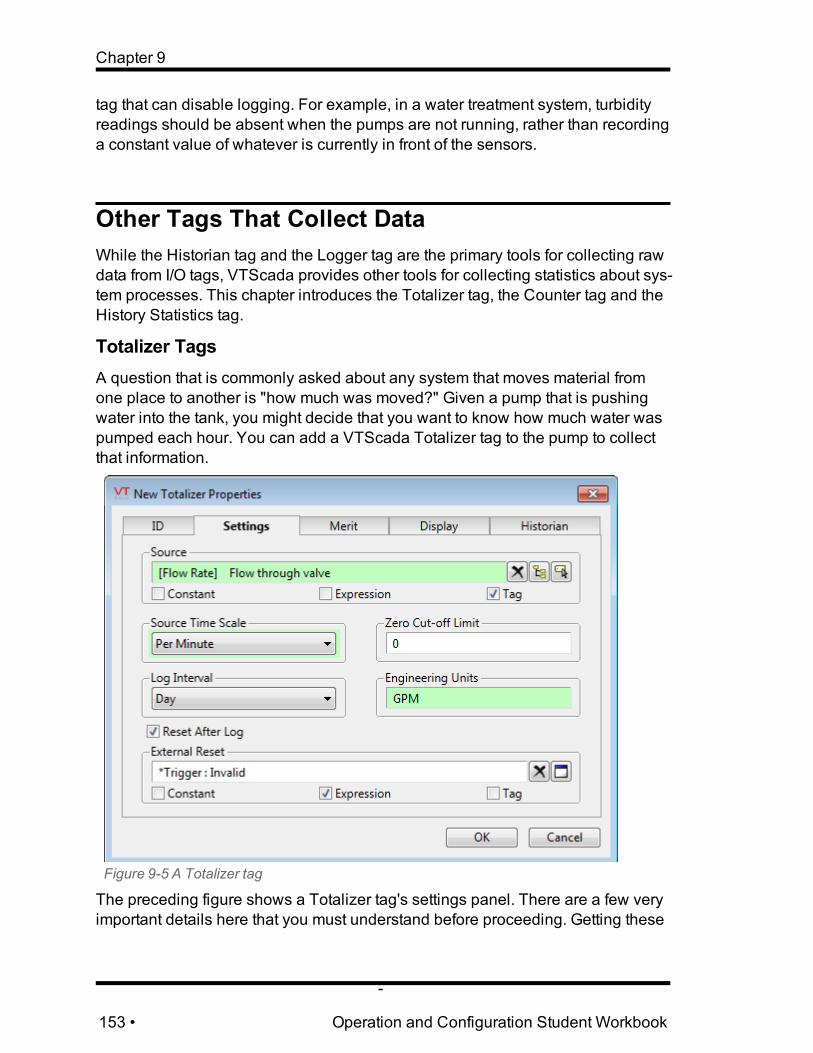
Chapter 9
tag that can disable logging. For example, in a water treatment system, turbidityreadings should be absent when the pumps are not running, rather than recordinga constant value of whatever is currently in front of the sensors.
Other Tags That Collect DataWhile the Historian tag and the Logger tag are the primary tools for collecting rawdata from I/O tags, VTScada provides other tools for collecting statistics about sys-tem processes. This chapter introduces the Totalizer tag, the Counter tag and theHistory Statistics tag.
Totalizer TagsA question that is commonly asked about any system that moves material fromone place to another is "how much was moved?" Given a pump that is pushingwater into the tank, you might decide that you want to know how much water waspumped each hour. You can add a VTScada Totalizer tag to the pump to collectthat information.
Figure 9-5 A Totalizer tag
The preceding figure shows a Totalizer tag's settings panel. There are a few veryimportant details here that you must understand before proceeding. Getting these
-
153 • Operation and Configuration Student Workbook

9 Record Data From Tags
details wrong will mean that the values reported by your Totalizer tag will bewrong.
The source is the tag whose flow (or other monitored value) is to be counted forthe total. This is expected to update on a regular interval such as once persecond, once per minute or once per hour.The source time scale must match the frequency with which the data sourceupdates. If the data source is updating once per minute (e.g. a sensor is mon-itoring gallons per minute) then the source time scale must be minutes. Setting itto any other option will result in the total being miscalculated. For example, if thesource is reporting gallons per minute, but the source time scale is set to seconds,then every second the totalizer will add the GPM rate to the total. The displayedresult will be at least 60 times too large.The log interval allows you to select the frequency with which the total is loggedand (usually) reset to begin counting again. The reset feature is optional: You canlog the running total every hour, but continue counting without resetting.The zero cut-off limit allows you to filter out noise that may occur close to zero. Set-ting a value here results in all values within that range of zero being excludedfrom the count.You also have the option of configuring a tag that will serve as an external reset.With this feature, you could record the running total every hour throughout theday, and reset to zero at midnight each night.
Exercise 9-1 Logging Data
1. Open the Tag Browser and expand the tree until you can see Valve 1 belowTower1.
2. Add a new child tag to Valve 1.3. Select Totalizer as the type.4. Set the name to "Tower Totals".5. Set the description to "Volume flow to municipality".6. Open the Settings tab.7. Configure as follows:
Source Flow Rate
Source Time Scale Per Minute
Log Interval Hour
Reset After Log Checked
Zero Cut-off Limit 0.1
Engineering Units gal
Operation and Configuration Student Workbook • 154

Chapter 9
8. Save the tag.9. Open Supply Map page for editing in the Idea Studio.10. Add a Numeric Value widget to the page, near the Tufts site map indicator,
and link it to the tag you have just created.11. Add a label, "Volume this hour" below the Numeric Value.
Counter TagsThese tags count discrete events. Pump cycles, alarms, and anything else thatchanges state from 0 to non-zero and back again can all be counted.
You can get around thatlimitation of analog tagsby adding a Deadbandtag, or by creating a Cal-culation tag with anappropriate expression.
The key point when configuring a counter tag isthe selection of the source. This must be some-thing that changes value from 0 to non-zero. Ana-log tags can be counted, but be warned that theirvalue often does not drop to exactly zero. A trans-ition from 0.000001 to 1 will not be counted.
Exercise 9-2 Count Start/Stop CyclesYour task in this exercise is to add a counter tag to the Supply Pump definitionand make it a part of the Pump Control DM, using a Numeric Value drawingmethod.
1. Open the Tag Browser and navigate the tag tree to find Pump1 below ElmWell.
2. Add a new child of type Counter to Pump1.3. Configure as follows:
Name PumpCycles
Description Count of on/off cycles
Source ..\Pump1\Status
Log Interval Day
Engineering Units Cycles
Reset after log Checked
4. After saving the Counter tag, right-click on its parent, then click "UpdateType".Remember the earlier warnings about the Update Type command. This isthe situation that this command was created for: redefining the type byadding a new child tag. If you expand the list of tags for Pump2 after run-ning the Update Type command, you will discover that the counter hasbeen added to it as well.
-
155 • Operation and Configuration Student Workbook

9 Record Data From Tags
5. In the Idea Studio, open the widget, PumpControlDetails.6. Add a Numeric Value widget7. Open the widget's properties dialog and set the data source to Linked Tag
Property. Select the child tag, PumpCycles.8. Configure the widget to match the existing Numeric Values, and add an
appropriate label.
Figure 9-6 Pump control with a counter
9. Close the Idea Studio and operate any pump. The cycle count shouldincrease with each start.
History Statistics TagsThese tags will perform seven statistics functions on a given I/O tag's loggedvalues. These calculations include both totals and counts, but the History Stat-istics tag differs from the Totalizer and the Counter in that it adds a time rangeto the equation. This time range looks at the values logged over X minutes,updated every Y minutes.
Operation and Configuration Student Workbook • 156

Chapter 9
Figure 9-7 History Statistics time frames
The History Statistics tag may itself be logged, in order to create a record ofchanges in the calculated value over time. A connection to a Historian is not cre-ated automatically in History Statistics tags.
The calculations performed include:l Time-weighted average – average value over a specified length of time.l Minimum value during periodl Maximum value during periodl Value at startl Count of zero to non-zero transitions (e.g. equipment starts)l Non-zero time (example: total time that a pump was running during theperiod)
l Totalizer, calculated as the sum of the values logged during the time period.
While the History Statistics tag will perform all seven calculations, only one cal-culation will be shown. To access the other six, you must create more History Stat-istics tags, each of which will use the primary tag as its data source and which willdisplay one of the other calculations.
There are also the Digital Statistics tag and the Analog Statistics tag. Both launcha large number of History Stats. tags as children, collecting stats for a wide rangeof time periods.You can limit the impact by un-selecting time ranges you don't need.
Exercise 9-3 Statistics from the Supply Valve
-
157 • Operation and Configuration Student Workbook

9 Record Data From Tags
1. Reopen the Tag Browser and navigate to Valve1 under the Water Tower.2. Add a new child tag to OpenCloseStatus, setting the type to History Stat-
istics.3. Set the tag name to "OpenTime".4. Set the description to "Valve open time".5. Open the Source Settings tab.
Since you added this tag as a child of a numeric tag, the source is auto-matically configured.
6. Set the Statistic selection to Non-Zero Time.7. Set the Scaling Factor to 0.16667.
That's 1/60, scaling from seconds to minutes.8. Set the Engineering Units to "min." for minutes.
Figure 9-8 Configured History Statistics tag
9. Open the Data Period tab.10. Change the period to record the latest day, updated every hour.11. Save your work.12. In the Idea Studio, draw this tag on the Tower Details page as a Numeric
Value widget.
Operation and Configuration Student Workbook • 158

10 System Monitoring Tools
10 System Monitoring ToolsThe logged data for each tag is stored in directories named after that tag. Therewill be one set of these directories for each Historian in the application, all ofwhich are collected under a folder named DATA. (For example, C:\VTS\Well_AJH\Data\History\SystemHistorian\.)The data files use a proprietary storage format. To read from these files, you mustuse the tools included with VTScada .As an alternative, you can configure the Historian tag(s) to save data to a 3rdparty database such as Oracle® or MySQL®. If doing so, it is your responsibilityto install and maintain the database program and data. Data will still be organizedin a way that makes it easy for the VTScada tools to read, but not so much forhumans to query. Whether you use the VTScada data storage system or a 3rdparty database, the primary tools for reviewing historical data are always the His-torical Data Viewer and the VTScada Reports Page.
In general, the default configuration of the System Historian will be more thanadequate for most applications. Full details of and instructions for alternative con-figurations can be found in the VTScada Help Guide.In any case, it is highly recommended that you make a backup of the historicaldata on a regular basis. The best method for doing this is to install VTScada on asecond computer that is configured to run the application as a backup server.Data is automatically mirrored on both machines, and it is a simple matter toreplace a server should one fail. You can also copy the Data folder structure to asecure location on a regular basis, recognizing that you may lose the data col-lected between backups.
The Historical Data Viewer (HDV)When you left-click on the drawing object for any input or status tag in a runningpage (not in the Idea Studio), the Historical Data Viewer immediately opens,showing you a live view of the values being recorded by that tag.
Operation and Configuration Student Workbook • 159

Chapter 10
Figure 10-1 The Historical Data Viewer
If the Historical Data Viewer does not show any data for a tag that you are sureshould have a fluctuating value, then the first thing to check is the time framebeing displayed. Located at the top center, the default value is likely to be 1 day.Selecting a 5 minute time frame to display will result in a much more rapidlyupdated graph.Unless you attach a Historian tag to an input (either directly or, through a logger),the Historical Data Viewer will show only the values that occurred from the timeyou opened the viewer to present.Before looking very closely at VTScada’s system monitoring tools, it is worthreviewing the concept of the Historian tag. To put it simply, data that has not beencollected cannot be shown. Historian tags exist for the purpose of collecting andsaving tag values.Some tags include built-in links to a Historian. These tags are: Analog Status,Digital Status, Pump Status, Totalizer and Counter. Other tags require that a Log-ger tag be created, which will collect data from the I/O tag at a user-specified rateand provide it to a Historian tag for recording.
-
160 • Operation and Configuration Student Workbook

10 System Monitoring Tools
Add a Mini HDV to a PageOne of the widgets available for most numeric tags is “Plot Data”. This allows youto display the graph portion of the historical data viewer right on an applicationpage for continuous monitoring of an input.You can find the Plot Data widget in the folder Analytics >> Trends and HistoricalData.
Figure 10-2 The Plot Data widget.
The properties dialog for this widget provides a full range of options to control thetime frame displayed, the graph, the color schema and much more.
Unlike the full HDV, the Plot Data widget can display the value of only one tag.
Operation and Configuration Student Workbook • 161

11 Report Features
11 Report FeaturesReports are created using the Reports page. This is a standard page includedwith every VTScada application. The page is divided into six boxed sections,designed to be completed in order. You create a report by:A. Select a type.B. Select the tags to report on. (Only logged tags have history that can be
included in a report, but VTScada won't stop you from selecting a tag withno logged history.)
C. Select the time frame to be covered by the report.D. Optionally, repeat that time frame for a number of previous periods.E. Select the destination (and format) for the output.F. Optionally modify the output if the selected destination was either Microsoft
Excel® or Access®.
Report Types:The following report types are included:
Daily snapshot report The value of selected tags at a particular time eachday throughout the report period.
Daily total report The total data accumulated for a selected set of tags atthe current time within a user-defined time period.
Driver communicationerror detail report A summary of error activity for a specified time period.
Driver communicationsummary report
A summary of driver activity for a specified time period,including response times, data quality, etc.
Hourly snapshot report A snapshot of the value of each tag in a selected set ofloggers at each hour within a specified time period.
Hourly total report The total data accumulated hourly for a selected set oftags within a specified time period.
Standard report the value of each selected tag, every second or so fora specified time period.
Operation and Configuration Student Workbook • 162
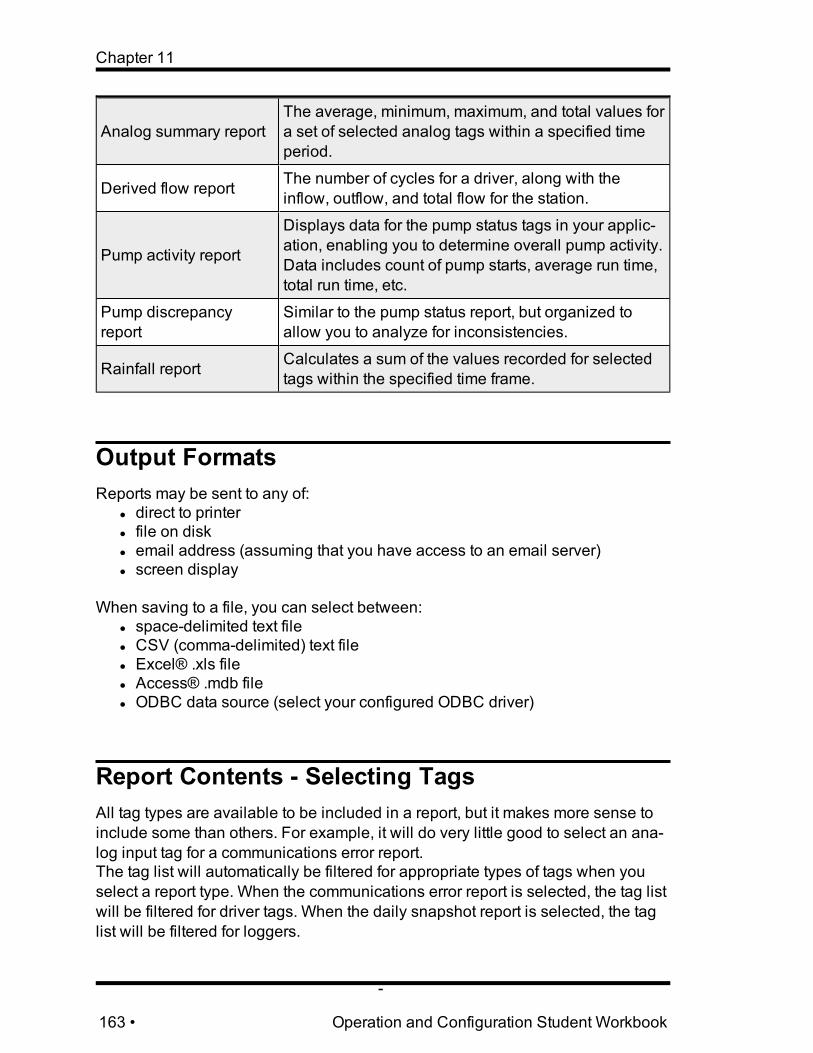
Chapter 11
Analog summary reportThe average, minimum, maximum, and total values fora set of selected analog tags within a specified timeperiod.
Derived flow report The number of cycles for a driver, along with theinflow, outflow, and total flow for the station.
Pump activity report
Displays data for the pump status tags in your applic-ation, enabling you to determine overall pump activity.Data includes count of pump starts, average run time,total run time, etc.
Pump discrepancyreport
Similar to the pump status report, but organized toallow you to analyze for inconsistencies.
Rainfall report Calculates a sum of the values recorded for selectedtags within the specified time frame.
Output FormatsReports may be sent to any of:
l direct to printerl file on diskl email address (assuming that you have access to an email server)l screen display
When saving to a file, you can select between:l space-delimited text filel CSV (comma-delimited) text filel Excel® .xls filel Access® .mdb filel ODBC data source (select your configured ODBC driver)
Report Contents - Selecting TagsAll tag types are available to be included in a report, but it makes more sense toinclude some than others. For example, it will do very little good to select an ana-log input tag for a communications error report.The tag list will automatically be filtered for appropriate types of tags when youselect a report type. When the communications error report is selected, the tag listwill be filtered for driver tags. When the daily snapshot report is selected, the taglist will be filtered for loggers.
-
163 • Operation and Configuration Student Workbook

11 Report Features
You also have the option of further filtering the list by area. The available tags,matching the filtered type, will be displayed in a list on the left of the reports page.Buttons marked with “>” and “<” allow you to select which of these tags to includein the report.You can save a list of selected tags as a named group. Doing so is very useful ifyou expect to run the same report on a regular basis.To use this list for a future report, simply select the report type, then select theLoad Group button. Select your named group and then run the report.
Setting the Report Time PeriodIn the upper right of the reports page, there are selectors to allow you to set thetime frame for the report. The start time can never be later than the end time, andthe end time can never be later than the current time. It is a good idea to alwaysset the end time first, otherwise you might have difficulty advancing the start timewhile the old end time is at an earlier date.
Figure 11-1 Reporting period
To change any field within the start or endtime, select that field and use the up anddown arrows at the right of the window.The Presets provide a quick and easy way toset a common time period. There are twogroups: The last X minutes, hours or daysbefore the report is run and the previous N cal-endar days, weeks, months, etc.The difference between the two groups is asfollows: any selected time period that uses
the word “Last” will have an end time that coincides with the moment that thereport is run. Any selected time period that uses the word “previous” will have anend time that matches a discrete boundary such as the end of an hour, day orweek.
The Report TagThe Report tag provides all of the functionality of the Reports Page, plus two keyfeatures:
l It will trigger automatically on the interval you specify (perhaps every morn-ing at 8:00).
Operation and Configuration Student Workbook • 164

Chapter 11
l It adds an offset to the time periods. For example, you could set the timeperiod to be the Last Hour, but offset such that data is for the hour ending 15minutes before the report runs.
A Report tag is added to an application like any other tag. Configure for a reportby following the configuration tabs from left to right. Note that, the list of tags toreport upon must be saved in a named group.The Report tag need not be drawn in order to function. If drawn, you can show itas a time display, showing when the report was last run. You can also draw it as abutton, allowing operators to run the report at a time of their choosing, or to repeata missed report (a configuration option of the report button widget).
Also worth noting: the Report Tools Library provides a number of buttons you canplace in an application page to provide an operator with quick access to many ofthe functions found in the Reports page. These are designed to work with aReport tag, adding operator control.
-
165 • Operation and Configuration Student Workbook

12 The Privilege and Security System
12 The Privilege and Security SystemNewly created applications run in an unsecured state until you decide that thetime has come to secure them. When you first access the security dialogs, youmust choose to secure the system and then create at least one account that youwill use for managing it. From that point forward, all users (including you) mustlogon to the application in order to make any configuration changes.Once the application is secured, configuration is no longer available without log-ging in.It is therefore normal practice to not activate security until you have finisheddesigning and configuring your application, and are ready to configure useraccounts for the system operators.
Activating Security
Figure 12-1 Activating security
When you first access the security dia-logs, whether by clicking on Logon in theapplication, or Security in the ApplicationConfiguration dialogs, you will be promp-ted to activate security:Upon clicking, 'Yes', you must create theinitial account for the application.
Operation and Configuration Student Workbook • 166

Chapter 12
Figure 12-2 The Security Accounts dialog
Secure Passwords: Youcan find a wealth ofinformation onlinedescribing the minimumrequirements for asecure password. Tosummarize, a securepassword should be atleast 8 characters long,be a pass-phrase ratherthan a pass-word, andinclude mixed case, num-bers and other symbols.
In most instances, this account should be used foronly one purpose: managing user accounts. Itshould also be given a difficult-to-guess password.Remember that SCADA systems are inviting targetsfor hackers. Do not open yours to abuse by creatingaccounts with administrative rights and easilyguessed user names and passwords.The initial privileges are enough to let the accountmanage security settings (Administrative), accessthe Application Configuration dialog (Configure), cre-ate and configure other user accounts (Manager)and stop the application (Application Stop). The priv-ileges required to acknowledge alarms, continuedevelopment, switch the Questionable flag off or on,etc. are not included.
-
167 • Operation and Configuration Student Workbook

12 The Privilege and Security System
RolesOnce you have created the initial account by providing a name and password,then clicking Apply, the list of roles will be populated with four examples,designed to help you start managing your security system. These can be added toyour account by first clicking the Add Role button, then selecting a role from dia-log that opens in response.
Figure 12-3 Sample roles, provided by default.
A role is a named set of privileges. You can assign a role to an account, but youcannot log in as a role. Roles do not have passwords or any other configurationbeyond a list of privileges.When defining a role, you may assign one role to another in addition to assigningprivileges. This allows you to create basic roles, then re-use those privilege-setsby adding to them, rather than having to create every role from scratch.
The predefined roles:These are provided to help you get started with your security configuration. It isexpected that you will create new roles or modify the predefined roles as appro-priate for your situation.
Role Privileges allow...
Logged Off
Nothing. VTScada will continue to run if nobody is logged on.Actions that happen at that workstation while nobody is logged onare attributed to a user named, 'Logged Off'. You can choose togrant privileges to this account, such as the ability to view thealarm page, but be very careful.
OperatorAcknowledge and mute alarms. View access to all of theVTScada system pages.Create and edit page notes.
Configurer Operator plus all privileges required to create and configure anapplication
Operation and Configuration Student Workbook • 168

Chapter 12
SuperUserConfigurer plus security configuration privileges. All VTScada priv-ileges except Internet Client Access and Modify Types, whichmust be granted explicitly.
Exercise 12-1 Activate Security and Create AccountsYou will create two accounts: one with SuperUser privileges for yourself and onewith a more limited set for an operator.1. Click, Logon2. Click Yes, when prompted to secure the application.3. Enter your name as the Account Name4. Enter and confirm a password.
Passwords are case-sensitive. Do not forget your password!5. Click, Apply.
The Accounts dialog will close. You must now logon for the first time.6. Logon, then reopen the Accounts dialog.7. Select your account.8. Click the Role button beside Add New Rule.9. Select the SuperUser Role.10. Click, Apply.11. Click the green Plus button at the bottom of the list of Users.12. Enter "Minion" as the account name.13. Enter and confirm a password for Minion.14. Click, Apply.15. Grant the Operator role to Minion.16. Apply, close the dialog and log out.17. Log in as Minion.18. Experiment with operational and configuration controls in the application to
see what is possible for the Operator role.
Save Time by CopyingIf you are creating a series of user accounts for a group of people who will havesimilar access rights, you can save time by copying the first account to make newones. Upon clicking the Copy button below the user list, you will have to provide anew account name and password, after which the new account will be created asan otherwise exact duplicate of the first.You can also generate a new role by copying a user account.The copied account will have exactly the same privilege set as the original, butwill not maintain a link. Changes to the original do not affect the copy.
This is where roles are superior to copies. Having set up one operator account,you might copy that account into a new role. Then, delete all the privileges fromthe original operator account, and re-assign the privileges in a single step byassigning the role to this and every new operator account. If you decide to change
-
169 • Operation and Configuration Student Workbook

12 The Privilege and Security System
the privilege set of the role at some point in the future, all the user accounts will beupdated immediately and automatically, since their privileges are whatever is inthat role.
Security RulesYou may have noticed that, the prompt to add a new privilege or role is "Add NewRule".A rule is more than just a privilege. Rules can be limited by tag scope, and byworkstation name.
For example, in the class project, there are three stations. If you have an operatorwho works in the water tower, but not at either of the two wells, you could add therule scope, Tufts Stn. to that operator's privilege's privilege set. The result wouldbe that all of their privileges would be in effect when working with the tags of TuftsStn, but not when attempting to work with the tags of either well.The Workstation modifier allows you to limit a privilege so that it is only in effectwhile the operator is logged in at a given workstation. If they log in at a differentstation, their privileges do not apply.The benefit of security rules is that you don't have to create different roles for eachoperator. By modifying the scope of a rule (role, privilege) you can apply the samerole to a group of operators and still grant varying access to different parts of theapplication.
Caution!Tag scope rules should be applied only to privileges that have to do with tags.Most of these privileges will be ones that you create, since only a very small num-ber of the built-in privileges are for tags.If you apply a tag-scope rule to a page privilege, alarm privilege, or any other priv-ilege that has nothing to do with tags, then you deny that privilege.If you apply a tag-scope rule to a role granted to an account, then you deny all priv-ileges within that role that have nothing to do with tags.
Application PrivilegesAll of the privileges seen so far apply to VTScada features and functionality only.They do not restrict anyone from opening one of your pages or from using any out-put control that may be in the application.
Operation and Configuration Student Workbook • 170
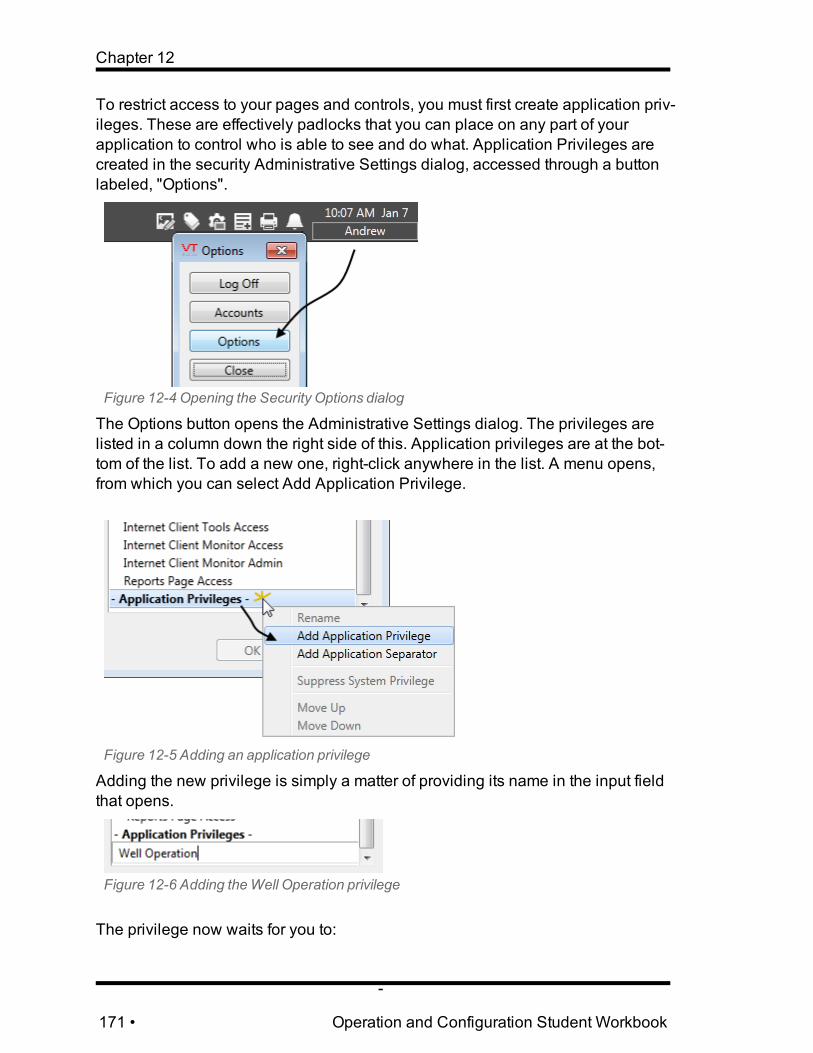
Chapter 12
To restrict access to your pages and controls, you must first create application priv-ileges. These are effectively padlocks that you can place on any part of yourapplication to control who is able to see and do what. Application Privileges arecreated in the security Administrative Settings dialog, accessed through a buttonlabeled, "Options".
Figure 12-4 Opening the Security Options dialog
The Options button opens the Administrative Settings dialog. The privileges arelisted in a column down the right side of this. Application privileges are at the bot-tom of the list. To add a new one, right-click anywhere in the list. A menu opens,from which you can select Add Application Privilege.
Figure 12-5 Adding an application privilege
Adding the new privilege is simply a matter of providing its name in the input fieldthat opens.
Figure 12-6 Adding theWell Operation privilege
The privilege now waits for you to:
-
171 • Operation and Configuration Student Workbook

12 The Privilege and Security System
a. apply it to a page or output tag andb. grant it to an account or role.
Note: When you create an application privilege, it is not automatically granted toany account, including your own. You must grant yourself the privilege that youcreated or else find that the pages and tags that you link it to, will be denied toyou.
Use an Application Privilege to Limit AccessTo restrict access to a page, open that page in the Idea Studio and click the Secur-ity tool in the Page Properties toolbar. Any of (but only one of) the application priv-ileges that you created can be linked to the page.
Figure 12-7 Linking an application privilege to a page
Security on output tags can be configured in much the same way. Open the Merittab of the tag's properties dialog and choose the appropriate privilege from thedrop-down list.
Figure 12-8 Linking an application privilege to a tag
Exercise 12-2 Application privileges and scope-limited rulesYou will create an application privilege in this exercise and grant it to a roleshared by both accounts created earlier. The privilege will then be used to restrictaccess to parts of the system. Finally, you will modify Minion's account so that theprivilege is only in effect for the Water Tower.
Operation and Configuration Student Workbook • 172
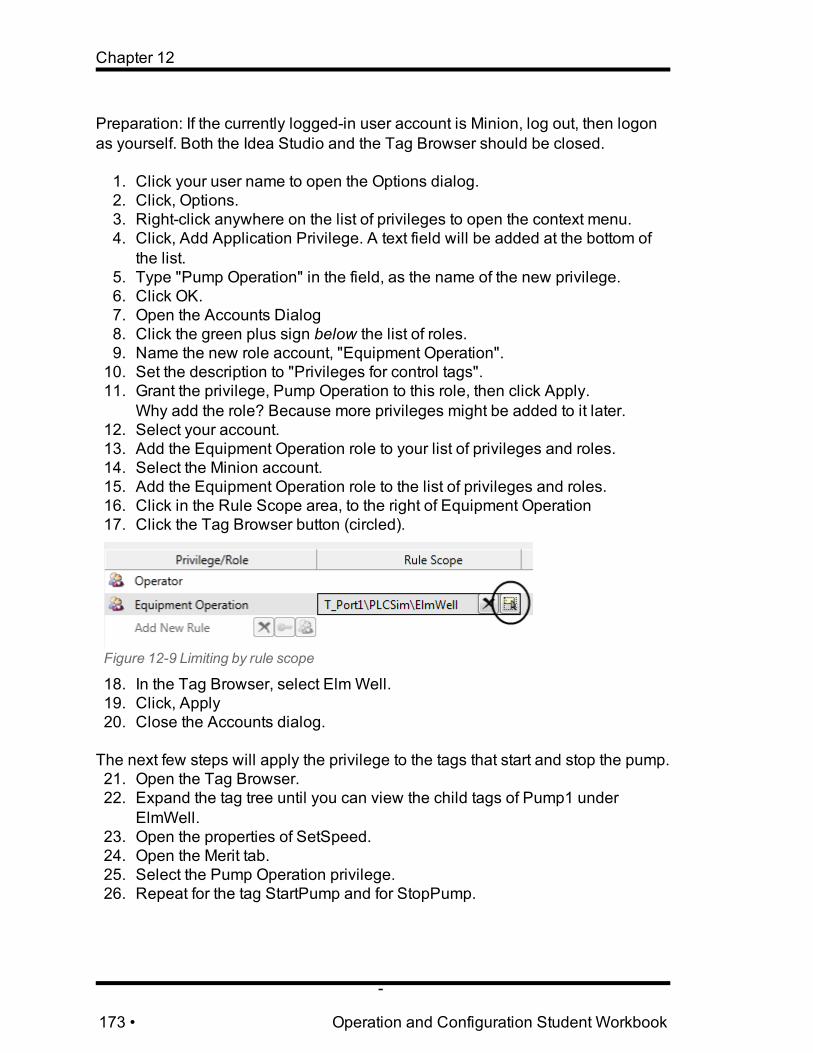
Chapter 12
Preparation: If the currently logged-in user account is Minion, log out, then logonas yourself. Both the Idea Studio and the Tag Browser should be closed.
1. Click your user name to open the Options dialog.2. Click, Options.3. Right-click anywhere on the list of privileges to open the context menu.4. Click, Add Application Privilege. A text field will be added at the bottom of
the list.5. Type "Pump Operation" in the field, as the name of the new privilege.6. Click OK.7. Open the Accounts Dialog8. Click the green plus sign below the list of roles.9. Name the new role account, "Equipment Operation".10. Set the description to "Privileges for control tags".11. Grant the privilege, Pump Operation to this role, then click Apply.
Why add the role? Because more privileges might be added to it later.12. Select your account.13. Add the Equipment Operation role to your list of privileges and roles.14. Select the Minion account.15. Add the Equipment Operation role to the list of privileges and roles.16. Click in the Rule Scope area, to the right of Equipment Operation17. Click the Tag Browser button (circled).
Figure 12-9 Limiting by rule scope
18. In the Tag Browser, select ElmWell.19. Click, Apply20. Close the Accounts dialog.
The next few steps will apply the privilege to the tags that start and stop the pump.21. Open the Tag Browser.22. Expand the tag tree until you can view the child tags of Pump1 under
ElmWell.23. Open the properties of SetSpeed.24. Open the Merit tab.25. Select the Pump Operation privilege.26. Repeat for the tag StartPump and for StopPump.
-
173 • Operation and Configuration Student Workbook

12 The Privilege and Security System
Make a habit of grantingManage Tag Types onlywhen needed, thenimmediately removingthat privilege when done.
The next step is to update the pump type and thewell type, but you do not have the privilege requiredto do this. The Manage Tag Types privilege isdenied unless explicitly granted. The earlier exer-cises did not instruct you to grant this privilege whenyou were setting up your account because ManageTag Types should remain denied for everyone untilneeded. This reduces the chance of accidentally run-ning Update Type on a driver or port tag if you are using a hierarchical tag struc-ture.
27. Reopen the security Accounts dialog and select your account.28. Grant yourself the Manage Tag Types privilege.29. Click Apply and close the dialog.
30. Reopen the Tag Browser and navigate to ElmWell in the tag list.31. Right-click on Pump1 and click, Update Type in the menu.32. Right-click on ElmWell and click Update Type in the menu.33. Close the Tag Browser.
34. Reopen the security Accounts dialog and select your account.35. Remove Manage Tag Types from your list of privileges.36. Click Apply and close the dialog.
This may seem like extra work, but trust your instructor: Accidentally runningUpdate Type on a driver or port that has child tags will result in far moreextra work than this.
37. Confirm that you are able to start and stop the pumps at both wells.38. Log out.39. Logon as Minion.40. Confirm that you can operate the pumps for the ElmWell, but not for the
Ridge Well.
Operation and Configuration Student Workbook • 174

13 VTScada on Multiple Workstations
13 VTScada on Multiple WorkstationsIf only one computer is used in an application, then that would be referred to as a"Local Application". While this is sometimes the case, it misses out on many ofthe more powerful features of VTScada .
More commonly, there are several workstations involved in running an applic-ation. This is referred to as a "Remote Application". A remote application is onethat runs on multiple workstations, sharing and synchronizing data between thecomputers. Remote applications have a client/server architecture.
The process to create a remote application is as follows:A. Create an application.B. Install VTScada on another workstation on your network.C. Add a new application, selecting the Advanced option in the Wizard.D. Select 'Get FromWorkstation' to copy the application from the first computer
to the second.E. Open the Application Configuration dialog (on either computer) and use the
Edit Server Lists dialog to add the two computers to the server list.The first computer in the list will be the primary and the second will be thebackup.Not every computer running the application needs to be in the list. Thoseare referred to as client workstations, providing operator access but not tak-ing over if the computers in the server list go off line.
F. Repeat from step B. as required.
Primary and Backup ServersIn its simplest form, server configuration consists of one primary server, one ormore backup servers, and optionally, one or more pure clients. A pure client issimply a workstation that is running the application, but which will not take over asa server in the event that the primary is lost.
Operation and Configuration Student Workbook • 175

Chapter 13
Figure 13-1 Fail-over from primary to backup
The Primary and backup servers are continuously synchronized. If the primarygoes offline for any reason, the backup will immediately take over. When theprimary is restored to service, the backup will synchronize configuration and datawith it, following which the primary will again take over its role.The Client computer can be used for monitoring and control, and it is possible tomake configuration changes using it, but communication to the hardware is doneby the current server. Read/write requests are handled by the server and con-figuration updates are first sent to the server, then distributed to the other work-stations.
Get an Application From a WorkstationGiven an application running on a remote workstation, if you want to run thatapplication on a backup or client workstation, then the method that is both thebest and the easiest is to direct VTScada to get the application from the originalworkstation.
This is done with the Advanced option of the Add New Application wizard.
-
176 • Operation and Configuration Student Workbook

13 VTScada on Multiple Workstations
Figure 13-2 First step of the process
In the second step, you must provide the name or IP address of the workstationwhere the application resides. Given a properly configured network, this listshould be populated automatically.
VTScada will contact the workstation, and if a copy of VTScada is running, all theapplications available in its VAM will be made available for you to select from.
Figure 13-3 List of applications on a remote workstation
Operation and Configuration Student Workbook • 177

Chapter 13
Choose the application that you want from the list and click Next. There will be afinal confirmation screen to click through, then the application will be copied toyour workstation.
At this stage, you have your own copy. A primary server must be defined beforechanges made to one will be reflected in the other, and before they will shareresources.
The method just described is strongly recommended over simply copying theapplication directory from one computer to another. A variety of useful con-figuration tasks are performed for you by VTScada when you acquire a remoteapplication. These tasks can be done by you, but it is much easier to let the soft-ware do the work.In situations where there is no option but to copy the application via memory stickor other media, create and use a ChangeSet file.
Exercise 13-1 Get an Application From Another WorkstationParts of this exercise will be done by the class together. To prepare, please dothe following:
1. Stop any currently running VTScada applications.2. Click on the Add Application Wizard button in the VAM.3. Select the Advanced option and click Next.4. Select the Get FromWorkstation option and click Next.5. Select the instructor's computer as indicated in class.
A list of available applications should load.6. Select the Well_AJH application and click through to finish the import.
The remainder of this exercise will be done as a class exercise with the guidanceof the instructor. Topics to be covered include the Remote Configuration man-ager, creating backup configuration servers and monitoring an application withthe Trace Viewer
Distributing ServicesVTScada allows you to distribute tasks between separate servers. You canassign tasks that are CPU-intensive (such as alarm handling) to one server andassign tasks with large amounts of hard disk I/O (such as logging) to another. Inlarger applications, this sort of load distribution can make a significant differenceto overall performance.
-
178 • Operation and Configuration Student Workbook

13 VTScada on Multiple Workstations
Server lists are configured from the Application Configuration dialog. The basicmode of this tool allows you to define a server list where the primary server is thefirst in the list and handles all parts of the application. Should it fail, everything willfail-over to the next computer in the list.
Figure 13-4 A basic server list
In the Advanced mode, you can set a server list for each part of VTScada’s oper-ation.
Figure 13-5 An advanced server list
Depending on the size and complexity of your network, the primary server for onetask can be the backup server for another and vice-versa, or you can have a com-pletely separate set of backup servers for each primary.
When distributing services in this way, it is recommended that you keep theDefault Server List for all those services that need not be individually defined. Ser-vices such as Operator Notes, page parameters and the time synchronizationmanager are seldom parceled out to a custom server list.
Operation and Configuration Student Workbook • 179

Chapter 13
Certain services in the list are available for configuration only while the applic-ation is running. These are the tag-based services including the I/O drivers andthe Historians. All other services can be configured in the list when the applic-ation is stopped.
Note in the previous figure, the option immediately below each service is "Defaultfor Workstations". You have the ability to set up custom server lists for specificworkstations. System Integrators find this feature useful as it allow them to createa server list that applies only to their workstation. They can set their own computeras its own primary server, thus allowing them to run the application in an envir-onment that has no connection to the usual primary server.
-
180 • Operation and Configuration Student Workbook
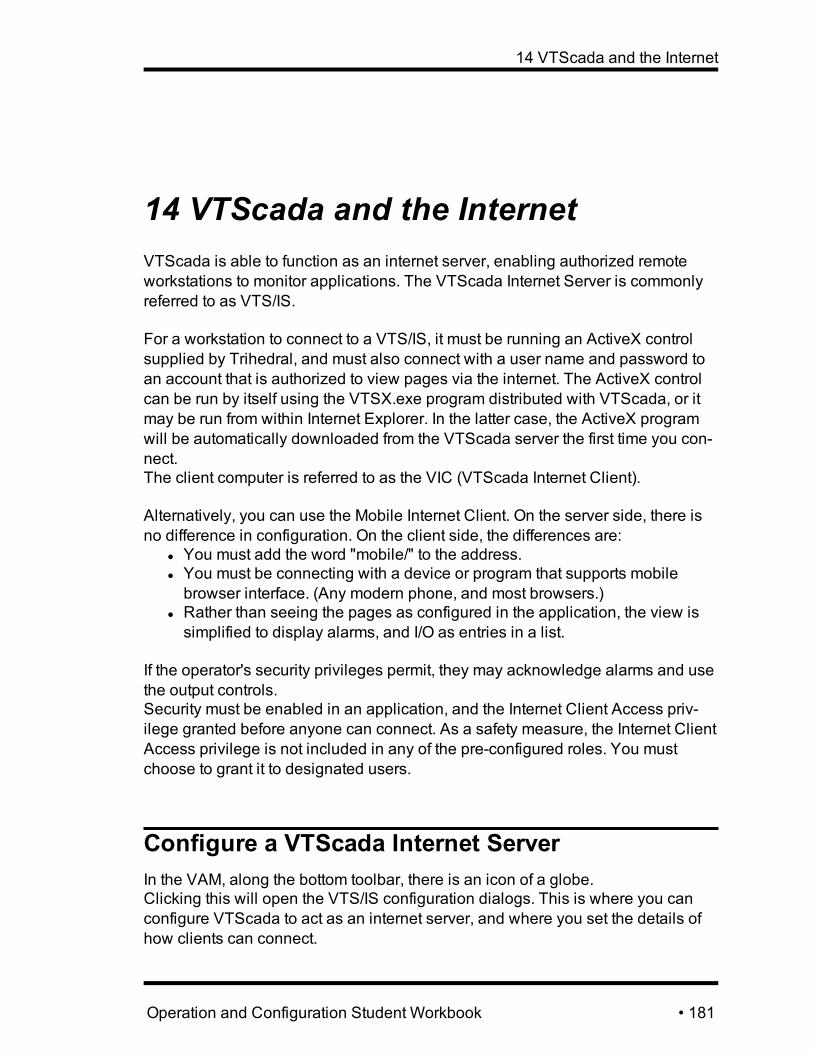
14 VTScada and the Internet
14 VTScada and the InternetVTScada is able to function as an internet server, enabling authorized remoteworkstations to monitor applications. The VTScada Internet Server is commonlyreferred to as VTS/IS.
For a workstation to connect to a VTS/IS, it must be running an ActiveX controlsupplied by Trihedral, and must also connect with a user name and password toan account that is authorized to view pages via the internet. The ActiveX controlcan be run by itself using the VTSX.exe program distributed with VTScada, or itmay be run from within Internet Explorer. In the latter case, the ActiveX programwill be automatically downloaded from the VTScada server the first time you con-nect.The client computer is referred to as the VIC (VTScada Internet Client).
Alternatively, you can use the Mobile Internet Client. On the server side, there isno difference in configuration. On the client side, the differences are:
l You must add the word "mobile/" to the address.l You must be connecting with a device or program that supports mobilebrowser interface. (Any modern phone, and most browsers.)
l Rather than seeing the pages as configured in the application, the view issimplified to display alarms, and I/O as entries in a list.
If the operator's security privileges permit, they may acknowledge alarms and usethe output controls.Security must be enabled in an application, and the Internet Client Access priv-ilege granted before anyone can connect. As a safety measure, the Internet ClientAccess privilege is not included in any of the pre-configured roles. You mustchoose to grant it to designated users.
Configure a VTScada Internet ServerIn the VAM, along the bottom toolbar, there is an icon of a globe.Clicking this will open the VTS/IS configuration dialogs. This is where you canconfigure VTScada to act as an internet server, and where you set the details ofhow clients can connect.
Operation and Configuration Student Workbook • 181

Chapter 14
SecurityThe first step in the configuration process is normally to define security. If all con-nections will use your local network, or a virtual private network (VPN) that youmaintain, then all is well.If clients will connect over the Internet at large, then you must obtain and imple-ment an x.509 certificate. (Commonly referred to as an SSL certificate.) Con-nection credentials are otherwise transmitted in a form that is easily interceptedand read.
Server SetupHaving configured your security, the next step is to identify the server. You canuse an IP address or a property configured domain name. In general, a resourcename is preferred unless you are certain that the server will have a static IPaddress.
Figure 14-1 Adding a server
In order for a VIC to connect while on the same computer as the server, the serversetup must be recognized as “local”. This will happen automatically if the servername is recognized by a properly configured DNS (Domain Name Server) asbelonging to the computer you are working on.
In the absence of a DNS or a network administrator who can take care of suchthings for us, you should do the following before beginning the class exercise.
-
182 • Operation and Configuration Student Workbook

14 VTScada and the Internet
1. Open the file, HOSTS.This is located in the directory C:\WINDOWS\SYSTEM32\DRIVERS\ETC
2. Add a line for your computer name and its IP address.For example:192.165.6.2 MyComputerName
3. Save the HOSTS file.
The local indicator will not immediately show a check mark. Upon saving theserver setup and reopening the dialog, the check mark will be there if VTScada isable to recognize that this computer is the internet server.
RealmsThe final step is to define one or more realm names and link your application tothe name. A realm is the name given to the set of configuration parameters thatdefine how the connection is to be made and what application(s) will be availableto that connection.
There are two reasons why you might define more than one realm for the sameapplication:
l You can specify differing display parameters for each realm, by addingRealmDisplaySetup tags to the application.
l You can define the maximum number of connections allowed to each realm.If your license allows ten connections, you might want to create one realmfor managers that allows only three connections, and another for operatorswhich is not limited. Then, in the event of an emergency, your operators willnot find that all available connections are taken by managers.
Operation and Configuration Student Workbook • 183

Chapter 14
Figure 14-2 Configuration for adding a realm
The name for the realm may be any-thing, but you should use somethingthat describes the application that VICclients will expect to connect to. Asingle word is not required, but is recom-mended as this will form part of a URL.
Having created a realm, you must thenselect at least one application that willbe available to this connection. TheAdd button in the application area of theVTScada Internet Client dialog will giveyou a selection to choose from.
After creating the realm and adding anapplication to it, you should click theApply button.
This will build URLs, based on the configuration information that you providedand allow you to test the connection. When testing the VIC URL, InternetExplorer® will open. When testing the MIC URL, your default browser will beused.
Figure 14-3 Configured realms, ready for testing
-
184 • Operation and Configuration Student Workbook

14 VTScada and the Internet
Connecting as an Internet ClientThere are two methods by which a client computer (VIC) can connect to theserver:
A. They can use Internet Explorer® to navigate to the server's URL.An ActiveX component will be installed on first connection. This has theadvantage that you are not required to distribute any software to the clients.
B. They can install the ActiveX component and use it directly to connect.This has the advantage of not using Internet Explorer®.
The ActiveX component is the same in either case. Once connected, there is nodifference in what the user will be able to see and do.It is important to note that VIC access is controlled by the security manager. Everyuser, even those with administrative privileges, must have specifically been gran-ted rights to connect via a VTScada Internet Client before they will be able to login.
Connecting via Internet Explorer®To connect to the application, clients will open Internet Explorer® and enter theaddress for the server. The address follows standard URL formatting. As anexample, three online demos are on Trihedral’s website. Clients anywhere in theworld can connect to them using the following address: (note: pop-ups must beenabled in your browser).http://www.trihedral.com/trials-and-demos/live-pc-demoUsing one of the applications located there as an example, you will find anaddress such as:http://vts.trihedral.com/waterdemo
The portion, “http://vts/trihedral.com/”, is the address of the server and “water-demo/” is the name of the realm configured on that server.
Upon first connecting, the client will attempt to download an ActiveX component.This is an essential tool that must be installed on the remote workstation.Since the VIC relies on an ActiveX component to run, you must use InternetExplorer as your browser. The component will not run on Netscape, Opera orother browsers.
Connecting via the ActiveX component.Those who prefer not to use Internet Explorer® can run the VICSetup.exe pro-gram that comes with VTScada. This installs the ActiveX component and a frame-work for it to run within that is not Internet Explorer.The program will be installed as, C:\Program Files\Trihedral\VTSX.exe Theinstallation process does not create a link to this program on either the desktop or
Operation and Configuration Student Workbook • 185
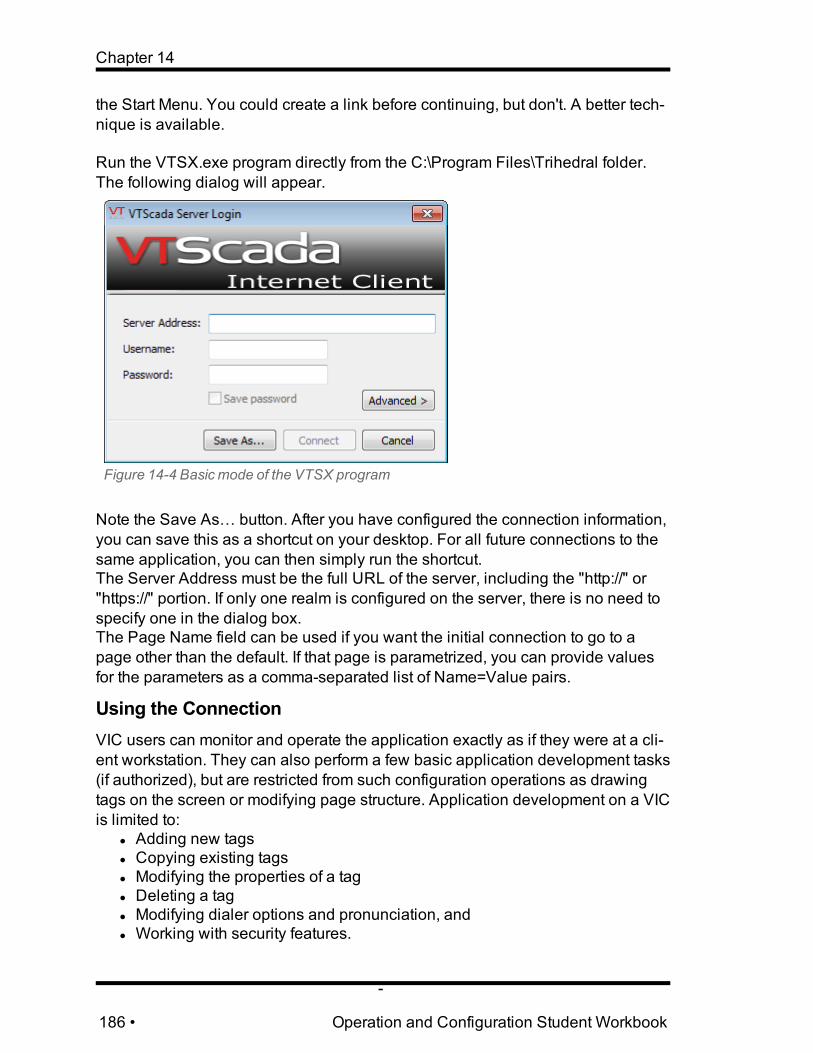
Chapter 14
the Start Menu. You could create a link before continuing, but don't. A better tech-nique is available.
Run the VTSX.exe program directly from the C:\Program Files\Trihedral folder.The following dialog will appear.
Figure 14-4 Basic mode of the VTSX program
Note the Save As… button. After you have configured the connection information,you can save this as a shortcut on your desktop. For all future connections to thesame application, you can then simply run the shortcut.The Server Address must be the full URL of the server, including the "http://" or"https://" portion. If only one realm is configured on the server, there is no need tospecify one in the dialog box.The Page Name field can be used if you want the initial connection to go to apage other than the default. If that page is parametrized, you can provide valuesfor the parameters as a comma-separated list of Name=Value pairs.
Using the ConnectionVIC users can monitor and operate the application exactly as if they were at a cli-ent workstation. They can also perform a few basic application development tasks(if authorized), but are restricted from such configuration operations as drawingtags on the screen or modifying page structure. Application development on a VICis limited to:
l Adding new tagsl Copying existing tagsl Modifying the properties of a tagl Deleting a tagl Modifying dialer options and pronunciation, andl Working with security features.
-
186 • Operation and Configuration Student Workbook
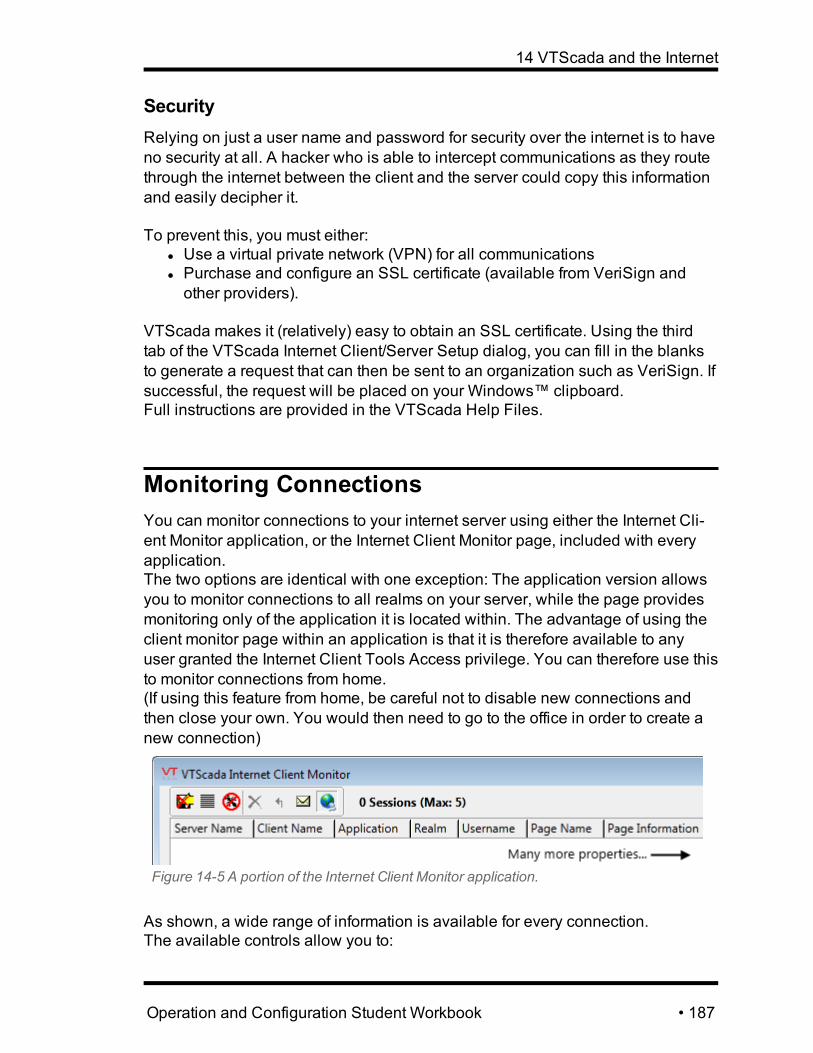
14 VTScada and the Internet
SecurityRelying on just a user name and password for security over the internet is to haveno security at all. A hacker who is able to intercept communications as they routethrough the internet between the client and the server could copy this informationand easily decipher it.
To prevent this, you must either:l Use a virtual private network (VPN) for all communicationsl Purchase and configure an SSL certificate (available from VeriSign andother providers).
VTScada makes it (relatively) easy to obtain an SSL certificate. Using the thirdtab of the VTScada Internet Client/Server Setup dialog, you can fill in the blanksto generate a request that can then be sent to an organization such as VeriSign. Ifsuccessful, the request will be placed on your Windows™ clipboard.Full instructions are provided in the VTScada Help Files.
Monitoring ConnectionsYou can monitor connections to your internet server using either the Internet Cli-ent Monitor application, or the Internet Client Monitor page, included with everyapplication.The two options are identical with one exception: The application version allowsyou to monitor connections to all realms on your server, while the page providesmonitoring only of the application it is located within. The advantage of using theclient monitor page within an application is that it is therefore available to anyuser granted the Internet Client Tools Access privilege. You can therefore use thisto monitor connections from home.(If using this feature from home, be careful not to disable new connections andthen close your own. You would then need to go to the office in order to create anew connection)
Figure 14-5 A portion of the Internet Client Monitor application.
As shown, a wide range of information is available for every connection.The available controls allow you to:
Operation and Configuration Student Workbook • 187
Chapter 14
l Terminate connections.l Block all new connections.l Send a message to one or all connections.l Enable logging of connections.
Connect Using the Mobile ClientHaving completed the configuration described in the preceding chapters, it is noweasy to connect to your application using a mobile device.All that is required is to add the word, "mobile/ " to the URL of the connection.If you have configured a server and a realm, and you have a browser that sup-ports mobile connections, you can connect now.
Sample images from a mobile client are provided in the following figures:
Figure 14-6 Initial page when connecting using the mobile browser
-
188 • Operation and Configuration Student Workbook
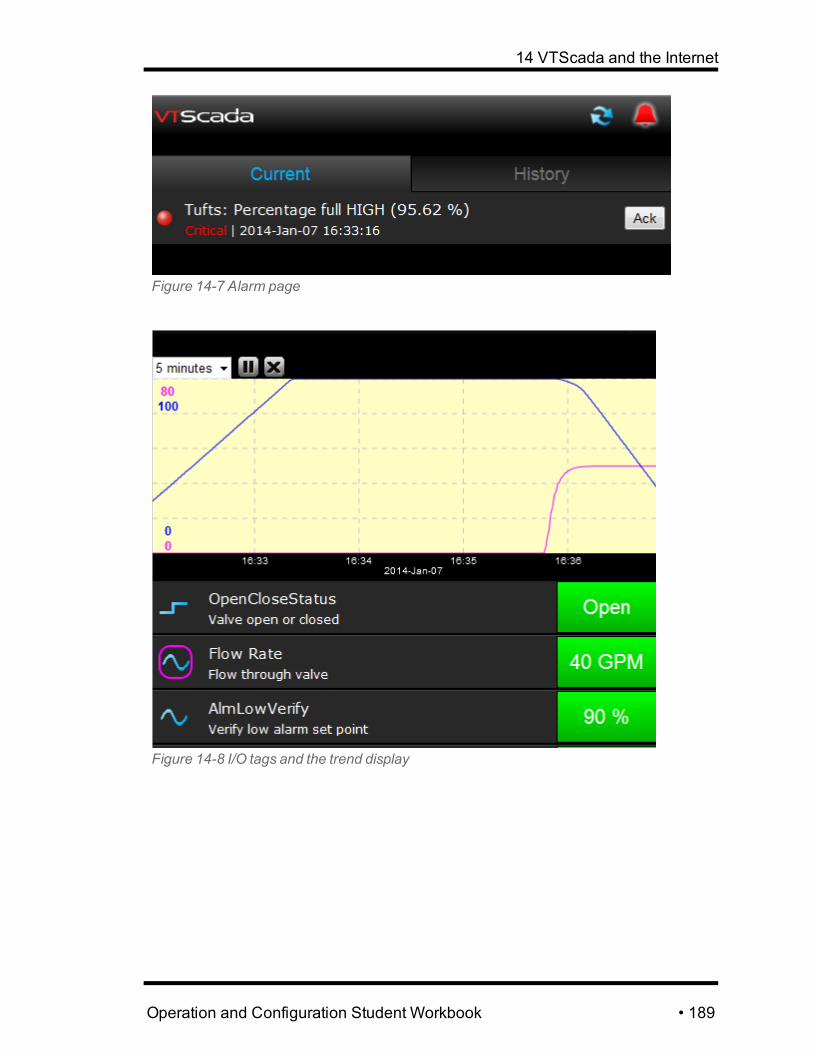
14 VTScada and the Internet
Figure 14-7 Alarm page
Figure 14-8 I/O tags and the trend display
Operation and Configuration Student Workbook • 189

15 Version Control
15 Version ControlAs you develop your applications, every change is recorded to a distributed ver-sion control system. "Distributed" means that the complete history of changes isshared with all the workstations running the application.
Figure 15-1 Version control log detail
The version numbering system combines the name of the workstation (wherechange was made) with a counter showing the version number. The letter "D"means that the change was "Deployed". The alternative is a local change "L",meaning that the change is in effect only on the indicated workstation.
While local changes are in effect only on one workstation, the version log is dis-tributed to all workstations that the application is active on. Thus, an authorizedoperator at any remote workstation could choose to view the details of a changethat was local to another workstation.
Automatic versus Manual Version DeploymentBy default, all version changes are automatically deployed. This is controlled inthe "Other" tab of the Edit Properties page of the Application Configuration dialog.
Operation and Configuration Student Workbook • 190

Chapter 15
If you switch off the Automatically Deploy option, then you must choose when toDeploy your changes, using the Deploy menu item in the Application Con-figuration dialog. All local changes will be included when deploying.
You can use the Revert Changes tool only when there are local changes torevert. That is, when the Automatically Deploy option is not selected. The revertchanges command will discard all local changes, returning your system to the lastDeployed version.
Reviewing Version ChangesA right-click on any entry in the Version Log will open the following menu, whichallows you to view details of each change, switch to an earlier (or later) version,and merge or reverse changes.
Figure 15-2 Version details menu
If you choose the option, Show Version Changes, a complete record of how thatversion differs from the previous will be shown at a source code level.
In this change, the Questionable property of the tag, Percentage Full, waschanged to 0 by Andrew on January 7th.
The menu at the left of the changes dialog indicates which part of the applicationchanged – source files, tags, images, properties, etc. Within each category, onlythose files that changed from the previous version will be shown.
-
191 • Operation and Configuration Student Workbook
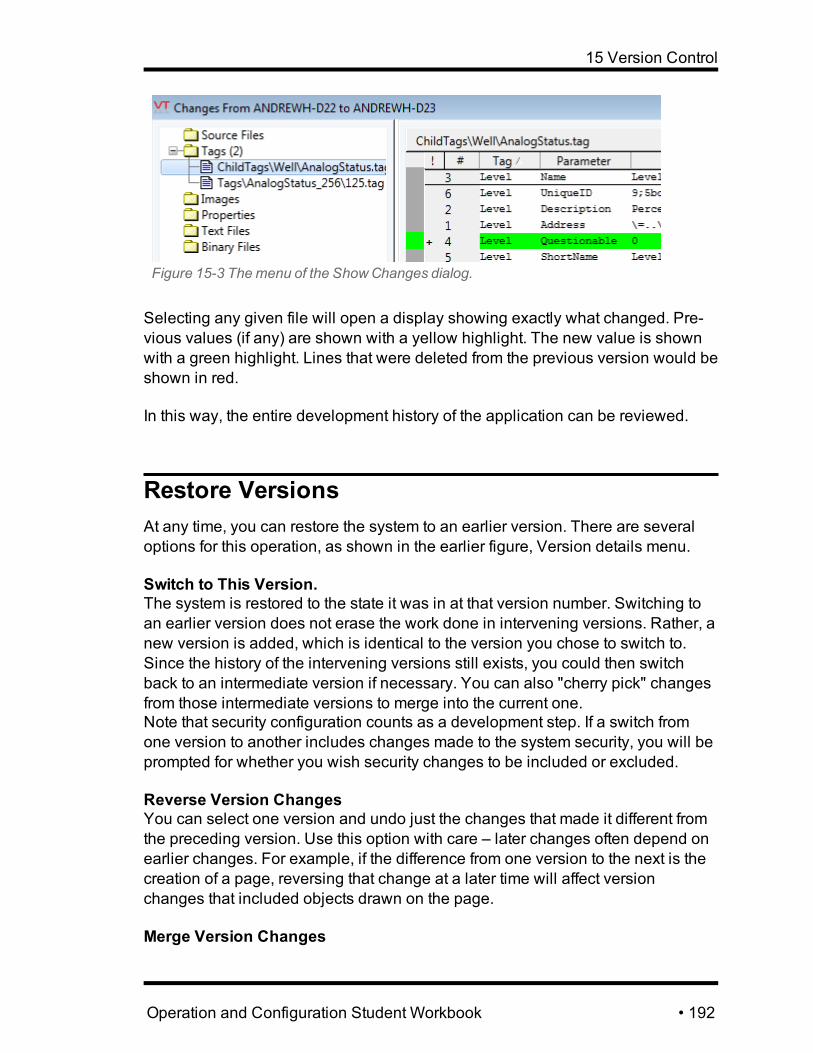
15 Version Control
Figure 15-3 Themenu of the ShowChanges dialog.
Selecting any given file will open a display showing exactly what changed. Pre-vious values (if any) are shown with a yellow highlight. The new value is shownwith a green highlight. Lines that were deleted from the previous version would beshown in red.
In this way, the entire development history of the application can be reviewed.
Restore VersionsAt any time, you can restore the system to an earlier version. There are severaloptions for this operation, as shown in the earlier figure, Version details menu.
Switch to This Version.The system is restored to the state it was in at that version number. Switching toan earlier version does not erase the work done in intervening versions. Rather, anew version is added, which is identical to the version you chose to switch to.Since the history of the intervening versions still exists, you could then switchback to an intermediate version if necessary. You can also "cherry pick" changesfrom those intermediate versions to merge into the current one.Note that security configuration counts as a development step. If a switch fromone version to another includes changes made to the system security, you will beprompted for whether you wish security changes to be included or excluded.
Reverse Version ChangesYou can select one version and undo just the changes that made it different fromthe preceding version. Use this option with care – later changes often depend onearlier changes. For example, if the difference from one version to the next is thecreation of a page, reversing that change at a later time will affect versionchanges that included objects drawn on the page.
Merge Version Changes
Operation and Configuration Student Workbook • 192

Chapter 15
After restoring an earlier version, you may decide that certain intervening versionsincluded changes that you do not want to lose. You may merge those changesinto the current version using this option.
Reverse Version RangeThe range begins with the currently selected version number. You will be promp-ted to select another version number to end the range.You can then select changes to reverse from all those made in all the versionswithin the selected range. Note that the same warnings apply as stated inReverse Version Changes.
Merge Version RangeAfter restoring an earlier version, you may decide that certain intervening versionsincluded changes that you do not want to lose. You can merge changes from sev-eral intervening versions by selecting a range. The range begins with the cur-rently selected version number. You will be prompted to select another versionnumber to end the range.You can then select changes to merge from all those made in all the versionswithin the selected range.
In every case, your action will result in the creation of a new version – which itselfcan be reversed or switched away from.
Import File ChangesFor the purposes of the distributed version control system, there are three parts toan application.
The repository. This is the version control history, including the version numberand dates of the files that make up the current version. Any attempt to modifythese files will at best be ignored, but will most likely destroy the application.
The working copy. These are the files containing the current version of theapplication. Any change made to one of these files will be immediately detectedby the version control system since the file will then differ from the informationabout it stored in the repository. An attempt to modify these files will be ignored,but may destroy the application.
The user copy. A set of files, continuously updated by the version control system,that contain the source code for the application in human-readable format. Note:You can configure your applications to not include these human-readable files.
-
193 • Operation and Configuration Student Workbook

15 Version Control
Systems Integrators who do not want customers to have access to their code willsometimes distribute their applications to include only the compiled, run-time files.As a developer, you can use a text editor to modify any of the files that make upthe user copy of your application. This can be a convenient way to edit pages, re-configure user drawing methods, alter and add application properties, etc.Since it would circumvent security to allow any one to modify the application byediting files outside of the control of the VTScada security system, changes to theuser files will only take effect after those files are imported into the application.Naturally, only authorized users may import files.It is expected that, the authorized user will review the changes that have beenmade and take responsibility for those changes. In any case, the VTScada ver-sion control system will record who imported file edits, thereby identifying who isresponsible for the import, if not the actual changes.
ChangeSets. An Application in a FileA ChangeSet is a file containing the version history of an application, up to thepoint at which the ChangeSet was created. The name, "ChangeSet" was chosendeliberately. It is a file containing the set of changes (version history) that wentinto creating the application. This is not the same thing as a compressed copy ofan application.
Common uses of ChangeSet files are to distribute an application, to create aclone that can be used for testing and experimentation, and to create a backup ofthe configuration. ChangeSet files are not intended to be used a substitution forthe Application Version Control System.
An example may help clear up one of the most common misunderstandings ofwhat a ChangeSet is and how it can be used.Suppose that you create a ChangeSet of your application, as it exists right now.The version number stands at D120.You then spend a week modifying the application. The version number increasesto D180.At this point, you decide that the work you have done over the past week hasbeen a waste of time. You use the Apply ChangeSet command to apply thechanges stored in the file, to the current application.
What will happen is... nothing.
The Application Version Control System compares the contents of the ChangeSetfile to the version history of the application and finds that there is nothing in the file
Operation and Configuration Student Workbook • 194

Chapter 15
that didn't already exist in the application for the past week. There is no work to bedone.
If there is no logged data to worry about, you might decide to delete the applic-ation from the VAM, removing its entire folder in the process. If you are running astand-alone application, this will be effective. You can then create a new applic-ation, using the ChangeSet and you will find yourself back at version D120.However, if this is a remote application, other servers on the network will treat thisworkstation as if it had simply been offline for a week, and will immediately applythe changes from versions D121 through to D180, thus bringing the workstationback up to date with the rest of the network. Depending on the situation, you mayalso succeed in corrupting the application on all workstations.
In summary, if your intention is to restore an application to an earlier version, usethe Application Version Control System, not a ChangeSet file.If you want to distribute an application, create a clone to experiment on, or createa backup of a stand-alone system, then a ChangeSet is an ideal tool.
Create a Full ChangeSetTo create a full ChangeSet file:A. Open the Application Configuration dialog for the selected application.B. Click the menu option, Create ChangeSet file.C. Click Create.D. Select the folder and file name for the file. The file extension will always be
.ChangeSet.
To create an application from a ChangeSet there are two methods:Method 1:A. Double-click on the ChangeSet file.
Method 2:A. In the VAM, click on Add Application WizardB. Select the advanced option and click Next.C. Select the option, Get From ChangeSet and click Next.D. Find and open the ChangeSet file.E. If the application already exists on this computer, you will be prompted to
create the new application as a clone.A clone is simply an exact copy (as of the time the ChangeSet file was created)with a different name.
The version history that makes up the full ChangeSet will not, by default, be vis-ible in the new application's version log. To view it, set the Settings.Dynamic prop-erty, RepositoryShowCloneHistory to 1. Note that this property is part of the
-
195 • Operation and Configuration Student Workbook

15 Version Control
"Layer" section, not the "System" section. The version history will appear underthe original workstation's record, not as one of the current workstation's records.
Advanced ChangeSet TypesThere are other types of ChangeSet beyond the Full ChangeSet. These are as fol-lows:
Snapshot CopyA ChangeSet that does not include version history. Useful for Systems Integratorswho are sending an application to a client.
Run-Only Snapshot CopySimilar to the Snapshot Copy, but intended for distribution to Run Time licensedcopies of VTScada.
Add-On ChangeSetUsed to distribute updates to a client's application. It takes care and planning tocreate an Add-On ChangeSet. The first five steps create an empty application,that is guaranteed to have a fundamental layer in common with the target applic-ationA. Open the VTScada Application Manager.B. Click, Add Application Wizard and open the Advanced option.C. Select the option, Get From ChangeSet.D. Select the VTScada Layer's Template.ChangeSet file as the source
ChangeSet.E. Do not run the new application.
At this point, you have an application that is empty and that shares a commonOEM layer with any other application.
F. Make your changes to the new application's source code.This may be done by making your changes in another application using thestandard VTScada tools you have learned about in this course, then copyand paste the source code changes you require. The Version Log is anexcellent place to find all the source code changes that are created.
G. Use the Import File Changes button in the VAM.H. Create the Add-On ChangeSet.
This may now be applied to any application, thereby loading just your file editsinto that application.If you would like to test the changes, create a new application, and apply the Add-On ChangeSet to that before sending the ChangeSet file to the customer.
Template ChangeSet
Operation and Configuration Student Workbook • 196
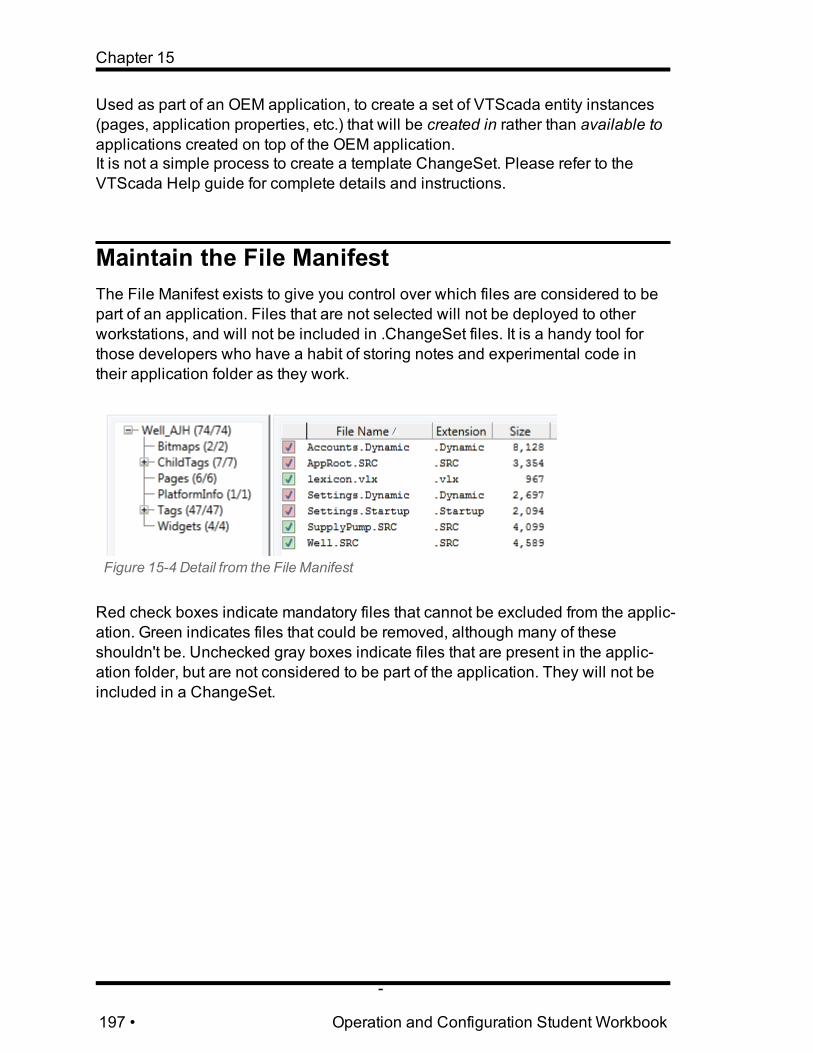
Chapter 15
Used as part of an OEM application, to create a set of VTScada entity instances(pages, application properties, etc.) that will be created in rather than available toapplications created on top of the OEM application.It is not a simple process to create a template ChangeSet. Please refer to theVTScada Help guide for complete details and instructions.
Maintain the File ManifestThe File Manifest exists to give you control over which files are considered to bepart of an application. Files that are not selected will not be deployed to otherworkstations, and will not be included in .ChangeSet files. It is a handy tool forthose developers who have a habit of storing notes and experimental code intheir application folder as they work.
Figure 15-4 Detail from the File Manifest
Red check boxes indicate mandatory files that cannot be excluded from the applic-ation. Green indicates files that could be removed, although many of theseshouldn't be. Unchecked gray boxes indicate files that are present in the applic-ation folder, but are not considered to be part of the application. They will not beincluded in a ChangeSet.
-
197 • Operation and Configuration Student Workbook

16 Sites and Site Maps
16 Sites and Site MapsA Site Map will show any of the following types of tag as a pin on a map. The pinwill change color if there is an active alarm within the site.
Tags that can be pinned to a Site Map:l Polling Driverl Data Flow System RTUl MultiSmart Stationl MPE SC Stationl MPE Duplexer Stationl Context tag, or user-defined tag type (which will always start as a Contexttag), provided that the properties Latitude and Longitude have been added.
(MultiSmart andMPE are trademarks of their respective owners)
The Sites page includes a Site Map, and a list of tags that could be pinned. Eachitem in the list includes an alarm indicator and navigational controls that allow youto view the I/O at that site in a compact format.
The tiles that make up the map are downloaded each time that you change theview. Naturally, this requires an open connection to the Internet. If your work-station does not have an Internet connection, then you can still use Site Maps. Allthat is required is that you download the tiles using a computer that does have anInternet connection, then copy the storage folder to your workstation.Map tiles are stored sub-folders of C:\VTS\Data\SlippyMapTiles\.
You may find a reason to restrict the opportunity for map browsing. If so, you candownload tiles as described, then change a Setup.INI property as follows:SlippyMapRemoteTileSource1 =file://C:\VTS\Data\SlippyMapTiles\MapType1
VTScada must be restarted for any change to Setup.INI to take effect.By changing the source for map times to a folder on your workstation, you preventthe downloading of any new tiles. Be sure that while you have an active Internetconnection, you download all the tiles that will be required by panning the mapover each area of interest, and at each of the sixteen possible zoom factors.
Exercise 16-1 View a Sites Page
Operation and Configuration Student Workbook • 198

Chapter 16
1. Using the list menu, open the Remote Sites group, then click the entry,Sites.If you correctly typed the words, Latitude and Longitude when adding prop-erties to your Well tag, you will see a list of three sites:
Figure 16-1 List of sites
2. Click the arrow for any site to open a display of the I/O within that tag.User-defined tags within the site such as the SupplyPump, can be clicked toopen a Site Details page, showing the I/O nested within.
3. Navigate back to the initial list of three sites, and click to expand ElmWell.Note that below the map, a message informs you that the site's location hasnot yet been set, and that there is a button to update the site's location.
4. Click the Update Site Location button.5. Navigate to the town of Wolfville, within the province of Nova Scotia,
Canada.6. Click near Elm Avenue.
A pin is placed on the map. Note that there is an animated bubble to indic-ate which pin relates to the current site, even though only one site is visible.
7. Check the option, Show All Sites.A pin appears for Tufts Stn. It does not have an animated bubble.
8. Click on the pin for the Elm Avenue well.A Site Details page opens, automatically populated with all the I/O withinthat site. Note that the controls for starting and stopping pumps can be usedhere. This display is very similar to that of the mobile browser interface.
9. Close the Site Details page and repeat by clicking on the pin for Tufts.10. Finish by ensuring that RidgeWell also has a pin on the map, located near
Ridge Rd. (Just south of Highway 101 on the Wolfville Ridge.)
-
199 • Operation and Configuration Student Workbook
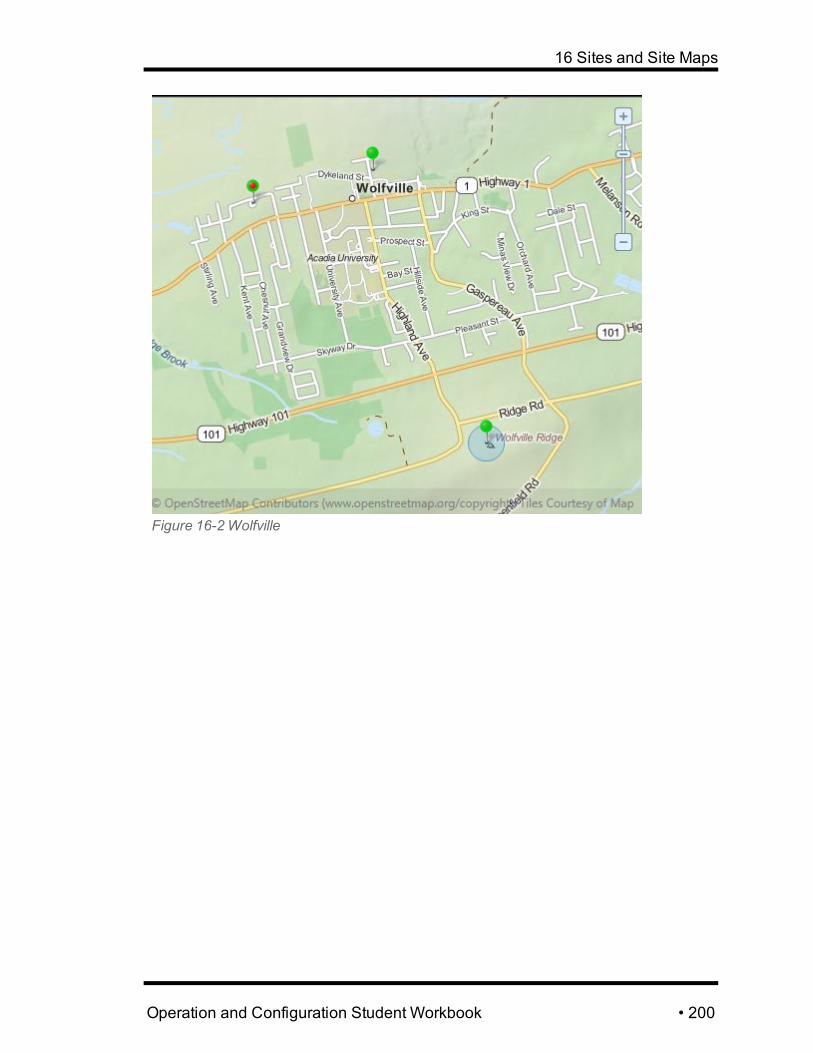
16 Sites and Site Maps
Figure 16-2Wolfville
Operation and Configuration Student Workbook • 200

17 Bonus Topics
17 Bonus TopicsThe following chapters contain information that is not officially part of the course,but which may be covered subject to student interest and available time.
More Tags to KnowIn addition to the types covered during this course, the following tags are wellworth knowing.These are listed with only brief instructions. If time permits, the instructor willdescribe each more fully. If there isn't time, you are encouraged to review thenotes in the VTScada Help Guide for each type.
Selector Switch.Selector Switch tags provide the means to create multi-position switches that canbe used to create on-off toggles, mode selectors, Hand-Off-Auto (H-O-A)switches, etc.A selector switch can accept two types of feedback: Equipment feedback indic-ates the current status or state of the equipment. Switch Position feedback (anoptional parameter that should be used when a second device is also controllingthe equipment) drives the position of the Selector Switch tag. Both feed backs areassumed to come from the PLC operating the equipment.Selector switches can be drawn with objects that look and act like switches. TheToggle Switch and the Selector Switch are two prominent examples.A demo application has been included in the Students folder, which you mayinstall and examine for further information. SelSwitchDemo.ChangeSet.
Multiple WriteThe MultiWrite tag allows you to configure a set of values that will be written to alist of registers when triggered. This can be used to place a plant into a state ofoperation or to quickly shut a plant down in one step.Up to 100 output tags can be controlled by a single MultiWrite tag, with a definedvalue set to be written to each. The trigger for the write may be any of a manualbutton press, a tag that changes state from false to true, or an expression that eval-uates to true.
Operation and Configuration Student Workbook • 201

Chapter 17
Each value to be written will be checked to ensure that it is valid before it is writ-ten. Invalid writes will be ignored. All valid values will be written, regardless ofwhether or not they have changed since the last write.Should 100 tags not be enough, it is possible for one MultiWrite tag to triggeranother upon finishing its write sequence.An event will be recorded in the alarm history whenever a MultiWrite is triggeredThe MultiWrite is drawn as a button that operators may click to initiate the writeprocess.
DriverMUXDriver multiplexer (DriverMUX) tags allow you to set up redundant lines of com-munication between I/O tags and equipment. Possible uses for this tag include:
l Establishing a fail-over communications route in the event that one systemis lost.In its basic configuration, the DriverMUX tag will direct all communicationsto the primary driver. In the event that the connection to the primary driver islost, communication will switch to the secondary driver.
l Upgrading to new communications equipment/drivers with zero downtime.In this scenario, you would install the new equipment and drivers while theexisting system remains in place. The new drivers would be connected tothe DriverMUX tag instead of directly to your I/O devices. When you areready to test the new system, you can direct the DriverMUX to switch to thenew, secondary system. If there are problems, then communication willimmediately and automatically switch back to the primary system with noloss of data.
l Load sharing between two lines of communication.The DriverMUX tag can be directed to use both communication drivers ineither an alternating or an as-ready basis. While one driver is busy with alarge packet, the other can continue to send messages.
l To provide OPC Server redundancy.A DriverMUX tag may be configured with OPC Client Drivers as sub-ordinates. This will allow I/O tags to exchange data with any number ofOPC Servers.
Deadband ControlDeadband Control tags monitor the value of any tag with a numeric value andcompare the monitored tag's value to a low set point and a high set point. If thevalue of the monitored tag falls below the low set point, the value of the Dead-band Control tag is set to 1. If the value of the monitored tag rises above the highset point, the value of the Deadband Control tag is set to 0.A check box allows this action to be reversed.
Rate of Change
-
202 • Operation and Configuration Student Workbook

17 Bonus Topics
Rate of Change tags are used to display how quickly another tag’s value is chan-ging. They can be used to watch for system problems such as leaks and block-ages.The Rate of Change tag calculates the first derivative of another tag’s value. Ingeneral terms, this is defined as the change in value divided by the change intime. A steady flow has a rate of change of zero.Note: The source tag's value must be logged in order for the Rate of Change tagto work properly.The rate of change will be positive if the source is increasing in value, and neg-ative if the source tag’s value is decreasing. The tag can be configured to reportthe absolute value instead, thus showing a positive value for any rate of change.For example, the water level in a large holding tank would normally changeslowly unless it started to leak. A tank feeding a process would be expected tohave a level decreasing at a minimum rate unless the outlet became blocked. ARate of Change tag can be configured for either situation in order to detect depar-tures from an expected rate of change. Alarms built into the tag can be triggeredwhen the rate is too fast or too slow.Note that in remote applications, the Rate of Change tag information is distributedfrom the server to workstations on a regular interval (default: 60 seconds) or whenthe value changes by a given percentage (default: 5%). These values are con-trolled by application properties.
WorkstationWorkstation status driver tags can be associated with one or more Analog Inputtags to access data that the driver obtains from the Windows Management Instru-mentation (an API in the Windows operating system that enables devices and sys-tems in a network to be managed and controlled).Windows Vista requires additional security configuration before you will be ableto access performance counter information (i.e. workstation status information). Bydefault, an application will run using the same privileges as the person who star-ted it. You can add the user account that the application runs as to the Per-formance Log Users group and then assign that group the right to "Log on as aBatch Job User".A workstation status driver tag monitors a workstation and allows associated Ana-log Input tags to report and display data about the workstation.In order to access information about the workstation being monitored by a work-station status driver tag, follow these steps:
l Create a workstation status driver tag.Set the Workstation Name drop-down list to the name of the workstation youwish to monitor. (You can create one workstation status driver tag for eachworkstation you wish to monitor.)
l Create one Analog Input tag for each piece of data you wish to obtain fromthe workstation being monitored.
Operation and Configuration Student Workbook • 203
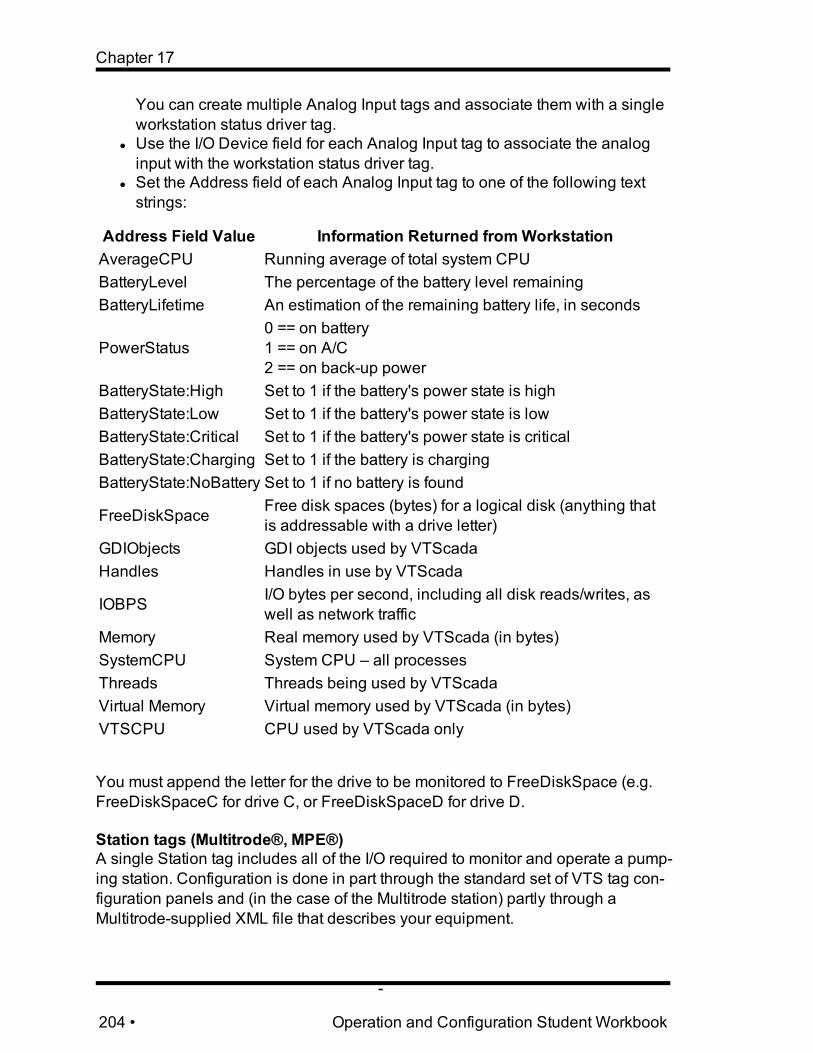
Chapter 17
You can create multiple Analog Input tags and associate them with a singleworkstation status driver tag.
l Use the I/O Device field for each Analog Input tag to associate the analoginput with the workstation status driver tag.
l Set the Address field of each Analog Input tag to one of the following textstrings:
Address Field Value Information Returned fromWorkstationAverageCPU Running average of total system CPUBatteryLevel The percentage of the battery level remainingBatteryLifetime An estimation of the remaining battery life, in seconds
PowerStatus0 == on battery1 == on A/C2 == on back-up power
BatteryState:High Set to 1 if the battery's power state is highBatteryState:Low Set to 1 if the battery's power state is lowBatteryState:Critical Set to 1 if the battery's power state is criticalBatteryState:Charging Set to 1 if the battery is chargingBatteryState:NoBattery Set to 1 if no battery is found
FreeDiskSpace Free disk spaces (bytes) for a logical disk (anything thatis addressable with a drive letter)
GDIObjects GDI objects used by VTScadaHandles Handles in use by VTScada
IOBPS I/O bytes per second, including all disk reads/writes, aswell as network traffic
Memory Real memory used by VTScada (in bytes)SystemCPU System CPU – all processesThreads Threads being used by VTScadaVirtual Memory Virtual memory used by VTScada (in bytes)VTSCPU CPU used by VTScada only
You must append the letter for the drive to be monitored to FreeDiskSpace (e.g.FreeDiskSpaceC for drive C, or FreeDiskSpaceD for drive D.
Station tags (Multitrode®, MPE®)A single Station tag includes all of the I/O required to monitor and operate a pump-ing station. Configuration is done in part through the standard set of VTS tag con-figuration panels and (in the case of the Multitrode station) partly through aMultitrode-supplied XML file that describes your equipment.
-
204 • Operation and Configuration Student Workbook

17 Bonus Topics
Station pages are available (and built in) for each type of station tag. Theseprovide complete monitoring and control of the station's I/O and alarms and arepre-built, ready for you to use.
Operation and Configuration Student Workbook • 205

Glossary
A
AckShort for Acknowledge
Anchor objectThe most recently selectobject in a selection set.Alignment and propertymatching tools will causeall other obejcts to matchthe anchor object.
Application pageA page that you can edit.
C
Communication ChainA set of tags configuring aport, a driver, and I/Oaddresses on remoteequipment.
D
DNSDomain Name Server
H
HDVHistorical Data Viewer
HSLHue Saturation Lumin-osity. A system for defin-ing a color.
L
LayerAny VTScada applic-ation, used as the found-ation for anotherapplication.
M
MICMobile Internet Con-nection
O
OEMOriginal Equipment Man-ufacturer
P
PageA display screen
PLCProgrammable Logic Con-troller
- 206 -

Glossary: RGB –Widget
R
RGBRed Green Blue. A sys-tem for defining a color
RTURemote Telemetry Unit
S
SMSShort Message Service
Snapshot ExpressionCode, within a tag's con-figuration, evaluated onlyon startup.
Start ConditionA snapshot expression ina tag's name field. Mustbe True or False. Con-trols the starting of thetag.
SyncImporting a previouslyexported tag database.
System pageA built-in page that youcannot edit.
T
TagThe representation of aphysical object. (Amongother things)
TAPITelephony ApplicationProgramming Interface
TSPTAPI Service Provider
U
URLUniform Resource Loc-ator (Internet address)
V
VICVTScada Internet Client
VPNVirtual Private Network
VTS/ISVTScada Internet Server
W
WidgetAnimation linked to a tag.
- 207 -

Index
A
Account 167Ack 131ActiveX 181Add Application Wizard 20Administrative Settings
dialog 171alarm system 130Alignment lines 29anchor object 31Application Privileges 170
B
blue distance arrow 30
C
Color Fill 81Context tags 75
D
Data source 40Deadband Control 202Deploy 191distributed version control 190DriverMUX 202drivers 2
E
exclamation mark 86Expressions 86
F
Fill tool 38
G
group 32
H
Home button 43HOSTS 183
I
Idea Studio 24Image Change 121Images 41Import File Changes 193Imported Images 44installation 4Internet Client Monitor 187
L
layers 2Lexicon 146Library dialog 46license 3Lighting overlays 43Link to tag 80Local Application 175local changes 190Logged Off 168Logger tag 152
M
Manage Tag Types 174Map 198MPE 204Multitrode 204MultiWrite 201Mute 131
N
navigation bar 23Numeric Value 83
- 208 -

Index: OEM – Zoom Controls
O
OEM 2opacity 124Outline 39
P
Page Menu 59Palettes 25parametrized page 115pinned page 23Plot Data 161Properties Dialog 39
Q
question mark 85Quick Access Toolbar 25Quick Add 21
R
Rate of Change 203RealmDisplaySetup 183Realms 183rearm 134red distance arrow 30Remote Application 175Report tag 164Reports page 162repository 193Revert 191Ribbons 25Roles 168Rules 170
S
Security 166Select Color dialog 38Selector Switch 201Set Value buttons 125Setup.INI 198Silence 131Site Details page 199
Site Draw 84Site Legend 84Site Map 198SlippyMapTiles 198Snapshot Expression 90SSL certificate 187Switch 192System Historian 151SystemStyle 102-103
T
Tag Icon Indicator 117Tags 63TAPI 146temporary group 32trigger 132Trip Alarm 135TSP 146Type 108
U
user copy 193
V
version numbering 190VIC 181VPN 182VTS/IS 181VTSX.exe 181
W
WEB 1Widgets 45widgets palette 46working copy 193Workstation status driver 203
Z
Zoom Controls 25
- 209 -

Index: OEM –Site Details page
Notes
- 210 -

Index: OEM –Site Details page
Notes
- 211 -

Index: OEM –Site Details page
Notes
- 212 -
