vswir: plant physiology and function types (ppft) …€¦ · · 2010-08-22vswir: plant...
TRANSCRIPT
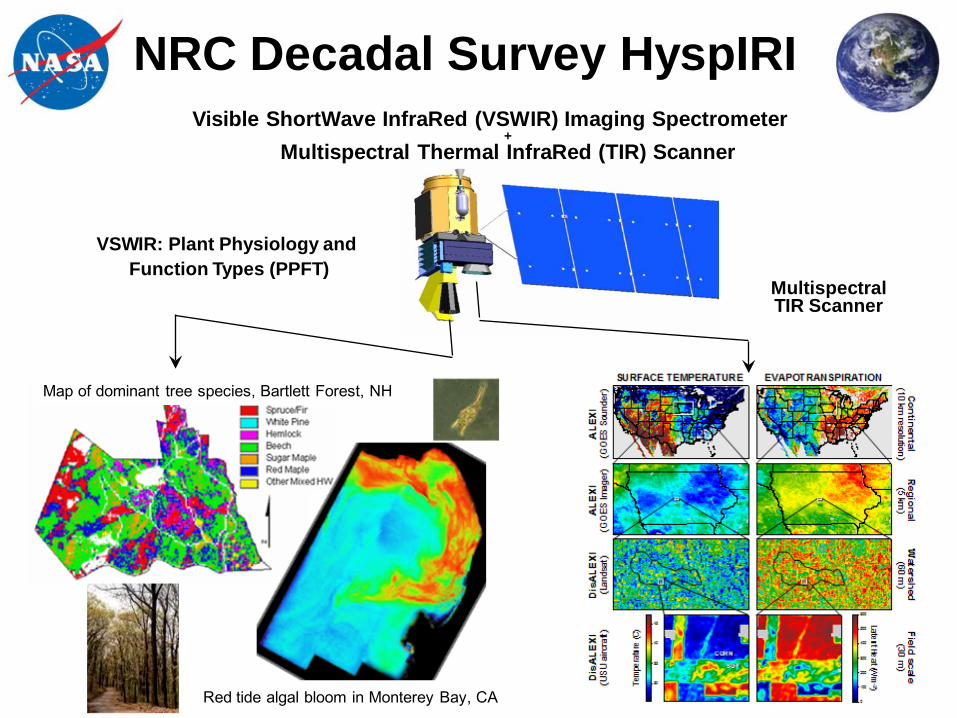
NRC Decadal Survey HyspIRI Visible ShortWave InfraRed (VSWIR) Imaging Spectrometer
+ Multispectral Thermal InfraRed (TIR) Scanner
VSWIR: Plant Physiology andFunction Types (PPFT)
Multispectral TIR Scanner
Red tide algal bloom in Monterey Bay, CA
Map of dominant tree species, Bartlett Forest, NH

2
HyspIRI Thermal Infrared Multispectral (TIR) Science Measurements
Science Questions:TQ1. Volcanoes/Earthquakes (MA,FF)– How can we help predict and mitigate earthquake and volcanic hazards through
detection of transient thermal phenomena?• TQ2. Wildfires (LG,DR)– What is the impact of global biomass burning on the terrestrial biosphere and
atmosphere, and how is this impact changing over time?• TQ3. Water Use and Availability, (MA,RA)– How is consumptive use of global freshwater supplies responding to changes in climate
and demand, and what are the implications for sustainable management of water resources?
• TQ4. Urbanization/Human Health, (DQ,GG)– How does urbanization affect the local, regional and global environment? Can we
characterize this effect to help mitigate its impact on human health and welfare?• TQ5. Earth surface composition and change, (AP,JC)– What is the composition and temperature of the exposed surface of the Earth? How do
these factors change over time and affect land use and habitability?
Measurement:
• 7 bands between 7.5-12 µm and 1 band at 4 µm
• 60 m resolution, 5 days revisit
• Global land and shallow water
Volcanoes
Urbanization
Water Use and Availability
Surface Temperature Evapotranspiration
Andean volcano heats up
0
0.1
0.2
0.3
0.4
0.5
0.6
0.7
0.8
0.9
1
3.00 4.00 5.00 6.00 7.00 8.00 9.00 10.00 11.00 12.00 13.00Wavelength (um)
Rel
ativ
e Sp
ectr
al R
espo
nse
H1 (m21)H2 (m28)H3 (a10)H4 (a11)H5 (a12)H6H7H8 (m32)
Multispectral Scanner
Schedule: 4 year phase A-D, 3 years operations
High Heritage
TIR

TIR Overarching Science Questions
• TQ1. Volcanoes/Earthquakes (MA,FF)– How can we help predict and mitigate earthquake and volcanic hazards through detection
of transient thermal phenomena?• TQ2. Wildfires (LG,DR)
– What is the impact of global biomass burning on the terrestrial biosphere and atmosphere, and how is this impact changing over time?
• TQ3. Water Use and Availability, (MA,RA)– How is consumptive use of global freshwater supplies responding to changes in climate
and demand, and what are the implications for sustainable management of water resources?
• TQ4. Urbanization/Human Health, (DQ,GG)– How does urbanization affect the local, regional and global environment? Can we
characterize this effect to help mitigate its impact on human health and welfare?• TQ5. Earth surface composition and change, (AP,JC)
– What is the composition and temperature of the exposed surface of the Earth? How do these factors change over time and affect land use and habitability?
4
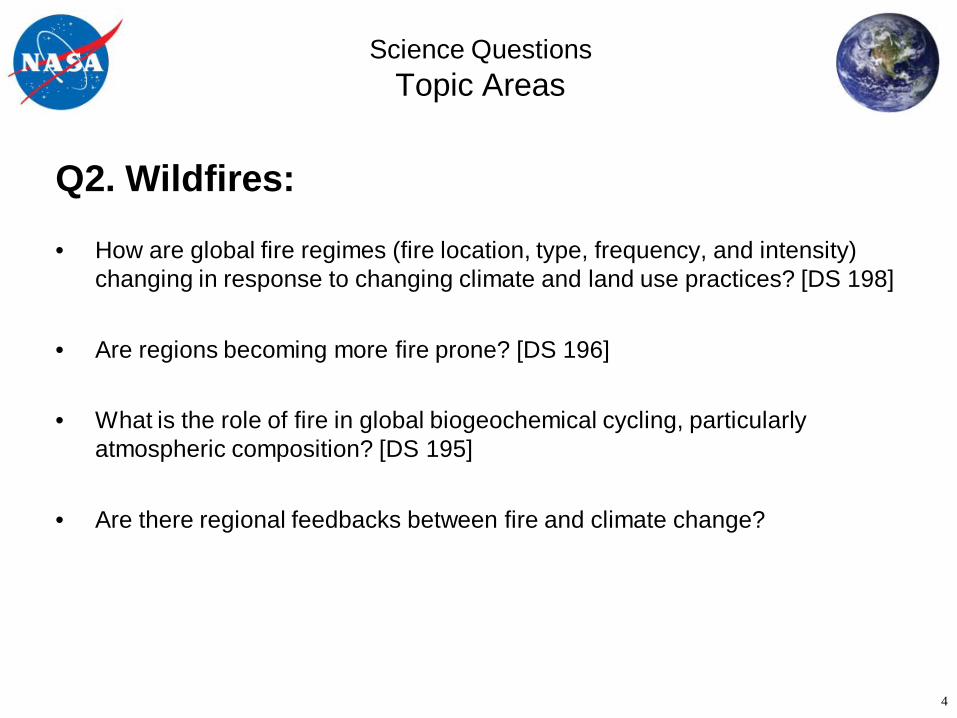
Q2. Wildfires:
• How are global fire regimes (fire location, type, frequency, and intensity) changing in response to changing climate and land use practices? [DS 198]
• Are regions becoming more fire prone? [DS 196]
• What is the role of fire in global biogeochemical cycling, particularly atmospheric composition? [DS 195]
• Are there regional feedbacks between fire and climate change?
Science Questions Topic Areas

5
Wildfires:How are global fire regimes changing?
Central Siberia
30 May 2001
30 m ASTER scene with
MODIS pixels superimposed (black squares)
High resolution thermal instrument can distinguish between the forest and non-forest parts of the flaming front allowing the fire type, intensity, etc., to be determined which indicates fire regime.
White squares show fire pixels detected by MODIS. Insufficient information to detect fire type
MIR band provides radiant flux to estimate rate at which biomass combusted and instantaneous emission estimate
HyspIRI will provide high spatial resolution mid to thermal infrared data for determining the fire regime and allowing flux estimation on a weekly basis

6
Q3. Water Use and Availability:
• How is climate variability impacting the evaporative component of the global water cycle over natural and managed landscapes? (DS 166, 196, 203, 257, 368; WGA)
• How can information about evapotranspiration and its relationship to land-use/land-cover be used to facilitate better management of freshwater resources? [DS 196, 203, 368]
• How can we improve early detection, mitigation, and impact assessment of droughts at local to global scales? [DS 166, 196, 203, 368]
• What is the current global irrigated acreage, how is it changing with time, and are these changes in a sustainable balance with regional water availability? [DS 196, 368]
• Can we increase food production in water-scarce agricultural regions while improving or sustaining environmental access to water? [DS 196, 368]
Science Questions Topic Areas
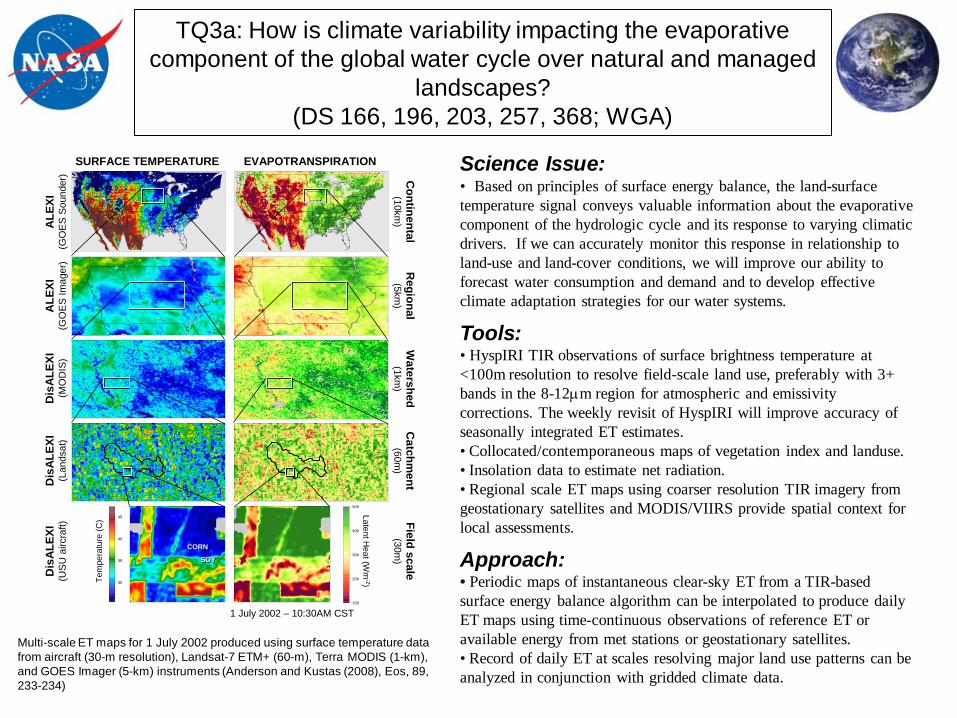
Science Issue:• Based on principles of surface energy balance, the land-surface temperature signal conveys valuable information about the evaporative component of the hydrologic cycle and its response to varying climatic drivers. If we can accurately monitor this response in relationship to land-use and land-cover conditions, we will improve our ability to forecast water consumption and demand and to develop effective climate adaptation strategies for our water systems.
Tools:• HyspIRI TIR observations of surface brightness temperature at <100m resolution to resolve field-scale land use, preferably with 3+ bands in the 8-12µm region for atmospheric and emissivity corrections. The weekly revisit of HyspIRI will improve accuracy of seasonally integrated ET estimates. • Collocated/contemporaneous maps of vegetation index and landuse.• Insolation data to estimate net radiation.• Regional scale ET maps using coarser resolution TIR imagery from geostationary satellites and MODIS/VIIRS provide spatial context for local assessments.
Approach:• Periodic maps of instantaneous clear-sky ET from a TIR-based surface energy balance algorithm can be interpolated to produce daily ET maps using time-continuous observations of reference ET or available energy from met stations or geostationary satellites.• Record of daily ET at scales resolving major land use patterns can be analyzed in conjunction with gridded climate data.
TQ3a: How is climate variability impacting the evaporative component of the global water cycle over natural and managed
landscapes? (DS 166, 196, 203, 257, 368; WGA)
30
35
40
45
100
200
300
400
500
1 July 2002 – 10:30AM CST
Dis
ALE
XI(L
ands
at)
Dis
ALE
XI(U
SU
airc
raft)
Catchm
ent(60m
)Field scale
(30m)
CORNCORN
SOYSOY
SURFACE TEMPERATURE EVAPOTRANSPIRATION
ALE
XI(G
OE
S Im
ager
) Regional(5km
)
ALE
XI(G
OE
S S
ound
er) C
ontinental(10km
)
Tem
pera
ture
(C)
Latent Heat (W
m-2)
Dis
ALE
XI(M
OD
IS)
Watershed
(1km)
Multi-scale ET maps for 1 July 2002 produced using surface temperature data from aircraft (30-m resolution), Landsat-7 ETM+ (60-m), Terra MODIS (1-km), and GOES Imager (5-km) instruments (Anderson and Kustas (2008), Eos, 89, 233-234)
8
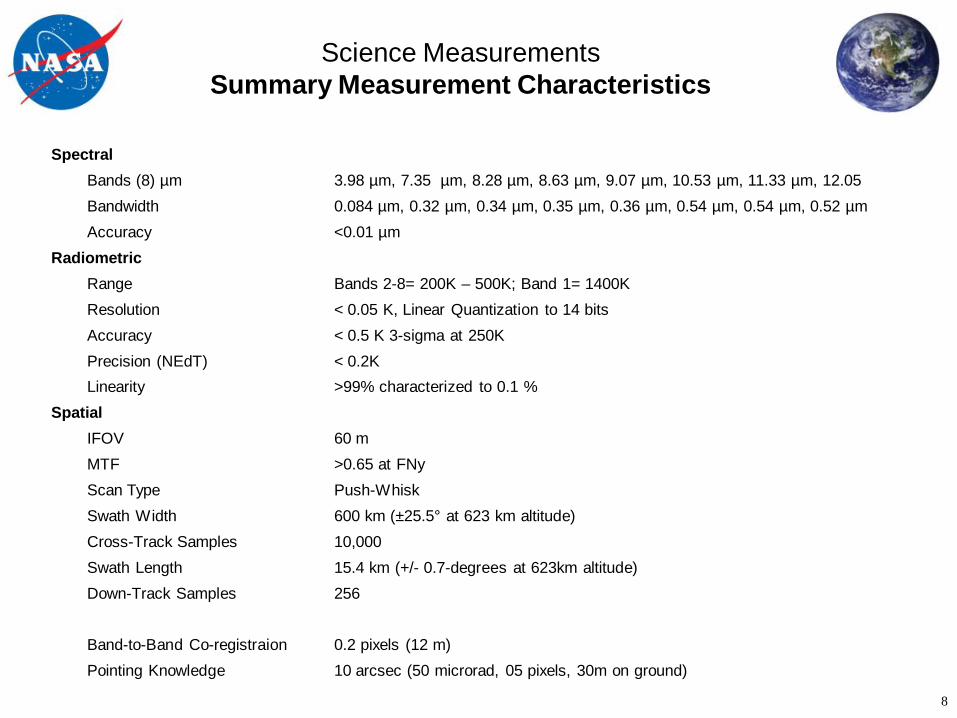
Science MeasurementsSummary Measurement Characteristics
SpectralBands (8) µm 3.98 µm, 7.35 µm, 8.28 µm, 8.63 µm, 9.07 µm, 10.53 µm, 11.33 µm, 12.05 Bandwidth 0.084 µm, 0.32 µm, 0.34 µm, 0.35 µm, 0.36 µm, 0.54 µm, 0.54 µm, 0.52 µmAccuracy <0.01 µm
RadiometricRange Bands 2-8= 200K – 500K; Band 1= 1400KResolution < 0.05 K, Linear Quantization to 14 bitsAccuracy < 0.5 K 3-sigma at 250KPrecision (NEdT) < 0.2KLinearity >99% characterized to 0.1 %
SpatialIFOV 60 mMTF >0.65 at FNyScan Type Push-WhiskSwath Width 600 km (±25.5° at 623 km altitude)Cross-Track Samples 10,000Swath Length 15.4 km (+/- 0.7-degrees at 623km altitude)Down-Track Samples 256
Band-to-Band Co-registraion 0.2 pixels (12 m)Pointing Knowledge 10 arcsec (50 microrad, 05 pixels, 30m on ground)
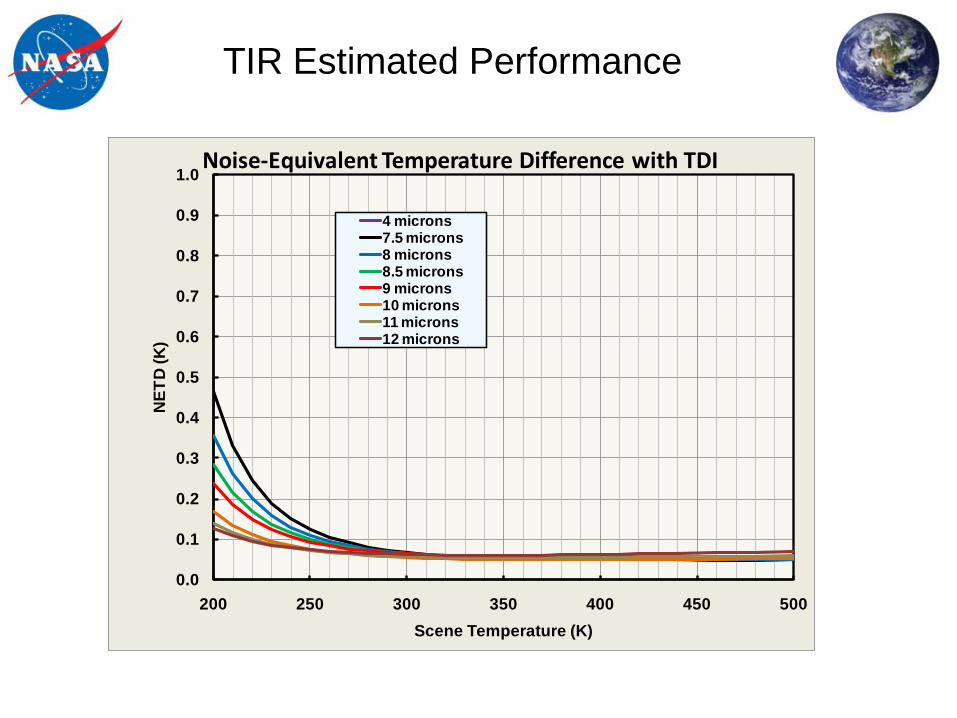
TIR Estimated Performance
0.0
0.1
0.2
0.3
0.4
0.5
0.6
0.7
0.8
0.9
1.0
200 250 300 350 400 450 500
NET
D (K
)
Scene Temperature (K)
Noise-Equivalent Temperature Difference with TDI
4 microns7.5 microns8 microns8.5 microns9 microns10 microns11 microns12 microns
10
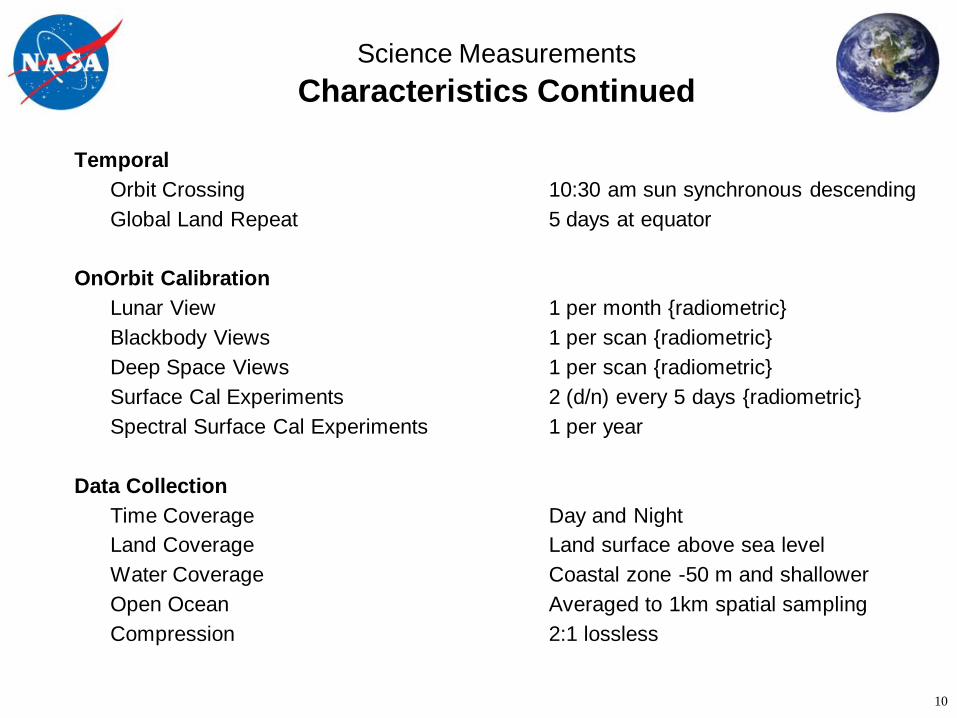
TemporalOrbit Crossing 10:30 am sun synchronous descendingGlobal Land Repeat 5 days at equator
OnOrbit CalibrationLunar View 1 per month {radiometric}Blackbody Views 1 per scan {radiometric}Deep Space Views 1 per scan {radiometric}Surface Cal Experiments 2 (d/n) every 5 days {radiometric}Spectral Surface Cal Experiments 1 per year
Data CollectionTime Coverage Day and NightLand Coverage Land surface above sea levelWater Coverage Coastal zone -50 m and shallowerOpen Ocean Averaged to 1km spatial samplingCompression 2:1 lossless
Science MeasurementsCharacteristics Continued

11
Mission ConceptOperational Scenario
• Following arrival at science orbit, the baseline data acquisition plan is established. Collect data for entire land surface excluding sea ice (Arctic and Antarctic) every 5 days at 60 m spatial resolution in 8 spectral bands
• Data are downlinked and transferred to the science data processing center where calibration and baseline processing algorithms are applied.
• Level 1, 2 products are delivered to the scientific community and general users to pursue the science questions– With appropriate cloud screening, compositing, spatial, and temporal subsetting
Land and coastal acquisition

12
Mission Concept TIR Overview
• Duration: 4 years development, 3 years science
• Coverage: Global land and shallow water every 5 days
• Day and Night imaging (1 day and night image at a given location obtained every 5 days)
• Data download using dual-polarization X-band at high-latitude stations
• Spacecraft: LEO RSDO bus (SA-200HP)
• Launch: Taurus-class launch vehicle
Sunshade
ScanMirror
Blackbody(V-Groove)
Space View
ActiveCryo-Cooler
PassiveRadiator

13
Mission Concept TIR Overview
• Duration: 4 years development, 3 years science
• Coverage: Global land and shallow water every 5 days
• Day and Night imaging (1 day and night image at a given location obtained every 5 days)
• Data download using dual-polarization X-band at high-latitude stations
• Spacecraft: LEO RSDO bus (SA-200HP)
• Launch: Taurus-class launch vehicle
Earth View
ScanMirror
Blackbody(V-Groove)
Space View

Summary
We have developed a set of TIR science questions that are well aligned with the HyspIRI Mission called for in the NASA Earth Science and Application Decadal Survey.
We have reviewed and refined these questions that relate to both science and application objectives and developed traceability to a set of science measurements.
We have established a high heritage and low risk approach for acquiring the HyspIRI TIR science measurements

Backup

16
TIR TRL is High
Subsystem TRL Comments
Scanner 9 Flight Proven on Numerous Designs
Telescope 9 Flight Proven on Galileo SSI, MGS-TES, CZCS, Cassini VIMS, HiRISE
Optical Filters 9 Flight Proven on MODIS, ASTER, Landsat
Focal Plane Assembly 6-7 Similar Detector Materials and ROIC’s Demonstrated on Ground and in Space
Active Cooler 9 Proven on Numerous Flight Programs
Passive Cryocoolers 9 Proven on M3, AIRS. More advanced forms flown on many programs.
Blackbody 9 Proven on MODIS
Mechanical / Thermal Systems 9 Proven on numerous flight missions
Scan Line Corrector N/A There is no scan line corrector!
Electronic Subsystems 6, 9 Exact form proven in Lab, Similar Designs flown on other Space Programs