voter strategies with restricted choice menus
TRANSCRIPT

B.J.Pol.S. 36, 459–485 Copyright © 2006 Cambridge University Press
doi:10.1017/S000712340600024X Printed in the United Kingdom
Voter Strategies with Restricted Choice Menus
KENNETH BENOIT, DANIELA GIANNETTI A N D MICHAEL LAVER*
Mixed-member electoral systems require voters simultaneously to cast ballots in single-member districts(SMD) and multimember, proportional representation (PR) constituencies. It may be that not all parties offercandidates in both electoral contexts, however. In this event would-be voters for some parties may findthemselves ‘frustrated’ by the restricted choice menu on offer in the SMD, being effectively forced to splittheir vote between different parties. Here we explore the different behaviours of frustrated voters in the 1996mixed-member election to Italy’s Chamber of Deputies, characterizing these as being either in some sensenon-strategic (concerned above all with the relative policy platforms of candidates) or strategic (concernedabove all to influence the eventual composition of government). Using an extended method for ecologicalinference, we parameterize and estimate rates of different types of ticket-splitting at the district level, and linkthe degree of what we characterize as strategic voting to the relative policy distance between the respectivelocal representatives of the Italian pre-electoral coalitions.
Split-ticket voting happens when voters choose, simultaneously or nearly simultaneously,to vote for different parties in different electoral contexts. This may occur inmixed-member electoral systems, run-off elections or simultaneous elections to differentbodies – for example, when national elections take place at the same time as elections tosubnational or supranational bodies. In such contexts, voters may chose to maintain aconsistent ‘ticket’ by casting two or more ballots for the same party, or to split their ticketby voting for different parties on different ballots. How real voters exercise this choice hasa range of theoretical implications for voting behaviour, relating among other things to:strategic voting;1 divided government;2 the impact of ballot mechanisms;3 the efficacyof campaigning;4 and the approval or rejection of potential governments.5 The logic ofsplit-ticket voting is thus central to many different accounts of voter motivation;discussions of this have occupied much space in the empirical and theoretical literatureon electoral behaviour.
In most of these discussions, ticket splitting is assumed to be a matter of free strategicchoice for the voter, yet this is not always the case. In particular, mixed-member electoral
* Department of Political Science, Trinity College Dublin; Department of Politics, University of Bologna;Department of Political Science, New York University, respectively. For comments on earlier versions of thisarticle, thanks to Raj Chari, John Haslett, Erik Herron, David Jackson, Gail McElroy and Gary King, and to JeffGill, Gary King, Ken Schotts and Michael Herron for advice on estimation issues. Thanks also to RenatoMannheimer for making ISPO survey data available. Work on this article was undertaken while Kenneth Benoitwas a Government of Ireland Research Fellow, Daniela Giannetti was a TMR Visiting Scholar at the TrinityCollege, Dublin, and Michael Laver was a Government of Ireland Senior Research Fellow.
1 Gary W. Cox, Making Votes Count: Strategic Coordination in the World’s Electoral Systems (Cambridge:Cambridge University Press, 1997); Michael Laver, ‘The Logic of Plurality Voting in Multiparty Systems’, inManfred Holler, ed., The Logic of Multiparty Systems (Dordrecht: Kluwer Academic Publishers, 1987),pp. 359–70.
2 Morris P. Fiorina, Divided Government, 2nd edn (Needham Heights, Mass.: Allyn and Bacon, 1996).3 Paul Allen Beck, Party Politics in America, 8th edn (New York: Longman, 1997).4 Barry C. Burden and David C. Kimball, ‘A New Approach to the Study of Ticket Splitting’, American
Political Science Review, 92 (1998), 533–44.5 Kaare Strøm, Ian Budge and Michael Laver, ‘Constraints on Cabinet Formation in Parliamentary
Democracies’, American Journal of Poltical Science, 38(1994), 303–35.
460 B E N O I T, G I A N N E T T I A N D L A V E R
systems of their essence place voters simultaneously in two distinct political contexts. Oneis a proportional representation (PR) context in multi-member constituencies, where theballot offers voters a choice from what is typically a comprehensive menu of party labels.The other is a single-member district (SMD) context, where the ballot presents a choicebetween individual candidates. Since the SMD elections typically use a plurality rule,strategic nomination decisions within sets of like-minded parties concerned not to splittheir vote and thereby lose the election typically mean that not all parties nominatecandidates to SMDs. As a result the choice menu for a voter in any given SMD is typicallyfar more limited than in the PR election. Clearly, mixed-member electoral systems forcesome voters to split their tickets, when the party they most prefer in the PR election is noton the menu in their SMD.
As mixed-member electoral rules gain in popularity,6 ticket-splitting in this context hasreceived increasing attention, typically as a study in voter response to the same menu ofalternatives when these are offered in different electoral contexts.7 Very few studies ofticket-splitting, however, have focused on the behaviour of voters in mixed-membersystems who are forced to split their tickets because the same set of alternatives isunavailable in the two electoral settings. Pierce has examined election surveys fromtwo-ballot run-off elections to model second choices made by what he terms ‘thwarted’voters: those whose first round choice did not qualify for the run off.8 Thwarted voters inthe two-round elections, however, have the possibility of abstention from the second roundof voting, an option not typically observed in mixed-member systems where both ballotsare cast simultaneously. No previous study has systematically investigated the choices ofvoters in mixed-member systems who are forced to split their vote because the same partychoices are not available on both ballots.
The analysis of voter behaviour in this quasi-experimental context does, however, yieldpotentially rich insights into the general logic of voting. Furthermore, new techniques ofecological inference now allow us to estimate, at the district level, actual split-ticket votingin mixed-member electoral systems, supplementing previous approaches drawn mainlyfrom surveys. In what follows we model voting behaviour in settings where voters mustchoose simultaneously in two different contexts from the same general choice menu, yetwhere the menu in one of those contexts is a restricted version of the other. Our empiricalcontext is Italy, where following electoral law reform in 1993, electoral competition hasbecome a contest between two large pre-electoral coalitions formed by the Italian parties.By the 1996 election, the use of pre-electoral coalitions had developed into disciplinedarrangements whereby the two coalitions – both vying for control of the government – eachagreed to nominate only one candidate in each SMD. The pre-electoral coalitionarrangement restricts the choice menu for voters in the SMD, since the supporters of allbut one party from each coalition will be forced to split their tickets because their most
6 Matthew S. Shugart and Martin P. Wattenberg, eds, Mixed-Member Electoral Systems: The Best of BothWorlds? (Oxford: Oxford University Press, 2001).
7 Karen Cox and Leonard Schoppa, ‘Interaction Effects in Mixed-Member Electoral Systems: Theory andEvidence from Germany, Japan, and Italy’, Comparative Political Studies, 35 (2002), 1027–53; ThomasGschwend, ‘Ticket-splitting and Strategic Voting in Mixed Electoral Systems’, MZES Working Paper No. 61(Mannheim: Mannheimer Zentrum fur Europaische Sozialforschung, 2003); Jeffrey A. Karp, Jack Vowles, SusanA. Banducci and Todd Donovan, ‘Strategic Voting, Party Activity, and Candidate Effects: Testing Explanationsfor Split Voting in New Zealand’s New Mixed System’, Electoral Studies, 21 (2002), 1–22.
8 Roy Pierce, ‘Modelling Electoral Second Choices: Thwarted Voters in the United States, France, and Russia’,Electoral Studies, 22 (2003), 265–85.
Voter Strategies with Restricted Choice Menus 461
preferred PR party does not also offer an SMD candidate. One possible choice is then tostick with their most-preferred party’s coalition candidate, possibly displaying a strategicconcern for electing a government and by implication for policy outcomes. The alternativeis to split their vote across coalitions by voting for the rival coalition candidate, based onthe policy platform of the rival candidate’s party without effective regard to the eventualelection outcome. Our framework first defines this choice matrix for each voter and outlinesthe quantities of coalition-sticking and coalition-switching among voters whose menuchoices have been restricted. Using the 1996 Italian National Election Study (ITANES),we gain some initial insight into this problem by examining individual-level responseitems. After reaching the limits of the ITANES data, we then turn to district-level electiondata to generate district-level estimates of split-ticket voting along coalition and party lines,using Gary King’s ecological inference (EI) technique.9 Because our concern is not onlyto estimate splitting and sticking among thwarted voters, but also to estimate their strategicchoices, we explain variation in coalition-splitters in terms of the relative policy positionsof the SMD candidates in each district. This analysis thereby sheds empirical light on therelative concern of voters for policy outcomes versus policy platforms. Our findingssuggest that voters are mainly concerned with policy outcomes, but defect increasinglyfrom their coalitions as the distance from their policy ideal points to their own coalitioncandidate increases, and as distance to the rival coalition candidate decreases. In thespecific Italian case, this confirms the conventional wisdom using precise, empiricalmethods that have never before been applied to that country’s mixed-member system. Ouraccount begins with a brief explanation of the context of split-ticket voting in Italy andour method for measuring this empirically.
TICKET-SPLITTING IN THE ITALIAN MIXED MEMBER SYSTEM
Under a law approved in August 1993, elections to the Italian lower chamber use amixed-member electoral system. This involves 475 single-member districts in whichcandidates contest plurality elections, as well as twenty-six multi-member constituencies(circoscrizioni) from which a total of 155 seats are allocated by proportional representation(PR), giving a total legislature of 630 seats.10 The new electoral system was expected bymany to bring about profound structural change in the party system, notably a significantreduction in the number of parties. This was because the dominant plurality element in thesystem, responsible for the selection of more than 75 per cent of legislators, was expectedto provide strong incentives for parties competing for the same pool of voters to combineinto larger units, thereby avoiding the damaging effects under plurality elections ofsplitting the available vote between them.
Italian parties resisted this tendency, however, and maintained their distinct identitiesin a multiparty system. Rather than fusing permanently into larger units, many parties choseto organize into one of two opposing electoral pre-electoral coalitions. This process beganloosely in 1994, but was not fully operative until the 1996 elections. In that context,electoral competition was structured around two major pre-election coalitions, the Polodella Liberta (The Pole of Liberty), on the right, and the Ulivo (Olive Tree), on the left
9 Gary King, A Solution to the Ecological Inference Problem (Princeton, N.J.: Princeton University Press,1997).
10 For a brief but clear description, see Roberto D’Alimonte, ‘Appendix: The Italian Elections of 1996’,European Journal of Political Research, 34 (1998), 171–4.
462 B E N O I T, G I A N N E T T I A N D L A V E R
(see Appendix A). Each coalition’s main function is to ensure that member parties do notcompete in single-member districts against one another, as each coalition offers only onecandidate per SMD. Coalition member parties retain distinct identities, however, andcompete as individual parties in the PR constituencies. Italy’s electoral reform has thusnot led to a two-party system at the national level, although it has tended to generatetwo-candidate competition at the local level.11
This arrangement to limit competition in the Italian SMD elections means that manyvoters supporting their most-preferred party in a PR constituency will be forced to votefor a different party, to split their ticket, in the SMD. In the 1996 elections, arrangementsby pre-election coalitions meant that only one of the five parties from the Ulivo coalition,and only one of the three from Polo, would offer a candidate in any given SMD. The netresult was that 56 per cent of voters casting ballots for parties on PR lists were forced tosplit their ticket, since the party they voted for in the PR constituency did not offer acandidate in their SMD.12 In what follows we describe voters who are prevented fromvoting in the SMD for the party they supported in the PR election as ‘frustrated’, and voterswho are offered the opportunity to vote in the SMD for the first choice in the PR electionas ‘satisfied’. The empirical distributions of satisfied and frustrated voters are describedin Appendix A, which summarizes the plurality contests in the 475 SMDs, highlightingthe party sponsorship of candidates affiliated to the two pre-election coalitions, as well asother candidates.13
While the PR element fills a much smaller number of seats than the plurality element,it nonetheless plays a very important role in Italian politics. First, nearly every Italian partyoffers a list in the multi-member constituencies. Electoral preferences, furthermore, tendto be defined along party terms. While opinion data shows a growing identification withinthe electorate with the two main electoral coalitions, up to 1996 the primary focus of loyaltyin Italian politics was still the party.14 Secondly, while the two pre-electoral coalitions arein effect proposals for alternative coalition governments, the PR component provides eachcoalition with a direct measure of each member party’s relative contribution to thecoalition, information used in the bargaining process for coalition formation and theallocation of government jobs. Thirdly, for non-coalition parties, the level of PR supportis the basis for representation in the parliament (provided that they pass the 4 per cent
11 Stephen Reed, ‘Duverger’s Law Is Working in Italy’, Comparative Political Studies, 34 (2001), 312–27. Thecoalition arrangement was also in effect in 2001, although the coalitions were slightly renamed and consisted ofslightly different parties. We have chosen to focus on the 1996 contest as it represents the first election followingthe 1993 reform where the coalition system was fully operative. While there is no reason why our analysis couldnot be applied to the 2001 elections, given the complexity of our empirical estimation we believe that includingadditional elections would unnecessarily burden this article.
12 The figure of 56 per cent is computed as the total number of voters who cast their PR votes for parties thatdid not also have candidates in that voter’s district (21,182,440) divided by the total PR votes (37,494,964).
13 Bargaining among party leaders determines which party will offer the SMD candidate from each coalition,and this bargaining is conditional on two criteria. First, using a proportionality rule, SMD candidacies are allocatedto parties according to their proportional vote share in previous local and national elections. Secondly, there isa careful rating of each electoral district into ‘safe’, ‘marginal’ and ‘lost’ – again on the basis of the results ofthe previous elections at the national and the local level (Aldo Di Virgilio, ‘L’offerta elettorale: la politica dellaalleanze si istituzionalizza’, in Roberto d’Alimonte and Stefano Bartolini, eds, Maggioritario finalmente? Latransizione elettorale 1994–2001 (Bologna: Il Mulino, 2002), to ensure an acceptable distribution of winnableseats among coalition members.
14 Marco Maraffi, ‘Per che cosa si e votato il 13 maggio? Le mappe cognitive degli elettori italiani’, in MarioCaciagli and Corbetta Piergiorgio, eds, Le ragioni dell’elettore (Bologna: Il Mulino, 2002), pp. 301–38.
Voter Strategies with Restricted Choice Menus 463
threshold). Finally, the PR vote share of parties determines the level of public funding forcampaign reimbursement. Thus, while ‘contamination effects’ in some mixed-membersystems may tip the balance in favour of the plurality component,15 the Italian system haslargely resisted these contamination effects and maintained voter affiliation primarilyoriented towards parties.16
While all voters in mixed-member elections have the option to split their tickets, someItalian voters, whom we describe as frustrated, are forced to do this given the failure oftheir most preferred party to offer a choice on both ballots. There are two possible waysin which frustrated Italian voters may respond to this restricted choice menu. First, theymay vote for the candidate sponsored by their most-preferred party’s coalition. Thisincreases the probability that their most-preferred party will be a member of the winningpre-electoral coalition, will go into government, will receive cabinet seats and will therebyhave some impact on public policy and other benefits. Such voters in effect use their votesto influence which pre-electoral coalition wins the election. We describe these voters ascoalition-stickers: they are frustrated voters who stick with the SMD coalition of the partythey supported in the PR election. The other option for frustrated voters is to give theirSMD vote to a candidate outside their first-choice party’s coalition, either to the candidatefrom the rival coalition or to one of the several non-coalition candidates typically on offer.We describe these voters as coalition-splitters. Satisfied voters, of course, may also splittheir tickets – something we return to examine in detail below – but our key focus in whatfollows is on Italian voters who are forced to split their ticket.
MEASURING SPLIT-TICKET VOTING IN ITALY
Ticket-splitting choices are faced by individual voters. Ideally, this phenomenon wouldbe analysed with individual-level data. Opinion surveys have been the most commonlyused method to investigate voting decisions, offering a direct measure of voter behaviourand motivations with regard to voting strategy. Our analysis therefore begins with theItalian National Election Study (ITANES)17 of 1996, a detailed survey of 2,502respondents. The ITANES includes questions about party closeness, voter choice on bothballots and vote motivations.
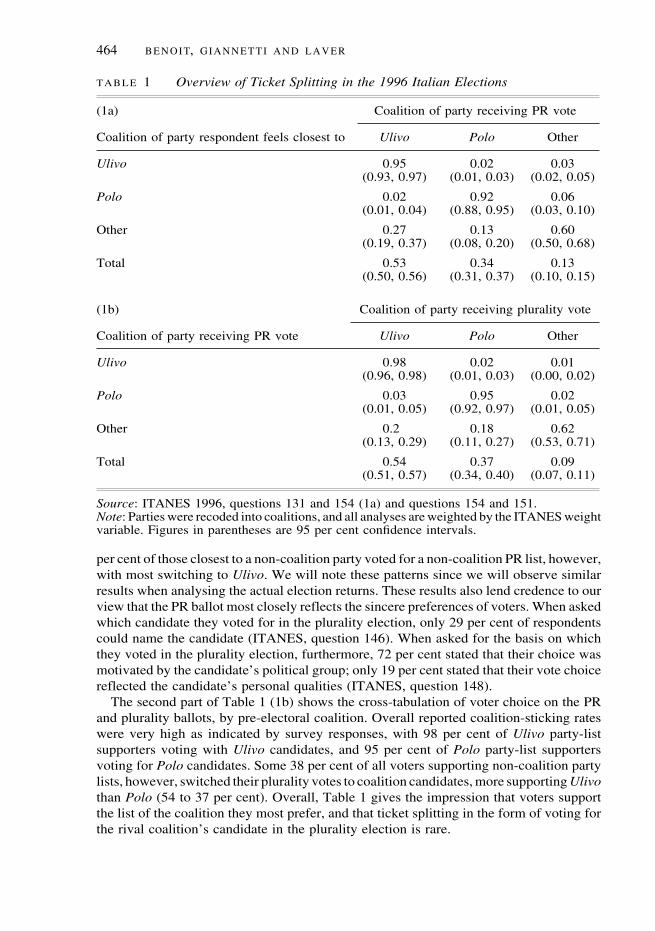
As we have noted, in the proportional representation constituency elections, competitionis organized around parties rather than pre-electoral coalitions. We have assumed that onthis ballot, voters will sincerely support their most preferred party’s list. The ITANES dataallows us to explore this assumption empirically. The first panel in Table 1 (1a) shows therelationship of respondents’ reports of ‘closeness’ to a party and their PR list vote. Thefigures represent the row proportions and (in parentheses) 95 per cent confidence intervals.As can be clearly seen, respondents tended to vote for the lists of the parties they felt closestto. (Here we have aggregated parties into coalitions for convenience but individual partysticking rates are similarly high.) From those reporting they are closest to an Ulivo coalitionparty, 95 per cent cast their PR ballots for an Ulivo party’s list; from those reportingcloseness to a Polo party, 92 per cent cast their PR ballots for a Polo party’s list. Only 60
15 Erik S. Herron and Misa Nishikawa, ‘Contamination Effects and the Number of Parties in Mixed-Superposition Electoral Systems’, Electoral Studies, 20 (2001), 63–86.
16 Cox and Schoppa, ‘Interaction Effects in Mixed-Member Electoral Systems’, p. 1036.17 ITANES 1996, Italian National Election Study, Istituto Cattaneo; it is available from http://
www.cattaneo.org/english/dati/itanes.html, and also in an English-language version from http://socrates.berkeley.edu:7502/CAT/INES/1996/EN/Doc/hcb.htm.
464 B E N O I T, G I A N N E T T I A N D L A V E R
TABLE 1 Overview of Ticket Splitting in the 1996 Italian Elections
(1a) Coalition of party receiving PR vote
Coalition of party respondent feels closest to Ulivo Polo Other
Ulivo 0.95 0.02 0.03(0.93, 0.97) (0.01, 0.03) (0.02, 0.05)
Polo 0.02 0.92 0.06(0.01, 0.04) (0.88, 0.95) (0.03, 0.10)
Other 0.27 0.13 0.60(0.19, 0.37) (0.08, 0.20) (0.50, 0.68)
Total 0.53 0.34 0.13(0.50, 0.56) (0.31, 0.37) (0.10, 0.15)
(1b) Coalition of party receiving plurality vote
Coalition of party receiving PR vote Ulivo Polo Other
Ulivo 0.98 0.02 0.01(0.96, 0.98) (0.01, 0.03) (0.00, 0.02)
Polo 0.03 0.95 0.02(0.01, 0.05) (0.92, 0.97) (0.01, 0.05)
Other 0.2 0.18 0.62(0.13, 0.29) (0.11, 0.27) (0.53, 0.71)
Total 0.54 0.37 0.09(0.51, 0.57) (0.34, 0.40) (0.07, 0.11)
Source: ITANES 1996, questions 131 and 154 (1a) and questions 154 and 151.Note: Parties were recoded into coalitions, and all analyses are weighted by the ITANES weightvariable. Figures in parentheses are 95 per cent confidence intervals.
per cent of those closest to a non-coalition party voted for a non-coalition PR list, however,with most switching to Ulivo. We will note these patterns since we will observe similarresults when analysing the actual election returns. These results also lend credence to ourview that the PR ballot most closely reflects the sincere preferences of voters. When askedwhich candidate they voted for in the plurality election, only 29 per cent of respondentscould name the candidate (ITANES, question 146). When asked for the basis on whichthey voted in the plurality election, furthermore, 72 per cent stated that their choice wasmotivated by the candidate’s political group; only 19 per cent stated that their vote choicereflected the candidate’s personal qualities (ITANES, question 148).
The second part of Table 1 (1b) shows the cross-tabulation of voter choice on the PRand plurality ballots, by pre-electoral coalition. Overall reported coalition-sticking rateswere very high as indicated by survey responses, with 98 per cent of Ulivo party-listsupporters voting with Ulivo candidates, and 95 per cent of Polo party-list supportersvoting for Polo candidates. Some 38 per cent of all voters supporting non-coalition partylists, however, switched their plurality votes to coalition candidates, more supporting Ulivothan Polo (54 to 37 per cent). Overall, Table 1 gives the impression that voters supportthe list of the coalition they most prefer, and that ticket splitting in the form of voting forthe rival coalition’s candidate in the plurality election is rare.
Voter Strategies with Restricted Choice Menus 465
While the ITANES data provide a general estimate of ticket splitting, we have takenthese data about as far as they can go with regard to our analysis, which fundamentallyconcerns not vote splitting in general but rather forced vote splitting. Unless we know theprecise (single-member) district context in which a voter participated, we cannot knowwhether that voter had the option to split her ticket, or was instead forced to do so by thepre-electoral coalition arrangement. While the ITANES data do contain an identifier forthe respondent’s constituency (the twenty-six PR districts), there is no similar identifierfor district (the 475 SMDs). The result is that it is impossible to link the survey informationwith the respondent’s strategic context from actual election data.18 And even if it werepossible to link the survey with district-level information, the upper limit of 2,502 surveyrespondents would have yielded an average of only five responses for each SMD, severelylimiting the inferences we could make regarding the effects of strategic context. Toinvestigate strategic and non-strategic behaviour with restricted choice menus, by contrast,we require sufficient observations at the local district level to allow for reliable estimationin the context where ticket splitting actually takes place. Not only are incentives forticket-splitting typically highly localized, varying by district and constituency,19 but alsothis holds particularly true in the Italian case.20 In effect, in order to dig deeper into ourresearch question, we must turn to a different source of data.
The only direct information about ticket splitting normally available to researchers insufficient quantity, and freely available in the Italian context, is found in actual votingresults aggregated at some unit of electoral geography, such as precinct, district, state orregion. Because the theoretical matter of interest concerns individual behaviour, however,previous attempts to squeeze insight from aggregate election results have run into thewell-known problem of ecological inference. The ecological inference problem occurswhen the observed data are aggregate-level quantities – here, total district votes for eachballot – but when the phenomena of interest are individual-level quantities, such as theprobability that a single Forza Italia PR voter will support an SMD candidate from the Ulivocoalition. In the Italian context, we can form a table in each district where rows are PRconstituency party choice – ranging from a minimum of nine to a maximum of fifteenparties – and the three columns are coalition choice, one each for Ulivo, Polo andnon-coalition candidates. In each district we observe only the table marginals, but it isthe interior (unknown) cell values we wish to estimate. The large size of this table,and the correspondingly higher number of unknowns, makes the multipartyecological inference problem substantially greater than in other split-ticket contexts whereecological inference techniques have been used.21
Work by Johnston and Pattie has applied an alternative entropy-maximizing procedureto estimate split-ticket voting in New Zealand’s multiparty, mixed-member system to
18 The geographical identifiers in the ITANES can be matched with census data but not with election data.Variable q235 reports PR constituency, but not plurality district; the average constituency contains more thaneighteen plurality districts. Variable q236 reports municipality, but municipalities do not correspond to electoraldistricts. For instance, one municipality (e.g. Rome) may contain numerous districts.
19 Michael Shin, ‘The Politicization of Place in Italy’, Political Geography, 20 (2001), 331–52; John A. Agnew,Place and Politics: The Geographical Mediation of State and Society (London: Allen and Unwin, 1987).
20 Shin, ‘The Politicization of Place in Italy’ p. 333; Michael E. Shin and John Agnew, ‘The Geography of PartyReplacement in Italy, 1987–1996’, Political Geography, 21 (2001), 221–42.
21 Such as Burden and Kimball’s application of King’s method to the investigation of ticket splitting in the 1988US elections (Burden and Kimball, ‘A New Approach to the Study of Ticket Splitting’); King, A Solution to theEcological Inference Problem.

466 B E N O I T, G I A N N E T T I A N D L A V E R
estimate unknown cells in 8 � 8 tables, and similar approaches have been applied toGermany’s multiparty system by Gschwend, Johnston and Pattie.22 In what follows,however, we employ a variant of King’s procedure extended to 2 � 3 tables, collapsingthe PR vote for each party i in each district into an observation of a vote for party i versusa vote for any other party.23 This decision not only yields the numerous advantages ofKing’s method, such as district-level estimates and confidence intervals, but also providesthe ability to incorporate covariates that will later be used to relate patterns of systematicvariation in ballot splitting to the policy configurations of candidates contesting eachsingle-member district.24
VOTER BEHAVIOUR WITH RESTRICTED CHOICE MENUS
Our characterization of Italian voter choice starts with the assumption – later to be testedempirically – that voter choice is fundamentally party based, and that voters distinguishbetween parties in terms of the relative distance between their own policy ideal points andthe perceived policy positions of parties. This is the classical spatial model of voter choicederived from Downs, extended by Enelow and Hinich, and by Hinich and Munger.25
As Dow notes, however, despite the increasing theoretical sophistication of spatialtheories of voting, spatial modelling is increasingly criticized for not having madecommensurate contributions to the empirical study of electoral competition.26 Inmultiparty electoral contexts, furthermore, spatial theory has provided even more limitedempirical insight.27 One of our key aims in what follows is to test empirically whetherItalian voters who are forced to split their tickets do so in ways consistent with the generalspatial model.
22 Ron Johnston and Charles Pattie, ‘Ecological Inference and Entropy-Maximizing: An Alternative Procedurefor Split-Ticket Voting’, Political Analysis, 8 (2000), 333–45; Thomas Gschwend, Ron Johnston and CharlesPattie, ‘Split-Ticket Patterns in Mixed-Member Proportional Election Systems: Estimates and Analyses of TheirSpatial Variation at the German Federal Election, 1998’, British Journal of Political Science, 33 (2003), 109–27.Entropy maximization would indeed offer an alternative to King’s method for estimating our main quantities ofinterest, although the properties of King’s estimates have been explored much further when used as second-stageregressors.
23 King, A Solution to the Ecological Inference Problem.24 Steven Voss, ‘Using Ecological Inference for Contextual Research: When Aggregation Bias Is the Solution
as Well as the Problem’, in Gary King, Ori Rosen and Martin Tanner, eds, Ecological Inference: NewMethodological Strategies (Cambridge: Cambridge University Press, 2004), pp. 69–96; Kenneth Benoit, DanielaGiannetti and Michael Laver, ‘Multi-Party Split-Ticket Voting Estimation as an Ecological Inference Problem’,also in King, Rosen and Tanner, eds, Ecological Inference, pp. 333–50.
25 Anthony Downs, An Economic Theory of Democracy (New York: Harper and Row, 1957); J. M. Enelowand M. Hinich, The Spatial Theory of Voting: An Introduction (New York: Cambridge University Press, 1984);J. M. Enelow and M. Hinich, eds, Advances in the Spatial Theory of Voting (New York: Cambridge UniversityPress, 1990); M. J. Hinich and M. C. Munger, Ideology and the Theory of Political Choice (Ann Arbor: Universityof Michigan Press, 1994); M. J. Hinich and M. C. Munger, Analytical Politics (New York: Cambridge UniversityPress 1997).
26 Jay K. Dow, ‘A Spatial Analysis of the 1989 Chilean Presidential Election’, Electoral Studies, 17 (1998),61–76.
27 Michael Laver and Norman Schofield, Multiparty Government (New York: Oxford University Press, 1990);T. Iversen, ‘Political Leadership and Representation in West European Democracies: A Test of Three Models ofVoting’, American Journal of Political Science, 38 (1994), 45–74; Samuel Merrill III, ‘Discriminating Betweenthe Directional and Proximity Spatial Models of Electoral Competition’, Electoral Studies, 14 (1995), 273–87;Samuel Merrill III and Bernard Grofman, A Unified Theory of Voting: Directional and Proximity Spatial Models(Cambridge: Cambridge University Press, 1999).
Voter Strategies with Restricted Choice Menus 467
The classical spatial theory of issue voting assumes that, ignoring issues ofpost-electoral government formation, voters support the party with the policy positionclosest to their ideal point. In the political context of Italian pre-electoral coalitions,this means that frustrated voters will cast their SMD ballot for a second-choicecandidate whose party’s policy position, irrespective of coalition affiliation, is closestto their own ideal point.28 This may lead them to be coalition splitters, and can beseen as essentially non-strategic behaviour in the sense that it does not take the eventualoutcome of the election into account. More strategic or ‘instrumental’ voters, bycontrast, may vote on the basis of the distance between their own ideal points and thepolicy outcomes likely to result from each candidate’s election.29 Such voters ‘usetheir vote more as an instrument to achieve preferred policy outcomes and not justto expressively voice support for one platform instead of another’.30 In the Italiancontext, this means voting in the SMD for the candidate sponsored by the pre-electoral coalition of the voter’s most-preferred party, even when the rival coalitioncandidate’s policy platform is closer to the frustrated voter’s own ideal point. This isdone in order to increase the prospects of a government that contains the mostpreferred (PR) party and is hence more likely to implement policies closest to the voter’sideal point.
More precisely, we interpret coalition sticking and coalition splitting as follows. In thePR election, all voters support the party with the policy position closest to their own idealpoints. They have no strategic incentive to do otherwise. In the plurality election, threepossible strategic situations can arise for a given voter:
1. The party in the PR election closest to the voter’s ideal point is also on offer in the SMD.Voters in this situation are satisfied. They have the chance to vote a straight party ticket.We label as ‘party stickers’ voters who exercise this option, continuing to vote for theparty with the policy position closest to their ideal point. We label as ‘party switchers’voters who for some reason choose to split their ticket and cast their SMD vote for adifferent party.
2. The party in the PR election closest to the voter’s ideal point is not on offer in theSMD; of the more limited menu on offer in the SMD, the party closest to the voter’sideal point comes from the same pre-electoral coalition as the party supported inthe PR election. Voters in this situation are frustrated. However, both the non-strategic incentive to vote for the closest party, and the strategic incentive to votefor the first-choice party’s coalition, imply voting for the coalition party on offer inthe SMD. All frustrated voters in this situation should therefore be ‘coalitionstickers’.
3. The party in the PR election closest to the voter’s ideal point is not on offer in the SMD;of the more limited menu on offer in the SMD, the party closest to the voter’s ideal pointdoes not come from the same pre-electoral coalition as the party supported in the PR
28 Hinich and Munger, Ideology and the Theory of Political Choice, p. 46.29 We are acutely aware that there are many ways to be ‘strategic’ in most choice situations, and that which
we focus on here is but one. Nonetheless, we do maintain that sticking with the coalition of your first choice party,when a party from a rival coalition is closer to your own ideal point, is ‘more strategic’ than switching coalitionsin this context.
30 Dean Lacy and Philip Paolino, ‘Downsian Voting and the Separation of Powers’, American Journal ofPolitical Science, 42 (1998), 1180–99, p. 1197; see also Kathleen Bawn, ‘The Logic of Institutional Preferences:German Electoral Law as a Social Choice Outcome’, American Journal of Political Science, 37 (1993), 965–89.
468 B E N O I T, G I A N N E T T I A N D L A V E R
election. Voters in this situation are also frustrated and, depending on the strategic logicthey bring to bear, can make one of two choices:
a. They can cast their SMD ballot for the candidate of their ‘own’ coalition – thecoalition that contains the PR party closest to the voter’s ideal point. They areexhibiting what we have called strategic behaviour in this context, in the sense thatthey are voting to get their most preferred (PR) party into government, rather thansimply voting for the party on the more restricted SMD menu that they feel closestto. Frustrated voters choosing this option will be (strategic) coalition stickers.
b. They can cast their SMD ballot for the candidate of the rival coalition, supportingthe party on offer in the SMD election that is closest to their ideal point, which willbelong to a different coalition from the party they supported in the PR election. Theyare exhibiting what we have called non-strategic behaviour since, while they aresupporting the party they most like on the more restricted SMD menu, they are ifanything harming the prospect that their most-preferred (PR) party will get intogovernment. Frustrated voters choosing this option will be (non-strategic) coalitionsplitters.
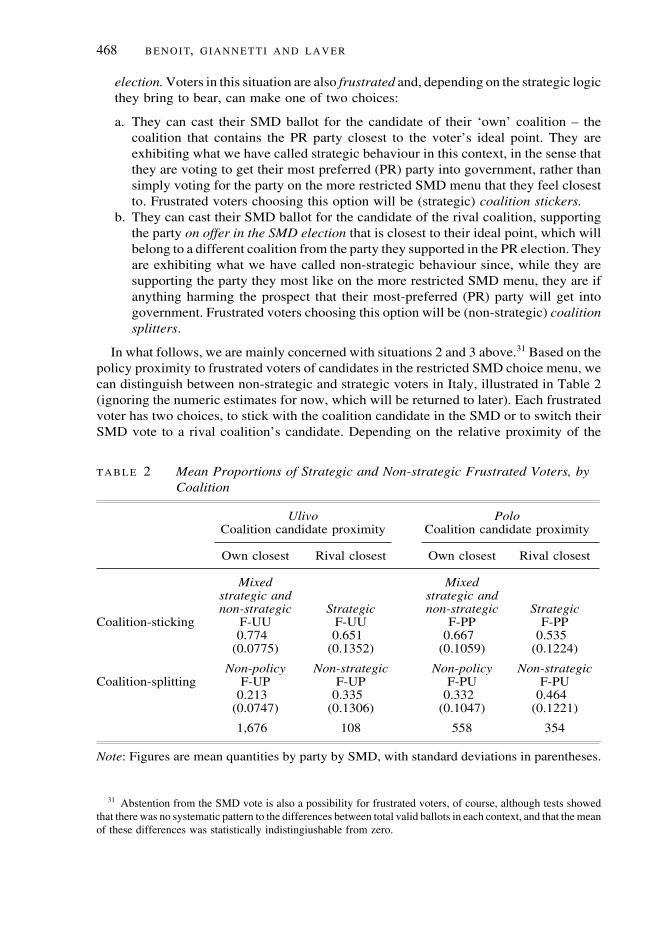
In what follows, we are mainly concerned with situations 2 and 3 above.31 Based on thepolicy proximity to frustrated voters of candidates in the restricted SMD choice menu, wecan distinguish between non-strategic and strategic voters in Italy, illustrated in Table 2(ignoring the numeric estimates for now, which will be returned to later). Each frustratedvoter has two choices, to stick with the coalition candidate in the SMD or to switch theirSMD vote to a rival coalition’s candidate. Depending on the relative proximity of the
TABLE 2 Mean Proportions of Strategic and Non-strategic Frustrated Voters, byCoalition
Ulivo PoloCoalition candidate proximity Coalition candidate proximity
Own closest Rival closest Own closest Rival closest
Mixed Mixedstrategic and strategic andnon-strategic Strategic non-strategic Strategic
Coalition-sticking F-UU F-UU F-PP F-PP0.774 0.651 0.667 0.535
(0.0775) (0.1352) (0.1059) (0.1224)
Non-policy Non-strategic Non-policy Non-strategicCoalition-splitting F-UP F-UP F-PU F-PU
0.213 0.335 0.332 0.464(0.0747) (0.1306) (0.1047) (0.1221)
1,676 108 558 354
Note: Figures are mean quantities by party by SMD, with standard deviations in parentheses.
31 Abstention from the SMD vote is also a possibility for frustrated voters, of course, although tests showedthat there was no systematic pattern to the differences between total valid ballots in each context, and that the meanof these differences was statistically indistingiushable from zero.

Voter Strategies with Restricted Choice Menus 469
coalition candidates to their own ideal points, voters will be of several types. When votersfind that the SMD candidate closest to their ideal point is from the rival coalition (Table2, second column), yet stick with the coalition of their first-choice party (first row), weconsider them to be strategic. They vote, not for the SMD candidate closest to their idealpoint, but for the coalition candidate most likely to get their first-choice party, for whichthey are denied the opportunity to vote, into government. When voters find that the SMDcandidate closest to their ideal point is from the rival coalition (second column) yet votefor that candidate anyway (second row) and become coalition splitters, we consider themnon-strategic. Such voters support the party on the restricted SMD choice menu that isclosest to their ideal point, despite the fact that the more successful this party, the lesslikely it is that their first-choice party will get into government.
It is more difficult without resorting to psychoanalysis to classify the motivations offrustrated voters finding that their own coalition candidate is the closest in the SMDelection to their ideal point. Such voters are not put in the position of having to make astrategic choice between the SMD party closest to their ideal point and the SMD party mostlikely to help their first-choice party get into government. What we can say, however, isthat, when a frustrated voter’s own coalition candidate is the closest in the SMD electionto his ideal point, yet the voter nonetheless switches SMD vote to the candidate of a rivalpre-electoral coalition, we can only assume that the SMD voting choice is not driven bypolicy concerns. Not only is the rival coalition candidate’s platform further from the voter’sideal point than his own coalition candidate’s, but supporting the rival coalition candidateincreases the chance that the government will exclude the voter’s first-choice party. Votersin this category must thus either be irrational, or be driven by non-policy concerns, suchas specific candidate characteristics or protest voting.32 If Italian voters do rationallydistinguish between parties and candidates on the basis of their policies, however, then weexpect this category to be small.33
Underpinning our model of voter choice is the assumption that the PR vote is a sincereexpression of voters’ policy preferences. In this context, note that the PR element electiondoes provide a strong incentive for voters to vote ‘sincerely’ for their most-preferredparties. Voting to increase support for a most-preferred party increases the probability thatthis party will get into government and change both policy outputs and other anticipatedpayoffs. It also increases the most-preferred party’s claim on cabinet seats should it succeedin getting into government, further increasing its impact on policy outputs and otherpayoffs. Finally, increasing a most-preferred party’s support in the PR election increasesthe party’s expectation of receiving, from the intra-coalition allocation, more SMDcandidacies in the next election, thereby increasing its chances of success in the future.
The assumption of sincere, policy-based voting in PR constituencies can be evaluatedempirically, since it has a directly observable implication for the behaviour of satisfied
32 Another possibility, of course, is that voters may have differing, possibly mistaken, perceptions of partyplatforms; or that policy preferences are multidimensional and that the choice table is more complicated than theunidimensional proximity model we implicitly assume in Figure 1. Finally, the lack of a perfect fit could be causedby measurement error, since our assumption that PR voting is sincere and that voters prefer the party whose positionis closest to their ideal points does not provide a perfect measure of voter ideal points, only the party closest tothe precise (unknown) voter ideal points.
33 We are aware that one of the parties in the ‘Other’ category, the Northern League, is more important thanothers both in terms of vote share and in terms of its strategic role in the formation of electoral coalitions. However,we also believe that this party is better understood in a two-dimensional model of Italian politics where our analysisuses more simplified one-dimensional spatial assumptions.

470 B E N O I T, G I A N N E T T I A N D L A V E R
voters, among whom we should observe almost perfect party sticking. Voters whose mostpreferred party also offers a candidate in their SMD will face strong incentives to supportthis party in the SMD election and no incentive not to do so. This will be true in allconstituencies except those where some third-party candidate is predicted to have a seriouschance of success, where we might witness the classic type of strategic voting identifiedby Cox in which electors avoid wasting votes by deserting their most-preferred candidatein favour of a less-preferred candidate with a higher chance of defeating an evenlesser-preferred rival.34 In constituencies where such incentives do not exist, however, weexpect satisfied voters to stick with the party they most preferred in the PR election. Insuch cases, the assumption that the PR vote is a sincere revelation of first preference impliesthat the rate of party splitting will be close to zero.
OPERATIONALIZING STICKING AND SPLITTING
A Partition of Voter Choice
Before the key quantities of coalition and party sticking and splitting can be estimated, wemust first define them operationally in the context of the available data and characterizethe full range of choice outcomes facing voters. Strategic options facing voters whosemost-preferred parties are coalition members can be exclusively and exhaustivelypartitioned into the choice matrix shown in Table 3. Satisfied voters either support theirPR-choice party in the SMD election (party stickers), or vote for some other SMDcandidate, either from a rival coalition or from a non-coalition party (party splitters). Welabel subsets of voters by their coalition-specific choices. For example, an S-UU partysticker is a satisfied voter (S) with a most preferred party in the Ulivo coalition, supportedin both PR and SMD elections (UU). An S-UP voter, however, is a satisfied (S) partysplitter with a most-preferred party in the Ulivo coalition, who, despite finding a candidatefrom the same party running in the SMD election, votes for a candidate from the Polocoalition (UP). Likewise, an S-PO party-splitter voter’s most-preferred party belongs to
TABLE 3 Choice Partition When Voter’s First-preference Party Belongs to aCoalition
Voter supports SMD candidate of:
Most-preferredVoter category party’s coalition Rival coalition Neither coalition
Frustrated voter COALITION COALITION COALITIONMost-preferred party STICKER SPLITTER SPLITTERhas no SMD F-UU F-UP F-UOcandidate F-PP F-PU F-PO
Satisfied voter PARTY PARTY PARTYMost-preferred party STICKER SPLITTER SPLITTERhas SMD S-UU S-UP S-UOcandidate S-PP S-PU S-PO
34 Cox, Making Votes Count, p. 72.
Voter Strategies with Restricted Choice Menus 471
the Polo coalition, but votes for a non-coalition SMD candidate despite finding the sameparty running in the SMD election.
Frustrated voters either support a candidate from the same coalition as their PR-choiceparty (coalition stickers), or vote for some other SMD candidate (coalition splitters). Thusan F-PP coalition sticker is a frustrated voter (F) with a most preferred party in the Polocoalition, who votes for a Polo candidate from some other party in the SMD election (PP).
In the 1996 Italian election, 14.6 per cent of Italian voters cast their PR ballots for partiesoutside of the Ulivo and Polo electoral coalitions. While these parties consist of a diversegroup – including regional parties, far-left parties, and a neo-fascist party – they have incommon small nationwide vote support and a rejection of the two major pre-electoralcoalition arrangements. For the simple reason of separating them from the coalitions, wehave grouped non-coalition parties into an ‘Other’ category. For those voters notsupporting a coalition party, there is a slightly different choice matrix since there wasfrequently more than one non-coalition candidate in a SMD (this happened in 160 districtsin 1996). However, we can still classify voters with a first preference for a non-coalitionparty in terms of whether they are satisfied or frustrated, and can still identify the SMDvoting strategies open to both frustrated and satisfied PR voters for non-coalition parties.Each choice category has the same interpretation as in Table 3, except that two newcategories are added, S-OO� and F-OO�, describing non-coalition voters who support twodifferent non-coalition parties – O and O� – in the PR and SMD elections.
Estimating Party Policy Positions
The data used to estimate the key quantities of interest from Table 3 are aggregate electionresults from the 1996 Italian election, measured at the SMD level. In order to assess thepolicy proximity of the coalition candidates, we also need some external measure of partypolicy positions. For this purpose we draw on estimated positions of the Italian parties onthe left–right dimension of economic policy. These measures are derived from a masssurvey carried out immediately after the 1996 elections by ISPO, one of the leadinginstitutes for the study of public opinion in Italy. We selected those survey questionsrelating to economic policy to create a measure of party positions. These left–rightmeasures provide a widely accepted uni-dimensional placement of the parties as theywould have been perceived by voters.35 While other policy dimensions have been identifiedwithin contemporary Italian politics, and are important in their own right, the left–rightscale of economic policy is widely identified as the most visible and salient dimension bywhich voters distinguish between parties.36
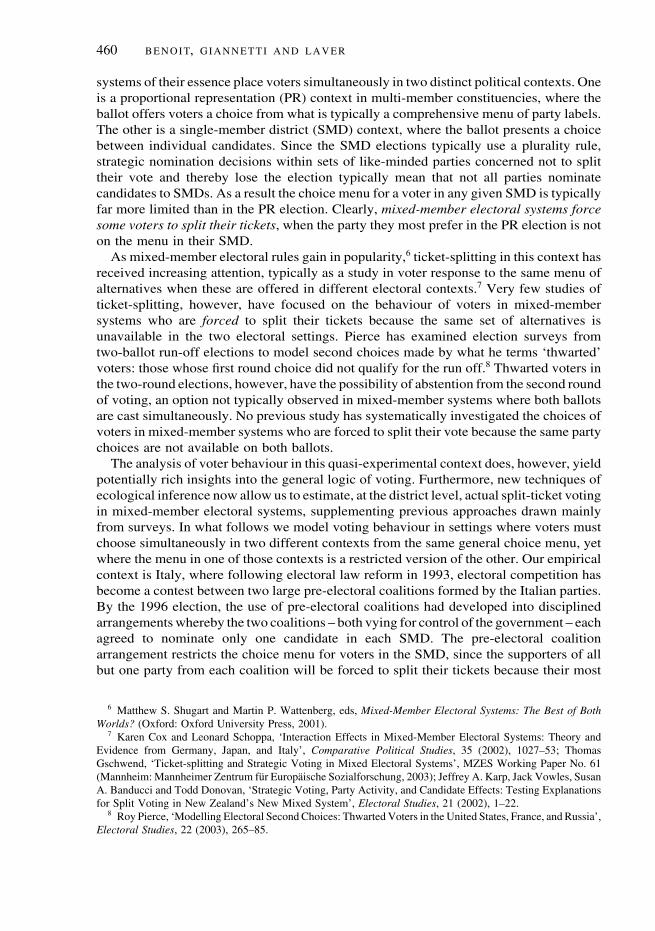
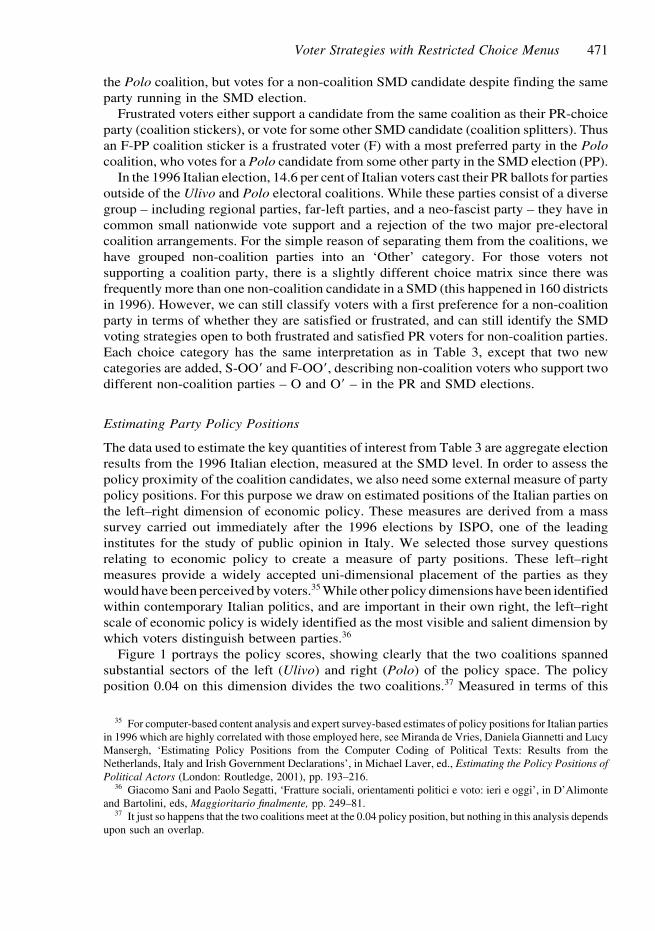
Figure 1 portrays the policy scores, showing clearly that the two coalitions spannedsubstantial sectors of the left (Ulivo) and right (Polo) of the policy space. The policyposition 0.04 on this dimension divides the two coalitions.37 Measured in terms of this
35 For computer-based content analysis and expert survey-based estimates of policy positions for Italian partiesin 1996 which are highly correlated with those employed here, see Miranda de Vries, Daniela Giannetti and LucyMansergh, ‘Estimating Policy Positions from the Computer Coding of Political Texts: Results from theNetherlands, Italy and Irish Government Declarations’, in Michael Laver, ed., Estimating the Policy Positions ofPolitical Actors (London: Routledge, 2001), pp. 193–216.
36 Giacomo Sani and Paolo Segatti, ‘Fratture sociali, orientamenti politici e voto: ieri e oggi’, in D’Alimonteand Bartolini, eds, Maggioritario finalmente, pp. 249–81.
37 It just so happens that the two coalitions meet at the 0.04 policy position, but nothing in this analysis dependsupon such an overlap.
472 B E N O I T, G I A N N E T T I A N D L A V E R
Fig. 1. Policy postions of parties from Italian electoral coalitionsNote: Scores are normalized ISPO factor scores as described in the text. Scores for non-coalition parties were notavailable.
dimension, voters to the left of this position should prefer the Ulivo coalition, and votersto the right of the line should prefer Polo. We define the inter-coalition midpoint (ICM)in each SMD as representing the point halfway between the positions of the parties of thecandidates offered by each coalition in the constituency in question. This dividing line willrepresent our partition of voters in a simple policy proximity model for each constituency.38
Non-strategic behaviour implies that frustrated voters whose ideal points are to the left ofthe ICM should vote for the Ulivo coalition candidate, and those whose ideal points areto the right of the ICM should vote for the Polo coalition candidate.
Prior Expectations
Consider first those voters whose ideal points are close to the parties near either end ofthe economic policy dimension – RC, Greens and PDS on the left, AN and Forza Italiaon the right.39 Clearly, supporters of these parties can never find themselves in the strategicdilemma forcing a choice between strategic coalition sticking and non-strategic coalitionsplitting. Such voters support their closest party in the PR election and, whatever party theircoalition puts up in the SMD election, this party will be closer to these voters’ ideal pointthan any party the rival coalition could possibly put up. We therefore expect all such votersto be coalition stickers, since strategic and non-strategic choice both imply this. Thisimplies that we should observe levels of coalition splitting among PR supporters of RC,Greens, PDS, AN and Forza Italia that are very small.
This situation is rather different, however, for voters whose ideal points are closer tothe positions of the other three parties. Supporters of the Prodi list, Lista Dini and theCCD-CDU in the PR election might well find themselves in a local strategic situation inthe SMD in which ‘their’ coalition puts up a candidate from a more extreme party, while
38 Because the party mechanism for selecting SMD candidates, furthermore, is independent of the policyposition of the rival coalition candidate, the ICM is also determined exogenously to potential coalition-splitting.
39 To see this for the PDS, note that a PDS supporter must have an ideal point to the left of the midpoint betweenthe PDS and Prodi lists ( � 0.65), placing her closer to the most left-wing Ulivo party (RC at � 1.22) than to themost left-wing Polo party (CCD-CDU at � 0.04). Strictly, there is a tiny area of potential AN support for whichthis might not be true, since the midpoint between AN and CCD-CDU is 0.610 and the midpoint between the mostright-wing Ulivo party (Lista Dini at 0.04) and the most right-wing Polo party (Forza Italia at 1.27) is 0.655. Polovoters with ideal points between 0.610 and 0.655 on this economic-policy scale would marginally preferCCD-CDU in an SMD contest between CCD-CDU and Forza Italia and have an ‘expressive’ incentive to becoalition splitters. But this zone is so small and so deeply within the realms of measurement error that we ignoreit in this context.

Voter Strategies with Restricted Choice Menus 473
the rival coalition puts up a more moderate candidate. Thus a Lista Dini PR voter in anSMD, forced to choose between an RC candidate from the Ulivo and a CCD-CDUcandidate from the Polo, could have an ideal point much closer to the CCD-CDU and wouldneed a strongly instrumental rationale to be a coalition sticker and support the RC in theSMD election. Such a voter would have a stronger non-strategic incentive to be a coalitionsplitter. This implies we expect the highest levels of coalition splitting for PR supportersof CCD-CDU and Lista Dini, with higher levels of coalition splitting for supporters of theProdi list than for the more extreme parties.
Finally, we expect the position of the inter-coalition midpoint – the policy halfway markbetween the parties of each coalition’s SMD candidates – to affect the level of coalitionsplitting. If Ulivo fields a left-wing candidate in a given SMD and the Polo fields a centristcandidate, then the ICM will be to the left of centre. There will be less incentive for coalitionsplitting by voters who supported Polo parties in the PR election and more incentive forcoalition splitting by those who supported Ulivo. The converse will be true if Ulivo fieldsa centrist candidate and the Polo fields a right-wing one – the incentives for coalitionsplitting will be with those who voted for a Polo party in the PR election. Thus we expectto find that the rate of F-UP coalition splitting will be negatively related, and the rate ofF-PU coalition-splitting positively related, to the position of the ICM in the SMD.40 In thesection that follows we estimate levels of coalition sticking and splitting and attempt toexplain variations in these rates at the district level, in order to see whether our expectationsare confirmed.
ESTIMATING POLICY MOTIVATIONS AMONG FRUSTRATED VOTERS
Overall Coalition Sticking and Coalition Switching
To measure splitting and sticking at the individual level, we use King’s technique ofecological inference.41 Our estimation is based on using the extended EI method appliedto 2 � 3 sub-tables of the full partition of voter choices described in the previous section.Working from observable marginal quantities in the voter choice table shown in Table 3,this technique allows us to estimate the unobserved cell quantities S-UU, S-PP, S-UP,S-PU, etc. Complete details of this estimation are provided in Appendix B.
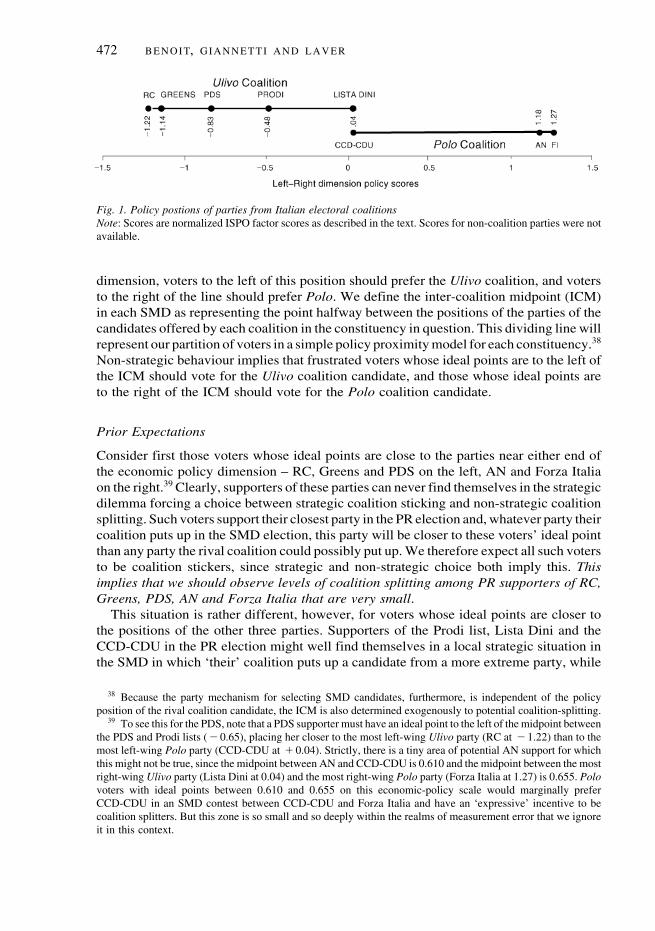
Table 4 reports estimated rates of coalition sticking and coalition splitting in the SMDelections obtained by using King’s extended EI method, aggregated from individual SMDsin a procedure that weights the averages by the number of voters. The aggregate estimatesallow us to see that there were significant levels of coalition splitting for each of the bigcoalitions. The rate of coalition splitting for those voting for a Polo candidate in the PRelection (F-PU) was nearly twice as high (at 35 per cent) as the rate of coalition-splitting(21 per cent) for frustrated Ulivo voters (F-UP). This relative inability on the part of thePolo coalition to hold on in the SMD elections to voters who voted for Polo candidatesin the PR election would have been a significant source of weakness for Polo in the electionas a whole.
Patterns in coalition splitting involving non-coalition candidates are also striking. First,frustrated voters for coalition PR candidates almost never switched their support tonon-coalition candidates (F-UO and F-PO) in the SMD election. Coalition splitting in this
40 Operationally, a higher score means a more right-wing ICM.41 King, A Solution to the Ecological Inference Problem.
474 B E N O I T, G I A N N E T T I A N D L A V E R
TABLE 4 Aggregate Estimates of Coalition Sticking andSplitting in SMDs for Frustrated Voters
PointQuantity estimate s.e. N
UlivoF-UU (Coalition-sticker) 0.78 0.012 1,784F-UP (Coalition-splitter) 0.21 0.011 1,784F-UO (Coalition-splitter) 0.01 0.000 1,784
PoloF-PP (Coalition-sticker) 0.65 0.012 912F-PU (Coalition-splitter) 0.35 0.012 912F-PO (Coalition-splitter) 0.00 0.000 912
Non-CoalitionF-OO� (Coalition-sticker) 0.03 0.001 1,356F-OU (Coalition-splitter) 0.49 0.013 1,356F-OP (Coalition-splitter) 0.48 0.013 1,356
Note: For estimation details, see Appendix B.
context almost invariably took place between the two big coalitions. Secondly, frustratednon-coalition voters almost invariably become ‘coalition’ splitters. If the non-coalitionparty they supported in the PR election was not available in the SMD, then they only rarelyvoted for another non-coalition party in the SMD (F-OO�). Most switched to a candidatefrom one of the big coalitions (F-OU and F-OP). We regard this result as entirely plausiblegiven the ideological diversity of non-coalition parties – generally either extreme ororiented towards specific policy or regional interests – who consequently have little mutualattraction for supporters.
Coalition Splitting and Policy Proximity
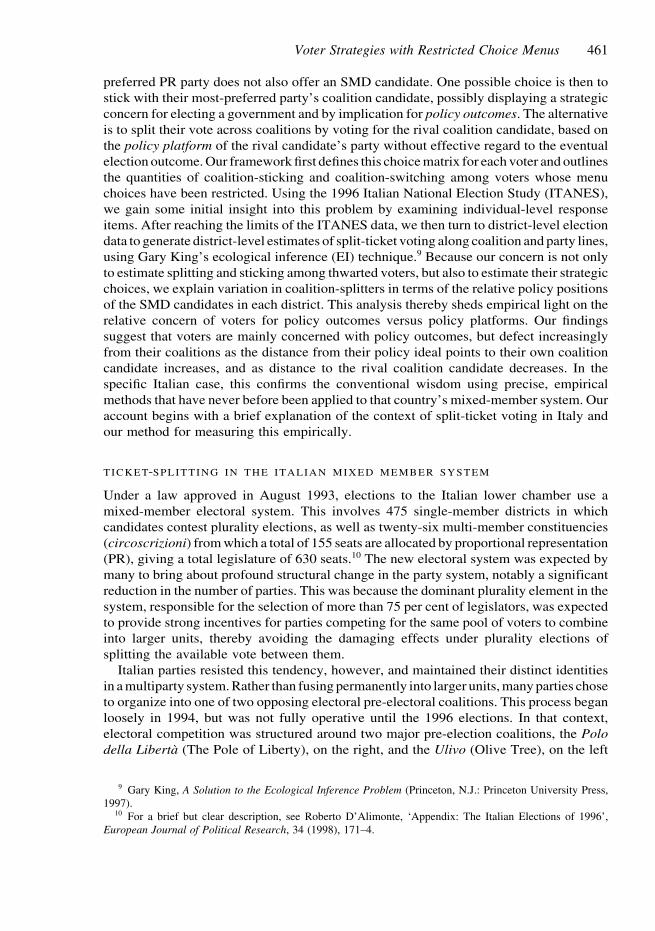
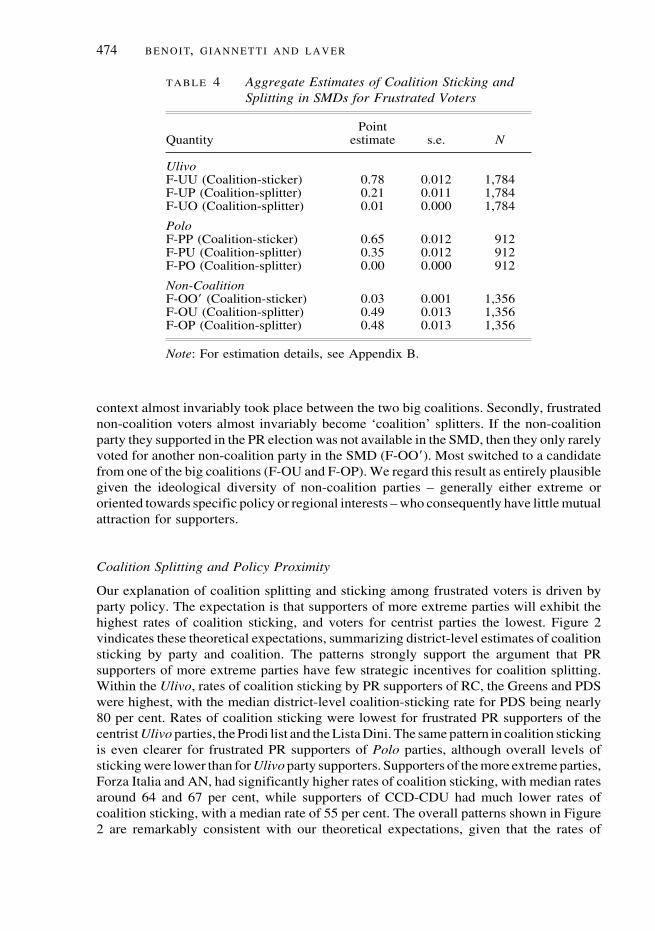
Our explanation of coalition splitting and sticking among frustrated voters is driven byparty policy. The expectation is that supporters of more extreme parties will exhibit thehighest rates of coalition sticking, and voters for centrist parties the lowest. Figure 2vindicates these theoretical expectations, summarizing district-level estimates of coalitionsticking by party and coalition. The patterns strongly support the argument that PRsupporters of more extreme parties have few strategic incentives for coalition splitting.Within the Ulivo, rates of coalition sticking by PR supporters of RC, the Greens and PDSwere highest, with the median district-level coalition-sticking rate for PDS being nearly80 per cent. Rates of coalition sticking were lowest for frustrated PR supporters of thecentrist Ulivo parties, the Prodi list and the Lista Dini. The same pattern in coalition stickingis even clearer for frustrated PR supporters of Polo parties, although overall levels ofsticking were lower than for Ulivo party supporters. Supporters of the more extreme parties,Forza Italia and AN, had significantly higher rates of coalition sticking, with median ratesaround 64 and 67 per cent, while supporters of CCD-CDU had much lower rates ofcoalition sticking, with a median rate of 55 per cent. The overall patterns shown in Figure2 are remarkably consistent with our theoretical expectations, given that the rates of

Voter Strategies with Restricted Choice Menus 475
Fig. 2. Coalition-sticking among frustrated voters by party and coalitionNote: Outside values have been excluded.
coalition sticking among different groups of party supporters were ranked in almostprecisely the same order as the ‘extremity’ of the policy position of the party in question.
Taking this analysis further, we now use the ICM to classify frustrated voters from eachcoalition into those whose own coalition candidate’s policy position is closest, and thosefor whom the rival coalition’s candidate is closest. Returning to the numeric quantities inTable 2, we have presented the mean estimates of coalition-sticking (F-UU and F-PP) andcoalition-switching (F-UP and F-PU) for each party in each district, classified by coalitioncandidate proximity. The totals at the bottom of each column refer to how many parties,from all SMDs, found their voters in this situation.
The estimates in Table 2 strongly confirm expectations. First, levels of coalition stickingfor both coalitions are substantially higher – about 77 per cent as opposed to 65 per centfor Ulivo and 67 per cent as opposed to 54 per cent for Polo – among voters whose owncoalition candidate’s policy position was closest as opposed to those for whom the rivalcoalition candidate’s position was closest. Secondly, the proportion of voters we havecharacterized as ‘strategic’ coalition stickers is higher for Ulivo (65 per cent) than for Polo(54 per cent), implying that frustrated Ulivo voters acted more instrumentally in the SMDsto get ‘their’ party’s coalition into power. This greater degree of coalition cohesion isclearly consistent with Ulivo’s eventual victory in the elections. Finally, there is anon-negligible amount of apparently non-policy coalition splitting among frustratedvoters. These are the voters whose own coalition candidate is closest to their own idealpoint, but who switch coalitions nonetheless. (Such voting behaviour could be generically

476 B E N O I T, G I A N N E T T I A N D L A V E R
thought of as reflecting non-policy candidate preferences.) About a fifth (0.213) of UlivoPR voters whose own coalition candidate was closest to their own ideal point nonethelessvoted in the SMD for a candidate from a rival coalition. About a third (0.332) of those whovoted for Polo in the PR election fell into this category.
Policy Proximity as a Stochastic Effect
A more precise way to use relative policy positions to explain variations in voter responsesto the local strategic situation involves a probabilistic model of switching and splitting.This approach treats the degree of non-strategic coalition splitting as a random variablewhose variation across districts is influenced by the relative distance between a frustratedvoter’s most preferred party’s policy position, and the relative policy positions of the twocoalition candidates actually on offer. This moves beyond the simple dichotomouscategorization of voters in the previous subsection. The implication is that, when a voter’sown coalition candidate is relatively far away in policy terms, and the rival coalitioncandidate is relatively close, the psychological ‘cost’ of strategic behaviour (voting for aparty that is relatively disliked when a party that is relatively liked is on offer) is higher,increasing the temptation to vote non-strategically for the most preferred candidate on therestricted SMD choice menu.
To estimate the relative influence of policy on coalition sticking and coalition splitting,we use weighted least-squares regression to estimate the effect of changes in the ICM onthe switching and splitting quantities F-UU, F-UP, F-PP and so on. While recognizingpotential limitations in relation to both estimation technique and measurement error, wenonetheless feel that the finding of a theoretically consistent, significant relationship willprovide strong evidence of a relationship between policy and vote choice among frustratedvoters. We also feel that our approach represents the best available methodological option,given our substantive lack of firm knowledge about coalition splitting patterns in Italy aswell the methodological limitations of using EI estimates in second-stage regressions.42
Table 5 presents the results of the second-stage regressions, weighted by the standarderrors from the EI estimation. We expect coalition splitting by frustrated Ulivo supporters(F-UP) to decrease, and by Polo supporters (F-PU) to increase, as the position of the ICMmoves rightwards (and its scale position thus increases). Conversely, coalition sticking byfrustrated Ulivo supporters (F-UU), and by frustrated Polo supporters (F-PP), should movein the opposite direction. From the coefficient estimates on the ICM variable in the columnsheaded F-UU and F-PP, we see that this is in fact precisely what happens. As the ICM shifts
42 The practice of using quantities estimated from EI as dependent variables in second-stage regressions isknown in the methodological literature as ‘EI-R’. We are aware of and have tried to follow carefully theprescriptions of the most recent methodological literature on ‘EI-R’, using King’s EI estimates as dependentvariables in second-stage regressions. First, we do not include as independent variables in EI-R any quantities notoriginally included as covariates in the first-stage EI estimation. This directly follows the advice of ChristopherAdolph, Gary King, Michael C. Herron and Kenneth W. Shotts, ‘A Consensus on Second Stage Analyses inEcological Inference Models’, Political Analysis, 11 (2003), 86–94. Secondly, we employ weighted least squares(WLS) using the estimated EI standard errors as weights, as recommended by Adolph et al. Finally, we conductedthe specification test for inconsistency described in Michael C. Herron and Kenneth W. Schotts, ‘LogicalInconsistency in EI-Based Second-Stage Regressions’, American Journal of Political Science, 48 (2004) 172–83.Our analysis passes the Herron and Schotts test, which does not necessarily indicate consistency, but fails anattempt to detect it. We recognize limitations in our approach but the robustness of our estimates across a varietyof specifications, as well as our best attempt to address the methdological concerns associated with EI-R, lead usto believe our estimates are valid.
Voter Strategies with Restricted Choice Menus 477
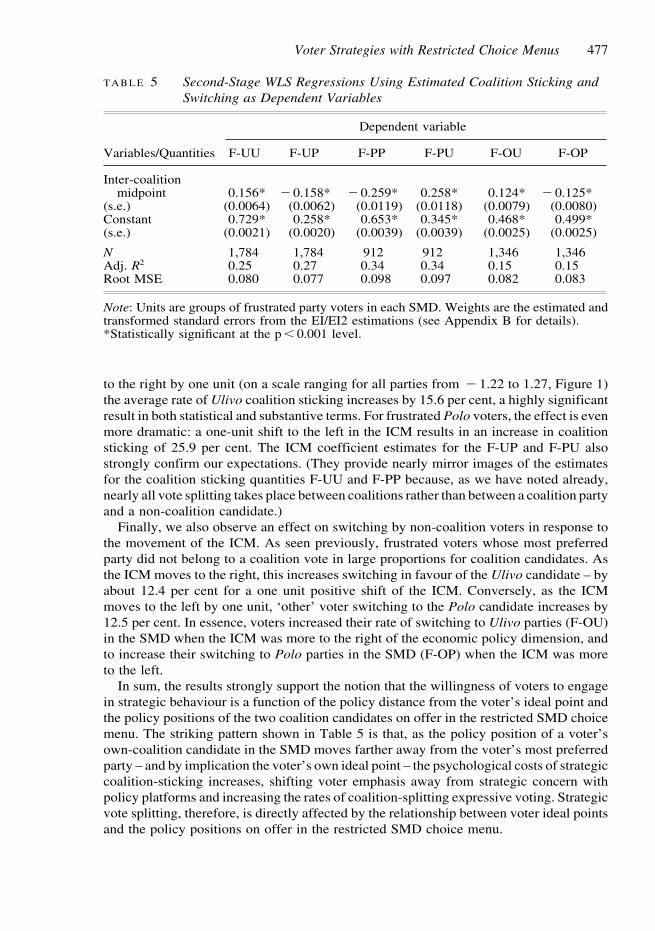
TABLE 5 Second-Stage WLS Regressions Using Estimated Coalition Sticking andSwitching as Dependent Variables
Dependent variable
Variables/Quantities F-UU F-UP F-PP F-PU F-OU F-OP
Inter-coalitionmidpoint 0.156* � 0.158* � 0.259* 0.258* 0.124* � 0.125*
(s.e.) (0.0064) (0.0062) (0.0119) (0.0118) (0.0079) (0.0080)Constant 0.729* 0.258* 0.653* 0.345* 0.468* 0.499*(s.e.) (0.0021) (0.0020) (0.0039) (0.0039) (0.0025) (0.0025)
N 1,784 1,784 912 912 1,346 1,346Adj. R2 0.25 0.27 0.34 0.34 0.15 0.15Root MSE 0.080 0.077 0.098 0.097 0.082 0.083
Note: Units are groups of frustrated party voters in each SMD. Weights are the estimated andtransformed standard errors from the EI/EI2 estimations (see Appendix B for details).*Statistically significant at the p � 0.001 level.
to the right by one unit (on a scale ranging for all parties from � 1.22 to 1.27, Figure 1)the average rate of Ulivo coalition sticking increases by 15.6 per cent, a highly significantresult in both statistical and substantive terms. For frustrated Polo voters, the effect is evenmore dramatic: a one-unit shift to the left in the ICM results in an increase in coalitionsticking of 25.9 per cent. The ICM coefficient estimates for the F-UP and F-PU alsostrongly confirm our expectations. (They provide nearly mirror images of the estimatesfor the coalition sticking quantities F-UU and F-PP because, as we have noted already,nearly all vote splitting takes place between coalitions rather than between a coalition partyand a non-coalition candidate.)
Finally, we also observe an effect on switching by non-coalition voters in response tothe movement of the ICM. As seen previously, frustrated voters whose most preferredparty did not belong to a coalition vote in large proportions for coalition candidates. Asthe ICM moves to the right, this increases switching in favour of the Ulivo candidate – byabout 12.4 per cent for a one unit positive shift of the ICM. Conversely, as the ICMmoves to the left by one unit, ‘other’ voter switching to the Polo candidate increases by12.5 per cent. In essence, voters increased their rate of switching to Ulivo parties (F-OU)in the SMD when the ICM was more to the right of the economic policy dimension, andto increase their switching to Polo parties in the SMD (F-OP) when the ICM was moreto the left.
In sum, the results strongly support the notion that the willingness of voters to engagein strategic behaviour is a function of the policy distance from the voter’s ideal point andthe policy positions of the two coalition candidates on offer in the restricted SMD choicemenu. The striking pattern shown in Table 5 is that, as the policy position of a voter’sown-coalition candidate in the SMD moves farther away from the voter’s most preferredparty – and by implication the voter’s own ideal point – the psychological costs of strategiccoalition-sticking increases, shifting voter emphasis away from strategic concern withpolicy platforms and increasing the rates of coalition-splitting expressive voting. Strategicvote splitting, therefore, is directly affected by the relationship between voter ideal pointsand the policy positions on offer in the restricted SMD choice menu.
478 B E N O I T, G I A N N E T T I A N D L A V E R
VOTING PATTERNS AMONG ‘SATISFIED’ VOTERS
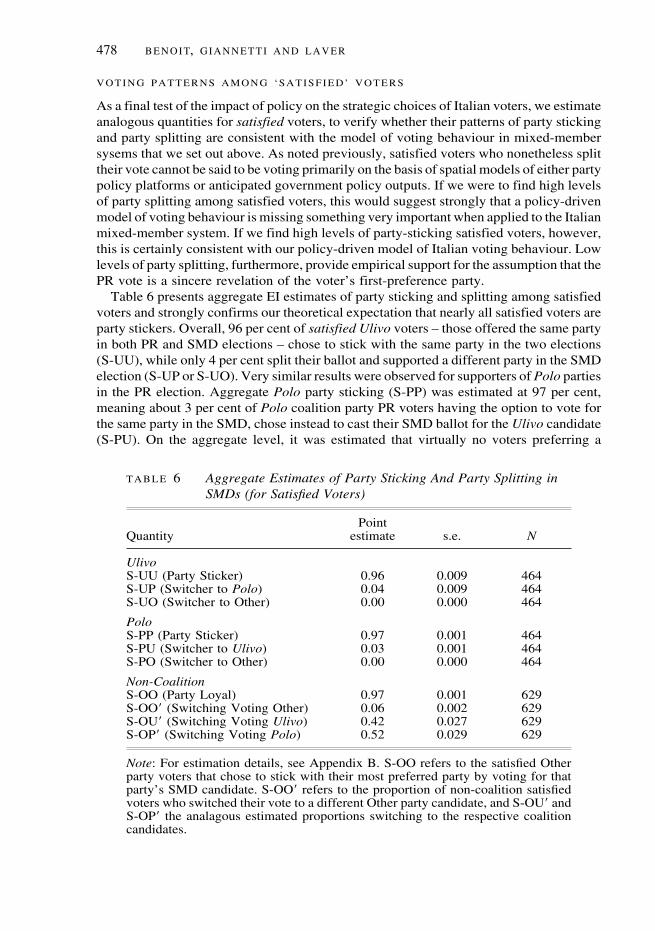
As a final test of the impact of policy on the strategic choices of Italian voters, we estimateanalogous quantities for satisfied voters, to verify whether their patterns of party stickingand party splitting are consistent with the model of voting behaviour in mixed-membersysems that we set out above. As noted previously, satisfied voters who nonetheless splittheir vote cannot be said to be voting primarily on the basis of spatial models of either partypolicy platforms or anticipated government policy outputs. If we were to find high levelsof party splitting among satisfied voters, this would suggest strongly that a policy-drivenmodel of voting behaviour is missing something very important when applied to the Italianmixed-member system. If we find high levels of party-sticking satisfied voters, however,this is certainly consistent with our policy-driven model of Italian voting behaviour. Lowlevels of party splitting, furthermore, provide empirical support for the assumption that thePR vote is a sincere revelation of the voter’s first-preference party.
Table 6 presents aggregate EI estimates of party sticking and splitting among satisfiedvoters and strongly confirms our theoretical expectation that nearly all satisfied voters areparty stickers. Overall, 96 per cent of satisfied Ulivo voters – those offered the same partyin both PR and SMD elections – chose to stick with the same party in the two elections(S-UU), while only 4 per cent split their ballot and supported a different party in the SMDelection (S-UP or S-UO). Very similar results were observed for supporters of Polo partiesin the PR election. Aggregate Polo party sticking (S-PP) was estimated at 97 per cent,meaning about 3 per cent of Polo coalition party PR voters having the option to vote forthe same party in the SMD, chose instead to cast their SMD ballot for the Ulivo candidate(S-PU). On the aggregate level, it was estimated that virtually no voters preferring a
TABLE 6 Aggregate Estimates of Party Sticking And Party Splitting inSMDs (for Satisfied Voters)
PointQuantity estimate s.e. N
UlivoS-UU (Party Sticker) 0.96 0.009 464S-UP (Switcher to Polo) 0.04 0.009 464S-UO (Switcher to Other) 0.00 0.000 464
PoloS-PP (Party Sticker) 0.97 0.001 464S-PU (Switcher to Ulivo) 0.03 0.001 464S-PO (Switcher to Other) 0.00 0.000 464
Non-CoalitionS-OO (Party Loyal) 0.97 0.001 629S-OO� (Switching Voting Other) 0.06 0.002 629S-OU� (Switching Voting Ulivo) 0.42 0.027 629S-OP� (Switching Voting Polo) 0.52 0.029 629
Note: For estimation details, see Appendix B. S-OO refers to the satisfied Otherparty voters that chose to stick with their most preferred party by voting for thatparty’s SMD candidate. S-OO� refers to the proportion of non-coalition satisfiedvoters who switched their vote to a different Other party candidate, and S-OU� andS-OP� the analagous estimated proportions switching to the respective coalitioncandidates.
Voter Strategies with Restricted Choice Menus 479
coalition party split their vote by supporting a non-coalition candidate (S-UO or S-PO),when a candidate from their most-preferred party was available in the SMD. Similarestimates for non-coalition voters also indicate an extremely high level of party stickingamong non-coalition satisfied voters. Approximately 97 per cent of voters most preferringa non-coalition party also voted for that party’s SMD candidate. Among the 3 per cent whosplit their vote by choosing another party, all but 6 per cent voted for coalition candidates,with slightly more switching their vote to a Polo candidate than to an Ulivo candidate.
Our theoretical expectation of party sticking by satisfied voters is overwhelminglysupported by the estimated voting patterns, buttressing our contention that a voter’s PRvote can be taken as a sincere revelation of preference. Furthermore, the rates of partysticking were virtually the same between Ulivo, Polo and non-coalition voters, althoughsome variation was observed at the district level and between parties (not shown). In thoselocal situations in which it is possible for them to do so, we conclude that satisfied voterstend overwhelmingly to stick in the plurality election with the party they supported in thePR election, suggesting at the very least a highly structured pattern of voting choice amongItalian voters, and being entirely consistent with the model we have set out in this article.
CONCLUSIONS
The policy distance between a frustrated voter’s PR party and the policy positions ofavailable candidates in the restricted SMD choice menu influences whether they‘strategically’ stick with their coalition – thereby enhancing the chance that theirfirst-choice party will get into government – or switch to the rival coalition – thereby voting‘non-strategically’ for the SMD candidate whose policies they prefer. Estimated at thedistrict level, our evidence shows that voter strategy under restricted menu choice dependsnot only on policy proximity, according to the classical spatial model, but also on the policyoutcomes associated with the restricted menu choice. Voters in each district, our findingsindicate, combined primarily strategic and policy non-strategic motivations, with therelative levels varying according to coalition and to party. Furthermore, our results showcritically that strategic coalition-sticking is strongly influenced by the closeness of afrustrated voter’s ideal point and the policy platform of the coalition candidate to besupported under strategic coalition sticking. When such strategic behaviour involvesvoting for a candidate who is much farther away in policy terms than the most preferredalternative on the restricted SMD choice menu, then frustrated voters are much more likelyto become coalition switchers, and thereby vote ‘non-strategically’, presumably becauseof the higher costs associated with choosing a strategic policy vote versus a sincere policyvote. The evidence seems to fit the classical Downsian characterization of a voter who does‘not merely compare platforms [but] instead must estimate in his own mind what the partieswould actually do were they in power’.43 When the perceived policy costs of a strategiccoalition-switching vote are too great for a frustrated voter, that voter is more likely torevert to comparing platforms and vote according to policy proximity. Although thecontext is quite different, our research suggests interesting extensions to research on Lacyand Paolino’s finding that presidential vote choice may be influenced more by concernswith outcomes such as policy balancing than by direct preferences for policy platforms.44
The technique may also be capable of being deployed to throw empirical light on debate
43 Downs, An Economic Theory of Democracy.44 Lacy and Paolino, ‘Downsian Voting and the Separation of Powers’.

480 B E N O I T, G I A N N E T T I A N D L A V E R
between those assuming classical Downsian ‘proximity’ voting and those assuming‘directional’ voting, under which a voter supports parties advocating policies on the same‘side’ of the status quo as s/he is.45
The high rates of ‘strategic’ coalition sticking also confirm the importance ofpre-electoral coalition politics in Italy, organizing voters to vote instrumentally even whenthe temptation to switch coalitions, given the particular candidates on offer in the SMD,is compelling. Pre-electoral coalitions organize the vote in SMDs and offer choicesbetween alternative government coalitions, but preferences for parties continue tocharacterize voter preferences. In the 1996 election that we have analysed, for instance,our results confirm the observation of Bartolini that the defeat of the centre-right Polocoalition was caused by its incapacity to control its ‘peripheral fringe’. Polo coalitionvoters, writes Bartolini, felt ‘less pressure to rally against the centre-left and morewillingness, therefore, to split their votes when unhappy about the centre-right candidatethey find in their district’.46 Our results have added precise empirical support to thisobservation and added considerable new insight into the problem, showing that not onlyinternal policy coherence, but also the policy distance between coalition candidates inSMDs, affects rates of coalition sticking among frustrated voters. The substantiveimplication for Italian politics is to suggest that an improved strategy for candidatenomination by coalitions in the single-member districts would be to take into account notjust the position of their own candidates, but also their positions relative to those of therival coalition. Furthermore, the firm evidence is that Italian voters – at least those withrestricted menu choice – engage in voting based on policy proximity, adding a newdimension to knowledge about the Italian voter.47 Finally, our separation of satisfied andfrustrated voters – distinguishing those with the option to split their tickets from those whoare forced to do so – suggests that nearly all of the ticket splitting in the Italianmixed-member system comes from pre-electoral coalition arrangements and that, when notforced to do so, Italian voters tend not to split their tickets. This is a aspect of ticket splittingin the Italian context that has not been previously explored.
As an exercise in estimating individual voter transition rates from aggregate data, ourinvestigation of Italian split-ticket voting also offers a new type of application of King’sEI model. As King points out, however, there is ultimately no solution to the ecologicalinference problem, and estimates are still only estimates.48 Our estimates of policyinstrumental and policy expressive voting are not free from these limitations, despite theirnumerous advantages over other methods of estimating rates of split-ticket voting. First,we have collapsed the multi-dimensional table in each district into two rows, a necessary
45 See, for example, George Rabinowitz and Stuart Elaine Macdonald, ‘A Directional Theory of Issue Voting’,American Political Science Review, 83 (1989), 93–121; and Merrill and Grofman, A Unified Theory of Issue Voting.The application of our method to directional voting in the Italian context would, however, require significant newand ‘hard to test’ assumptions about voter perceptions of the status quo under a mixed-member system with partycoalitions and coalition governments.
46 Stefano Bartolini, ‘The Political Consequences of the Italian Mixed Electoral System (1994–2001)’ (paperpresented at the Conference on Elections and Democracy, Social Science Institute (ICS), University of Lisbon,February 2002).
47 Italian voting behaviour has frequently been considered to be based on non-rational or party-loyalmotivations. See Chiaramonte Alessandro, ‘L’effetto mancato della riforma maggioritaria: il voto strategico’, inRoberto D’Alimonte and Stefano Bartolini, eds, Maggioritario per caso (Bologna: Il Mulino, 1997).
48 King, A Solution to the Ecological Inference Problem.
Voter Strategies with Restricted Choice Menus 481
but not optimal choice given cell interdependencies and other possible interactive effects.49
Future work in multiparty contexts would be well served by the ability to estimateunobserved cell quantities in fully R � C tables. Future work applying ecological inferenceto the study of ticket splitting might also consider testing for spatial auto-correlationeffects, perhaps using geographically-weighted regression,50 since our examination –similar to the majority of political science work in electoral studies – has not dealt directlywith potential problems of spatial dependence. Our estimation has also relied heavily onseveral key assumptions to parameterize the ticket splitting in a manner that can beestimated, although we have attempted to justify these empirically – as in the case of sincerePR voting – whenever possible. Our measurement of vote ideal points is also a generalbenchmark that is hardly free from error in specific cases, both for voters and at the districtlevel for assuming that all candidates in all constituencies and districts have positionsidentical to their party’s. Finally, Italian politics is more highly dimensional than can befully represented by a single economic policy scale. Yet we would expect all of theselimitations to result in the lack of significant findings, rather than producing such clear androbust results as we have found in our analysis. Our strong findings, consistent with boththeoretical expectations and a plausible explanation as to why Ulivo won the 1996 election,indicate convincingly that, despite the imperfections of our estimation procedures, therelationships we have measured do in fact characterize Italian voting behaviour.
Finally, while our results are of interest in the context of Italian elections, the methodand type of analysis we set out here clearly have broader applications. The EI method forlarger tables we have used here can be applied to other mixed-member elections in Italyand elsewhere. Furthermore, every democratic country has elections to more than one tierof representation, whether local, regional, national or supranational. These situations willput the same voters in different strategic contexts for the different elections, possibly heldsimultaneously.51 Furthermore, political arrangements also frequently restrict voter choicein other national contexts, as with the mixed-member systems in Lithuania and Hungary,and in two-round systems such as in Hungary and France, where parties agree to withdraweligible candidates from run-off contests. Here, we have presented a framework for settingout the different strategic choices facing voters in such situations and have demonstratedhow to estimate the key quantities from observed voting behaviour using ecologicalinference techniques, allowing actual election data to provide a direct link betweenstrategic context and individual-level voting behaviour.
49 King, A Solution to the Ecological Inference Problem; Ori Rosen, Wenxin Jiang, Gary King and Martin A.Tanner, ‘Bayesian and Frequentist Inference for Ecological Inference: The R � C Case’, Statistica Neerlandica,55 (2001), 134–56.
50 For instance, see Ernesto Calvo and Marcelo Escolar, ‘The Local Voter: A Geographically WeightedApproach to Ecological Inference’, American Journal of Political Science, 47 (2003), 189–204.
51 Non-simultaneous elections add a large additional level of complexity, not addressed here, which arises fromthe need to deal with turnover in the set of voters.
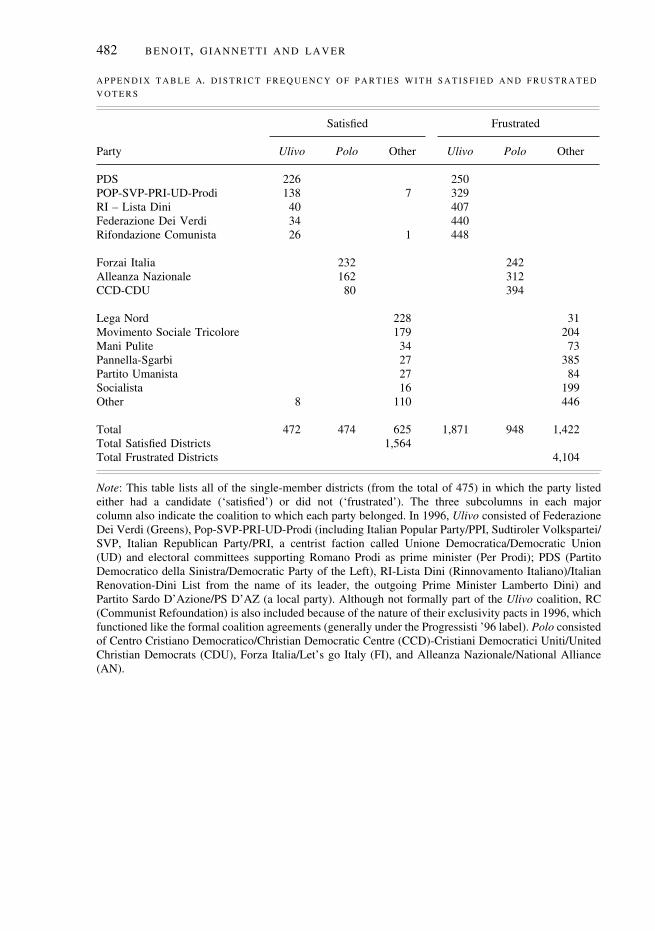
482 B E N O I T, G I A N N E T T I A N D L A V E R
A P P E N D I X T A B L E A. D I S T R I C T F R E Q U E N C Y O F P A R T I E S W I T H S A T I S F I E D A N D F R U S T R A T E D
V O T E R S
Satisfied Frustrated
Party Ulivo Polo Other Ulivo Polo Other
PDS 226 250POP-SVP-PRI-UD-Prodi 138 7 329RI – Lista Dini 40 407Federazione Dei Verdi 34 440Rifondazione Comunista 26 1 448
Forzai Italia 232 242Alleanza Nazionale 162 312CCD-CDU 80 394
Lega Nord 228 31Movimento Sociale Tricolore 179 204Mani Pulite 34 73Pannella-Sgarbi 27 385Partito Umanista 27 84Socialista 16 199Other 8 110 446
Total 472 474 625 1,871 948 1,422Total Satisfied Districts 1,564Total Frustrated Districts 4,104
Note: This table lists all of the single-member districts (from the total of 475) in which the party listedeither had a candidate (‘satisfied’) or did not (‘frustrated’). The three subcolumns in each majorcolumn also indicate the coalition to which each party belonged. In 1996, Ulivo consisted of FederazioneDei Verdi (Greens), Pop-SVP-PRI-UD-Prodi (including Italian Popular Party/PPI, Sudtiroler Volkspartei/SVP, Italian Republican Party/PRI, a centrist faction called Unione Democratica/Democratic Union(UD) and electoral committees supporting Romano Prodi as prime minister (Per Prodi); PDS (PartitoDemocratico della Sinistra/Democratic Party of the Left), RI-Lista Dini (Rinnovamento Italiano)/ItalianRenovation-Dini List from the name of its leader, the outgoing Prime Minister Lamberto Dini) andPartito Sardo D’Azione/PS D’AZ (a local party). Although not formally part of the Ulivo coalition, RC(Communist Refoundation) is also included because of the nature of their exclusivity pacts in 1996, whichfunctioned like the formal coalition agreements (generally under the Progressisti ’96 label). Polo consistedof Centro Cristiano Democratico/Christian Democratic Centre (CCD)-Cristiani Democratici Uniti/UnitedChristian Democrats (CDU), Forza Italia/Let’s go Italy (FI), and Alleanza Nazionale/National Alliance(AN).
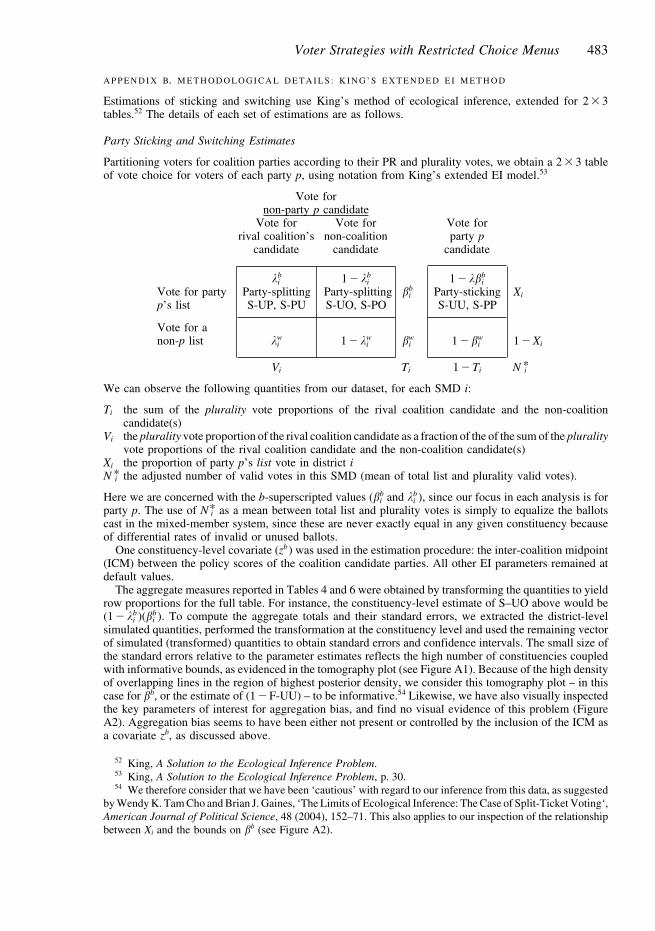
Voter Strategies with Restricted Choice Menus 483
A P P E N D I X B. M E T H O D O L O G I C A L D E T A I L S : K I N G ’ S E X T E N D E D E I M E T H O D
Estimations of sticking and switching use King’s method of ecological inference, extended for 2 � 3tables.52 The details of each set of estimations are as follows.
Party Sticking and Switching Estimates
Partitioning voters for coalition parties according to their PR and plurality votes, we obtain a 2 � 3 tableof vote choice for voters of each party p, using notation from King’s extended EI model.53
Vote fornon-party p candidate
Vote for Vote for Vote forrival coalition’s non-coalition party p
candidate candidate candidate
�bi 1 � �b
i 1 � ��bi
Vote for party Party-splitting Party-splitting �bi Party-sticking Xi
p’s list S-UP, S-PU S-UO, S-PO S-UU, S-PP
Vote for anon-p list �w
i 1 � �wi �w
i 1 � �wi 1 � Xi
Vi Ti 1 � Ti N *i
We can observe the following quantities from our dataset, for each SMD i:
Ti the sum of the plurality vote proportions of the rival coalition candidate and the non-coalitioncandidate(s)
Vi the plurality vote proportion of the rival coalition candidate as a fraction of the of the sum of the pluralityvote proportions of the rival coalition candidate and the non-coalition candidate(s)
Xi the proportion of party p’s list vote in district iN *i the adjusted number of valid votes in this SMD (mean of total list and plurality valid votes).
Here we are concerned with the b-superscripted values (�bi and �b
i ), since our focus in each analysis is forparty p. The use of N*i as a mean between total list and plurality votes is simply to equalize the ballotscast in the mixed-member system, since these are never exactly equal in any given constituency becauseof differential rates of invalid or unused ballots.
One constituency-level covariate (zb) was used in the estimation procedure: the inter-coalition midpoint(ICM) between the policy scores of the coalition candidate parties. All other EI parameters remained atdefault values.
The aggregate measures reported in Tables 4 and 6 were obtained by transforming the quantities to yieldrow proportions for the full table. For instance, the constituency-level estimate of S–UO above would be(1 � �b
i )(�bi ). To compute the aggregate totals and their standard errors, we extracted the district-level
simulated quantities, performed the transformation at the constituency level and used the remaining vectorof simulated (transformed) quantities to obtain standard errors and confidence intervals. The small size ofthe standard errors relative to the parameter estimates reflects the high number of constituencies coupledwith informative bounds, as evidenced in the tomography plot (see Figure A1). Because of the high densityof overlapping lines in the region of highest posterior density, we consider this tomography plot – in thiscase for �b, or the estimate of (1 � F-UU) – to be informative.54 Likewise, we have also visually inspectedthe key parameters of interest for aggregation bias, and find no visual evidence of this problem (FigureA2). Aggregation bias seems to have been either not present or controlled by the inclusion of the ICM asa covariate zb, as discussed above.
52 King, A Solution to the Ecological Inference Problem.53 King, A Solution to the Ecological Inference Problem, p. 30.54 We therefore consider that we have been ‘cautious’ with regard to our inference from this data, as suggested
by Wendy K. Tam Cho and Brian J. Gaines, ‘The Limits of Ecological Inference: The Case of Split-Ticket Voting‘,American Journal of Political Science, 48 (2004), 152–71. This also applies to our inspection of the relationshipbetween Xi and the bounds on �b (see Figure A2).

484 B E N O I T, G I A N N E T T I A N D L A V E R
Fig. A1. Tomography plot of �b versus �w (Ulivo coalition)Note: Circles represent mean posterior contours. In an ‘informative’ tomography plot, the tomography lines willintersect at the region of highest posterior density.
Fig. A2. Plot of Xi by the bounds on �b (Ulivo coalition)Note: A systematic relationship between Xi and the �b bounds – not evident in this plot – would indicate the presenceof aggregation bias.
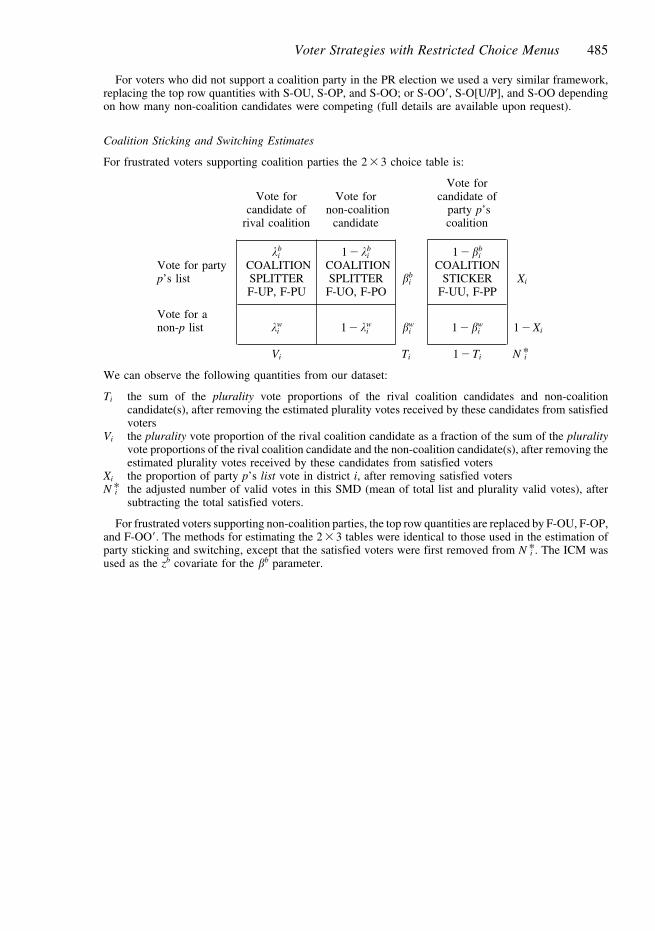
Voter Strategies with Restricted Choice Menus 485
For voters who did not support a coalition party in the PR election we used a very similar framework,replacing the top row quantities with S-OU, S-OP, and S-OO; or S-OO�, S-O[U/P], and S-OO dependingon how many non-coalition candidates were competing (full details are available upon request).
Coalition Sticking and Switching Estimates
For frustrated voters supporting coalition parties the 2 � 3 choice table is:
Vote forVote for Vote for candidate of
candidate of non-coalition party p’srival coalition candidate coalition
�bi 1 � �b
i 1 � �bi
Vote for party COALITION COALITION COALITIONp’s list SPLITTER SPLITTER �b
i STICKER Xi
F-UP, F-PU F-UO, F-PO F-UU, F-PP
Vote for anon-p list �w
i 1 � �wi �w
i 1 � �wi 1 � Xi
Vi Ti 1 � Ti N *i
We can observe the following quantities from our dataset:
Ti the sum of the plurality vote proportions of the rival coalition candidates and non-coalitioncandidate(s), after removing the estimated plurality votes received by these candidates from satisfiedvoters
Vi the plurality vote proportion of the rival coalition candidate as a fraction of the sum of the pluralityvote proportions of the rival coalition candidate and the non-coalition candidate(s), after removing theestimated plurality votes received by these candidates from satisfied voters
Xi the proportion of party p’s list vote in district i, after removing satisfied votersN *i the adjusted number of valid votes in this SMD (mean of total list and plurality valid votes), after
subtracting the total satisfied voters.
For frustrated voters supporting non-coalition parties, the top row quantities are replaced by F-OU, F-OP,and F-OO�. The methods for estimating the 2 � 3 tables were identical to those used in the estimation ofparty sticking and switching, except that the satisfied voters were first removed from N *i . The ICM wasused as the zb covariate for the �b parameter.
