vortex shedding from a ground tracking radar antenna · pdf filevortex shedding from a ground...
TRANSCRIPT
Progress in Computational Fluid Dynamics, Vol. 00, Nos. 0/0, 200x
Copyright © 2011 Inderscience Enterprises Ltd.
Vortex Shedding from a Ground Tracking Radar Antenna and 3D Tip Flow Characteristics
Cengiz Camci* Turbomachinery Aero-Heat Transfer Laboratory, The Pennsylvania State University, 223 Hammond Building, University Park, PA 16802, USA E-mail: [email protected] *Corresponding author
Baris Gumusel Turbomachinery Aero-Heat Transfer Laboratory, The Pennsylvania State University, 51A Hammond Building, University Park, PA 16802, USA E-mail: [email protected] Abstract: High-speed ground tracking radar systems rotating at about 60 rpm are currently being implemented as modern air traffic control systems in airports. The flow induced vibration and noise generation of the newly developed radar antennas are the two serious problems that jeopardize the successful deployment of the new ground based aircraft tracking systems. This paper deals with the viscous flow details of the highly three-dimensional antenna tip section and the vortex shedding characteristics at Re=426,000. The current analysis uses a 3D computational approach for the computation of viscous flow details around a highly 3 D tip geometry. A 2D unsteady computation of the vortex shedding phenomena is also presented. This paper is a continuation of the computational study dealing with the determination of aerodynamic drag coefficients on ASDE-X (Advanced Surface Detection Equipment) antenna previously presented in (Gumusel and Camci, 2010). Keywords: CFD, Vortex Shedding, ASDE-X antenna, tip flow, unsteady flow visualizations
Reference to this paper should be made as follows: Camci, C. and Gumusel, B. (2011) “Vortex Shedding from an Airport Ground Tracking Radar Antenna and 3D Tip Flow Characteristics”, Progress in Computational Fluid Dynamics, Vol. 00, Nos. 0/0, pp.000±000.
Biographical notes: C. Camci is currently a Professor of Aerospace Engineering at the Pennsylvania State University. He obtained his doctoral degree from the von Karman Institute for Fluid Dynamics, Belgium in 1985. He directed research in the Turbomachinery Aero-heat Transfer Laboratory at Penn State since 1986. He teaches theory of turbomachinery, fluid dynamics, turbulent flow, aerospace propulsion, propulsion systems for un-inhabited air vehicles and finite element methods in fluid dynamics and heat transfer. He is a member of AIAA, AHS and ASEE. C.Camci is a fellow of the ASME, American Society of Mechanical Engineers.
B. Gumusel received a BSc Degree and a MSc Degree in Mechanical Engineering from Istanbul Technical University. He obtained his doctoral degree at the Department of Aerospace Engineering at the Pennsylvania State University. His doctoral research included axial gas turbine casing region flow and heat transfer characteristics. He is currently employed as a senior research engineer at TUSAS/TEI, Eskisehir, Turkey.
1
C.CAMCI AND B.GUMUSEL
1 INTRODUCTION
Strong spatial variations of the static pressure field and the velocity vector exists near the tip section of an ASDE-X antenna. Vortex shedding from the antenna cross section is also observed during the antenna operation. Although the aerodynamic shape design of the specific antenna cross section is critical in obtaining an antenna operation with minimal drag, the current observations indicate a severe fluid structure interaction during the rotation of the antenna. This interaction combined with continuous vortex shedding may produce extreme vibration of the antenna and its foundation. Studying the unsteady flow character around an ASDE-X antenna is essential for the vibration free and safe operation of the antenna head. The current paper summarizes the findings of a 3D computational viscous flow study performed near the flat tip section of the antenna head. The simulations are obtained using the computer code Fluent 6.0 on high quality grids that are a mix of block-structured and un-structured grids. Details of the computational approach and incompressible Reynolds Averaged Navier-Stokes equations used in this study are explained in (Gumusel et al., 2006.a) and (Gumusel and Camci, 2010). A two-equation turbulence model based on k-epsilon RNG Re-normalization Group model described in (Yakhot and Orszag, 1986) is used in all calculations.
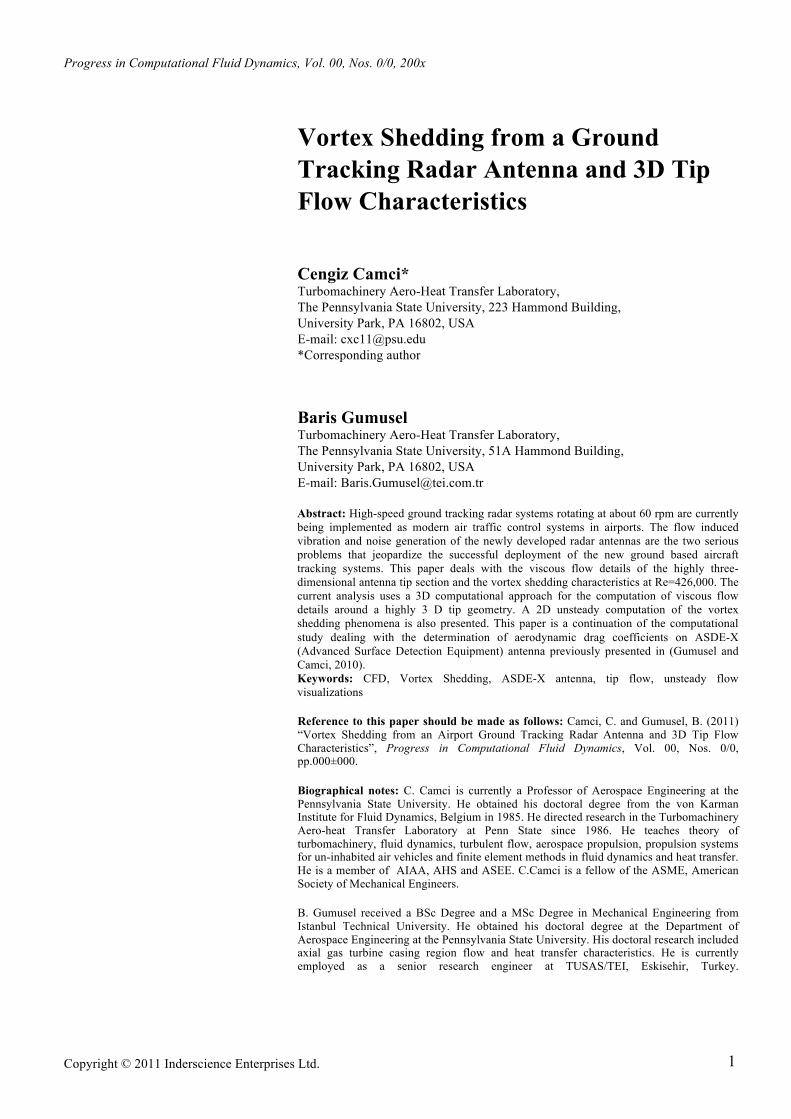
2 GRID SYSTEM Figure 1 shows the general features of the three dimensional un-structured grid system used for the computation of the complex flow around the ASDE-X cross section. This effort forms the initial phase of our on-going efforts that will eventually include the influence of rotation on the near antenna flow structure. The three-dimensional computational visualizations are performed in an
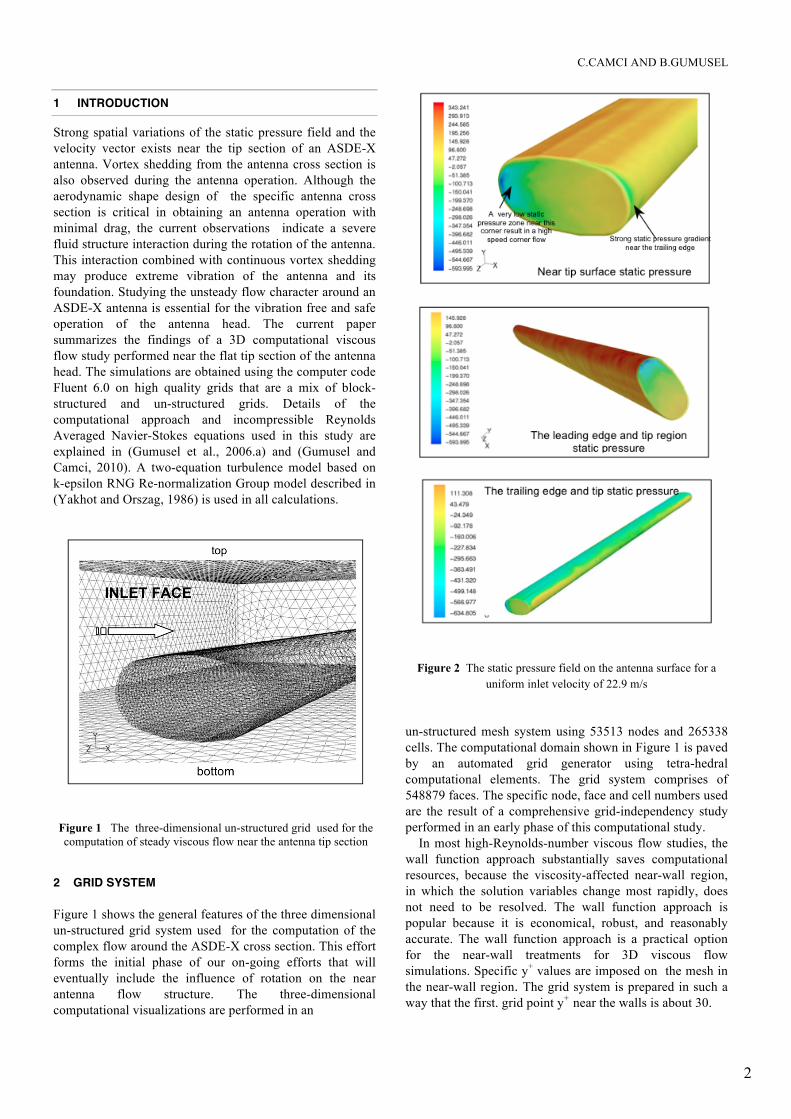
Figure 2 The static pressure field on the antenna surface for a
uniform inlet velocity of 22.9 m/s un-structured mesh system using 53513 nodes and 265338 cells. The computational domain shown in Figure 1 is paved by an automated grid generator using tetra-hedral computational elements. The grid system comprises of 548879 faces. The specific node, face and cell numbers used are the result of a comprehensive grid-independency study performed in an early phase of this computational study. In most high-Reynolds-number viscous flow studies, the wall function approach substantially saves computational resources, because the viscosity-affected near-wall region, in which the solution variables change most rapidly, does not need to be resolved. The wall function approach is popular because it is economical, robust, and reasonably accurate. The wall function approach is a practical option for the near-wall treatments for 3D viscous flow simulations. Specific y+ values are imposed on the mesh in the near-wall region. The grid system is prepared in such a way that the first. grid point y+ near the walls is about 30.
Figure 1 The three-dimensional un-structured grid used for the computation of steady viscous flow near the antenna tip section
2
Vortex Shedding from a Ground Tracking Radar Antenna and its 3D Tip Flow Characteristics
3 BOUNDARY CONDITIONS The inlet free stream velocity was set to be 22.9 m/s uniform along the height of the inlet face of the grid system shown in Figure 1. This translation velocity corresponds to the tip section (ω.r) linear speed of the rotating antenna at 60 rotations per minute. No antenna rotation is imposed in the current study. The top, bottom, left and right faces of the rectangular computational domain shown in Figure 1 are selected as “no-stress” boundaries so that the boundary layer blockage effects from a no-slip condition are avoided in the domain. Exit surface of the computational domain is treated as an “outflow” type boundary condition where all streamwise gradients are suppressed. 4 THREE DIMENSIONAL FLOW PREDICTION Figure 2 shows the total pressure in N/m2 on the antenna surfaces. Since a no-slip condition is used on the surfaces of the antenna, the total pressure and static pressure is the same on the antenna surface. An interesting flow feature is the highly three-dimensional structure of the flow near the tip section of the antenna. There is a small low static pressure zone near the leading edge of the flat tip surface where strong acceleration of flow around this corner is expected. The trailing side of the flat tip also shows strong static pressure gradients near the corner line of the flat tip. The local static pressure gradients in the tip zone are usually responsible from tip vortex formation on regular lifting airfoil shapes. For the case of the antenna where the cross section is symmetrical with respect to rotational plane, highly three-dimensional tip flows with significant total pressure deficit result in. The tip flows as shown in Figure 2 with high aerodynamic loss regions are expected to have a more significant operational impact when the antenna is rotated. A chopping of the highly three-dimensional and unsteady tip flow fluid and the wake fluid by the antenna itself can present a severe flow induced vibration problem. The chopping of the tip and wake fluid can happen twice per revolution especially when cross-winds or other three-dimensional flows around the antenna are present. The total pressure on the antenna surface and in the horizontal flow plane aligned with the inlet flow direction is shown in Figure 3. The wake region is clearly marked by green and yellow zones where significant momentum deficit is apparent. Although the zones near the tip sections show highly 3D behavior, the central areas of the antenna away from the tips (about two chords away) present an almost 2D static pressure distribution. The green wake zones near both tip zones are narrower when compared to the mid section of the antenna. The green-yellow zone in Figure 4 is also an indicator of a highly re-circulatory flow with significant unsteady flow content. Figure 5 shows the magnitude of the velocity vector in the highly three-dimensional tip region. Dark blue antenna surface
corresponds to a no-slip boundary condition imposed. Severe acceleration near the leading edge corner of the tipzone and the interaction of the high speed fluid and low
Figure 3 Total pressure on the antenna and in a horizontal flow plane aligned with inlet flow direction in (N/m2)
Figure 4 Total pressure in a vertical flow plane in N/m2
Figure 5 Magnitude of velocity near the tip region in (m/s) momentum fluid of the antenna wake region (trailing edge) are clearly indicated in Figure 5. Velocity magnitude variations near the tip region may become much more significant under the influence of cross-winds and rotation.
3

C.CAMCI AND B.GUMUSEL
The velocity vectors in the horizontal plane passing from the symmetry line of the antenna cross section are shown in Figure 6. The corner flows near the leading edge portion of the tip are visualized. The trailing edge corner of the tip surface is also a highly 3D flow zone where strong aerodynamic losses exist. The velocity vectors in the horizontal plane passing from the symmetry line of the antenna cross section are shown in Figure 6. The corner flows near the leading edge portion of the tip are visualized. The trailing edge corner of the tip surface is also a highly 3D flow zone where strong aerodynamic losses exist. The observed strong 3D flow patterns around the tip surface suggest that special tip region profiling may reduce the unsteady loads on the antenna tip region. The weakening of the tip region vortical structures may result in important reductions in the antenna unsteady forces mechanically exciting the support structure.
2 UNSTEADY FLOW SIMULATIONS OF VORTEX SHEDDING A 2D unsteady and incompressible solution of the Navier-Stokes equations for ASDE-X antenna was performed using the general purpose fluid dynamics solver Fluent 6.0. A second order implicit unsteady formulation was used to improve the computational accuracy. A time step of 0.002 second was used during unsteady computations. This time step corresponded to about 19 divisions for just one period of the antenna vortex shedding
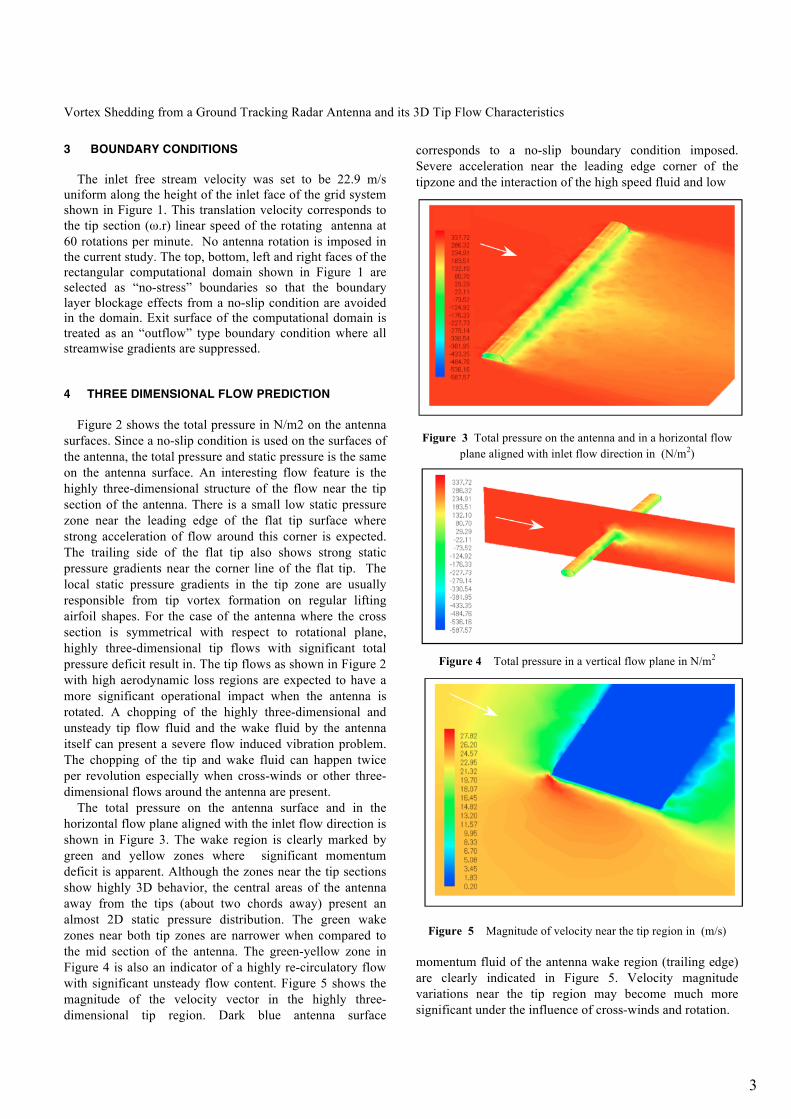
process. The computed time period of the self-sustained oscillations for the antenna problem was about 0.038 seconds at Re=426,000, (f=26.3 Hz). The present unsteady vortex shedding simulations are obtained by solving the two-dimensional laminar unsteady flow equations. Accuracy of the 2D unsteady flow calculations are assessed by solving a cylinder in cross flow configuration. The current unsteady simulation results from a cylinder of d=0.1 m are compared to a set of Strouhal number data shown in Figure 7 that includes measured St data from (Schlichting, 1979). Other sets of measured vortex shedding data around circular cylinders are also available in references from (Strouhal,1878), (von Karman and Rubach,1912), (Relf and Simmons,1924), (Novak,1975), (Heinemann et. al, 1976), (Cox et al., 1998) The two plus signs in Figure 7 are the present computed Strouhal numbers (St=fd/U) at Re=100 and Re=426,000. The validation computations are compared against the measured vortex shedding frequencies obtained from cylinders of various diameters in the same experimental set-up. The computed data shows very good agreement with the experimental results. The dissipative effects in unsteady calculations can be reduced by turning off the turbulence production term associated with the turbulent model as discussed in (Abdul Raheem and Babu, 2004) and (Khorrami et al., 2004). The removal of excessive damping introduced through turbulence production terms allows the boundary layer fluid to amplify into large-scale structures and to permit vortex
Figure 6 The velocity vectors near the tip section of the ASDE-X antenna. (Horizontal plane)
4

Vortex Shedding from a Ground Tracking Radar Antenna and its 3D Tip Flow Characteristics
Figure 7 Validation of unsteady flow computations using cylinder in cross flow data from [8]
Re=100, computed Strouhal number = fd/U = 0.164, Re=426,000, computed Strouhal number = fd/U = 0.228
merging. It is likely that, at the point of separation the cylinder (or antenna) boundary layer is likely to be laminar. These observations from the past literature is the main justification for the current laminar flow computations for the antenna cross section. In such wall bounded shear flows, the flow-field is determined by more instability of the shear layer than by turbulence effects. It seems that the simulation of the unsteady evolution of these vortices shedding into a typical von Karman street should not be controlled by the eddy viscosity designed for fully turbulent flow. Although the re-circulatory flow behind the cylinder in the wall enclosed area may not be truly laminar, it is not fully turbulent neither. The flow field character of the re-circulatory flow in this region is discussed in detail by (Abdul Raheem and Babu, 2004) and (Khorrami et al., 2002). Based on their suggestions, it can be concluded that the wall bounded flow behind the cylinder is a highly
unsteady and quasi-laminar flow. The current study uses laminar flow equations to predict vortex shedding frequencies behind the cylinder (or antenna) following the arguments persented in this paragraph. An unstructured two-dimensional grid comprising of 16364 grid points and 32435 faces was obtained using a paving strategy. A relatively coarse grid with four sided plane quadrilaterals as shown in Figure 8 was sufficient to capture the self-sustained oscillations of the wake behind the antenna cross section. The implementation of a coarse grid was consistent with the idea that the computational simulation of an unsteady vortex shedding process is driven by instability of the wall bounded flow separating from the antenna surface rather than the turbulence effects. Figure 9 shows the computed unsteady variation of vertical velocity component V at a point in the wake of the antenna cross section. After about t=0.325 second from the start of the the numerical computation the velocity oscillations driven by vortex shedding reach a constant frequency of f=26.3 Hz for Re=426,000. This frequency corresponds to a Strouhal number of St=f.H/U=0.312 which is slightly higher than the value obtained for a circular cylinder (0.228) with the same computational approach. Figure 10 shows the streamline pattern in the wake of the antenna cross-section at t=1.006 seconds. A von Karman vortex street is clearly visible in the computational domain. The pairing process with a larger re-circulatory area leaving the antenna from the aft body and a brand new vortex formation from the lower part of the antenna is also shown in Figure 10. The vortex shedding from the antenna has a very orderly mixing capability that organizes fluid in red areas with high and green/blue flow zones with low momentum. The unsteady computational results organized in the form of a movie show the time sequence of the vortex shedding process in the wake of the antenna in Movie 1. The local color is an indication of the magnitude of the local velocity
Figure 8 Un-structured 2D grid for unsteady calculations
5
C.CAMCI AND B.GUMUSEL
Figure 9 The computed unsteady variation of vertical velocity
component V in the wake of the antenna cross section vector. The low momentum fluid trapped just behind the aft portion of the antenna is ejected into the wake with strong unsteady velocity components in cross-stream direction in a pairing process. Highly re-circulatory green/blue low momentum areas in the wake travel together with red zones that are originally located on the top and bottom accelerating flow sections of the antenna. This self-sustained oscillatory flow character is very clear in Movie 1.
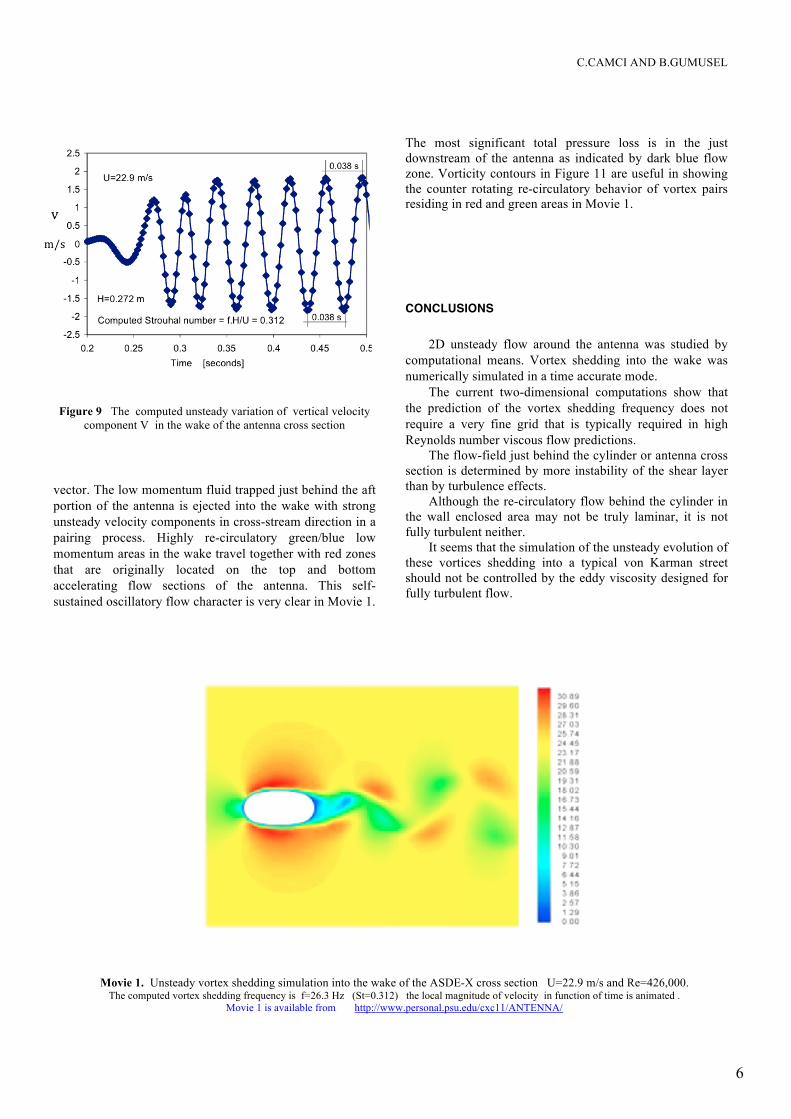
The most significant total pressure loss is in the just downstream of the antenna as indicated by dark blue flow zone. Vorticity contours in Figure 11 are useful in showing the counter rotating re-circulatory behavior of vortex pairs residing in red and green areas in Movie 1.
CONCLUSIONS 2D unsteady flow around the antenna was studied by computational means. Vortex shedding into the wake was numerically simulated in a time accurate mode. The current two-dimensional computations show that the prediction of the vortex shedding frequency does not require a very fine grid that is typically required in high Reynolds number viscous flow predictions. The flow-field just behind the cylinder or antenna cross section is determined by more instability of the shear layer than by turbulence effects. Although the re-circulatory flow behind the cylinder in the wall enclosed area may not be truly laminar, it is not fully turbulent neither. It seems that the simulation of the unsteady evolution of these vortices shedding into a typical von Karman street should not be controlled by the eddy viscosity designed for fully turbulent flow.
Movie 1. Unsteady vortex shedding simulation into the wake of the ASDE-X cross section U=22.9 m/s and Re=426,000. The computed vortex shedding frequency is f=26.3 Hz (St=0.312) the local magnitude of velocity in function of time is animated .
Movie 1 is available from http://www.personal.psu.edu/cxc11/ANTENNA/
6

Vortex Shedding from a Ground Tracking Radar Antenna and its 3D Tip Flow Characteristics
Figure 10 The streamlines around the ASDE-X antenna and the unsteady vortex street
A laminar unsteady computation on a coarse mesh is usually sufficient to capture the vortex shedding frequency and the time-wise development of the vortices shed from the antenna. Validation computations run at Re=100 and Re=426,000 around “a cylinder in cross flow” resulted in computational results that are in very good agreement with published experimental Strouhal number results. The vortex shedding frequency of the ASDE-X antenna tip is about 26 Hz corresponding to a Strouhal number of St=f.H/U=0.31. Slight variation of St is expected when one moves from the tip to hub section. The vertical velocity component in the wake of the antenna varies in time between –2.5 m/s to + 2.5 m/s on the average. A time accurate movie of vortex shedding into the wake of the ASDE-X cross section shows the spatial and temporal variations of the unsteady wake resulting from the original antenna. The current computational results confirm that the fluid-structure interaction near the radar antenna can reach levels that may disturb the complete antenna foundation and the drive system. This interaction is expected to be severe especially when cross winds and three-dimensional flows are dominant near the antenna system. It is recommended that the severe antenna vibration problem that is observed in windy days could be effectively studied by performing a complete three-dimensional fluid-structure interaction computation of the antenna and its support structure.
Figure 11 Contours of unsteady total pressure and vorticity magnitude at t=1.006 second
7
C.CAMCI AND B.GUMUSEL
REFERENCES Abdul Raheem, S. and Babu, V., (2004), “Numerical Simulation of
Unsteady Flows in Solid Rocket Motors,” AIAA paper 2004-2878.
Cox, J.S., Brentner, K.S. and Rumsey, C.L., (1998), “Computation of Vortex Shedding and Radiated Sound for a Circular Cylinder: Subcritical to Transcritical Reynolds Numbers,” Theoretical and Computational Fluid Dynamics, Springer Verlag, Vol.12, pp. 233-253.
Gumusel, B. and Camci, C., (2010), "Computational Shape Design of a Radar Antenna Used for Airport Ground Traffic Control," in Progress in Computational Fluid Dynamics, Vol.10, No.1, 2010, pp: 32-39, Inderscience Publications.
Gumusel,B.,Kavurmacioglu, L., Camci,C.,(2006.a), “Aerodynamic Drag Characteristics and Shape Design of a Radar Antenna Used for Airport Ground Traffic Control,” Proceedings of the the Eleventh International Symposium on Transport Phenomena and Dynamics of Rotating Machinery, ISROMAC-11.
Gumusel, B., Kavurmacioglu, L., Camci, C. , (2006.b), "3D Tip Flow Characteristics and Vortex Shedding from a Radar Antenna used for Airport Ground Traffic Control," Proceedings of the Eleventh International Symposium on Transport Phenomena and Dynamics of Rotating Machinery ISROMAC-11.
Heinemann, H.J., Lawaczeck, O. and Butefisch, K.A., (1976), “ Karman Vortices and their Frequency Determination in the Wakes of Profiles in the Sub and Transonic regime,” AGARD Conference Proceedings, No.177, Unsteady Phenomena in Turbomachinery,
Khorrami, M., Singer, B., Lockard, D., (2002), “Time Accurate Simulation and Acoustic Analysis of Slat Free Shear Layer, Part 2,” AIAA paper 2002-2579.
Novak, I., (1975), “Strouhal Number of Bodies and Their Systems, “ (in Russian), Strojnicky Casopis, 26, pp. 72-89.
Relf, E.F., and Simmons, L.F.G., (1924), “The Frequencies of Eddies Generated by the Motion of Circular Cylinders through a Fluid,” ARC RM 917, London.
Strouhal, V., (1878), “Uber eine Besondere Art der Tonerregung.” Ann. Phys. und Chemie, New Series, 5, pp. 216-251.
Schlichting, H., (1979), “Boundary Layer Theory,” Seventh Ed. Mc-Graw Hill, New York.
von Karman, T. and Rubach, H., (1912), “Uber den Mechanismus des Flussihkeits und Luftwiderstandes,” Phys. Z. Vol.13, pp. 49-59.
Yakhot, V. and Orszag, S.A. (1986), " Renormalization Group Analysis of Turbulence,", J. Sci. Comput. 1, 3.
8