volvo car group/media/files/v/volvo-cars-ir/... · 2 of 28 volvo car group interim report fourth...
TRANSCRIPT

Volvo Car GROUPInterim report FOURTH quarter and full year 2017

2 OF 28
VOLVO CAR GROUP
INTERIM REPORT FOURTH QUARTER AND FULL YEAR 2017VOLVO CAR AB (PUBL.) (556810–8988) INTERIM REPORT FOURTH QUARTER AND FULL YEAR 2017, GOTHENBURG FEBRUARY 7TH 2018
FOURTH QUARTER
• Retail sales increased by 2.0 per cent to
158,105 (155,003) units
• Net revenue increased by 11.3 per cent to
MSEK 61,662 (55,383)
• Operating income (EBIT) increased by
7.8 per cent to MSEK 3,616 (3,355)
• Net income increased by 26.1 per cent to
MSEK 2,963 (2,349)
• Cash flow from operating and investing
activities at MSEK 3,703 (8,769)
• Initial investment in Polestar
• MEUR 500 raised via a new bond issue
• New framework agreement with Uber announced
• 30 per cent of shares in LYNK & CO acquired
• Volvo Cars was ranked the number one employer
of choice by Universum
FULL YEAR
• Retail sales increased by 7.0 per cent to
571,577 (534,332) units
• Net revenue increased by 16.6 per cent to
MSEK 210,912 (180,902)
• Operating income (EBIT) increased by
27.7 per cent to MSEK 14,061 (11,014)
• Net income increased by 37.1 per cent to
MSEK 10,225 (7,460)
• Cash flow from operating and investing
activities at MSEK -3,800 (6,515)
• Electrification strategy announced
• Full SUV line up launched and put into production
• New subscription service Care by Volvo launched
• New Volvo Cars and Geely collaborations
announced; GV Tech, LYNK & CO and Polestar
• Further investments in US operations announced
3 OF 28
VOLVO CAR GROUP
INTERIM REPORT FOURTH QUARTER AND FULL YEAR 2017
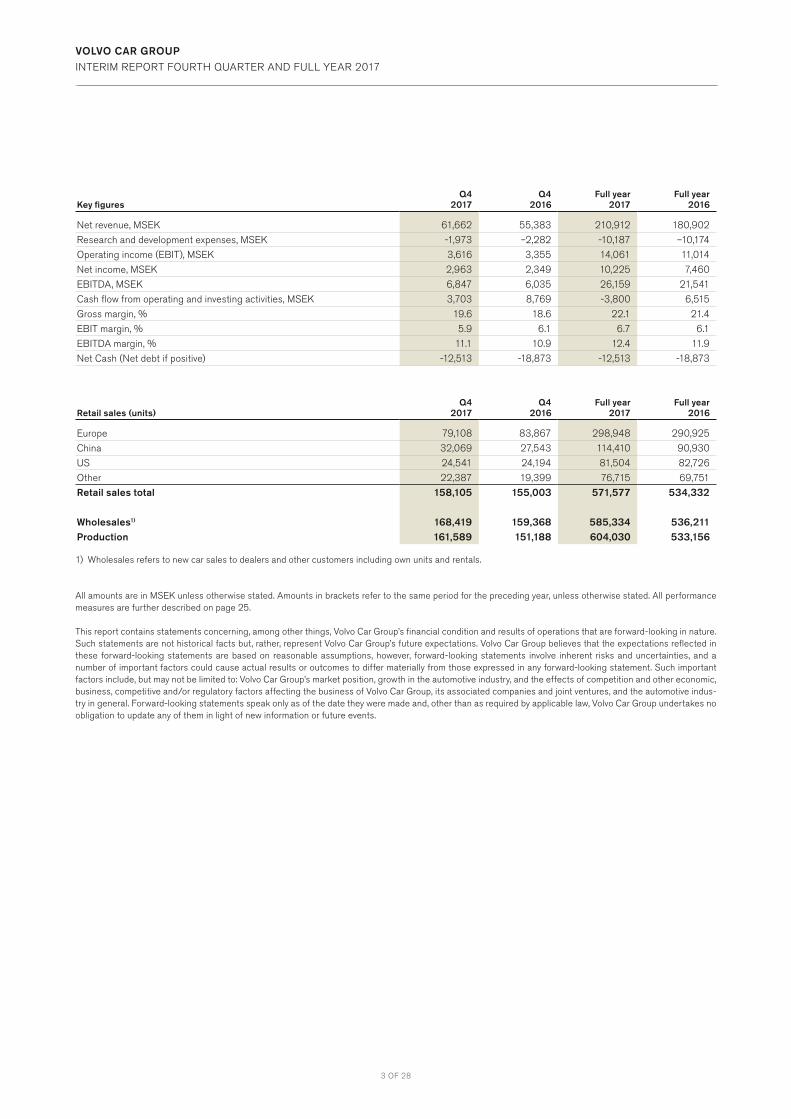
Key figuresQ4
2017Q4
2016Full year
2017Full year
2016
Net revenue, MSEK 61,662 55,383 210,912 180,902
Research and development expenses, MSEK -1,973 –2,282 -10,187 –10,174
Operating income (EBIT), MSEK 3,616 3,355 14,061 11,014
Net income, MSEK 2,963 2,349 10,225 7,460
EBITDA, MSEK 6,847 6,035 26,159 21,541
Cash flow from operating and investing activities, MSEK 3,703 8,769 -3,800 6,515
Gross margin, % 19.6 18.6 22.1 21.4
EBIT margin, % 5.9 6.1 6.7 6.1
EBITDA margin, % 11.1 10.9 12.4 11.9
Net Cash (Net debt if positive) -12,513 -18,873 -12,513 -18,873
Retail sales (units)Q4
2017Q4
2016Full year
2017Full year
2016
Europe 79,108 83,867 298,948 290,925
China 32,069 27,543 114,410 90,930
US 24,541 24,194 81,504 82,726
Other 22,387 19,399 76,715 69,751
Retail sales total 158,105 155,003 571,577 534,332
Wholesales1) 168,419 159,368 585,334 536,211Production 161,589 151,188 604,030 533,156
1) Wholesales refers to new car sales to dealers and other customers including own units and rentals.
All amounts are in MSEK unless otherwise stated. Amounts in brackets refer to the same period for the preceding year, unless otherwise stated. All performance measures are further described on page 25.
This report contains statements concerning, among other things, Volvo Car Group’s financial condition and results of operations that are forward-looking in nature. Such statements are not historical facts but, rather, represent Volvo Car Group’s future expectations. Volvo Car Group believes that the expectations reflected in these forward-looking statements are based on reasonable assumptions, however, forward-looking statements involve inherent risks and uncertainties, and a number of important factors could cause actual results or outcomes to differ materially from those expressed in any forward-looking statement. Such important factors include, but may not be limited to: Volvo Car Group’s market position, growth in the automotive industry, and the effects of competition and other economic, business, competitive and/or regulatory factors affecting the business of Volvo Car Group, its associated companies and joint ventures, and the automotive indus-try in general. Forward-looking statements speak only as of the date they were made and, other than as required by applicable law, Volvo Car Group undertakes no obligation to update any of them in light of new information or future events.

4 OF 28
VOLVO CAR GROUP
INTERIM REPORT FOURTH QUARTER AND FULL YEAR 2017
Volvo Cars continues to stand out as a pioneer within the auto space. With our sustainability commitment ‘OMTANKE’ firmly embedded in our business, we are finding solutions to the disrup-tions being posed around electrification, connectivity, mobility services and autonomous driving (AD). This year we have laid out clear strategies in each of these areas, but before elaborating on them, let me recap on developments in our core business during 2017. The Chinese passenger car market remains the fastest growing market worldwide, and Volvo Cars performed very well in China in 2017, breaking the 100,000 unit threshold for the first time. With our car plants in Chengdu, Luqiao and Daqing, as well as a stable dealer network, we are driving greater awareness of our product quality, technology, brand values and Scandinavian heritage. We continued to increase sales in Europe where the market remained strong. We are particularly pleased with 6 per cent increase in Sweden selling almost 75,000 cars against market growth of 2 per cent. Overall, the US market was softer this year than last. Our sales during the first half of 2017 declined, but during the second half, we saw a positive sales development, almost ending the year on the same level as 2016. We are opening our new factory in Charleston later in 2018 and we believe a stronger presence in the market will have a positive bearing on sales going forward. I am very pleased with the successful ramp up in production of the new XC60 after the very impressive launch at the beginning of the year. As of December, the XC60 is now being built in both Gothenburg, Sweden, and in Chengdu, China. Recently, it was named the car with the best overall performance by the prestig-ious Euro NCAP 2017 Best in Class safety awards. This adds to a list of achievements that exemplify our commitment to our vision that no one should be seriously injured or killed in a new Volvo car by 2020. By launching the XC40 we have a complete SUV offering for the first time. Production started in November at our plant in Ghent, Belgium, and the car will come to market in the beginning of 2018. The XC40 launch brought with it the launch of Care by Volvo, our response to flexible mobility. The aim is to give our customers
more freedom – without having to own a car. I believe subscription services are one way forward as new mobility continues its rapid development. For subscription services and AD, connectivity and digitalisation are essential. Being a small player in this sector, we have chosen to make a virtue of our agility in forming a number of strong and mutually beneficial partnerships during the year. Our collaborations are all with experts in their respective areas. When it comes to autonomous drive we have joined up with Autoliv, transferring most of our AD-related software development to our joint venture Zenuity. Importantly, we believe that we can benefit from commercialising our AD technology as this business will sell its products to other OEM’s in the future. On the hardware side we collaborate with Uber, where we have agreed to sell up to 24,000 cars to them for their AD taxi service. Uber is already using XC90s for its self-driving tests, reflecting the strength of our credentials and commitment to becoming the supplier of choice for autonomous drive ride-sharing services globally. On electrification, our strategy, laid out in July 2017, is that all new Volvo cars launched from 2019 will be hybrids or all electric. We think we have a very firm advantage with our progressive, pure electric performance brand Polestar already having started con-struction on its first plant in Chengdu, China. In 2018, we foresee continued growth both in revenue and retail sales. We are launching and ramping up production of our last two models on the SPA platform, the V60 and the S60. The latter will be built in the new factory in Charleston, US. We will also ramp up production of the XC40 and we are looking forward to its recep-tion when it reaches our customers. Broadly speaking, in addition to our core business of building and selling cars we will continue to develop other business areas within subscription services, AD and electrification. This, we expect, will result in improved 2018 profits while we will continue to lead the way in responding to the disruptive challenges in our industry.
Håkan SamuelssonCEO
ceo COMMENT2017 was Volvo Cars’ fourth consecutive year of growth and we are delivering according to the plan we set out. We are investing heavily – in people, in our product portfolio and in our global manufacturing footprint. In Sweden, we have grown from 16,000 employees in 2011 to 21,000 employees this year with a total workforce of 38,000 globally.

5 OF 28
VOLVO CAR GROUP
INTERIM REPORT FOURTH QUARTER AND FULL YEAR 2017

6 OF 28
VOLVO CAR GROUP
INTERIM REPORT FOURTH QUARTER AND FULL YEAR 2017
VOLVO CAR GROUP INTERIM REPORT FOURTH QUARTER AND FULL YEAR 2017
Volvo Car AB (publ.), with its registered office in Gothenburg, is majority owned (99 per cent) by Geely Sweden Holdings AB, owned by Shanghai Geely Zhaoyuan International Investment Co., Ltd., registered in Shanghai, China, ultimately owned by Zhejiang Geely Holding Group Ltd., registered in Hangzhou, China.
Volvo Car AB (publ.) holds shares in its subsidiary Volvo Car Corporation and provides the Group with certain financing solu-
tions. Volvo Car AB (publ.) indirectly, through Volvo Car Corpora-tion and its subsidiaries, operates in the automotive industry with business relating to the design, development, manufacturing, mar-keting and sales of cars and thereto related services. Volvo Car Group and its global operations are referred to as “Volvo Cars”.
For the full year 2017, Volvo Cars’ global retail sales increased by 7.0 per cent to 571,577 (534,332) units. 2017 represents our fourth consecutive year of record sales. Wholesale increased by 9.2 per cent to 585,334 (536,211) units in the same period. Sales of the new XC60 and the 90 series were the main drivers. The new XC60, together with the XC60 Classic, was the best-selling model, followed by the V40.
Volvo Cars’ fourth quarter retail sales increased by 2.0 per cent to 158,105 (155,003) units. Wholesale increased by 5.7 per cent to 168,419 (159,368) units. Stronger demand for all models in the 90 series drove the retail sales, supported by growth in China, the Nordic countries and Russia.
EuropeSales of passenger cars in Europe (EU+EFTA) increased by 3.3 per cent in 2017, reflecting growth in the major markets: overall car sales in Sweden increased by 1.9 per cent, Germany 2.7 per
cent, France 4.7 per cent and Italy 7.9 per cent. Sales in United Kingdom, however, decreased by 5.7 per cent. This was the first annual decline in the UK since 2011 as higher taxes, lower con-sumer confidence and a significant drop in diesel sales hit demand. Despite the market conditions, Volvo Cars increased its market share by 5 per cent in the UK.
Volvo Cars reported a retail sales increase of 2.8 per cent to 298,948 (290,925) units in the full year 2017 supported by all-time-high volumes in Sweden. Sales were supported by stronger demand for the 90 series, as well as the XC60, and the introduc-tion of the new XC60 in the second quarter of 2017.
In the fourth quarter, Volvo Cars’ retail sales declined by 5.7 per cent to 79,108 (83,867) units. Sales declined in a number of Volvo Cars’ major European markets, affected by weaker overall demand in Europe, however, this was partly offset by positive sales development in Volvo Cars’ Nordic markets: Sweden, Nor-way, Denmark and Finland.
The Volvo Car Group
Sales development
Retail sales (units)Q4
2017Q4
2016 Change %Full year
2017Full year
2016 Change %
Europe 79,108 83,867 -5.7 298,948 290,925 2.8
China 32,069 27,543 16.4 114,410 90,930 25.8
US 24,541 24,194 1.4 81,504 82,726 -1.5
Other 22,387 19,399 15.4 76,715 69,751 10.0
Retail sales total 158,105 155,003 2.0 571,577 534,332 7.0
Wholesales 168,419 159,368 5.7 585,334 536,211 9.2Production 161,589 151,188 6.9 604,030 533,156 13.3

7 OF 28
VOLVO CAR GROUP
INTERIM REPORT FOURTH QUARTER AND FULL YEAR 2017
ChinaThe Chinese passenger car market grew by 1.4 per cent in the full year 2017. SUV sales increased by 13.3 per cent in the same period, while sales in other segments declined. A vehicle sales tax increase implemented in the beginning of 2017, impacted the overall demand during the year. The NEV (New Energy Vehicles) market benefited from government incentives with sales increas-ing by 53.3 per cent in the full year.
With double digit growth of 25.8 per cent in 2017, Volvo Cars’ outperformed the overall market. The increase contributed to total retail sales of 114,410 (90,930) units. Growth was driven by a stronger increase in the demand of the S90 and the solid demand for the XC90 and XC60. The latter was the most popular Volvo Car model in China.
Volvo Cars’ sales increased by 16.4 per cent to 32,069 (27,543) units in the fourth quarter, to some extent reflecting the softer overall market and the XC60 model transition, when Volvo Cars phased out the XC60 Classic and introduced the new XC60.
USFor the full year 2017, sales in the overall US market for light vehicles declined by 1.8 per cent, after seven consecutive years of growth. Still, 2017 saw the fourth best full-year sales level in US history reflecting a solid macro-economic performance and good consumer confidence. The demand for SUVs, crossovers and pickups remained strong, growing at the expense of other seg-ments. Volvo Cars’ retail sales declined by 1.5 per cent in the full year 2017, slightly less than the overall market. Total sales figures were impacted by delivery constraints in the beginning of the year, although this was offset by sales growth in the final three quar-ters.
In the fourth quarter, Volvo Cars US retail sales increased by 1.4 per cent to 24,541 (24,194) units. The XC90 continued to be the best-selling model, followed by the XC60.
OtherIn other markets, Volvo Cars’ retail sales increased by 10.0 per cent to 76,715 (69,751) in 2017, supported by demand for the
S90 and V90, as well as the XC60 Classic together with the new XC60. In Japan, Volvo Cars registered a retail sales increase of 8.3 per cent during the year, reflecting strong sales of both the V90 and the new XC60, which was awarded Car of the Year in Japan 2017. In Russia, the sales growth of 23.1 per cent was driven by the recovery of the Russian car market and increased sales of the 90 series. In Korea, the introduction of the 90 series, a strengthened dealer network and growing demand for imported brands, contributed to growth of 27.4 per cent in the year. In Can-ada, Volvo Cars recorded a sales increase of 16.3 per cent as a result of good growth in the overall market, strong sales of the S90 and V90. In the fourth quarter, Volvo Cars’ retail sales improved further in the region with an increase of 15.4 per cent. Retail sales in Can-ada and Russia increased by 57.7 and 30.2 per cent, respectively. Korea recorded an increase of 12.9 per cent, while sales were almost flat in Japan.
RETAIL SALES BY MARKET FOURTH QUARTER 2017
RETAIL SALES BY CARLINE FOURTH QUARTER 2017
US 16%China 20%
Other 14%
Europe 50%
XC 46%
V 34%
S 20%
VOLVO CAR GROUP INTERIM REPORT FOURTH QUARTER AND FULL YEAR 2017
8 OF 28
VOLVO CAR GROUP
INTERIM REPORT FOURTH QUARTER AND FULL YEAR 2017
VOLVO CAR GROUP INTERIM REPORT FOURTH QUARTER AND FULL YEAR 2017
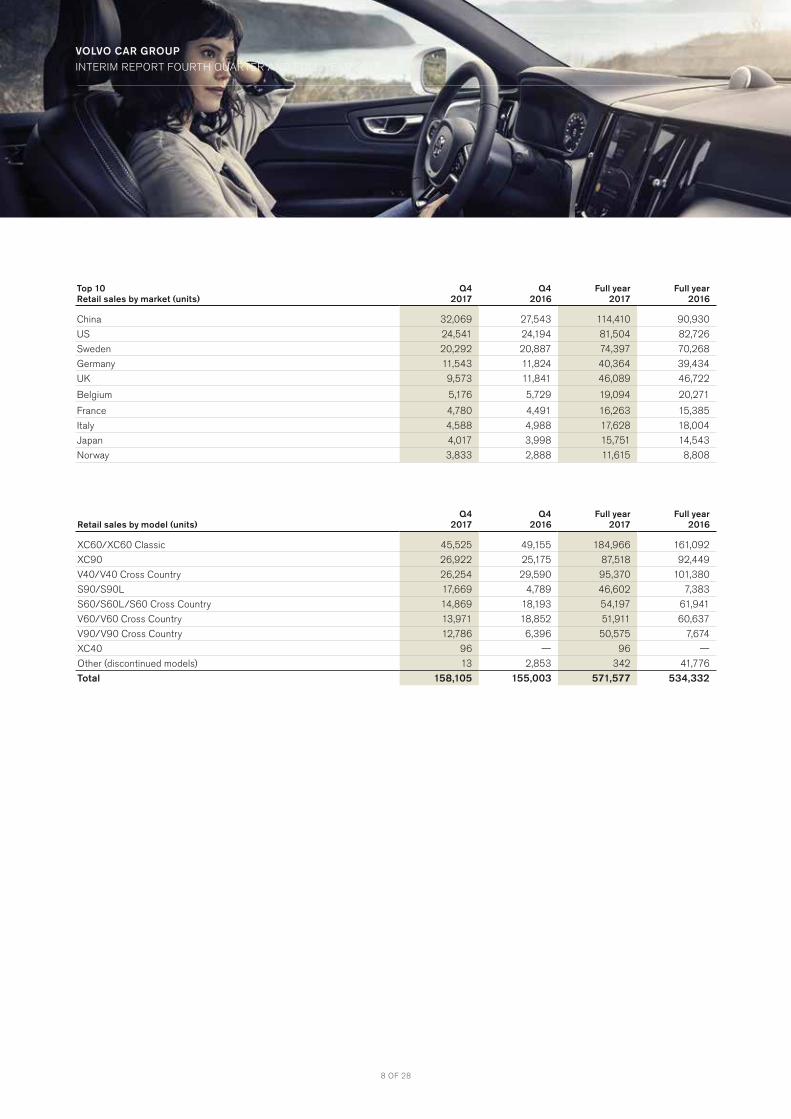
Top 10Retail sales by market (units)
Q4 2017
Q4 2016
Full year 2017
Full year 2016
China 32,069 27,543 114,410 90,930
US 24,541 24,194 81,504 82,726
Sweden 20,292 20,887 74,397 70,268
Germany 11,543 11,824 40,364 39,434
UK 9,573 11,841 46,089 46,722
Belgium 5,176 5,729 19,094 20,271
France 4,780 4,491 16,263 15,385
Italy 4,588 4,988 17,628 18,004
Japan 4,017 3,998 15,751 14,543
Norway 3,833 2,888 11,615 8,808
Retail sales by model (units)Q4
2017Q4
2016Full year
2017Full year
2016
XC60/XC60 Classic 45,525 49,155 184,966 161,092
XC90 26,922 25,175 87,518 92,449
V40/V40 Cross Country 26,254 29,590 95,370 101,380
S90/S90L 17,669 4,789 46,602 7,383
S60/S60L/S60 Cross Country 14,869 18,193 54,197 61,941
V60/V60 Cross Country 13,971 18,852 51,911 60,637
V90/V90 Cross Country 12,786 6,396 50,575 7,674
XC40 96 — 96 —
Other (discontinued models) 13 2,853 342 41,776
Total 158,105 155,003 571,577 534,332

9 OF 28
VOLVO CAR GROUP
INTERIM REPORT FOURTH QUARTER AND FULL YEAR 2017
FOURTH QUARTER 2017
Volvo Cars and Geely invest in PolestarVolvo Cars and Zhejiang Geely Holding Group Ltd. announced they will make a joint investment of MSEK 6,100 to establish a jointly owned company which will include a Polestar manufactur-ing facility in Chengdu, China, which is consolidated into Volvo Cars. Volvo Cars’ first installment of MSEK 631 was carried out
during the quarter, and will support the initial phase of Polestar’s electrified product, brand and industrial development.
Volvo Cars invests in LYNK & COFollowing the agreement with Geely Automobile Holding Ltd. in the third quarter to form a separate Lynk & Co Investment Co., Ltd. company, Volvo Cars aquired 30 per cent of the new compa-ny’s shares.
Significant events
VOLVO CAR GROUP INTERIM REPORT FOURTH QUARTER AND FULL YEAR 2017
Other eventsProducts & Technology Volvo Cars and Uber enhances strategic partnershipVolvo Cars announced a framework agreement with Uber, the ride sharing company, to sell tens of thousands of autonomous driving compatible base vehicles between 2019 and 2021. Volvo Cars’ engineers have worked closely together with engineers from Uber to develop the XC90 premium SUVs that are to be supplied to Uber. The base vehicles are developed on Volvo Cars’ fully modu-lar, in-house developed Scalable Product Architecture (SPA).
Production of two new models started - XC40 (Belgium) and XC60 (China)Production of the new XC40 started in the Ghent plant, Belgium. The new XC40 is Volvo Cars’ first ever small premium SUV and takes Volvo Cars into the fastest growing segment of the automo-tive industry. In addition, production of the new XC60 started in Chengdu, China.
People Appointments to the Executive Management TeamMårten Levenstam was appointed Senior Vice President Product Strategy and Business Ownership. Effective January 1, 2018, Mårten will oversee the product creation operations following the merging of the product strategy team and the vehicle line man-agement team.
FinancingNew bond issueVolvo Cars raised MEUR 500 via a new bond issue under its newly established Euro Medium Term Note Programme. The issue further improves the company’s financial flexibility and diversifies its funding sources. The bond is listed on the Luxem-bourg Stock Exchange and the proceeds will be used for general
corporate purposes, which may include refinancing of existing debt.
Summary of previously reported events• Electrification strategy announced• Volvo Cars and Geely Automobile Holding Ltd. agreed on the formation of Lynk & Co Investment Co., Ltd. and formed a technology sharing JV (GV Automobile Technology (Ningbo) Co. Ltd.)• The new XC40 was launched• The new XC60 went into production• Further investments in the US operations, where the next generation of XC90 will be built• Amtek Components Sweden AB acquired• The subscription service Care by Volvo introduced• The technology platform Luxe and key competence acquired• Polestar New Energy Vehicle Co., Ltd. became separate global high performance car brand• First fully electric car announced to be built in China• Zenuity AB, the JV with Autoliv with the purpose to develop next generation self-driving car technologies, became operational• Upgraded credit rating to BB+ with a stable outlook received• Volvo Cars announced a new car-sharing mobility business within the Group• New appointments to the Executive Management Team: - Anders Gustafsson, Senior Vice President Volvo Americas - Lex Kerssemakers, Senior Vice President EMEA - David Ibison, Senior Vice President Corporate
Communications - Martina Buchhauser, Senior Vice President Procurement - Xiaolin Yuan, Senior Vice President Asia Pacific

10 OF 28
VOLVO CAR GROUP
INTERIM REPORT FOURTH QUARTER AND FULL YEAR 2017
Income Statement (MSEK)Q4
2017Q4
2016
Net revenue 61,662 55,383
Gross income 12,086 10,309
Operating income 3,616 3,355
Income before tax 3,319 2,835
Net income 2,963 2,349
Research and development (MSEK)Q4
2017Q4
2016
Research and development spending -3,139 -3,161
Capitalised development costs 2,167 1,941
Amortisation and depreciation of Research and development4) -1,001 -1,062
Research and development expenses -1,973 -2,282
1) Prior year net revenue and cost of sales have been restated to hedged currency rates. Total effect amounts to MSEK 22 (-557) for net revenue and MSEK 117 (117) for cost of sales, see Note 1 – Accounting principles.
2) Sold licenses have been reclassified from Other Operating Income to Net Revenue. The comparative period has been restated. Total effect amounts to MSEK 52 (-), see note 1 – Accounting principles.
3) During 2017 costs have been reclassified from cost of sales to research and development. The comparative period has been restated. Total effect amounts to MSEK 207 (244).
4) Includes amortisation of capitalised development cost and a portion of depreciation of other intangible assets.
During the fourth quarter, Volvo Cars generated net revenue of MSEK 61,662 (55,383)1) 2), an increase of 11.3 per cent. This result reflects continuous strong growth of Volvo Cars core busi-ness. The increase was a result of a positive sales volume devel-opment, where wholesale increased by 5.7 per cent to 168,419 (159,368) units. The increase was also a result of an improved sales mix, driven by XC60, S90 and V90 sales, acquired business (First Rent A Car Group), partly offset by negative currency effects. Cost of sales increased by MSEK 4,502 to MSEK –49,576 (–45,074).1) 3) The increase was attributable to higher sales vol-ume, improved sales mix as well as continued ramp-up in produc-tion, including increased depreciation and amortisation. Gross income increased to MSEK 12,086 (10,309). Gross margin increased to 19.6 (18.6) per cent. 2)
Volvo Cars is continuously investing in new technologies and new car models while meeting the increase in demand by ramping up production. This planned growth translates into an increase of expenses, where research and development, selling and adminis-trative expenses increased to MSEK -9,214 (-7,321)3). The increase also reflects a larger number of employees (see section Employees on page 13), higher marketing and event expenses due to the launch of new car models as well as advertising cam-
paigns and increased IT expenses as a part of Volvo Cars’ focus on digitalisation. Research and development expenses have increased but has been partly offset by received government grants. For details regarding research and development expenses, see the table below.
Other operating income and expense, net, increased to MSEK 645 (207)1) 2), mainly relating to received government grants, partly offset by royalty expenses.
Operating income (EBIT) increased to MSEK 3,616 (3,355). The gross income development had a positive effect on operating income. This effect has been partly offset by increased selling and administrative expenses mainly driven by costs related to the growth of the business and advertising, sales and promotion due to launch of new car models. Together with a negative foreign exchange effect of MSEK 115, EBIT margin decreased to 5.9 (6.1) per cent.
Net financial items amounted to MSEK -297 (-520), mainly related to decreased interest expenses and other financial expenses. The income tax decrease is mainly related to withhold-ing tax credits partly offset by increased profit and change in corporate income tax rates.
Net income increased by 26.1 per cent to MSEK 2,963 (2,349).
Financial summaryFOURTH QUARTER 2017 – INCOME AND RESULTThe comparative figures refer to the consolidated income statement of the fourth quarter 2016 if not otherwise stated.
VOLVO CAR GROUP INTERIM REPORT FOURTH QUARTER AND FULL YEAR 2017

11 OF 28
VOLVO CAR GROUP
INTERIM REPORT FOURTH QUARTER AND FULL YEAR 2017
Volvo Cars generated net revenue of MSEK 210,912 (180,902)1)
2), an increase of 16.6 per cent, reflecting continued strong growth of Volvo Cars core business. The increase was a result of a posi-tive sales volume development, where wholesale increased by 9.2 per cent to 585,334 (536,211) units, making 2017 the fourth consecutive year of record sales for Volvo Cars. The increase was also a result of an improved sales mix (driven by XC60, S90 and V90 sales), sold licenses and acquired business (First Rent A Car Group), which was partly offset by negative currency effects.
Cost of sales increased by MSEK 22,034 to MSEK –164,254 (–142,220)1) 3). The increase was attributable to higher sales vol-ume, improved sales mix as well as moving production of the S90 series to Daqing and general ramp-up in production, including depreciation and amortisation. Gross income increased to MSEK 46,658 (38,682). Gross margin increased to 22.1 (21.4) per cent.2)
Volvo Cars is continuously investing in new technologies and new car models while meeting the increase in demand by ramping up production. This planned growth translates into increased expenses, where research and development, selling and adminis-trative expenses increased to MSEK -33,635 (-28,637)3). The increase also reflects a larger number of employees (see section Employees on page 13), higher marketing and event expenses due to the launch of new car models as well as advertising cam-
paigns and increased IT expenses as a part of Volvo Cars’ focus on digitalisation. Research and development expenses have increased but has been partly offset by received government grants. For details regarding research and development expenses, see table below.
Other operating income and expense, net, increased to MSEK 838 (551)1) 2), mainly relating to received government grants, partly offset by negative translation exchange effects on operat-ing assets and liabilities.
Operating income (EBIT) increased to MSEK 14,061 (11,014). The improvement was largely a result of the positive gross income development related to increased volumes, positive sales mix and sold licenses.2) The improvement was partly offset by increased selling and administrative expenses together with a negative for-eign exchange effect of MSEK 1 595. This has resulted in an EBIT margin of 6.7 (6.1) per cent.
Net financial items amounted to MSEK –914 (–1,493), mainly relating to decreased interest expenses and other financial expenses as well as increased interest income on cash and short term investments. The income tax increase is related to increased profit and withholding tax.
Net income increased by 37.1 per cent to MSEK 10,225 (7,460).
FULL YEAR 2017 – INCOME AND RESULTThe comparative figures refer to the consolidated income statement of the full year 2016 if not otherwise stated.
Income Statement (MSEK)Full year
2017Full year
2016
Net revenue 210,912 180,902
Gross income 46,658 38,682
Operating income 14,061 11,014
Income before tax 13,147 9,521
Net income 10,225 7,460
Research and development (MSEK)Full year
2017Full year
2016
Research and development spending -13,665 -12,288
Capitalised development costs 7,639 6,177
Amortisation and depreciation of Research and development4) -4,161 -4,063
Research and development expenses -10,187 -10,174
1) Prior year net revenue and cost of sales have been restated to hedged currency rates. Total effect amounts to MSEK -471 (175) for net revenue and MSEK 288 (262) for cost of sales, see Note 1 – Accounting principles.
2) Sold licenses have been reclassified from Other Operating Income to Net Revenue. The comparative period has been restated. Total effect amounts to MSEK 4,023 (55), see note 1 – Accounting principles.3) During 2017 costs have been reclassified from cost of sales to research and development. The comparative period has been restated. Total effect amounts to
MSEK 830 (800).4) Includes amortisation of capitalised development cost and a portion of depreciation of other intangible assets.
VOLVO CAR GROUP INTERIM REPORT FOURTH QUARTER AND FULL YEAR 2017

12 OF 28
VOLVO CAR GROUP
INTERIM REPORT FOURTH QUARTER AND FULL YEAR 2017
CASH FLOWCash flow from operating and investing activities amounted to MSEK -3,800 (6,515).
Cash flow from operating activities amounted to MSEK 24,530 (26,861). The change is due to an increased operating income amounting to MSEK 14,061 (11,014), adjusting for depreciation and amortisation, an additional MSEK 12,098 (10,527) was con-tributed. A positive change in working capital contributed with MSEK 2,816 (7,656) which was offset by income tax paid of MSEK -3,471 (-1,705).
The positive effect in working capital is mainly related to increased accounts payables, primarily due to increased produc-tion volume. Furthermore, there are positive cash flow effects from provisions and other working capital assets and liabilities, partly offset by negative effects from inventory and accounts receivables. The change in inventory is due to production related seasonality, product mix and ramp-up of production in Daqing. The change in account receivables is explained by increased sales.
Cash flow from investing activities amounted to MSEK –28,330 (–20,346). Investments in tangible assets amounted to MSEK –16,634 (–12,669), following the ongoing construction of the US plant and special tool investments related to new car models, such as the new XC60 and XC40. Investments in intangible assets amounted to MSEK –9,651 (–6,394) as a result of contin-uous investments in new and upcoming car models and new tech-nology. Investments in shares and participations amounted to MSEK -2,081 (-1,280) primarily attributable to the MSEK 2,800 investment in Lynk & Co Investment Co., Ltd.
NET FINANCIAL POSITION AND LIQUIDITYThe presented figures refer to the consolidated figures for the full year 2017 if not otherwise stated. The comparative figures for the cash flow items refer to the consolidated cash flow statement for the full year 2016 if not otherwise stated. The comparative figures for the balance sheet items refer to the consolidated balance sheets of December 31, 2016 if not otherwise stated.
VOLVO CAR GROUP INTERIM REPORT FOURTH QUARTER AND FULL YEAR 2017
Cash flow Statement (MSEK)Full year
2017Full year
2016
Cash flow from operating activities 24,530 26,861
Cash flow from investing activities -28,330 –20,346
Cash flow from operating and investing activities -3,800 6,515
Cash flow from financing activities 1,333 5,792
Cash flow for the period -2,467 12,307
Cash flow from financing activities amounted to MSEK 1,333 (5,792). The change is mainly attributable to proceeds from bond issuance of MSEK 4,914 (7,579), withdrawal of credit facilities of MSEK 1,291 (1,696) and matured marketable securities of net MSEK 785 (–1,189). The positive change in financing activities was partly offset by repayment of liabilities to credit institutions of MSEK –3,658 (–7,634) and dividends paid of MSEK –2,188 (–).
Cash and cash equivalents including marketable securities decreased to MSEK 39,394 (43,373). Net cash decreased to MSEK -12,513 (-18,873). Including undrawn credit facilities of MSEK 15,203 (6,305), liquidity is at MSEK 54,597 (49,678).
EQUITYTotal equity increased by MSEK 11,350 to MSEK 54,660 (43,310), resulting in an equity ratio of 28.7 (26.8) per cent. The change is attributable to the positive net income of MSEK 10,225 and positive effects in other comprehensive income. The latter is related to change in cash flow hedge reserve of MSEK 3,473 partly offset by a negative translation foreign exchange effect, including hedges of MSEK -412 and remeasurement of post-em-ployment benefits of MSEK -360. The investment in Polestar increased the non-controlling interest with 631 MSEK. A divi-dend of MSEK -2,188 has been paid to the shareholders, whereof MSEK 65 was distributed to the holders of preference shares.
13 OF 28
VOLVO CAR GROUP
INTERIM REPORT FOURTH QUARTER AND FULL YEAR 2017
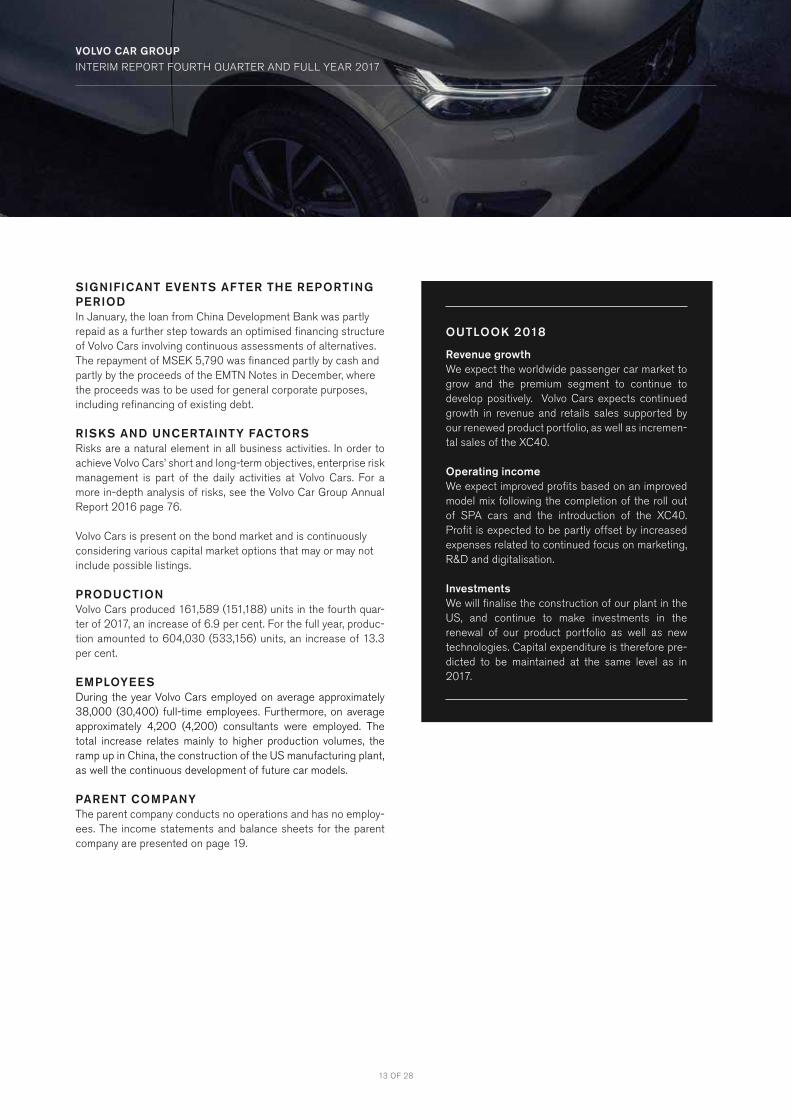
SIGNIFICANT EVENTS AFTER THE REPORTING PERIOD In January, the loan from China Development Bank was partly repaid as a further step towards an optimised financing structure of Volvo Cars involving continuous assessments of alternatives. The repayment of MSEK 5,790 was financed partly by cash and partly by the proceeds of the EMTN Notes in December, where the proceeds was to be used for general corporate purposes, including refinancing of existing debt.
RISKS AND UNCERTAINTY FACTORSRisks are a natural element in all business activities. In order to achieve Volvo Cars’ short and long-term objectives, enterprise risk management is part of the daily activities at Volvo Cars. For a more in-depth analysis of risks, see the Volvo Car Group Annual Report 2016 page 76.
Volvo Cars is present on the bond market and is continuously considering various capital market options that may or may not include possible listings.
PRODUCTIONVolvo Cars produced 161,589 (151,188) units in the fourth quar-ter of 2017, an increase of 6.9 per cent. For the full year, produc-tion amounted to 604,030 (533,156) units, an increase of 13.3 per cent.
EMPLOYEESDuring the year Volvo Cars employed on average approximately 38,000 (30,400) full-time employees. Furthermore, on average approximately 4,200 (4,200) consultants were employed. The total increase relates mainly to higher production volumes, the ramp up in China, the construction of the US manufacturing plant, as well the continuous development of future car models.
PARENT COMPANYThe parent company conducts no operations and has no employ-ees. The income statements and balance sheets for the parent company are presented on page 19.
VOLVO CAR GROUP INTERIM REPORT FOURTH QUARTER AND FULL YEAR 2017
OUTLOOK 2018
Revenue growthWe expect the worldwide passenger car market to grow and the premium segment to continue to develop positively. Volvo Cars expects continued growth in revenue and retails sales supported by our renewed product portfolio, as well as incremen-tal sales of the XC40.
Operating incomeWe expect improved profits based on an improved model mix following the completion of the roll out of SPA cars and the introduction of the XC40. Profit is expected to be partly offset by increased expenses related to continued focus on marketing, R&D and digitalisation.
InvestmentsWe will finalise the construction of our plant in the US, and continue to make investments in the renewal of our product portfolio as well as new technologies. Capital expenditure is therefore pre-dicted to be maintained at the same level as in 2017.

14 OF 28
VOLVO CAR GROUP
INTERIM REPORT FOURTH QUARTER AND FULL YEAR 2017
CONSOLIDATED INCOME STATEMENTS
MSEK Note Q4
2017Q4
2016Full year
2017Full year
2016
Net revenue 1 61,662 55,383 210,912 180,902
Cost of sales 1 -49,576 –45,074 -164,254 –142,220
Gross income 12,086 10,309 46,658 38,682
Research and development expenses -1,973 –2,282 -10,187 –10,174
Selling expenses -4,755 –3,231 -15,266 –11,992
Administrative expenses -2,486 –1,808 -8,182 –6,471
Other operating income 1 947 1,049 3,054 2,412
Other operating expenses 1 -302 –842 -2,216 –1,861
Share of income in joint ventures and associates 99 160 200 418
Operating income 3,616 3,355 14,061 11,014
Financial income 82 65 355 218
Financial expenses -379 –585 -1,269 –1,711
Income before tax 3,319 2,835 13,147 9,521
Income tax -356 –486 -2,922 –2,061
Net income 2,963 2,349 10,225 7,460
Net income attributable toOwners of the parent company 2,315 1,820 7,960 5,944
Non-controlling interests 648 529 2,265 1,516
2,963 2,349 10,225 7,460

15 OF 28
VOLVO CAR GROUP
INTERIM REPORT FOURTH QUARTER AND FULL YEAR 2017
CONSOLIDATED COMPREHENSIVE INCOME
MSEKQ4
2017Q4
2016Full year
2017Full year
2016
Net income for the period 2,963 2,349 10,225 7,460Other comprehensive incomeItems that will not be reclassified subsequently to income statement:Remeasurements of provisions for post-employment benefits 10 1,408 -422 -1,422
Tax on items that will not be reclassified to income statement -26 -417 62 265
Items that may be reclassified subsequently to income statement:Translation difference on foreign operations 526 -25 -318 514
Translation difference of hedge instruments of net investments in foreign operations -89 32 -121 -159
Change in cash flow hedge -388 -2,332 4,453 -3,941
Tax on items that may be reclassified to income statement 105 506 -953 902
Other comprehensive income, net of income tax 138 -828 2,701 –3,841Total comprehensive income for the period 3,101 1,521 12,926 3,619
Total comprehensive income attributable toOwners of the parent company 2,315 961 10,777 2,070
Non-controlling interests 786 560 2,149 1,549
3,101 1,521 12,926 3,619

16 OF 28
VOLVO CAR GROUP
INTERIM REPORT FOURTH QUARTER AND FULL YEAR 2017
CONSOLIDATED BALANCE SHEETS
MSEK NoteDec 31,
2017Dec 31,
2016
ASSETSNon-current assetsIntangible assets 29,157 25,368
Property, plant and equipment 55,245 45,468
Assets held under operating leases 2,577 2,483
Receivables on parent company 54 54
Investments in joint ventures and associates 5,480 2,498
Other long-term securities holdings 80 79
Deferred tax assets 4,558 4,112
Other non-current assets 2 3,704 2,013
Total non-current assets 100,855 82,075
Current assetsInventories 30,665 21,198
Accounts receivable 3 10,832 8,717
Current tax assets 463 293
Other current assets 2 7,955 5,757
Marketable securities 2 3,992 4,738
Cash and cash equivalents 2 35,402 38,635
Total current assets 89,309 79,338TOTAL ASSETS 190,164 161,413
EQUITY & LIABILITIESEquityEquity attributable to owners of the parent company 48,729 39,536
Non-controlling interests 5,931 3,774
Total equity 54,660 43,310
Non-current liabilitiesProvisions for post-employment benefits 6,525 6,348
Deferred tax liabilities 1,977 1,209
Other non-current provisions 7,600 6,995
Liabilities to credit institutions 2 6,622 13,910
Bonds 2 12,735 7,699
Other non-current liabilities 2, 3 3,660 5,818
Total non-current liabilities 39,119 41,979
Current liabilitiesCurrent provisions 19,084 15,371
Liabilities to credit institutions 2 7,426 2,813
Advance payments from customers 657 652
Accounts payable 3 38,536 30,508
Current tax liabilities 1,380 626
Other current liabilities 2, 3 29,302 26,154
Total current liabilities 96,385 76,124TOTAL EQUITY & LIABILITIES 190,164 161,413

17 OF 28
VOLVO CAR GROUP
INTERIM REPORT FOURTH QUARTER AND FULL YEAR 2017
CONDENSED CHANGES IN CONSOLIDATED EQUITY
MSEKDec 31,
2017Dec 31,
2016
Opening balance 43,310 34,635Net income for the period 10,225 7,460
Other comprehensive income, net of income tax 2,701 –3,841
Total comprehensive income 12,926 3,619Capital contribution from Non-controlling interests 631 −
Aquisition of non-controlling interests − 140
Issue of preference shares -19 4,916
Dividend to shareholders -2,188 −
Transactions with owners -1,576 5,056Closing balance 54,660 43,310
Attributable to Owners of the parent company 48,729 39,536
Non-controlling interests 5,931 3,774
Closing balance 54,660 43,310

18 OF 28
VOLVO CAR GROUP
INTERIM REPORT FOURTH QUARTER AND FULL YEAR 2017
CONSOLIDATED STATEMENTS OF CASH FLOWS
MSEK NoteQ4
2017Q4
2016Full year
2017Full year
2016
OPERATING ACTIVITIESOperating income 3,616 3,355 14,061 11,014
Depreciation and amortisation of non-current assets 3,231 2,680 12,098 10,527
Interest and similar items received 80 64 303 218
Interest and similar items paid -471 –442 -1,016 –953
Other financial items -131 –308 -383 –418
Income tax paid -1,018 –302 -3,471 –1,705
Adjustments for other items not affecting cash flow -212 861 122 522
5,095 5,908 21,714 19,205
Movements in working capital
Change in inventories 505 2,106 -9,524 –231
Change in accounts receivable 2,304 –158 -1,474 730
Change in accounts payable 3,486 3,742 8,220 4,023
Change in items relating to repurchase commitments -228 –234 235 –342
Change in provisions 1,478 1,997 3,432 3,497
Change in other working capital assets/liabilities 1,930 1,965 1,927 –21
Cash flow from movements in working capital 9,475 9,418 2,816 7,656Cash flow from operating activities 14,570 15,326 24,530 26,861
INVESTING ACTIVITIESInvestments in shares and participations, net 4 -2,149 360 -2,081 –1,280
Dividend received from joint ventures and associates — — 37 5
Investments in intangible assets -3,971 –2,047 -9,651 –6,394
Investments in property, plant and equipment -4,746 –4,867 -16,634 –12,669
Other -1 –3 -1 –8
Cash flow from investing activities -10,867 –6,557 -28,330 –20,346Cash flow from operating and investing activities 3,703 8,769 -3,800 6,515
FINANCING ACTIVITIESProceeds from credit institutions 112 1,217 1,291 1,696
Proceeds from bond issuance 4,914 2,982 4,914 7,579
Proceeds from issuance of preference shares, net -50 4,979 -82 4,979
Repayment of liabilities to credit institutions -1,417 –3,439 -3,658 –7,634
Dividend paid to shareholders — — -2,188 −
Investments in marketable securities, net -571 257 785 –1,189
Other 371 193 271 361
Cash flow from financing activities 3,359 6,189 1,333 5,792Cash flow for the period 7,062 14,958 -2,467 12,307
Cash and cash equivalents at beginning of period 27,890 23,598 38,635 25,623Exchange difference on cash and cash equivalents 450 79 -766 705
Cash and cash equivalents at end of period 35,402 38,635 35,402 38,635

19 OF 28
VOLVO CAR GROUP
INTERIM REPORT FOURTH QUARTER AND FULL YEAR 2017
CONDENSED PARENT COMPANY INCOME STATEMENTS
CONDENSED PARENT COMPANY BALANCE SHEETS
MSEKQ4
2017Q4
2016Full year
2017Full year
2016
Administrative expenses -6 –2 -20 –10
Operating income -6 –2 -20 –10
Income from participation in subsidiary1) − − 1,565 −
Financial income 70 47 243 107
Financial expenses -196 –340 -481 –414
Income before tax -132 –295 1,307 –317
Income tax 13 69 43 71
Net income -119 –226 1,350 –246
1) Received dividend from subisidary of MSEK 1,565, passed through to the shareholders.
Other comprehensive income and net income are consistent since there are no items in other comprehensive income.
MSEK Dec 31,
2017Dec 31,
2016
ASSETSNon-current assets 25,196 20,100
Current assets 4,895 5,021
TOTAL ASSETS 30,091 25,121
EQUITY & LIABILITIESEquityRestricted equity 51 51
Non-restricted equity 7,380 7,614
Total equity 7,431 7,665
Non-current liabilities 22,602 17,338
Current liabilities 58 118
TOTAL EQUITY & LIABILITIES 30,091 25,121

20 OF 28
VOLVO CAR GROUP
INTERIM REPORT FOURTH QUARTER AND FULL YEAR 2017
VOLVO CAR GROUP
INTERIM REPORT FOURTH QUARTER AND FULL YEAR 2017

21 OF 28
VOLVO CAR GROUP
INTERIM REPORT FOURTH QUARTER AND FULL YEAR 2017
NOTE 1 – ACCOUNTING PRINCIPLES
This interim report has been prepared in accordance with IAS 34 – Interim Financial Reporting and the Swedish Annual Accounts Act. The parent company applies RFR 2 - Reporting for legal entities and the Swedish Annual Accounts Act. The Volvo Car Group applies International Financial Reporting Standards (IFRS) as endorsed by the European Union. The accounting principles adopted are, in all material aspects, consistent with those described in the Volvo Car Group Annual Report 2016 Note 1 – Accounting Principles (available at www.volvocars.com), together with the additions in below paragraphs. Note 1 to the Volvo Car Group Annual Report 2016 describes the analysis performed in order to estimate the effects of implementing the new accounting standards IFRS 9 – Financial Instruments and IFRS 15 – Revenue from contracts with customers. In 2017, certain concluding review procedures have been performed, which confirms the anticipated effects as described in note 1 to the Volvo Car Group Annual Report 2016. Based on our review procedures, we can conclude that the effects of implementing IFRS 9 and 15 are very limited, why any adjustment to the opening balances on January 1st 2018 will not be made. In terms of IFRS 16 - Leases, Volvo Car Group is yet to assess the impact.
In 2017, the effect from realised cash-flow hedges is classified as net revenue and cost of sales, respectively, depending on the underlying substance of the transaction. Comparative figures for 2016 have been restated, whereby a reclassification from other oper-ating income/expenses to net revenue and cost of sales has been made. There has been no impact on operating income. The effect of realised cash-flow hedges year to date 2017 in net revenue is MSEK –471 (175) and in cost of sales MSEK 288 (262), with correspond-ing figures for the fourth quarter isolated MSEK 22 (-557) for net revenue and MSEK 117 (117) for cost of sales.
From the third quarter 2017, income from sold licenses related to IP and other developed technology has been reclassified from Other operating income to Net Revenue. The reclassification is made as sale of licenses has become a recurring part of Volvo Car Group’s business, and has therefore been assessed to be a part of the Group’s core business activities. Prior year comparative figures have been restated. Total effect year to date 2017 amounts to MSEK 4,023 (55), and for the quarter MSEK 52 (-).
Certain disclosures, required by IAS 34 – Interim financial reporting, may be given within this interim report, but outside of the formal interim financial statements.
NOTE 2 – FAIR VALUE OF FINANCIAL INSTRUMENTS
Valuation principles for financial instruments as described in Volvo Car Group Annual Report 2016 Note 21 – Financial risks and finan-cial instruments, have been consistently applied throughout the reporting period. The comparative figures in this note refer to December 31, 2016.
In Volvo Car Group’s balance sheet, financial instruments reported at fair value through the income statement consist of derivatives as well as marketable securities (excluding time deposits in banks), see table ‘Financial instruments recorded at fair value through the income statement’ in this note. Fair value of financial instruments is established according to three levels, depending on the market information available. All financial instruments reported at fair value through the income statement that Volvo Car Group holds as of December 31, 2017 belong to level 2. No transfers between the levels of the fair value hierarchy have occurred during the reporting period. Valuation of financial instruments at fair value is based on prevailing market data and on a discounting of estimated cash flows using the deposit/swap curve of the cash flow currency and include risk assumptions. For currency option instruments, the valuation is based on Black & Scholes formula. Fair value of commodity contracts is calculated by discounting the difference between the con-tracted forward price and the contracted forward price that can be obtained on the balance sheet date for the remaining contract period.
The total fair value of the derivative portfolio as of December 31, 2017, amounted to MSEK 1,612 (-2,827). The major part is related to cash flow hedging of currency risk. The table below shows the percentage of the forecasted cash flows that were hedged expressed in nominal terms and in Cash Flow at Risk (CFaR), which is the maximum loss at a 95 per cent confidence level in one year. The CFaR is dependent on the cash flow forecast, market volatility and correlations.
0-24 months 25-48 months
Dec 31, 2017
Dec 31,2016
Dec 31, 2017
Dec 31,2016
Nominal hedge % 29 33 5 6
CFaR incl. hedges % 38 42 11 9
22 OF 28
VOLVO CAR GROUP
INTERIM REPORT FOURTH QUARTER AND FULL YEAR 2017
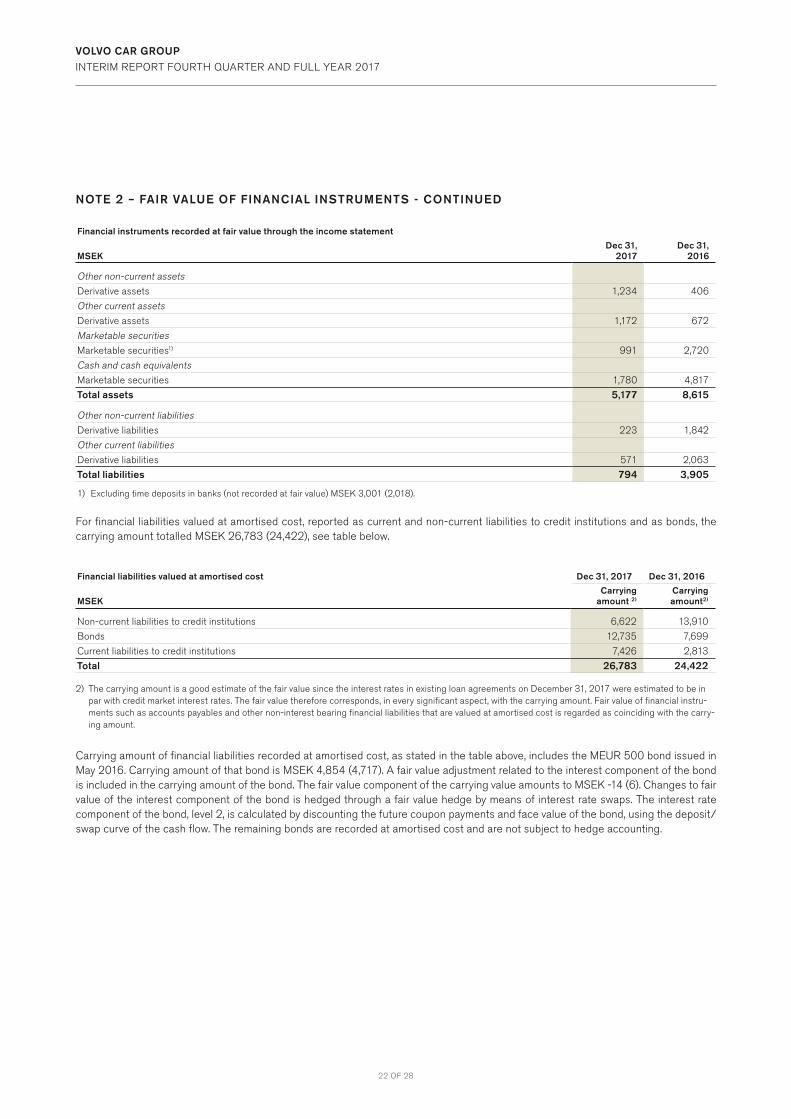
NOTE 2 – FAIR VALUE OF FINANCIAL INSTRUMENTS - CONTINUED
Financial instruments recorded at fair value through the income statement
MSEKDec 31,
2017Dec 31,
2016
Other non-current assetsDerivative assets 1,234 406
Other current assetsDerivative assets 1,172 672
Marketable securitiesMarketable securities1) 991 2,720
Cash and cash equivalentsMarketable securities 1,780 4,817
Total assets 5,177 8,615
Other non-current liabilitiesDerivative liabilities 223 1,842
Other current liabilitiesDerivative liabilities 571 2,063
Total liabilities 794 3,905
1) Excluding time deposits in banks (not recorded at fair value) MSEK 3,001 (2,018).
For financial liabilities valued at amortised cost, reported as current and non-current liabilities to credit institutions and as bonds, the carrying amount totalled MSEK 26,783 (24,422), see table below.
Financial liabilities valued at amortised cost Dec 31, 2017 Dec 31, 2016
MSEKCarrying
amount 2)Carrying amount2)
Non-current liabilities to credit institutions 6,622 13,910
Bonds 12,735 7,699
Current liabilities to credit institutions 7,426 2,813
Total 26,783 24,422
2) The carrying amount is a good estimate of the fair value since the interest rates in existing loan agreements on December 31, 2017 were estimated to be in par with credit market interest rates. The fair value therefore corresponds, in every significant aspect, with the carrying amount. Fair value of financial instru-ments such as accounts payables and other non-interest bearing financial liabilities that are valued at amortised cost is regarded as coinciding with the carry-ing amount.
Carrying amount of financial liabilities recorded at amortised cost, as stated in the table above, includes the MEUR 500 bond issued in May 2016. Carrying amount of that bond is MSEK 4,854 (4,717). A fair value adjustment related to the interest component of the bond is included in the carrying amount of the bond. The fair value component of the carrying value amounts to MSEK -14 (6). Changes to fair value of the interest component of the bond is hedged through a fair value hedge by means of interest rate swaps. The interest rate component of the bond, level 2, is calculated by discounting the future coupon payments and face value of the bond, using the deposit/swap curve of the cash flow. The remaining bonds are recorded at amortised cost and are not subject to hedge accounting.

23 OF 28
VOLVO CAR GROUP
INTERIM REPORT FOURTH QUARTER AND FULL YEAR 2017
NOTE 3 – REL ATED PARTY TRANSACTIONS
During the fourth quarter and full year 2017, Group companies entered into the following transactions with related parties which are not consolidated in the Group. The information in the table below includes all assets and liabilities to related parties. Besides from other non-current liabilities of MSEK 300 (1,383) all assets and liabilities are current.
Sales of goods, services and otherMSEK
Q4 2017
Q4 2016
Full year 2017
Full year 2016
Related companies1)3) 707 522 4,756 1,738
Associated companies and joint ventures2) 106 53 249 162
Purchases of goods, services and otherMSEK
Q4 2017
Q4 2016
Full year 2017
Full year 2016
Related companies1) -853 -889 -1,613 -1,241
Associated companies and joint ventures2) -460 -268 -1,043 -926
Receivables Payables
Dec 31, 2017
Dec 31,2016
Dec 31, 2017
Dec 31,2016
Related companies1) 3,136 3,486 2,935 3,726
Associated companies and joint ventures2) 911 780 297 127
1) Related companies are companies outside the Volvo Car Group but within the Geely sphere of companies. 2) Associated companies and joint ventures are companies in which Volvo Car Group has a significant but not controlling influence, which generally is when Volvo
Car Group holds between 20 and 50 per cent of the shares. 3) Licence revenue represent a value of MSEK 45 (-) in Q4 and MSEK 3,002 (27) in full year.

24 OF 28
VOLVO CAR GROUP
INTERIM REPORT FOURTH QUARTER AND FULL YEAR 2017
NOTE 4 – BUSINESS COMBINATIONS
AquisitionsOn July 27, 2017, Volvo Cars acquired by way of appropriation 100 per cent of the shares in Amtek Components Sweden AB, renamed to Automotive Components Floby AB, a Swedish component factory. The acquired company consists of the Floby plant that supplies vehicle components to Volvo Cars as well as other external customers.
MSEK 2017
Purchase pricePurchase consideration 644
Total cost of the combination 644
Acquired assets and liabilities at fair valueTangible assets 385
Inventories 128
Current receivables 199
Other current assets 4
Cash and cash equivalents 143
Deferred tax liabilities -39
Current liabilities -257
Total fair value of net assets acquired 563Goodwill 81
Cash effect on business combinationPurchase consideration -644
Part of consideration used to amortise previous debt to Volvo Cars 358
Acquired cash and cash equivalents 143
Change in cash and cash equivalents due to acquisitions -143
Goodwill attributable to the acquisition is explained by the strategic importance of ensuring the component supply and also from the future estimated increased income from the acquired business. Acquisition related costs for 2017 amounted to MSEK 9 and have been reported as administration costs in the income statement. There were no contingent liabilities assumed or collateral pledged arising from the acquisition. The fair value of the acquired receivables (which primarily comprises accounts receivables) corresponds to the gross contractual value and amounts to MSEK 199. All receivables are expected to be collectible.
The acquired business contributed revenues of MSEK 562 and net profit of MSEK 26 to the Group for the period from August 1 to December 31, 2017. The total cost of combination and fair values have been determined provisionally, thus, the acquisition analyses may be subject to adjustment during a twelve months period.
Adoption of preliminatry acquisition analysisThe preliminary acquisition analysis previously recognised for First Rent A Car Group was adopted in 2017, resulting in a MSEK 6 reduc-tion of the negative goodwill that arose on the acquistion.

25 OF 28
VOLVO CAR GROUP
INTERIM REPORT FOURTH QUARTER AND FULL YEAR 2017
GENERAL DEFINITIONS
Volvo Car Group and Volvo CarsVolvo Car AB (publ.), Volvo Car Corporation and all its subsidiaries.
Joint venture companiesJoint ventures refer to companies in which Volvo Car Group, through contractual cooperation together with one or more parties, has a joint control over the operational and financial management.
Gross marginGross margin is Gross income as a percentage of net revenue and represents the percent of total net revenue that Volvo Cars retains after incurring the direct costs associated with producing the goods and services sold.
EBITEBIT represents earnings before interest and taxes. EBIT is syn-onymous with operating income which measures the profit Volvo Car Group generates from its operations.
EBIT marginEBIT margin is EBIT as a percentage of net revenue and meas-ures Volvo Car Group’s operating efficiency.
EBITDAEBITDA represents earnings before interest, taxes, depreciations and amortisation, and is another measurement of the operating performance. It measures the profit Volvo Car Group generate from its operations without effect from previous periods capitali-sation levels.
EBITDA marginEBITDA margin is EBITDA in percentage of net revenue.
Equity ratioTotal equity divided by total assets, is a measurement of Volvo Car Group’s long-term solvency and financial leverage.
Net cash/net debtNet cash/net debt is an indicator of Volvo Car Group’s ability to meet its financial obligations. It is represented by liabilities to credit institutions, bonds and other interest-bearing non- current liabilities, less cash and cash equivalents and marketable securi-ties. If negative, the performance measure is referred to as net cash and if positive the performance measure is referred to as net debt.
LiquidityLiquidity consist of cash and cash equivalents, undrawn credit facilities and marketable securities.
EuropeEurope is defined as EU28+EFTA.
Passenger carsPassenger cars are vehicles with at least four wheels, used for the transport of passengers, and comprising no more than eight seats in addition to the driver’s seat.
Performance measures disclosed in the interim report are those that are deemed to give a relevant view of Volvo Car Group’s financial performance for a reader of the interim report. For a reconciliation of performance measures, refer to page 26.
DEFINITIONS OF PERFORMANCE MEASURES
26 OF 28
VOLVO CAR GROUP
INTERIM REPORT FOURTH QUARTER AND FULL YEAR 2017
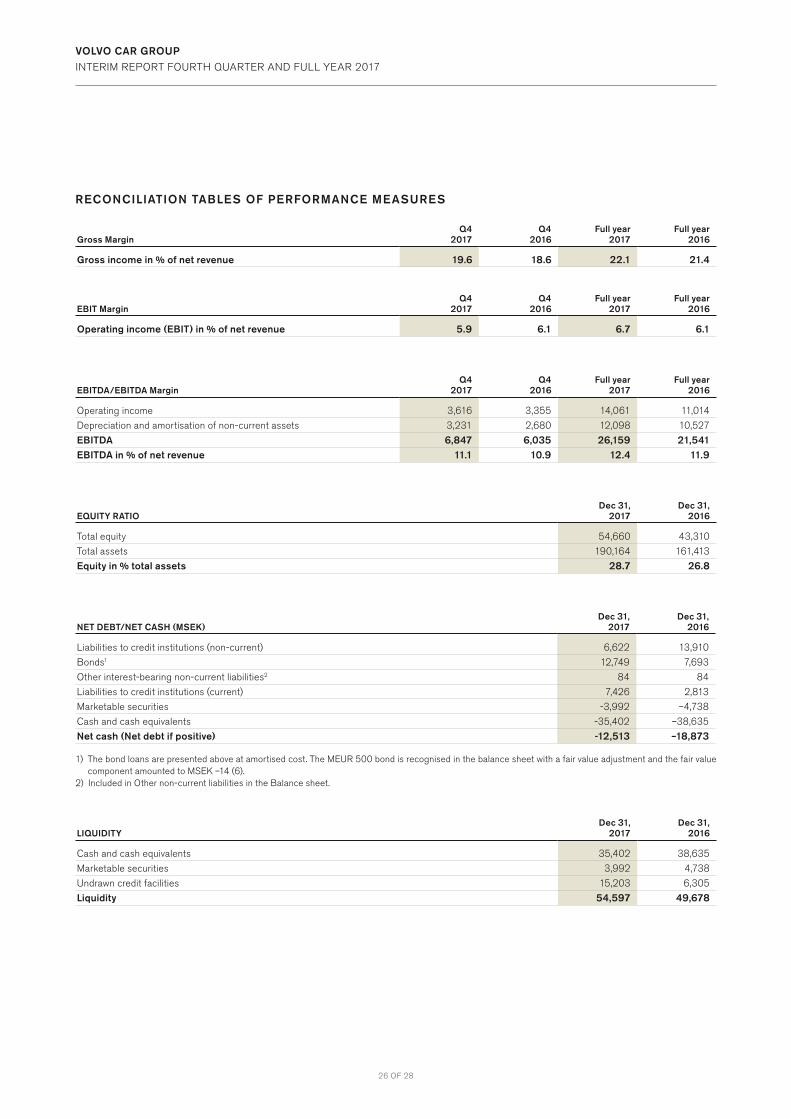
RECONCILIATION TABLES OF PERFORMANCE MEASURES
Gross MarginQ4
2017Q4
2016Full year
2017Full year
2016
Gross income in % of net revenue 19.6 18.6 22.1 21.4
EBIT MarginQ4
2017Q4
2016Full year
2017Full year
2016
Operating income (EBIT) in % of net revenue 5.9 6.1 6.7 6.1
EBITDA/EBITDA MarginQ4
2017Q4
2016Full year
2017Full year
2016
Operating income 3,616 3,355 14,061 11,014
Depreciation and amortisation of non-current assets 3,231 2,680 12,098 10,527
EBITDA 6,847 6,035 26,159 21,541EBITDA in % of net revenue 11.1 10.9 12.4 11.9
EQUITY RATIODec 31,
2017Dec 31,
2016
Total equity 54,660 43,310
Total assets 190,164 161,413
Equity in % total assets 28.7 26.8
NET DEBT/NET CASH (MSEK)Dec 31,
2017Dec 31,
2016
Liabilities to credit institutions (non-current) 6,622 13,910
Bonds1 12,749 7,693
Other interest-bearing non-current liabilities2 84 84
Liabilities to credit institutions (current) 7,426 2,813
Marketable securities -3,992 –4,738
Cash and cash equivalents -35,402 –38,635
Net cash (Net debt if positive) -12,513 –18,873
1) The bond loans are presented above at amortised cost. The MEUR 500 bond is recognised in the balance sheet with a fair value adjustment and the fair value component amounted to MSEK –14 (6).
2) Included in Other non-current liabilities in the Balance sheet.
LIQUIDITYDec 31,
2017Dec 31,
2016
Cash and cash equivalents 35,402 38,635
Marketable securities 3,992 4,738
Undrawn credit facilities 15,203 6,305
Liquidity 54,597 49,678

27 OF 28
VOLVO CAR GROUP
INTERIM REPORT FOURTH QUARTER AND FULL YEAR 2017
CONTACT
Nils MöskoVice President, Head of Investor Relations+46-(0)31–59 21 [email protected]
Volvo Car Group Headquarters405 31 Gothenburgwww.volvocars.com
The President and Chief Executive Officer certifies that the interim report gives a fair view of the performance of the business, position and income statements of Volvo Car AB (publ.) and Volvo Car Group, and describes the principal risks and uncertainties to which the Volvo Car Group is exposed.
Gothenburg, February 7th, 2018
Håkan SamuelssonPresident and Chief Executive Officer
This report has not been subject to review by Volvo Car AB’s auditors.
The Volvo Car Group annual report 2017 will be published in March 2018. The Volvo Car Group interim report on the first quarter 2018 will be published on April 27, 2018.
