voluntary pension plans in the united states dennis p. duffy principal the vanguard group may 2005
TRANSCRIPT

Voluntary Pension Plans in the United States
Dennis P. DuffyPrincipalThe Vanguard GroupMay 2005

> 2
Agenda
•Beneath the averages
•Myths & facts
•Savings adequacy
> 3
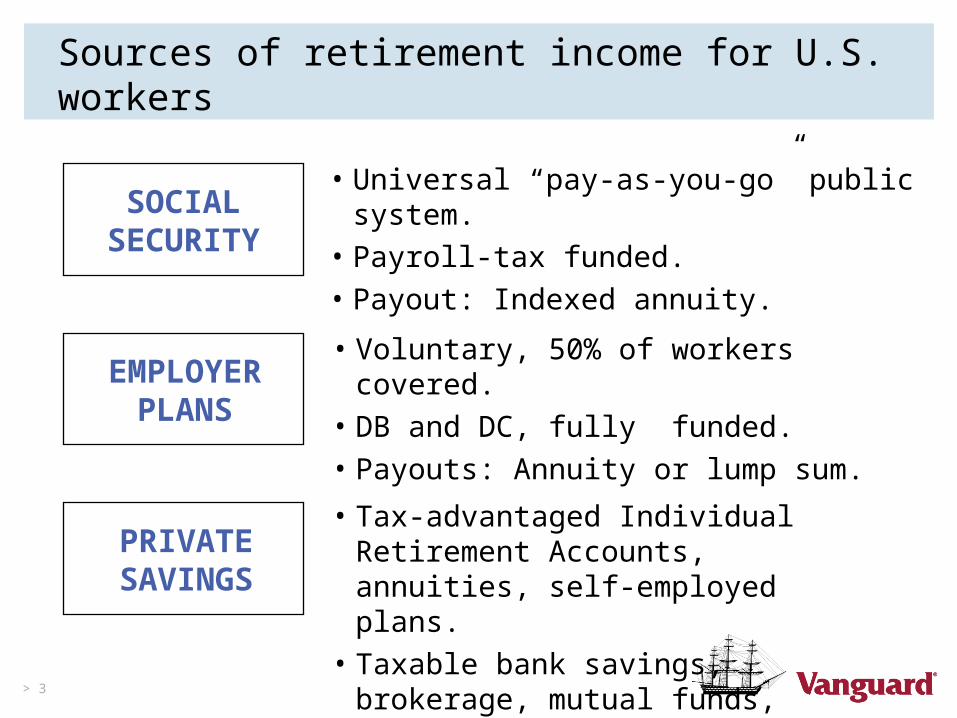
• Universal “pay-as-you-go” public system.
• Payroll-tax funded.
• Payout: Indexed annuity.
SOCIALSECURITY
Sources of retirement income for U.S. workers
EMPLOYER PLANS
PRIVATE SAVINGS
• Voluntary, 50% of workers covered.
• DB and DC, fully funded.
• Payouts: Annuity or lump sum.
• Tax-advantaged Individual Retirement Accounts, annuities, self-employed plans.
• Taxable bank savings, brokerage, mutual funds, insurance products.

> 4
What is a 401(k) plan?
•Employer-sponsored retirement savings plan
•Worker pre-tax contributions
•Employer contributions and/or matching contributions
•Tax-deferred growth
•Self-directed investment decisions
•Diverse investment selection

> 5
Retirement plan coverage—1975 to 2003
Source: DOL through 1998; Vanguard estimates thereafter.
0%
20%
40%
60%
80%
100%
1975 1980 1985 1990 1995 2000
DBDB/DC
DC
Private sector workforce age 16 and over
No Coverage

> 6
Plan participants—1985 to 2005
Source: DOL through 1998; Vanguard estimates thereafter.
Active participants (millions)
0
10
20
30
40
50
60
70
1985 1990 1995 2000 2005
DB (-1%)
DC (+3%)
401K* (+9%)
* 401K is subset of defined contribution figure.

> 7
Are U.S. workers saving for retirement?
69%72% 71%
68% 69%62%
58%62%61%61%
0%
20%
40%
60%
80%
100%
2001 2002 2003 2004 2005
Have Saved Money % Currently Save Money %
Source: Employee Benefit Research Institute and Mathew Greenwald & Associates, Inc., 2005 Retirement Confidence Survey
> 8
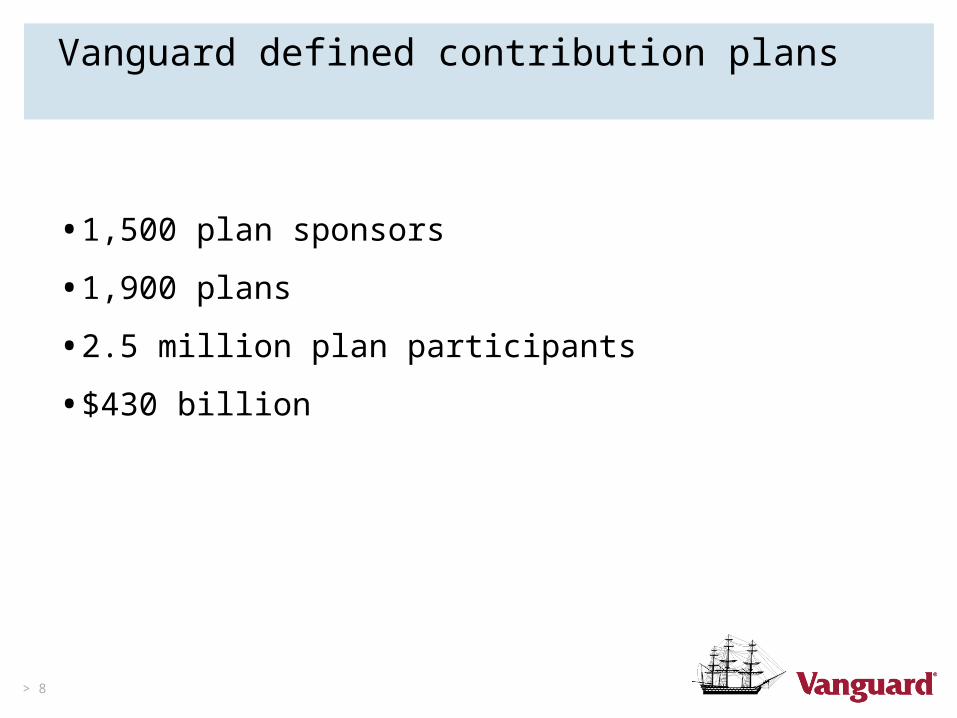
Vanguard defined contribution plans
•1,500 plan sponsors
•1,900 plans
•2.5 million plan participants
•$430 billion

> 9
Participation rates
76% 76% 75% 74%
65% 65% 66% 66%
76%
66%
0%
20%
40%
60%
80%
100%
2000 2001 2002 2003 2004 (Est.)
Average plan Average employee
Source: The Vanguard Group, 2005.

> 10
Participation rates—beneath the averages
•Of those under age 25, only 26% join.
•Of those earning less than $30,000, only 41% join.
•Of those with less than two years on the job, only 43% join. “Stayers are savers.”
Source: The Vanguard Group, 2005.
Bottom line: Across all plans, one-third of eligible participants fail to join.

> 11
Saving rates
7.17% 7.20% 7.22% 7.22% 7.25%
6.0% 6.0% 6.0% 6.0% 6.0%
0%
2%
4%
6%
8%
10%
2000 2001 2002 2003 2004 (Est.)
Average Median
Source: The Vanguard Group, 2005.

> 12
Saving rates—beneath the averages
•There is a group of strong savers:–25% of participants saved 10% or more.–10% of participants saved the maximum allowed.
•Yet 23% of participants saved 4% or less.
Source: The Vanguard Group, 2005.

> 13
Equity holdings
77%71%
64%69% 71%
78% 76%71%
67%71%
0%
20%
40%
60%
80%
100%
2000 2001 2002 2003 2004
Assets Contributions
Source: The Vanguard Group, 2005.

> 14
Equity holdings—beneath the averages
•13% of participants are 100% fixed income.
•20% of participants have all of their account in equities—right for some, but not for everyone.
•17% of participants have 20%+ in company stock—some have complementary DB/DC plan, but not always.
Source: The Vanguard Group, 2005.

> 15
Account balances
$48,718 $47,513 $45,634
$58,199
$65,216
$14,867 $15,388 $15,474
$21,182$23,811
$0
$20,000
$40,000
$60,000
$80,000
2000 2001 2002 2003 2004
Average Median
Source: The Vanguard Group, 2005.

> 16
Account balances—beneath the averages
•18% of participants had account balances greater than $100,000. Most were:
–Older –Long-tenured–And/or higher income
•36% of participants had account balances less than $10,000.
Source: The Vanguard Group, 2005.

> 17
Agenda
•Beneath the averages
•Myths & facts
•Savings adequacy

> 18
Myth
“Participants want more choice.”
> 19
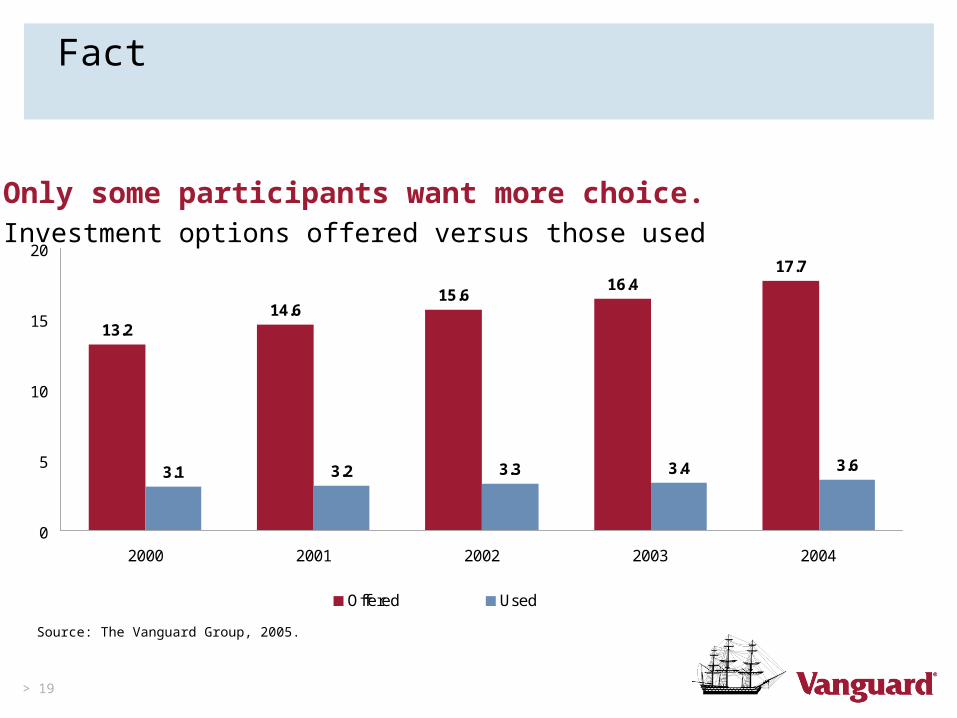
Fact
13.214.6
15.616.4
17.7
3.1 3.2 3.3 3.4 3.6
0
5
10
15
20
2000 2001 2002 2003 2004
Offered Used
Source: The Vanguard Group, 2005.
Only some participants want more choice.Investment options offered versus those used

> 20
Myth
“Enron heightened investor awareness of the risks of company stock.”

> 21
Fact
Source: The Vanguard Group, 2005.
In plans offering company stock
2000 2001 2002 2003 2004
Plans
% with company stock over 20% 34% 35% 34% 33% 34%
Participants
% with no company stock 33% 35% 34% 34% 34%
% with more than 20% 45% 43% 45% 44% 44%
Enron has had no discernable effect on company stock exposure.
> 22
Myth
“Mutual fund investors have experienced negativepersonal returns over the past few years.”
> 23
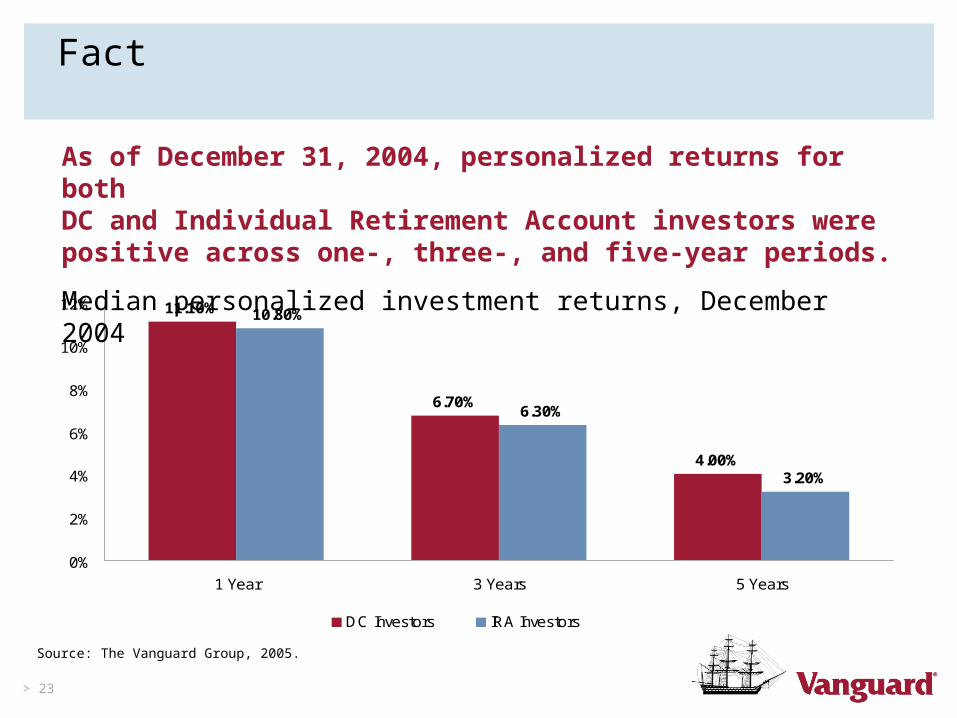
Fact
11.10%
6.70%
4.00%
10.80%
6.30%
3.20%
0%
2%
4%
6%
8%
10%
12%
1 Year 3 Years 5 Years
DC Investors IRA Investors
Source: The Vanguard Group, 2005.
As of December 31, 2004, personalized returns for bothDC and Individual Retirement Account investors were positive across one-, three-, and five-year periods.
Median personalized investment returns, December 2004

> 24
Fact
5%2%
6%
1%
32%
44%
17%
33%31%
29%
0%
10%
20%
30%
40%
50%
Less than 0 0 to 5% 5% to 10% 10% to 15% Greater than 15%
DC Investors IRA InvestorsSource: The Vanguard Group, 2005.
As of December 2004, five-year returns were positive or break-even for more than 80% of Vanguard DC plan investors and70% of Individual Retirement Account investors.
Distribution of 5-year personalized returns, 2000–2004

> 25
Agenda
•Beneath the averages
•Myths & facts
•Savings adequacy

> 26
The median participant today
•Age 44
•Income of $69,000
•Saving 9% (6% worker contribution + 3% employer match)
•Diversified equity-oriented portfolio
Today’s median balance$24,000
Single life annuity* $164 per month
*Current single-life annuity value if participant were 65 today.Source: The Vanguard Group, 2005.
> 27
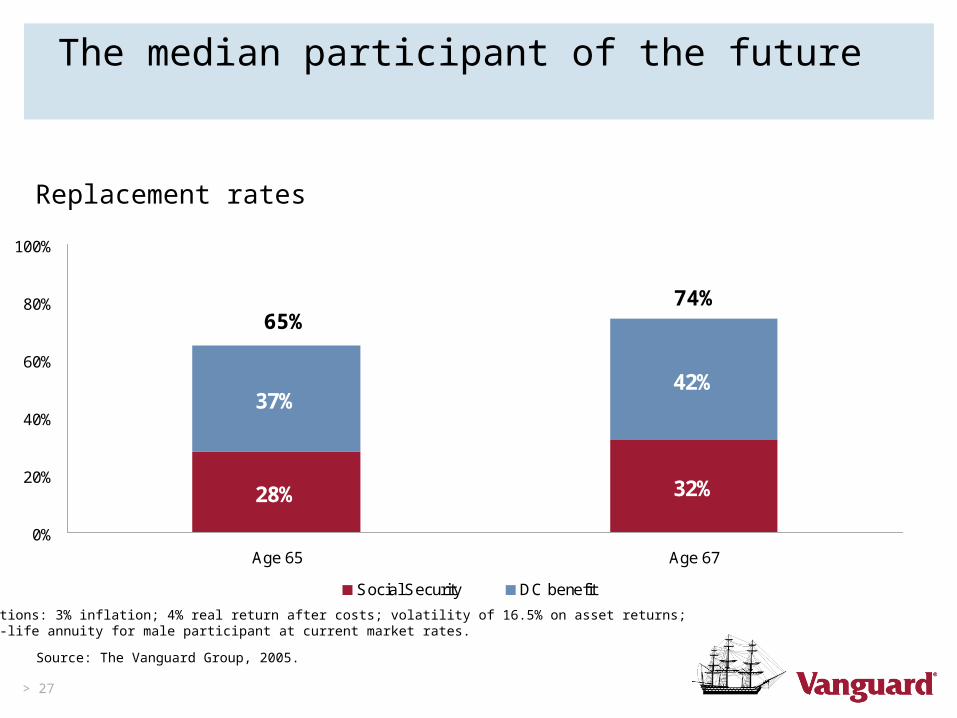
The median participant of the future
28% 32%
37%42%
0%
20%
40%
60%
80%
100%
Age 65 Age 67
Social Security DC benefit
65%74%
Assumptions: 3% inflation; 4% real return after costs; volatility of 16.5% on asset returns; single-life annuity for male participant at current market rates.
Replacement rates
Source: The Vanguard Group, 2005.

> 28
The real challenge
•Within DC plans–half are under-saving:–Non-participants–Low savers (one-quarter of participants at 4% or less)
•Within the retirement system as a whole, problems loom:–Higher health care costs–The demographic crisis facing Social Security
and Medicare
•Higher returns could help–but participants are already taking a significant equity risk.
> 29
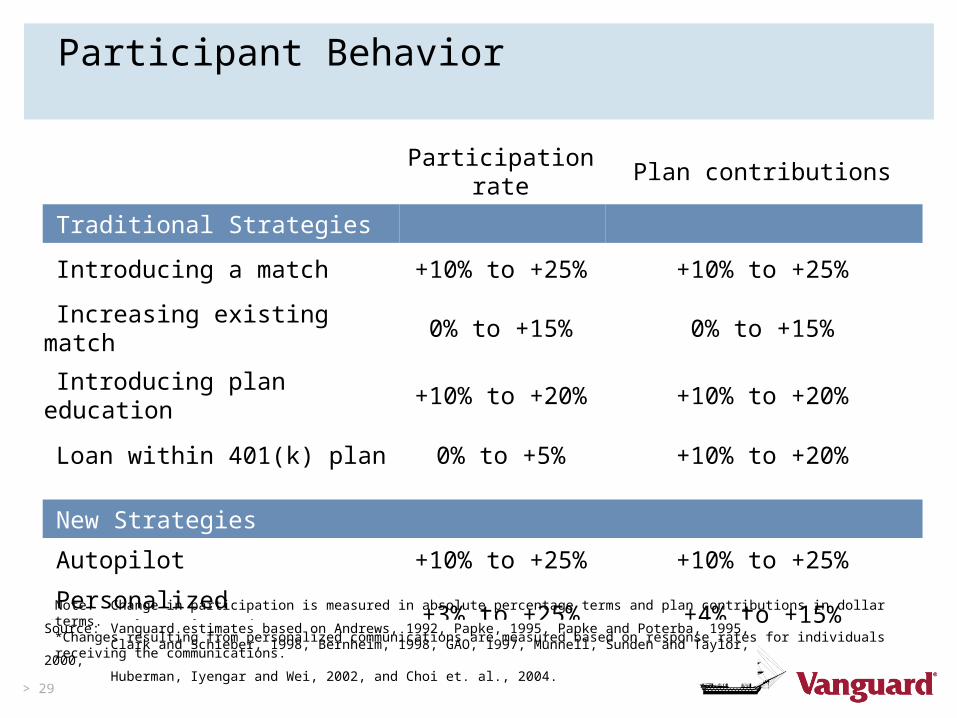
Participant Behavior
Participation rate Plan contributions
Traditional Strategies
Introducing a match +10% to +25% +10% to +25%
Increasing existing match 0% to +15% 0% to +15%
Introducing plan education +10% to +20% +10% to +20%
Loan within 401(k) plan 0% to +5% +10% to +20%
New Strategies
Autopilot +10% to +25% +10% to +25%
Personalized Communications* +3% to +25% +4% to +15%
Source: Vanguard estimates based on Andrews, 1992, Papke, 1995, Papke and Poterba, 1995, Clark and Schieber, 1998, Bernheim, 1998, GAO, 1997, Munnell, Sunden and Taylor, 2000,Huberman, Iyengar and Wei, 2002, and Choi et. al., 2004.
Note: Change in participation is measured in absolute percentage terms and plan contributions in dollar terms. *Changes resulting from personalized communications are measured based on response rates for individuals receiving the communications.

> 30
Vanguard’s innovative One Step® program
•Automatic enrollment
•Automatic savings rate increases
•Automatic investment in balanced fund
•Managed account advice programs
•Managed retirement programs
Autopilot 401(k): Default designs leading to optimized solutions for reluctant savers . . . while preserving choices for planners.

> 31
The bottom line
•The top-line statistics on DC savings look fine. Our challenge is to look beneath the averages.
•Top-line savings for the typical participant looks fine. If you’ve saved in the past, and continue to save in the future, you should
be okay.
•Yet, the real challenge remains among the non- and low-savers

> 32
Our collective challenge
“Twenty years from now, how many workers will complain that they have saved too much?”

> 33
Regulatory disclaimer
The performance data shown represent past performance, which is not a guarantee of future results. Investment returns and principal value will fluctuate, so investors’ shares, when sold, may be worth more or less than their original cost. For performance data current to the most recent month-end, which may be higher or lower than that cited, visit our website at www.vanguard.com.
For more information about Vanguard funds, visit www.vanguard.com or call 800-662-7447 to obtain a prospectus. Investment objectives, risks, charges, expenses, and other important information are contained in these documents; read and consider them carefully before investing.
The Vanguard Group, Vanguard, and the ship logo are trademarks of The Vanguard Group, Inc. All other marks are the exclusive property of their respective owners.
© 2005 The Vanguard Group, Inc. All rights reserved. Vanguard Marketing Corporation, Distributor.