volumes 113–116 (12 issues), spring 2004, issn: … · ... 48 international filter paper units...
TRANSCRIPT

AppliedBiochemistryand Biotechnology
AppliedBiochemistryand Biotechnology
Volumes 113–116 (12 Issues), Spring 2004, ISSN: 0273–2289
Executive Editor: Ashok Mulchandani
Biotechnologyfor Fuels and Chemicals
The Twenty-Fifth Symposium
Editors
Mark FinkelsteinJames D. McMillanBrian H. Davison
Barbara Evans
Biotechnologyfor Fuels and Chemicals
The Twenty-Fifth Symposium
Editors
Mark FinkelsteinJames D. McMillanBrian H. Davison
Barbara Evans

Fermentation of Quick Fiber 937
Applied Biochemistry and Biotechnology Vol. 113–116, 2004
Copyright © 2004 by Humana Press Inc.All rights of any nature whatsoever reserved.0273-2289/04/115/0937–0949/$25.00
937
*Author to whom all correspondence and reprint requests should be addressed.
Fermentation of “Quick Fiber” Producedfrom a Modified Corn-Milling Process
into Ethanol and Recovery of Corn Fiber Oil
BRUCE S. DIEN,*,1 NICK NAGLE,2 KEVIN B. HICKS,3VIJAY SINGH,4 ROBERT A. MOREAU,3 MELVIN P. TUCKER,2
NANCY N. NICHOLS,1 DAVID B. JOHNSTON,3MICHAEL A. COTTA,1 QUANG NGUYEN,2 AND RODNEY J. BOTHAST5
1National Center for Agricultural Utilization Research, USDA,†
Agricultural Research Service, 1815 North University Street,Peoria, IL 61604, E-mail: [email protected];
2Biotechnology Division for Fuels and Chemicals, National RenewableEnergy Laboratory, 1617 Cole Boulevard, Golden, CO 80401;
3Eastern Regional Research Center, USDA,Agricultural Research Service, Wyndmoor, PA 19038;
4Department of Agricultural Engineering, University of Illinois,Urbana, IL 61801; and
5National Corn to Ethanol Research Pilot Plant, SIU Edwardsville,1 N. Research Drive, Edwardsville, IL 62025
Abstract
Approximately 9% of the 9.7 billion bushels of corn harvested in theUnited States was used for fuel ethanol production in 2002, half of which wasprepared for fermentation by dry grinding. The University of Illinois hasdeveloped a modified dry grind process that allows recovery of the fiberfractions prior to fermentation. We report here on conversion of this fiber(Quick Fiber [QF]) to ethanol. QF was analyzed and found to contain 32%wtglucans and 65%wt total carbohydrates. QF was pretreated with dilute acidand converted into ethanol using either ethanologenic Escherichia coli strainFBR5 or Saccharomyces cerevisiae. For the bacterial fermentation the liquidfraction was fermented, and for the yeast fermentation both liquid and solidswere fermented. For the bacterial fermentation, the final ethanol concentra-tion was 30 g/L, a yield of 0.44 g ethanol/g of sugar(s) initially present in thehydrolysate, which is 85% of the theoretical yield. The ethanol yield withyeast was 0.096 gal/bu of processed corn assuming a QF yield of 3.04 lb/bu.
Posted with Permission

938 Dien et al.
Applied Biochemistry and Biotechnology Vol. 113–116, 2004
The residuals from the fermentations were also evaluated as a source of cornfiber oil, which has value as a nutraceutical. Corn fiber oil yields were8.28%wt for solids recovered following prtetreatment.
Index Entries: Bioethanol; corn fiber oil; Escherichia coli; pentose fermen-tations; Saccharomyces cerevisiae; β-glucosidase.
Introduction
In 2000, the United States produced more than 2 billion gallons offuel ethanol, and >95% of this was from processed corn (Renewable FuelsAssociation, 2003). Ethanol is used as a fuel oxygenate, to meet goalsrequired by the Clean Air Act 1990 amendment. Methyl tert-butyl ether(MTBE), which is made from petroleum-derived methanol, is the alterna-tive oxygenate. However, MTBE has been identified as a major ground-water pollutant, and the federal government is moving to ban its use ingasoline. Fuel ethanol from corn is expected to double because it will beneeded as a substitute for MTBE. Alternately, there is currently a proposalin the US Congress to relax the fuel oxygenate standard and require fuelethanol usage as part of a National Renewable Fuel Standard.
Corn is processed for ethanol production by wet milling and dry grind-ing. Dry grinding accounts for 60% of the processed corn, and dry grindproduction capacity is growing more rapidly than wet milling. This growthin dry grinding capacity can be traced to the establishment of co-operativesowned by farmers, who favor this process because capital costs are muchless than for wet mills. A major disadvantage of dry grinding compared towet milling is the production of fewer coproducts.
Dry grind plants produce the following coproducts in addition to etha-nol: carbon dioxide and a variety of high-fiber content animal feeds (1).Carbon dioxide is produced during the fermentation, but because of its lowselling price it is collected and sold by only a few of the dry grind ethanolprocessors. The animal feed products are manufactured from the fermen-tation residuals. The whole stillage is centrifuged or screened to yield dis-tillers’ wet grain (DWG) (more dense material) and thin stillage. The DWGis sometimes sold as is, but only locally because of its short shelf life. Moreoften, it is combined with condensed thin stillage, dried, and sold as distill-ers’ dried grains with solubles. By contrast, wet millers produce the follow-ing coproducts: corn oil, gluten meal, and corn gluten feed. Many wetmillers also produce a variety of products from the starch in addition toethanol. The final result is that the net cost of corn for ethanol productionis lower for a wet mill compared to a dry grind operation.
The University of Illinois is developing a modified milling process,which would allow recoveries of the germ and hull fractions prior to fer-mentation (2,3). The process involves soaking corn in water for a shortperiod of time (12 h). The process has the following advantages over drygrinding: the potential for recovery of corn oil from recovered germ, anincreased bioreactor capacity from prior separation of nonfermentables,

Fermentation of Quick Fiber 939
Applied Biochemistry and Biotechnology Vol. 113–116, 2004
and the ability to increase value and relative protein content for modifieddistillers’ wet grains with solubles. It has been estimated that the modifiedprocess could generate an additional revenue of 5–7 ¢/gal (4). The processis much less expensive to build than a traditional wet milling because of theshortened soaking time, fewer complex equipment needs, and avoidanceof sulfuric acid steeping.
In the modified milling process, following steeping, the corn is milledand the germ and pericarp fiber are separated from the starch and glutenusing hydroclones. The germ and pericarp fiber (quick fiber [QF]) arewashed to recover additional starch, dried, and separated from each otherby aspiration. The germ, which contains the corn oil, could be sold to an oilprocessor for extraction. The QF would be available for production of cornfiber oil, as well as an additional substrate for fermentation. Corn fiber oilhas potential as a valuable coproduct because this oil contains relativelyhigh levels of phytosterols (5–7), which have been shown to lower choles-terol in several animal studies (8,9). The phytosterol components includefree phytosterols (St), phytosterol fatty acyl esters (St:E), and ferulate phy-tosterol esters (FPE). Corn fiber oil also contains stanols, which have addi-tional value for lowering cholesterol.
QF has potential as a feedstock for ethanol fermentation because of itshigh carbohydrate content. A modified dry grind process that includes con-version of QF into ethanol is shown in Fig. 1. After fiber removal, the starchis liquefied, in part by jet cooking, and then undergoes simultaneous saccha-rification and fermentation (SSF1) to ethanol by the addition of yeast andglucoamylase. Converting QF to ethanol requires two additional processingsteps: pretreatment and a SSF (SSF2). The ethanol streams for the starch andfiber fermentations can be mixed prior to distillation (Fig. 1, dotted line).Pretreatment prepares the cellulose for enzymatic saccharification andhydrolyzes the other carbohydrate components (i.e., residual starch andhemicellulose) into free sugars. The cellulose is saccharified enzymaticallyby cellulase. Fermentation of the fiber hydrolysate is more complicated thancorn starch. The fiber contains a variety of carbohydrates including residualstarch, hemicellulose, and cellulose. Hydrolyzing corn hemicellulose pro-duces a mixture of sugars including arabinose, galactose, and xylose (ibid).
Fig. 1. Schematic of corn dry grind process with fiber conversion to ethanol. DDGS,distillers‘ dried grains with solubles.

940 Dien et al.
Applied Biochemistry and Biotechnology Vol. 113–116, 2004
Saccharomyces cerevisiae ferments neither arabinose nor xylose. For thepresent study, these sugars along with glucose were converted to ethanolusing recombinant ethanologenic Escherichia coli strain FBR5, which wasdeveloped by our laboratory (10,11). This strain has been metabolicallyengineered to convert a wide spectrum of sugars to ethanol. Typical ethanolyields are 94% or greater of theoretical (11). However, some mills may notwish to use recombinant organisms and, thus, fermentations were also car-ried out using S. cerevisiae. The yeast, however, is only capable of convertingthe sugars derived from cellulose and residual starch to ethanol.
Materials and Methods
Bacterial Strains, Growth Media, and Reagents
Media and protocols for routine maintenance of E. coli strain FBR5have been previously described (10). S. cerevisiae (Y-2034; ARS CultureCollection, Peoria, IL) was stored in 50% (v/v) glycerol stocks at –80ºC.The yeast culture was routinely maintained on YPD (10 g/L of yeastextract, 20 g/L of peptone, and 20 g/L of dextrose with 20 g/L of Difcoagar added for solid medium) and incubated at 32ºC.
Enzymes were supplied by Novozyme (US Office: Franklinton, NC)and included cellulase (Celluclast® 1.5 L; 48 international filter paper units[IFPU]/mL), β-glucosidase (Novozym® 188; 66.8 × 10³ IU/mL), andglucoamylase (Novozyme AMG300L). Sugars were purchased from Sigma(St. Louis, MO), and all other chemical and media reagents were from Fisher(Fairview, NJ).
Preparation of Quick Fiber
QF was prepared from no. 2 yellow dent corn as previously described(2,12). Briefly, corn (1 kg) was soaked in water (2 L) for 12 h at 59°C. Thecorn was ground in a blender at 40% full power for 3 min followed by 46%full power for an additional 3 min, so as to separate out but not damagethe germ. The germ, which is lighter than water, was isolated by flotation.The density of the remaining corn solution was adjusted by adding driedstarch until the fiber fraction floated and could be removed by skimmingoff the surface. The coarse fiber was washed twice with water to removeadded starch and stored at –20°C prior to hydrolysis.
Compositional Analysis of Biomass
Each sample was analyzed for moisture, carbohydrate, oil, and pro-tein contents. Moisture was measured by drying the samples at 105°C untilthey reached a stable weight. Oil was measured using AOAC method920.39 and protein by AOAC method 976.06, which is based on measuringtotal nitrogen. Starch was determined as previously reported (13). Arabi-nose and xylose were determined by hydrolyzing the biomass withtrifluoroacetic acid and analyzing for production of free sugars by high-
Fermentation of Quick Fiber 941
Applied Biochemistry and Biotechnology Vol. 113–116, 2004
performance liquid chromatography (HPLC) as described previously (14).Cellulose was determined using ASTM method E1758-95. Samples wereanalyzed for oil, protein, and starch by Analabs (Fulton, IL).
Optimizing Acid Loading for SSF Experiments
QF was pretreated with dilute acid for the S. cerevisiae SSF experiments.The amount of acid added per gram of biomass was optimized for completehydrolysis of the hemicellulose and subsequent enzymatic hydrolysis of thecellulose. The QF (1.2 g) was mixed with 16 mL of various dilute H2SO4
solutions (0–12 g H2SO4/100 g of biomass [dry basis, db]) to give a solidloading of 7.0% (w of biomass, db/total w). The mixture was placed instainless steel pipe reactors (40-mL working volume), which were placed ina fluidized sand bath (Model 01187-00 bath and 01190-72 temperature con-troller; Cole-Parmer, Vernon Hills, IL). The mixture was heated to and keptat 150ºC for 10 min before being quickly cooled in a water bath. The internalreactor temperature was monitored using a thermocouple probe insertedinto one of the pipe reactors. The pretreated material was transferred to atest tube, neutralized with Ca(OH)2 to pH 4.5, and citric acid buffer (pH 4.8,50 mM) was added along with cellulase (0.3 mL) and β-glucosidase (0.3 mL);the total enzyme loading was 24 IFPU/g of QF. Thymol (0.025 mg/mL) wasadded to prevent microbial contamination. The biomass samples were incu-bated at 45°C with agitation for 48 h in a water bath (Dubnoff MetabolicShaking Incubator; Precision Scientific, Chicago, IL). The hydrolysis reac-tions were sampled at 24 and 48 h for sugar concentrations. Each reactionwas run in duplicate.
S. cerevisiae SSFThe biomass was pretreated as already described for the cellulase
hydrolysis experiments with a 3.2% (w/w) H2SO4 loading. For SSF, 10.8 g(db) of pretreated material was placed in a 125-mL Erlenmeyer flask to whichthe following was added: cellulase (0.33% [v/v]), β-glucosidase (0.33% [v/v]),glucoamylase (0.046% [v/v]), and 10% (v/v) of a 10X YP stock (final concen-tration in medium: 10 g/L of Difco yeast extract, 20 g/L of Difco ProteosePeptone). The SSF was initiated by inoculation with S. cerevisiae to an OD600
of 0.5. The beginning solids for the SSF, including all additions, was 16.4%(w/w). The flasks were capped with rubber stoppers and pierced with a22-gage needle to exhaust CO2. The cultures were incubated at 32°C andagitated at 150 rpm (Refrigerated Innova® Shaker; New Brunswick Scien-tific, Edison, NJ) for 70 h. The fermentations were sampled each day forglucose and ethanol concentrations. All fermentations were run in duplicate.
E. coli FBR5 FermentationsThe QF was hydrolyzed using a different protocol than described for
the S. cerevisiae fermentations, and, furthermore, the cellulose fraction wasenzymatically hydrolyzed and fermented to ethanol. The QF was ground

942 Dien et al.
Applied Biochemistry and Biotechnology Vol. 113–116, 2004
with a coffee mill. The corn fiber was mixed with 1% (v/v) H2SO4 solutionat a ratio of 1.2 g (db) biomass to 5.0 mL, placed in a shallow Pyrex® dish,covered with aluminum foil, and heated at 121°C for 1 h. After beingallowed to cool, the liquid was separated from the solids by strainingthrough cheesecloth. The recovered liquid portion was then treated as fol-lows: first, the pH was adjusted to 10.0 by adding Ca(OH)2. Second, 1 g/Lof sodium bisulfite was added. Third, the liquid was warmed to 90°C andincubated at this temperature for 30 min. Finally, the liquid was neutralizedwith H2SO4 to pH 7.0. Following neutralization, the resulting precipitates,including gypsum, were removed by centrifugation (10,000g, 15 min). Therecovered liquid was filter sterilized through a 0.22-µm membrane filter.
Bacterial fermentations were carried out in minibioreactors withautomatic pH control that were constructed and operated as describedpreviously (14,15). Each 500-mL Fleaker® culture vessel contained 170 mLof hydrolysate supplemented with 20 mL of a 10X Luria-Bertani solution(10 g/L of tryptone and 5 g/L of yeast extract) and antifoam 289(0.1 mL/L). Nitrogen was bubbled through the medium for 30 min prior toinoculation to remove oxygen. The fermentation vessels were each inocu-lated with a 5% (v/v) inoculum from an anaerobic culture of E. coli FBR5grown overnight at 37°C. Fermentations were run at 35°C and stirred mag-netically with 1 × 1 in. “X”-shaped stir bars at 300 rpm. The pH was set at6.5 and maintained by the addition of a concentrated base solution (4 NKOH). Ethanol, sugars, organic acids, and optical densities (ODs) (550 nm)were determined periodically with 1.5-mL samples of cultures. Eachexperiment was run in duplicate.
Analytical Procedures
Activities for cellulase (FPU/mL) and β-glucosidase (IU/mL) weremeasured by the methods described previously (16,17). ODs (1-cm lightpath) of cultures were monitored on a Beckman DU-640 Spectrophotometer(Fullerton, CA) at 550 (E. coli) or 660 nm (S. cerevisiae). Concentrations ofsugars and ethanol were determined by HPLC using an Aminex HPX-87Hcolumn (300 × 7.8 mm; Bio-Rad, Richmond, CA) and refractive index detec-tor. Samples were run at 65°C and eluted at 0.6 mL/min with 5 mM H2SO4.
Calculations
Ethanol yields and productivities for the fermentations were deter-mined as previously described (18). Ethanol yields for the QF are alsoreported on a per-bushel-of-corn-processed basis. The ethanol yield equa-tion, which is similar to those derived in ref. 19, is as follows.
Ethanol gal/bu = Dry Mass Yield lb/bu corn × Carbohydrate Yield lb/lb biomass
× 1.11 lb free sugar/lb anhydrous sugar
× Fermentation Yield lb ethanol/lb fermented sugar
÷ 6.58 lb ethanol/gal ethanol

Fermentation of Quick Fiber 943
Applied Biochemistry and Biotechnology Vol. 113–116, 2004
The dry biomass yield for QF (db) was assumed to be 3.04 lb/bu. Thedata on carbohydrate composition for QF (db) are provided in Table 1. Thefermentation yield for a theoretical ethanol yield is 0.51 lb of ethanol/lb ofsugar(s).
Results and DiscussionComposition of QF
QF samples contained 15% (w/w) starch and 17% cellulose (Table 1).The total carbohydrate composition was 65%. Protein and oils accountedfor 12%. The components measured account for 78% of the dried material,the residual material (not tested for) includes ash, extractables, lignin,and lipids. The composition of the QF was, as expected, similar to thatfound for corn fiber. Corn fiber and QF are both derived from the pericarpand tip portions of the kernel. Most notably, the QF contained approx thesame amount of residual starch, which suggests that the modified millingprocess is as effective at separating starch from the pericarp as a full steep-ing protocol. Starch recovery is significantly improved compared to pre-vious results for which the starch content of the QF was 42–46% w/w (2).The current study used an improved process that included an additionalstarch washing step.
Pretreatment and SSF of QF Using S. cerevisiae
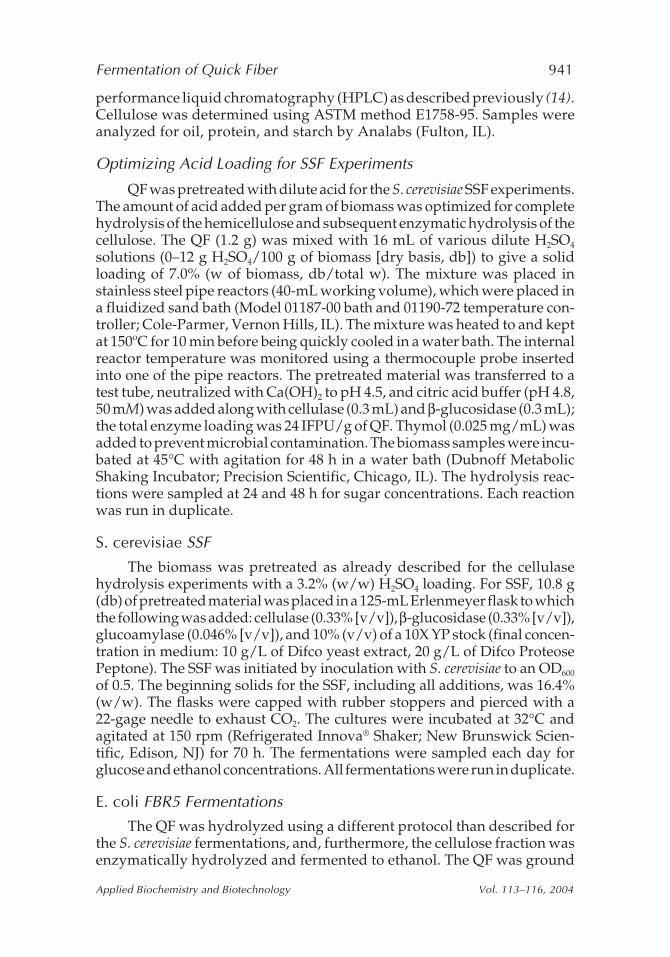
The noncellulose carbohydrates present in QF were converted directlyto free sugars by hydrolyzing with dilute H2SO4. Cellulose was hydrolyzedenzymatically using industrial cellulase preparations. QF was pretreated atvarious sulfuric acid loadings (0–4.8% g of H2SO4/g biomass [db]) to deter-mine the optimal amount required for complete hydrolysis. The tempera-ture for the pretreatment was set at 150°C as suggested (20) for the similarsubstrate of corn fiber. The glucose yield was maximum (92% of starch andcellulose recovered as glucose) at acid loadings of 0.8–3.2% (w/w) (Table 2).
Table 1Comparison of QF and Corn Fibera
Corn fiber QFComponent (% w/w db)a (% w/w db)
Starch 11–23 15Cellulose 12–18 17Xylan 18–28 22Arabinan 11–19 11Protein 11–12 11Oil 2 1
aData from ref. 25.

944 Dien et al.
Applied Biochemistry and Biotechnology Vol. 113–116, 2004
Maximum yields for arabinose (98% of available arabinose recovered as freesugar) and xylose (98% of xylan recovered as xylose) occurred at 3.2% (w/w)(Table 2). These percentage yields correspond to recoveries of 0.11 g of ara-binose, 0.38 g of glucose, and 0.22 g of xylose/g of QF (db). Heating, evenwithout adding a mineral acid, was sufficient to recover 0.32 g of glucose/gof QF (db) or 75% of the available glucan.
For the yeast fermentations, QF was treated at a high solid loading(14.1% w biomass [db]/total w) and an acid loading of 3.2% (w/w). Thehighest possible solid loading was used, such that the material formed amixable slurry. The pretreated QF was neutralized; mixed with cellulase,β-glucosidase, and glucoamylase (to ensure complete starch hydrolysis);and inoculated with S. cerevisiae. The cellulase loading was 15 FPU/g ofcellulose. The native β-glucosidase activity of the cellulase mixture wassupplemented because adding extra β-glucosidase activity has beenreported to enhance the rate of SSF (21). The combined hydrolysis andfermentation was completed within 72 h (Fig. 2), and the final ethanol con-centration was 23.4 ± 0.1 g/L. The ethanol yield was 0.153 g of ethanol/g ofQF (db) or 85 ± 1% of maximum ethanol possible based on the total amountof glucans added and the theoretical ethanol yield from glucose. Assumingthat 3.04 lb (db) of QF is recovered per bushel of corn, the fermentationresults suggest that an additional 0.096 gal of ethanol/bu can be gained byfermenting QF with S. cerevisiae. The theoretical yield, based on the totalglucan composition of QF, is 0.113 gal/bushel of corn.
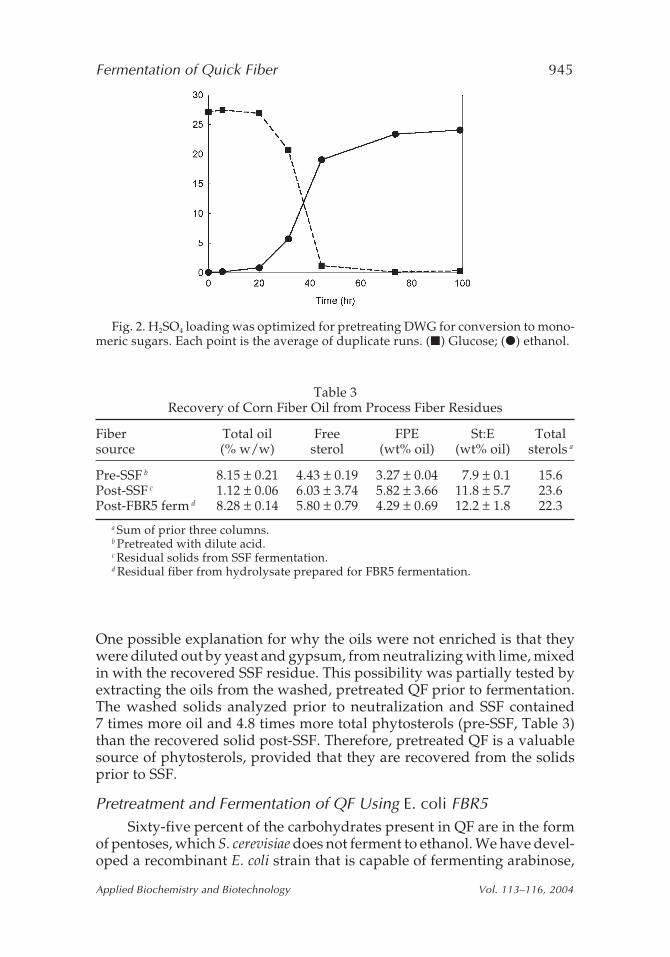
The oils present in the QF differ from those found in the germ (corn oil)and in particular are enriched for phytosterols, which are cholesterol-low-ering agents (5–9). A prior study with corn fiber demonstrated that the oilswithstood dilute-acid) pretreatment and became enriched in the pretreatedsolids (22). Therefore, it was of interest to determine whether dilute-acid-pretreated QF solids might also serve as a source for these valuablenutraceutical chemicals. Following SSF, the solids residue was recoveredand analyzed for the presence of oils. It was determined that only 1.12% oilswas present in the residual solids (post-SSF, Table 3), which is comparablewith that found in untreated QF (1.24–3.49% oil as noted in ref. 2).
Table 2Dilute Acid Hydrolysis and Saccharification of QF
Acid Loading Glucose Xylose Arabinose pH after(% w/w)a (%)b (%) (%) heating
0 7 5 ± 0 16 ± 0 39 ± 0 4.41 ± 0.070.8 92 ± 2 50 ± 6 77 ± 2 2.78 ± 0.001.6 90 ± 1 74 ± 9 86 ± 3 2.12 ± 0.073.2 92 ± 3 98 ± 6 98 ± 4 1.89 ± 0.074.8 87 ± 4 98 ± 8 87 ± 0 1.56 ± 0.09
a % g of H2SO4/g of biomass.b % of theoretical yield.
Fermentation of Quick Fiber 945
Applied Biochemistry and Biotechnology Vol. 113–116, 2004
One possible explanation for why the oils were not enriched is that theywere diluted out by yeast and gypsum, from neutralizing with lime, mixedin with the recovered SSF residue. This possibility was partially tested byextracting the oils from the washed, pretreated QF prior to fermentation.The washed solids analyzed prior to neutralization and SSF contained7 times more oil and 4.8 times more total phytosterols (pre-SSF, Table 3)than the recovered solid post-SSF. Therefore, pretreated QF is a valuablesource of phytosterols, provided that they are recovered from the solidsprior to SSF.
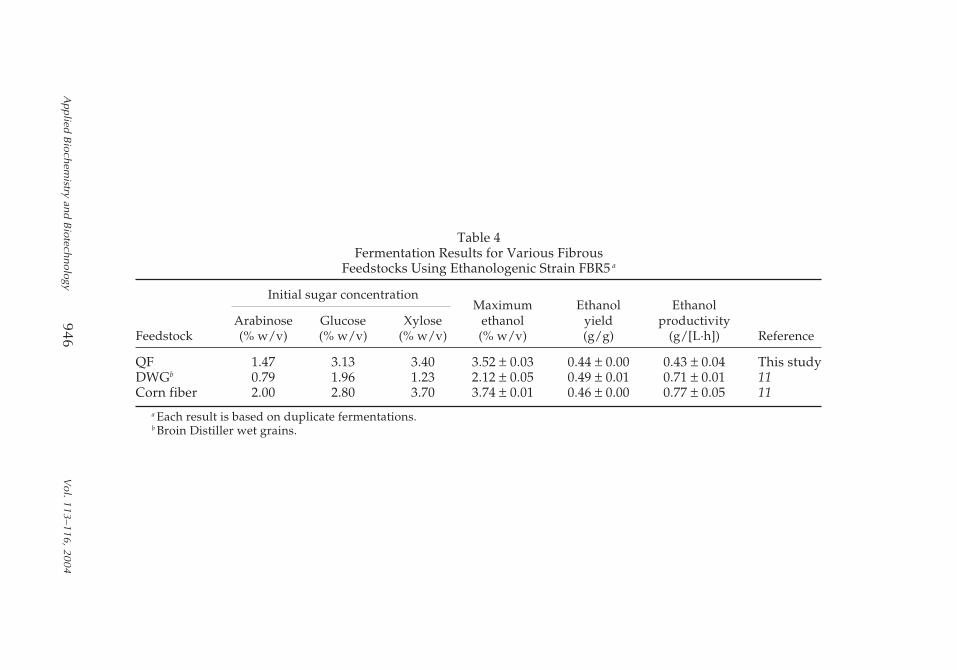
Pretreatment and Fermentation of QF Using E. coli FBR5Sixty-five percent of the carbohydrates present in QF are in the form
of pentoses, which S. cerevisiae does not ferment to ethanol. We have devel-oped a recombinant E. coli strain that is capable of fermenting arabinose,
Fig. 2. H2SO4 loading was optimized for pretreating DWG for conversion to mono-meric sugars. Each point is the average of duplicate runs. (�) Glucose; (�) ethanol.
Table 3Recovery of Corn Fiber Oil from Process Fiber Residues
Fiber Total oil Free FPE St:E Totalsource (% w/w) sterol (wt% oil) (wt% oil) sterols a
Pre-SSF b 8.15 ± 0.21 4.43 ± 0.19 3.27 ± 0.04 7.9 ± 0.1 15.6Post-SSF c 1.12 ± 0.06 6.03 ± 3.74 5.82 ± 3.66 11.8 ± 5.7 23.6Post-FBR5 ferm d 8.28 ± 0.14 5.80 ± 0.79 4.29 ± 0.69 12.2 ± 1.8 22.3
a Sum of prior three columns.b Pretreated with dilute acid.c Residual solids from SSF fermentation.d Residual fiber from hydrolysate prepared for FBR5 fermentation.
946D
ien et al.
Applied B
iochemistry and B
iotechnologyV
ol. 113–116, 2004946
Table 4Fermentation Results for Various Fibrous
Feedstocks Using Ethanologenic Strain FBR5 a
Initial sugar concentrationMaximum Ethanol Ethanol
Arabinose Glucose Xylose ethanol yield productivityFeedstock (% w/v) (% w/v) (% w/v) (% w/v) (g/g) (g/[L·h]) Reference
QF 1.47 3.13 3.40 3.52 ± 0.03 0.44 ± 0.00 0.43 ± 0.04 This studyDWGb 0.79 1.96 1.23 2.12 ± 0.05 0.49 ± 0.01 0.71 ± 0.01 11Corn fiber 2.00 2.80 3.70 3.74 ± 0.01 0.46 ± 0.00 0.77 ± 0.05 11
a Each result is based on duplicate fermentations.b Broin Distiller wet grains.

Fermentation of Quick Fiber 947
Applied Biochemistry and Biotechnology Vol. 113–116, 2004
glucose, and xylose into ethanol (10). The same pretreatment protocol wasused for the present experiments as had been used previously for corn fiberproduced by wet milling. Unlike the protocol described herein for theS. cerevisiae fermentations, only the liquid portion of the pretreated mate-rial was fermented to avoid a high solids content in the bioreactor. Cellulasewas not added to the hydrolysate because cellulose partitions with thesolids. The recovered liquid fraction from the hydrolysate contained 9.4%(w/v) total sugars (data not shown). E. coli FBR5 fermented all of the ara-binose, glucose, and much of the xylose into ethanol (Fig. 3A). The finalethanol concentration was 3.51% (w/v), which is equal to 85% of the theo-retical maximum ethanol yield based on the beginning sugar concentrationof the medium (Table 4). The remaining 15% of the sugar(s) not convertedto ethanol can be accounted for as residual xylose. The overall ethanol yieldfor FBR5 was 0.116 g of ethanol/g of QF (db).
Fig. 3. (A) SSF of pretreated DWG with S. cerevisiae. Fermentations were per-formed in duplicate. (B) Fermentation of DWG liquid hydrolysate with E. coli FBR5.Fermentations were performed in duplicate. (�) Xylose; (�) glucose; (�) arabinose;(�) ethanol.

948 Dien et al.
Applied Biochemistry and Biotechnology Vol. 113–116, 2004
A sugar mixture was prepared at a concentration similar to that of theQF hydrolysate using reagent-grade sugars. Fermentation of this sugarmixture served as a control. In contrast to the hydrolysate, all of the sugarswere readily fermented (Fig. 3B), and the final production yield was 98% oftheoretical. Furthermore, the ethanol productivity of the control fermenta-tions was 57% faster than that of the hydrolysate. The difference in yieldand rate can be attributed to microbial inhibitors that are formed during thehydrolysate preparation process (23,24). Numerous inhibitors are formedduring pretreatment and hydrolysis, and their effects are synergetic. Oneinhibitor that was detected in the QF was acetic acid (5 g/L), which arosefrom the acetyl side groups on the hemicellulose.
The additional yield per bushel of corn realized with FBR5 was 0.055gal/bu. Ideally, 0.126 gal/bu would be realized by converting all of thepentosans and starch to ethanol at the theoretical ethanol yield (0.51 g ofethanol/g of fermented sugars). However, most of the loss in yield (73%)is associated with the pretreatment step. Fermentable sugars are lost dur-ing pretreatment by failing to recover all of the free sugars from the solidcake. The solids were not washed so as not to dilute the recovered sugars.Sugars can also be lost during pretreatment by degradation reactions; how-ever, very little furfural and hydroxymethylfurfural were detected byHPLC in the hydrolysate (data not shown).
The residual solids from the QF pretreated for the FBR5 fermentationwere analyzed for their oil content. The total oil content for the washed cake(Table 3) was 8.28% (w/dw) and the yield of total phytosterols was equalto 1.89% (w/dw). The yield compared favorably to that of an earlier studyin which corn fiber was pretreated with dilute H2SO4 for which the yield oftotal phytosterols was 1.43% (w/dw) (22). The pretreatment step concen-trated the total phytosterols 26 times compared to untreated QF (2).
As noted previously, QF is derived from the pericarp fraction of thecorn. In dry grinding and wet milling, this fraction ends up in the DWG andcorn fiber, respectively (1). Both of these feedstocks have been converted toethanol using E. coli FBR5 own this laboratory using the same protocol asdescribed herein for QF (Table 4). Strain FBR5 produced the highest ethanolconcentrations from corn fiber and QF, as expected because the preparedhydrolysates had approximately twice the concentration of sugars of theDWG. The ethanol production yields were also similar for corn fiber andQF, 86–90% of theoretical. However, FBR5 fermented the QF hydrolysateat a much slower rate (44% slower based upon average productivity) thanthe corn fiber hydrolysate. The slower rate suggests that the QF hydroly-sate was more inhibitory to fermentation than the corn fiber. This result wasunexpected and suggests that some difference in the collection of the twomaterials may be responsible. Possibly, the conventional steeping process“washes away” an inhibitor that is not removed during the much gentlersteeping used to produce QF. One solution may be to include an additionalstep to further remove the inhibitors present following hydrolysis in addi-tion to overliming.
Fermentation of Quick Fiber 949
Applied Biochemistry and Biotechnology Vol. 113–116, 2004
Acknowledgments
We wish to thank Patricia J. O’Bryan and Loren Iten for their finetechnical assistance.
References
1. Dien, B. S., Bothast, R. J., Nichols, N. N., and Cotta, M. A. (2002), Int. Sugar J.104(1241), 204–207.
2. Singh, V., Moreau, R. A., Doner, L. W., Eckhoff, S. R., and Hicks, K. B. (1999), CerealChem. 76(6), 868–872.
3. Wahjudi, J., Xu, L., Wang, P., Singh, V., Buriak, P., Rausch, K. D., Mcaloo, A. J.,Tumbleson, M. E., and Eckhoff, S. R. (2000), Cereal Chem. 77(5), 640–644.
4. Taylor, F., Mcaloon, A. J., Craig, J. C., Yang, P., Wahjudi, J., and Eckhoff, S. R. (2001),Appl. Biochem. Biotechnol. 94(1), 41–49.
5. Moreau, R. A., Hicks, K. B., and Norton, R. A. (1998), US patent no. 5,843,499.6. Moreau, R. A., Powell, M. J., and Hicks, K. B. (1999), J. Agric. Food Sci. 44, 2149–2154.7. Moreau, R. A., Singh, V., Nunez, A., and Hicks, K. B. (2000), Biochem. Soc. Trans. 28,
803–806.8. Hicks, K. B. and Moreau, R. A. (2001), Food Technol. 55(1), 63–67.9. Moreau, R. A., Whitaker, B. D., and Hicks, K. B. (2002), Prog. Lipid Res. 41(6), 457–500.
10. Dien, B. S., Hespell, R. B., Wyckoff, H. A., and Bothast, R. J. (1998), Enzyme Micro.Technol. 23(6), 366–371.
11. Dien, B. S., Nichols, N. N., O’Bryan, P. J., and Bothast, R. J. (2000), Appl. Biochem.Biotechnol. 84–86, 181–196.
12. Singh, V. and Eckhoff, S. R. (1996), Cereal Chem. 73(6), 716–720.13. Dien, B. S., Bothast, R. J., Iten, L. B., Barrios, L., and Eckhoff, S. R. (2002), Cereal Chem.
79(4), 582–585.14. Dien, B. S., Hespell, R. B., Ingram, L. O., and Bothast, R. J. (1997), World J. Microbiol.
Biotechnol. 13(6), 619–625.15. Beall, D. S., Ohta, K., and Ingram, L. O. (1991), Biotechnol. Bioeng. 38(3), 296–303.16. Ghose, T. K. (1987), Pure Appl. Chem. 59(2), 257–268.17. Hespell, R. B., Wolf, R., and Bothast, R. J. (1987), Appl. Environ. Microbiol. 53(12),
2849–2853.18. Nichols, N. N., Dien, B. S., and Bothast, R. J. (2001), Appl. Microbiol. Biotechnol. 56(1–2),
120–125.19. Gulati, M., Kohlmann, K., Ladisch, M. R., Hespell, R., and Bothast, R. J. (1996),
Bioresour. Technol. 58(3), 253–264.20. Grohmann, K. and Bothast, R. J. (1997), Process Biochem. 32(5), 405–415.21. Grohmann, K. (1993), in Bioconversion of Forest and Agricultural Plant Residues, 1st Ed.,
Saddler, J. N., ed., C.A.B. International, Wallingford, UK, pp. 183–210.22. Singh, V., Johnston, D. B., Moreau, R. A., Hicks, K. B., Dien, B. S., and Bothast, R. J.
(2003), Cereal Chem. 80(2), 126–129.23. Palmqvist, E. and Hahn-Hagerdal, B. (2000), Bioresour. Technol. 74(1), 17-24.24. Palmqvist, E. and Hahn-Hagerdal, B. (2000), Bioresour. Technol. 74(1), 25–33.25. Leathers, T. D. (1998), Soc. Ind. Microbiol. News 48(5), 210–217.