volume on routes
TRANSCRIPT
%%%%
""""
""""
%%%%
%%%%
""""
%%%%
%%%%
%%%%
%%%%
""""
%%%%%%%%
%%%%
""""""""%%%%
%%%%
%%%%
%%%%
%%%%
%%%%
""""""""
%%%%
%%%%
%%%%
%%%%
%%%%
%%%%
%%%%
%%%%
""""
%%%%
%%%%
%%%% %%%%
%%%%
%%%%
%%%%
%%%%%%%%
%%%%
""""
%%%%
"""""""" """"
%%%%
%%%%""""
%%%%%%%%%%%%
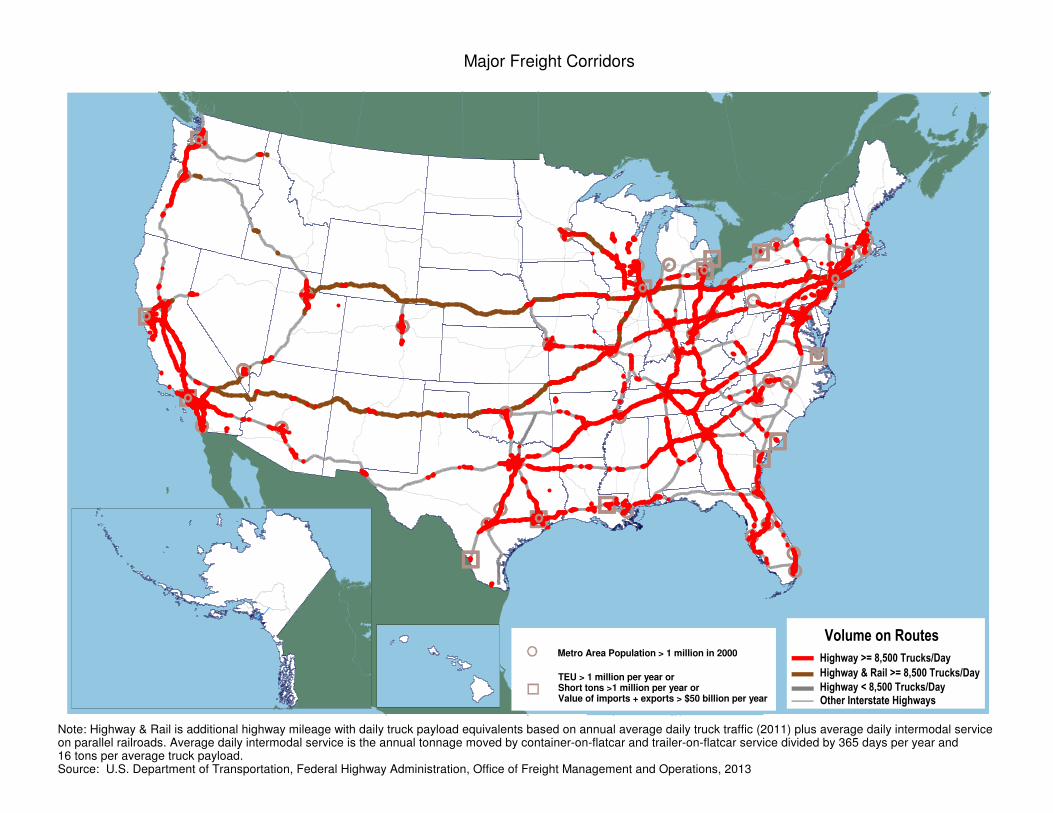
Major Freight Corridors
Note: Highway & Rail is additional highway mileage with daily truck payload equivalents based on annual average daily truck traffic (2011) plus average daily intermodal serviceon parallel railroads. Average daily intermodal service is the annual tonnage moved by container-on-flatcar and trailer-on-flatcar service divided by 365 days per year and16 tons per average truck payload.Source: U.S. Department of Transportation, Federal Highway Administration, Office of Freight Management and Operations, 2013
Metro Area Population > 1 million in 2000
TEU > 1 million per year orShort tons >1 million per year orValue of imports + exports > $50 billion per year
Volume on Routes
Highway >= 8,500 Trucks/Day
Highway & Rail >= 8,500 Trucks/Day
Highway < 8,500 Trucks/DayOther Interstate Highways