volume nucleation rates for homogeneous freezing · acpd 9, 22883–22927, 2009 volume nucleation...
TRANSCRIPT
ACPD9, 22883–22927, 2009
Volume nucleationrates for
homogeneousfreezing
M. E. Earle et al.
Title Page
Abstract Introduction
Conclusions References
Tables Figures
J I
J I
Back Close
Full Screen / Esc
Printer-friendly Version
Interactive Discussion
Atmos. Chem. Phys. Discuss., 9, 22883–22927, 2009www.atmos-chem-phys-discuss.net/9/22883/2009/© Author(s) 2009. This work is distributed underthe Creative Commons Attribution 3.0 License.
AtmosphericChemistry
and PhysicsDiscussions
This discussion paper is/has been under review for the journal Atmospheric Chemistryand Physics (ACP). Please refer to the corresponding final paper in ACP if available.
Volume nucleation rates forhomogeneous freezing in supercooledwater microdroplets: results from acombined experimental andmodelling approach
M. E. Earle1,*, T. Kuhn1,**, A. F. Khalizov1,***, and J. J. Sloan1
1Department of Earth and Environmental Sciences, University of Waterloo,Waterloo, ON, Canada*now at: Cloud Physics and Severe Weather Research Section, Environment Canada,Toronto, ON, Canada**now at: Department of Space Science, Lulea Technical University, Kiruna, Sweden
22883
ACPD9, 22883–22927, 2009
Volume nucleationrates for
homogeneousfreezing
M. E. Earle et al.
Title Page
Abstract Introduction
Conclusions References
Tables Figures
J I
J I
Back Close
Full Screen / Esc
Printer-friendly Version
Interactive Discussion
∗∗∗now at: Department of Atmospheric Sciences, Texas A&M University, College Station, TX,USA
Received: 28 August 2009 – Accepted: 13 October 2009 – Published: 28 October 2009
Correspondence to: J. J. Sloan ([email protected])
Published by Copernicus Publications on behalf of the European Geosciences Union.
22884
ACPD9, 22883–22927, 2009
Volume nucleationrates for
homogeneousfreezing
M. E. Earle et al.
Title Page
Abstract Introduction
Conclusions References
Tables Figures
J I
J I
Back Close
Full Screen / Esc
Printer-friendly Version
Interactive Discussion
Abstract
Temperature-dependent volume nucleation rate coefficients for supercooled waterdroplets, JV (T ), are derived from infrared extinction measurements in a cryogenic lam-inar aerosol flow tube using a microphysical model. The model inverts water and iceaerosol size distributions retrieved from experimental extinction spectra by considering5
the evolution of a measured initial droplet distribution via homogeneous nucleation andthe exchange of vapour-phase water along a well-defined temperature profile. Exper-iment and model results are reported for supercooled water droplets with mode radiiof 1.0, 1.7, and 2.9µm. Values of mass accommodation coefficients for evaporationof water droplets and vapour deposition on ice particles are also determined from the10
model simulations. The coefficient for ice deposition was found to be approximately0.031, while that for water evaporation was 0.054. Results are considered in termsof the applicability of classical nucleation theory to the freezing of micrometre-sizeddroplets in cirrus clouds, with implications for the parameterization of homogeneousice nucleation in numerical models.15
1 Introduction
Cirrus clouds play a significant role in Earth’s radiative balance due to their interactionswith incident solar and surface-emitted thermal radiation (Liou, 1986). The radiativeinfluence of cirrus clouds is predicated on the concentrations, sizes, and shapes of theconstituent ice particles (Lawson et al., 2006). Microphysical schemes in numerical20
models used to quantify and predict this influence require detailed parameterizationsof the processes involved in ice initiation. Primary ice formation by homogeneousand/or heterogeneous nucleation provides an important starting point for describing theevolution of cloud properties due to mass-transfer evaporation/growth (the Bergeron-Findeisen process) and agglomeration/riming. Thus, ice nucleation processes in cirrus25
clouds continue to be an active area of atmospheric research.
22885

ACPD9, 22883–22927, 2009
Volume nucleationrates for
homogeneousfreezing
M. E. Earle et al.
Title Page
Abstract Introduction
Conclusions References
Tables Figures
J I
J I
Back Close
Full Screen / Esc
Printer-friendly Version
Interactive Discussion
At temperatures below about 235 to 237 K, cirrus ice is formed primarily by homo-geneous nucleation of aqueous droplets (Heymsfield et al., 2005). In the classicalapproach, homogeneous nucleation is considered to occur within the bulk volume ofan aqueous droplet (Turnbull and Fisher, 1949), with a temperature-dependent ratecoefficient, JV (T ), having units of cm−3 s−1. Numerous laboratory studies have been5
conducted to determine atmospherically-relevant values of the nucleation rate coeffi-cient. The bulk of this experimental work has focussed on the freezing of pure waterdroplets as a model system for ice formation in cirrus clouds and as a fundamentaltesting ground for the predictions of classical nucleation theory. Using water dropletssuspended in air (Demott and Rogers, 1990; Duft and Leisner, 2004; Kramer et al.,10
1999; Stockel et al., 2005) and various oils (Butorin and Skripov, 1972; Taborek, 1985),values of JV (T ) were determined from experimental measurements employing a rangeof droplet sizes and freezing detection methods.
The experimentally-determined rate coefficients from the pure water studies are ingeneral agreement with classical nucleation theory (Pruppacher, 1995). In some in-15
stances, however, there are large discrepancies among the results obtained from dif-ferent studies; for example, there is a spread of over five orders of magnitude in val-ues obtained at 240 K (Tabazadeh et al., 2002b). For some time, it has been unclearwhether these large discrepancies were due solely to systematic differences in theexperimental techniques and/or errors, or to some deficiency in the classical, volume-20
based approach for deriving nucleation rate coefficients from freezing data. The latternotion has been discussed recently, following the proposal that in some cases, crystalnucleation at the droplet surface is thermodynamically favoured over nucleation withinthe bulk volume (Djikaev et al., 2002; Tabazadeh et al., 2002a, b). The thermodynamicbasis for surface nucleation is the potential decrease in surface energy when at least25
one of the crystal faces is in contact with the surrounding medium (air or oil in the rele-vant experimental studies), rather than the bulk liquid. The corresponding dependenceon droplet surface area necessitates the introduction of a second, surface-specific ratecoefficient, JS (T ), with units of cm−2 s−1.
22886
ACPD9, 22883–22927, 2009
Volume nucleationrates for
homogeneousfreezing
M. E. Earle et al.
Title Page
Abstract Introduction
Conclusions References
Tables Figures
J I
J I
Back Close
Full Screen / Esc
Printer-friendly Version
Interactive Discussion
The total nucleation rate, Jt, has units of s−1 and is the sum of contributions fromvolume- and surface-based processes:
Jt=JV V + JSS (1)
where V and S are the volume and surface area of the droplets, respectively. Therelative contributions of each nucleation process depend on the nature of the interface5
with the droplet (air or oil) and droplet size (Tabazadeh et al., 2002b). The contributionof surface nucleation is expected to increase with decreasing particle size, because ofthe increasing surface-to-volume ratio. Duft and Leisner (2004) determined JV valuesfor 19 and 49µm (radius) droplets levitated (in air) in an electrodynamic balance, andsuggested that surface nucleation will only be important for particles with radii less than10
about 4µm.To assess further whether the classical, volume-based theory for homogeneous nu-
cleation can be extended to micrometre-sized droplets suspended in air, additional lab-oratory studies are required. The evaporation of droplets in electrodynamic balancesis prohibitive to the determination of JV (T ) values for small droplets. Aerosol flow tubes15
(AFTs) and cloud chambers provide avenues for laboratory studies of micrometre-sizeddroplets; however, the determination of nucleation rate coefficients is complicated bythe evaporation of liquid droplets and subsequent deposition on ice particles. This wa-ter vapour mass transfer growth of ice particles leads to increases in the (volume) icefraction which are not directly related to the nucleation process. Previous studies of20
homogeneous ice nucleation in aerosol flow tubes have shown that at temperaturesnear the nucleation point, only a small fraction of the aerosols freeze (1 in 104 to 106),followed by significant vapour-phase exchange from the remaining liquid droplets to thenascent ice particles (Chelf and Martin, 2001).
To separate the contributions from homogenous nucleation and water vapour mass25
transfer in experimental measurements of aerosols in laminar flow tubes, microphysicalmodels have been employed. Hung and Martin (2001) developed an inversion modelin which the volume-based nucleation rate was treated as an adjustable parameter,
22887
ACPD9, 22883–22927, 2009
Volume nucleationrates for
homogeneousfreezing
M. E. Earle et al.
Title Page
Abstract Introduction
Conclusions References
Tables Figures
J I
J I
Back Close
Full Screen / Esc
Printer-friendly Version
Interactive Discussion
and homogeneous nucleation and mass transfer were considered as sequential pro-cesses. The nucleation rate, JV (T ), was varied iteratively to produce the best agree-ment between the volume fraction of ice calculated by the model, and that determinedby Fourier-transform infrared (FTIR) observation, for a given freezing temperature.
The objective of this study is to combine experimental measurements from an5
aerosol flow tube with a microphysical model to determine JV (T ) for micrometre-sizedwater droplets. The AFT apparatus has been characterized extensively using computa-tional fluid dynamic (CFD) calculations (Khalizov et al., 2006b). Laminar flow conditionswere demonstrated by quantifying thermal transfer in the flowing gas, thereby providinga time scale for kinetic measurements. The experimental conditions were designed to10
be appropriate for the application of the results to cirrus cloud formation. The micro-physical model used in this study treats nucleation and mass transfer as simultaneousprocesses, thereby differing from the sequential approach used in previous models.This paper details the experimental setup and approach, as well as the design andimplementation of the model. Values of JV (T ) are reported from model simulations for15
pure water droplets with mode radii (maxima in the volume size distributions) of 1.0,1.7, and 2.9µm. The results are considered with respect to the applicability of classi-cal, volume-based, nucleation theory to the freezing of small droplets in cirrus clouds.The implications for bulk parameterizations of homogeneous nucleation in numericalmodels are also discussed.20
2 Experimental
2.1 Freezing experiments
Freezing experiments were performed in a vertical aerosol flow tube (AFT), the de-tails of which have been reported elsewhere (Khalizov et al., 2006a). The tube isequipped with copper cooling coils capable of operation down to 150 K, and was de-25
signed to maintain laminar conditions with no temperature gradient-driven recirculation
22888

ACPD9, 22883–22927, 2009
Volume nucleationrates for
homogeneousfreezing
M. E. Earle et al.
Title Page
Abstract Introduction
Conclusions References
Tables Figures
J I
J I
Back Close
Full Screen / Esc
Printer-friendly Version
Interactive Discussion
under very low flow velocities. It comprises four independently temperature-controlledcopper sections, each 37.5 cm long, with an inner diameter (i.d.) of 8.9 cm. Adjacentsections are joined by thin-walled stainless steel bellows, which minimize heat flowand allow individual sections to be maintained at different temperatures. The inner as-sembly (copper sections and bellows) is enclosed within an evacuated stainless steel5
jacket that provides thermal isolation from the laboratory environment. Chilled nitro-gen coolant (mixture of liquid and gas) flows through coils affixed to the outer wall of
each section. The wall temperature of each section is regulated using a LabVIEW®
interface and feedback loop that controls a heater in the coolant gas flow. This systemcan maintain the average temperature of a section within ±0.1 K of the set point value,10
with axial temperature deviations along the length of each section wall typically main-tained within ±0.5 K. A set of cross-shaped copper fins is placed inside each section totransfer heat across the flow tube more efficiently, improving the cooling efficiency andminimizing radial temperature gradients in the gas flow.
A liquid water aerosol was generated by atomization or ultrasonic nebulization of15
Millipore®-filtered water, or by the heterogeneous condensation of humidified carriergas on ∼20 nm dry sodium chloride (NaCl) particles. In the latter case, the condensa-tion nuclei were produced by atomizing a dilute, 10−4 mol L−1 (M) solution of reagent-
grade NaCl (Sigma-Aldrich Co.) in Millipore®-filtered water, and passing the aqueous
particles through a 60 cm long Nafion® diffusion dryer. The dry salt aerosol was pre-20
mixed with humidified nitrogen and introduced to the flow tube, where the salt particlesdeliquesced and continued to grow by water vapour uptake. The low NaCl concentra-tion in the resulting droplets affected neither optical properties (Demott and Rogers,1990) nor freezing temperatures. We confirmed this in separate freezing experimentswith NaCl solutions of several increasing concentrations. Changes in the optical and25
freezing properties became noticeable only for NaCl concentrations three orders ofmagnitude higher than those used here.
22889
ACPD9, 22883–22927, 2009
Volume nucleationrates for
homogeneousfreezing
M. E. Earle et al.
Title Page
Abstract Introduction
Conclusions References
Tables Figures
J I
J I
Back Close
Full Screen / Esc
Printer-friendly Version
Interactive Discussion
The experimental configuration is shown in Fig. 1. For each generation method,the droplets or nuclei were entrained in a dry nitrogen gas flow of 3 SLPM (3 L min−1
at standard conditions of 294 K and 1013 hPa). These externally-generated particleswere introduced at the top of the cryogenic AFT via a central inlet (heated to prevent icedeposition), where they were then combined with a pre-cooled flow of nitrogen carrier5
gas at 7 SLPM. When employing nebulization or atomization, dry nitrogen carrier gaswas used. A mixture of dry (4 SLPM) and humidified (3 SLPM) nitrogen was usedfor the carrier flow when generating aerosol particles by heterogeneous condensation.The total flow rate was 10 SLPM in all cases.
The aerosol samples were exposed to well-defined temperature profiles as they10
flowed through the four tube sections, which will be designated A through D (top tobottom) in the following. Sections A and B were maintained at 240 K in all experimentsto condition the aerosol. At the end of section B, the samples were composed solely ofsupercooled droplets. Tube sections C and D were then cooled to candidate freezingtemperatures between 230 and 240 K. At a total flow rate of 10 SLPM, the residence15
time of aerosol particles, from the point at which they are cooled following conditioningto the observation point (see Sect. 2.2), is about 35 s.
2.2 Infrared spectra and retrieval
Infrared (IR) extinction spectra of the flowing aerosol were recorded in the lower half ofsection D. A collimated IR beam, modulated at 40 kHz metrology frequency by a Michel-20
son interferometer (Bruker Tensor 37), was passed through optical ports (capped withKRS-5 windows) on opposite sides of the flow tube, intersecting the aerosol. The trans-mitted IR beam was focussed by an off-axis parabolic mirror onto a mercury cadmiumtelluride (MCT) detector (FTIR-22-1.0, Infrared Associates). For each measurement,80 scans were averaged over the frequency range from 450 cm−1 to 6000 cm−1, at 225
cm−1 resolution. Water vapour spectra recorded at 243 K were routinely subtractedfrom the measured extinction spectra to remove water vapour interference.
22890
ACPD9, 22883–22927, 2009
Volume nucleationrates for
homogeneousfreezing
M. E. Earle et al.
Title Page
Abstract Introduction
Conclusions References
Tables Figures
J I
J I
Back Close
Full Screen / Esc
Printer-friendly Version
Interactive Discussion
A remote sensing retrieval procedure developed in our laboratory was used to deter-mine the phase composition and corresponding size distribution(s) of the supercooledwater and/or ice particles from their IR spectra (Zasetsky et al., 2004a, 2007). Theretrieval procedure is based on a minimization of the variance between the measuredspectrum and a calculated spectrum that is the linear combination of a set of monodis-5
perse reference spectra. This basis set of reference spectra is calculated for 96 radiithat are equally spaced on a logarithmic size scale in the range between 0.05 and11.8µm. Spectral basis sets for both supercooled water and ice are calculated usingMie scattering code (Bohren and Huffman, 1983), with frequency-dependent complexindices of refraction (Zasetsky et al., 2005). This approach assumes sphericity, which is10
a reasonable approximation, because the average particle radii are in the 1µm to 5µmrange and images made with an optical microscope (Zasetsky et al., 2007) mountedtemporarily in the aerosol flow (in tube section D) show that under the conditions ofthese experiments, the particles have near-unity aspect ratios.
The retrieval procedure determines a particle size distribution using a nonlinear15
least-squares algorithm. The resulting size distribution is the number concentration ofparticles in each of the 96 size bins (corresponding to the radii in the basis set) whichproduce the calculated spectrum that best fits the measured spectrum. Ice and/or su-percooled water particle distributions are obtained simultaneously in this way. Numbersize distributions can be converted to volume size distributions by multiplying the num-20
ber concentration of particles in each bin by (4/3)πr3, where r is the bin radius. Volumesize distributions are used in all analyses because they are directly related to mass,which is conserved in kinetic processes.
2.3 Initial aerosol size distributions
To estimate the sizes of the conditioned aerosols from each generation method, ex-25
periments were conducted with all four flow tube sections held at the conditioningtemperature of 240 K. Excess water vapour was removed to the wall and fins by dif-fusion/condensation upon cooling in the first two sections, and the particles did not
22891

ACPD9, 22883–22927, 2009
Volume nucleationrates for
homogeneousfreezing
M. E. Earle et al.
Title Page
Abstract Introduction
Conclusions References
Tables Figures
J I
J I
Back Close
Full Screen / Esc
Printer-friendly Version
Interactive Discussion
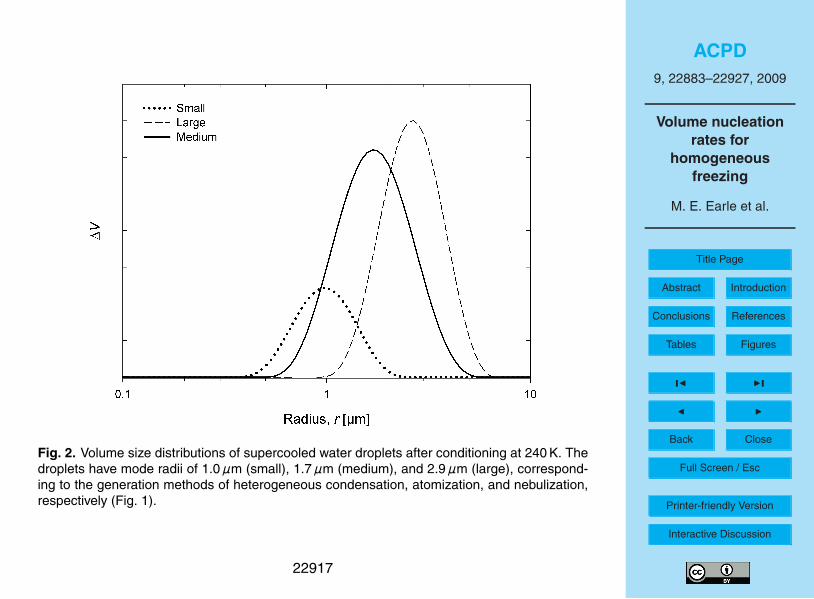
experience appreciable changes in size beyond this point. Analysis of the resulting ex-tinction spectra using the characterization procedure (detailed in Sect. 2.2) producedthe volume size distributions of supercooled water droplets for each generation methodshown in Fig. 2. The conditioned aerosols produced by heterogeneous condensa-tion have radii between approximately 0.4 and 2µm, with a maximum in the volume5
distribution (mode) at about 1µm. Those produced by the constant output atomizerhave radii between 0.6 and 5µm, with a mode of approximately 1.7µm. Nebulizationproduces conditioned aerosols with radii between 1 and 7µm, with a mode of about2.9µm. Based on these sizes, the aerosols produced by condensation, atomization,and nebulization will henceforth be referred to as small, medium, and large droplets,10
respectively.
2.4 Axial temperature profiles
The axial temperature profile experienced by the aerosol cannot be inferred solely frommeasurements made at the tube wall and/or at fixed radial positions in the flow (e.g. inthe centre), because even at the relatively low linear flow velocities of our experiments15
(a few cm per second), thermal transfer is not fast enough to equalize the radial tem-peratures completely. It is necessary to account for these radial temperature gradients(which vary with axial distance along the tube) because the aerosol is spread out overthe entire cross-section of the flow. To quantify these gradients, CFD calculations wereused to determine the cross-sectional- and mass-averaged temperature profiles in the20
AFT (Khalizov et al., 2006a). It has been shown that CFD computations accurately rep-resent the conditions to which the aerosol particles are exposed as they travel throughthe AFT, including not only the temperature distributions, but also important flow char-acteristics such as gas streamlines and particle tracks. These results show that theparticle motion is linear and follows the gas flow, which is laminar under the conditions25
of our experiments. Laminar flow is necessary both to avoid agglomeration and toensure that the timescales used in the subsequent kinetic analyses are correct.
22892

ACPD9, 22883–22927, 2009
Volume nucleationrates for
homogeneousfreezing
M. E. Earle et al.
Title Page
Abstract Introduction
Conclusions References
Tables Figures
J I
J I
Back Close
Full Screen / Esc
Printer-friendly Version
Interactive Discussion
CFD profiles were calculated for each candidate freezing temperature. Using thecalculated aerosol flow velocities (e.g. ∼3 cm s−1 for a total flow rate of 10 SLPM), thetemperature profiles as a function of the axial coordinate were converted into profilesas a function of aerosol residence time. The latter profiles are required by the kineticmodel to interpret the aerosol transformations during freezing. This model is detailed5
in the following section.
3 Model description
Implemented in Matlab (The Mathworks, Inc.), the model uses volume distributionsof supercooled water and ice aerosol particles obtained from freezing experimentsto determine temperature-dependent homogeneous nucleation rate coefficients. The10
distributions measured at different temperatures represent the aerosol particles at thevarious stages of the freezing event. Before freezing, the initial distribution is that of apure (supercooled) water aerosol that has been conditioned with all wall temperaturesset to 240 K (Fig. 2). The final supercooled water and/or ice distributions are takenfrom experiments conducted with the bottom two tube sections (C and D) at a given15
candidate freezing temperature.The model has two components: a microphysical simulation and a minimization step.
The microphysical component consists of a series of rate processes describing ho-mogeneous ice nucleation and (diffusion-limited) exchange between aerosol particlesand water vapour. The exchange accounts for mass transfer between the liquid and20
frozen particles via evaporation, diffusion, and condensation/deposition. All processesuse temperature-dependent rate constants and include the influence of the Kelvin ef-fect. Nucleation and vapour-phase exchange processes are considered simultane-ously, as opposed to the sequential approach used previously in similar models (Chelfand Martin, 2001; Hung et al., 2002; Hung and Martin, 2001). Beginning with the initial25
supercooled water aerosol distribution, the microphysical component solves the time-dependent differential equations describing the relevant rate processes, subject to the
22893

ACPD9, 22883–22927, 2009
Volume nucleationrates for
homogeneousfreezing
M. E. Earle et al.
Title Page
Abstract Introduction
Conclusions References
Tables Figures
J I
J I
Back Close
Full Screen / Esc
Printer-friendly Version
Interactive Discussion
axial AFT temperature profile and the nucleation rate function JV (T ). The calculationsproduce time-dependent volume distributions of supercooled water and/or ice. Thenormalized sum of squares of differences, χ , between the calculated and measured(in AFT section D) supercooled water and ice distributions is minimized by varying thefunction JV (T ).5
3.1 Details of microphysical component
The volume distributions of supercooled water and ice output by the retrieval procedure(Sect. 2.2) give the volume concentration of particles in each of the 96 size bins corre-sponding to the radii specified in the spectral basis set. These radii will be referred toas nodes in the following. Particles in the size bins are assumed to reside only at the10
nodes.The rate of increase in the number of ice particles in node i , Ns
i , due to homogeneousnucleation is given by the following:
dNsi
/dt=N l
i JV (T ) vi (2)
where N li is the number concentration of liquid droplets in node i , and15
vi=(4/
3)π(r li)3
is the volume of a liquid droplet in node i having radius r li . The
decrease in the number of water droplets resulting from homogeneous nucleation isdetermined from the increase in the number of ice particles:
dNsi
/dt=−dN l
i
/dt (3)
Equations (2) and (3) are based on the assumptions that nucleation events in droplets20
are independent, that ice formation is the result of only one nucleation event per droplet,and that once nucleated, the entire droplet is frozen instantaneously.
22894

ACPD9, 22883–22927, 2009
Volume nucleationrates for
homogeneousfreezing
M. E. Earle et al.
Title Page
Abstract Introduction
Conclusions References
Tables Figures
J I
J I
Back Close
Full Screen / Esc
Printer-friendly Version
Interactive Discussion
The temperature dependence of the nucleation rate is given by classical nucleationtheory (Turnbull and Fisher, 1949):
JV (T )=NVkTh
exp(−∆FVkT
)(4)
where NV=3.35×1022 cm−3 is the number concentration of water molecules in thedroplet volume, k is the Boltzmann constant, and h is the Planck constant. The term5
∆FV represents the sum of the free energy of nucleus formation in the bulk volumeand the activation energy for the diffusion of water molecules across the liquid–solidboundary of the nucleus (Pruppacher and Klett, 1998; Turnbull and Fisher, 1949). Thetemperature dependence of JV is given by the strong temperature dependence of theexponential factor, as well as that of the pre-factor and ∆FV . The latter was modelled10
using the expression ∆FV=AV−BV T . Incorporating the parameters AV (in units of en-ergy) and BV (in units of energy divided by temperature) into the formulation of JV (T )used in the model (Eq. 4) gives:
JV (T )=NVkTh
exp(−AV−BV T
kT
)(5)
The temperature dependence in Eq. (5) governs the number of ice particles formed as15
the temperature of the supercooled water aerosol changes subject to the temperatureprofile in the flow tube. Minimization of the function χ by varying the parameters AV andBV produces the temperature-dependent nucleation rates JV (T ) that are the desiredoutput.
Diffusion-limited exchange processes result from differences between the saturation20
vapour pressures above particles and the partial pressure of water vapour in the sur-rounding gas. These processes include the evaporation and condensation growth ofthe liquid particles and the deposition growth of the ice particles. The rate of radiuschange for water droplets and ice particles by the combination of these processes is
22895

ACPD9, 22883–22927, 2009
Volume nucleationrates for
homogeneousfreezing
M. E. Earle et al.
Title Page
Abstract Introduction
Conclusions References
Tables Figures
J I
J I
Back Close
Full Screen / Esc
Printer-friendly Version
Interactive Discussion
determined as follows (Hinds, 1999):
dr lidt
=D∗v (r li )Mw
R ρw
1
r li
(p∞T∞
−pi
T li
)(6)
drsidt
=D∗v (rsi )Mw
R ρice
1
rsi
(p∞T∞
−pice
T si
)(7)
where r li is the radius of liquid droplets in node i ; rsi is the radius of ice particles in nodei ; D∗
v (r li ) and D∗v (rsi ) are the gas-phase diffusion coefficients for water and ice; Mw is5
the molar mass of water; R is the ideal gas constant; ρw is the density of supercooledwater; ρice is the density of ice; p∞is the far-field water partial pressure; pi is thesaturation vapour pressure above droplets in node i (corrected for the Kelvin effect);pice is the saturation vapour pressure above ice; T∞ is the ambient gas temperature atlocations far removed from the droplets; T l
i and T si are the surface temperatures of the10
water droplets and ice particles, respectively. It is assumed that T∞=T li =T
si , because
the gain or release of heat by particles during condensation/deposition or evaporationwill not change the particle surface temperatures by more than 0.1 K (Chelf and Martin,2001).
The dependence of the gas-phase diffusion coefficients, D∗v (r li ) and D∗
v (rsi ), on the15
radii of water and ice particles follows from the approach of Fuchs, which corrects fordiscontinuities in the vapour density above the particles when their radii approach themean free path, λ, of vapour particles (Pruppacher and Klett, 1998):
D∗v (r l/si )=
Dv[r l/si
r l/si +∆v+ Dv
r l/si αw/ice
(2πMw
R T l/si
)2] (8)
In the above expression, Dv is the vapour diffusivity of water in air, ∆v is the distance of20
the vapour continuum above the particle surface (taken as 1.3 λ in the present study),22896

ACPD9, 22883–22927, 2009
Volume nucleationrates for
homogeneousfreezing
M. E. Earle et al.
Title Page
Abstract Introduction
Conclusions References
Tables Figures
J I
J I
Back Close
Full Screen / Esc
Printer-friendly Version
Interactive Discussion
and αw and αice are the mass accommodation coefficients for the evaporation of liquiddroplets (evaporation coefficient) and vapour deposition on ice particles (depositioncoefficient), respectively.
The values of αw and αice required for computation of the corrected diffusion coeffi-cients D∗
v (r li ) and D∗v (rsi )are not well known. Under temperature conditions character-5
istic of our freezing experiments, previously reported values of αw vary from 0.04 toapproximately 0.5 (Li et al., 2001; Shaw and Lamb, 1999), while those of αice spanthree orders of magnitude from approximately 0.001 to 0.6 (Choularton and Latham,1977; Haynes et al., 1992; Magee et al., 2006; Pratte et al., 2006). Therefore, αw andαice are treated as adjustable parameters in the model, and are iteratively varied during10
the minimization procedure (Sect. 3.2).The far-field water partial pressure,p∞, is calculated from the total concentration of
gaseous water molecules (vapour), Nv , using the ideal gas law:
p∞=Nv k T∞ (9)
The value of Nv is determined by assuming that the concentration of gaseous water15
is in a steady-state with respect to condensation and evaporation to and from liquiddroplets and deposition on ice particles, and is subject to losses to the ice-coated tubewalls and fins.
dNv
dt=−
96∑i=1
(1
vw ρw
dm li
dt+
1viceρice
dmsi
dt
)−kloss
(Nν−N ice
ν
)(10)
The two terms in the summation represent the contributions from the liquid droplets and20
ice particles, where m li is the mass concentration of liquid droplets in node i , ms
i is themass concentration of ice particles in node i , and νw and νice are the molecular volumesof liquid water and ice, respectively. The rates of change of mass concentration forliquid and ice particles in node i due to mass transfer are given by:
dm li
dt=4πr l
2
i ρwNli
dr lidt
(11)25
22897
ACPD9, 22883–22927, 2009
Volume nucleationrates for
homogeneousfreezing
M. E. Earle et al.
Title Page
Abstract Introduction
Conclusions References
Tables Figures
J I
J I
Back Close
Full Screen / Esc
Printer-friendly Version
Interactive Discussion
dmsi
dt=4πrs
2
i ρiceNsi
dr sidt
(12)
The final term in Eq. (10) represents the loss of gaseous water to the ice-coated tubewalls and fins, where N ice
v is the concentration of vapour molecules given by the satu-ration vapour pressure of ice, and kloss is the first-order rate constant for radial diffusionto the walls in a laminar flow (Houzelot and Villermaux, 1977; Villermaux, 1971):5
kloss=µDv
r2t
(13)
In Eq. (13), µ=3.66 is the Sherwood number for a cylindrical pipe, and rt is the tuberadius. In the present study, kloss=0.138 s−1 (Khalizov et al., 2006b).
From Eqs. (6) and (7), the changes in size of liquid water droplets and ice particlesare determined by the difference between the far-field vapour pressure and the satu-10
ration vapour pressures of particles. The number of particles in a node may changedue to size changes of particles resulting from condensation/deposition growth andevaporation. This exchange among nodes was implemented in the model using theapproach of Prakash et al. (2003), in which the change in the number of liquid dropletsin each node i is considered in terms of four vapour pressure scenarios:15
dN li
dt=
1(νi−νi−1)ρw
dmli−1
dt if p∞>pi−1 (growth in bin i − 1)
− 1(νi+1−νi )ρw
dmli+1
dt if p∞<pi+1 (evaporation in bin i + 1)
− 1(νi+1−νi )ρw
dm li
dt if p∞>pi (growth in bin i )
1(νi−νi−1)ρw
dm li
dt if p∞<pi (evaporation in bin i )
(14)
where νi is the volume of a particle in node i , and νi−1 and νi+1 are the volumes ofparticles in adjacent size bins. The first two terms in Eq. (14) will increase the numberdensity of particles in node i , while the last two terms will decrease the number density.
22898

ACPD9, 22883–22927, 2009
Volume nucleationrates for
homogeneousfreezing
M. E. Earle et al.
Title Page
Abstract Introduction
Conclusions References
Tables Figures
J I
J I
Back Close
Full Screen / Esc
Printer-friendly Version
Interactive Discussion
An equivalent set of equations is used to describe the change in the number of iceparticles in each node i :
dNsi
dt=
1
(vsi −vsi−1)ρice
dmsi−1dt−
1(vsi+1−v
si )ρice
dmsi
dt if p∞>pice (growth)
− 1(vsi+1−v
si )ρice
dmsi+1
dt + 1(vsi −v
si−1)ρice
dmsi
dt if p∞<pice (evaporation)(15)
There are only two possibilities in this case, because pice is a function of temperatureonly, and does not vary for adjacent nodes.5
The initial inputs for the microphysics component are the initial volume distributionof supercooled droplets, the time evolution of temperature (determined from the flowvelocity and axial temperature profile, as described in Sect. 2.4), the first guesses ofvalues of AV and BV for the calculation of the nucleation rate (Eq. 5), and the massaccommodation coefficients αw and αice for the calculation of mass transfer by evapo-10
ration/growth. By performing the steps implied by Eqs. (2) to (15), the model calculatesthe time evolution of the far-field partial pressure, the number fraction of droplets frozen(ratio of number of droplets frozen to initial number of droplets), and thereby the evolu-tion of the supercooled water and ice distributions.
3.2 Minimization component15
The minimization procedure iteratively varies the values of AV , BV , αw and αice to min-imize the normalized sum of squares of differences, χ (Eq. 6 below), between the finalvolume distributions of supercooled water and ice aerosol particles measured in freez-ing experiments and those calculated by the model.
χ=
96∑i=1
(V l ,expi −V l ,calc
i
)2+
96∑i=1
(V s,expi −V s,calc
i
)2
(96∑i=1
(V l ,expi + V s,exp
i
))2(16)20
22899

ACPD9, 22883–22927, 2009
Volume nucleationrates for
homogeneousfreezing
M. E. Earle et al.
Title Page
Abstract Introduction
Conclusions References
Tables Figures
J I
J I
Back Close
Full Screen / Esc
Printer-friendly Version
Interactive Discussion
In the above equation, V li and V s
i are the volume densities of liquid droplets and iceparticles, respectively, in node i . The additional superscripts indicate whether volumedensities are from experimental (exp) or calculated (calc) distributions. The model canbe run for a single freezing experiment at a given candidate freezing temperature, or forseveral freezing experiments, performed at different candidate freezing temperatures,5
simultaneously. In the latter case, χ is evaluated separately for each experiment usingEq. (16), and then averaged over all of the experiments. In either case, the modeliteratively varies a single set of AV , BV , αw, and αice values for all of the constituentexperiments to minimize the final (averaged) value of χ .
The minimization component uses the fminsearch minimizer from the Matlab stan-10
dard library, which finds a minimum for an unconstrained multivariable function usingthe simplex search method (Lagarias et al., 1998). The strong temperature depen-dence of homogeneous nucleation rates complicates the minimization, as AV and BVpairs producing reasonable values of JV for a given temperature form a narrow strip ona plot of AV versus BV . Lines of constant JV are given by AV=BV T−C, where C is a15
constant. If one changes AV and BV by moving along such a line, JV does not change(for a given temperature), but its temperature dependence does. If, on the other hand,one moves perpendicular to such a line, JV changes exponentially, while its tempera-ture dependence changes little. This situation necessitates the use of extremely smallsteps in the minimization to maintain reasonable values of JV , which slows down the20
calculation process dramatically.To circumvent this issue, the parameters AV and BV were transformed to new pa-
rameters aV and bV , which allow the value of JV and its temperature dependence tobe changed independently, greatly enhancing the performance of the minimizer. Theparameters aV and bV are the inclination and offset when JV is approximated by a25
straight line on a logJV versus T plot:
logJVJ0
=aV (T−T0) + bV (17)
22900
ACPD9, 22883–22927, 2009
Volume nucleationrates for
homogeneousfreezing
M. E. Earle et al.
Title Page
Abstract Introduction
Conclusions References
Tables Figures
J I
J I
Back Close
Full Screen / Esc
Printer-friendly Version
Interactive Discussion
where J0=1 cm−3 s−1 provides the correct units. Changing aV or bV is equivalent tomoving parallel or perpendicular, respectively, to the lines of constant JV on the AVversus BV plot. The coordinate transformation is accomplished by developing logJV (T )in a Taylor series expansion up to the first order, around a temperature T0 within thefreezing range typical for our freezing experiments:5
aV=1
T0 ln 10
(1 +
AV
kT0
)(18)
bV=1
ln 10
(−AV−BV T0
kT0+ ln
NV kT0
hJ0
)(19)
For these experiments, a value of T0=236.15 K was used. The new parameters aVand bV are used only in the minimization component of the model. In the microphysicscomponent, aV and bV are transformed back to AV and BV , which are used to calculate10
JV for each iteration.
4 Results and discussion
4.1 Changes in infrared spectra and aerosol size distributions upon cooling
Extinction spectra were recorded for pure water aerosol as a function of the candi-date freezing temperature. The spectra obtained at 239.6, 236.3, 236.1, and 234.9 K15
are shown in Fig. 3 for the representative case of medium droplets produced by at-omization. The freezing onset (homogeneous nucleation point) is indicated by distinctchanges in the spectra between 236.3 and 236.1 K; specifically, broadening of theO-H vibrational stretching feature at ∼3000 cm−1 and the H-O-H bending feature at∼1640 cm−1. These changes become more pronounced when the temperature is re-20
duced to 234.9 K and a larger number of droplets are frozen, with the O-H stretching
22901
ACPD9, 22883–22927, 2009
Volume nucleationrates for
homogeneousfreezing
M. E. Earle et al.
Title Page
Abstract Introduction
Conclusions References
Tables Figures
J I
J I
Back Close
Full Screen / Esc
Printer-friendly Version
Interactive Discussion
feature exhibiting a marked change in shape. In addition, the H-bonding (librational)feature at ∼700 cm−1 sharpens and shifts to higher wavenumbers.
The above changes in absorption features associated with freezing are all in ac-cordance with previous reports (Cziczo and Abbatt, 1999; Clapp et al., 1995). Smallvariations in these spectral features at warmer temperatures are also evident from com-5
parison of the spectra at 239.6 and 236.3 K. In fact, there is a general trend of spectradisplaying more “ice-like” character as the temperature is decreased from near 273 Ktoward the nucleation point. A previous study in our laboratory (Zasetsky et al., 2004b)attributed these changes to the formation of low-density domains, consisting of ice-likeclusters of water molecules, within the supercooled droplets.10
The changes in extinction that occur above about 4000 cm−1, where neither waternor ice absorb, are due to variations in scattering. After ice nucleation has occurredin a small fraction of supercooled droplets, the changes in slope in this region are dueprimarily to the growth of nascent ice particles by vapour diffusion from the remainingliquid droplets. The growth process can be characterised by retrieving temperature-15
dependent size distributions of supercooled water and/or ice aerosol particles fromexperimental spectra using the procedure outlined in Sect. 2.2.
Retrieved volume size distributions of hydrometeors are shown in Fig. 4 for the sameset of freezing experiments using medium droplets. The spectra calculated from theseretrieved size distributions are overlaid on the experimental spectra in Fig. 3. Figure 420
shows that the sample at 239.6 K was composed entirely of supercooled water, with themode at a radius of ∼1.7µm. The apparent contribution from small ice particles withradius approximately equal to that of the water droplets is believed to arise becausethe refractive indices, and therefore the spectra, of supercooled water and ice arevery similar. Hence, experimental noise in the measured spectra and/or inaccuracies25
in the indices of refraction can introduce small uncertainties in the retrieved ice andwater distributions (Zasetsky et al., 2004a). Similar small ice features are observedin the distributions at 236.1 K and 234.9 K, as well as at warmer temperatures (notshown). Since these features are not believed to represent ice, and comprise only a
22902

ACPD9, 22883–22927, 2009
Volume nucleationrates for
homogeneousfreezing
M. E. Earle et al.
Title Page
Abstract Introduction
Conclusions References
Tables Figures
J I
J I
Back Close
Full Screen / Esc
Printer-friendly Version
Interactive Discussion
small fraction of the total volume, they are removed from the distributions prior to theiruse in the microphysics model.
The secondary liquid water and ice features present at larger radii in Fig. 4 (e.g. thewater peaks in the vicinity of 10µm at 239.6 K and 236.1 K and the “tails” on the waterand ice distributions at the largest radii) are also removed before model analysis. These5
features can potentially result from aerosol particles at large radii; however, the freezingof such large droplets would occur rapidly, and as such, is not pertinent to the presentanalysis, in which nucleation and mass transfer processes are considered over longertimescales (see Sect. 4.3). Large particle features in the distributions can also resultfrom a baseline shift of the spectrometer (Zasetsky et al., 2004a). In either case, the10
features removed from the distributions make up less than 10% of the total volume.The samples at 236.3 and 236.1 K in Fig. 4 were partially frozen, with maxima in
the ice distributions at approximately 7.1 and 5.6µm, respectively, while the sample at234.9 K was completely frozen, with a maximum in the ice distribution at about 3.2µm.The residual water apparent in the distributions at 234.9 K is attributed to the similarity15
of refractive indices for supercooled water and ice considered above, and is removedfor subsequent analysis. The significant increases in the sizes of the ice particlesrelative to the initial supercooled water droplets are caused by deposition growth of thenucleated ice particles. The decrease in the size of the ice particles with reduction intemperature is a result of the temperature dependence of the growth process. Mass20
transfer is most significant near the nucleation point, where only a small fraction ofthe droplets have frozen and the saturation vapour pressure of water is high. As thetemperature is reduced, the saturation vapour pressure of water decreases and a largerfraction of droplets freeze homogeneously, reducing the available liquid water for masstransfer and suppressing the growth of the ice particles.25
It is important to emphasize that even for the completely frozen sample at 234.9 K,ice nucleated in only a small fraction of the droplets, and these then grew significantlyby mass transfer. Further decreases in the candidate freezing temperature to 233.5and 232.4 K led to the nucleation of a larger fraction of the droplets, which did not
22903

ACPD9, 22883–22927, 2009
Volume nucleationrates for
homogeneousfreezing
M. E. Earle et al.
Title Page
Abstract Introduction
Conclusions References
Tables Figures
J I
J I
Back Close
Full Screen / Esc
Printer-friendly Version
Interactive Discussion
grow as much as those at higher temperatures. The ice particle modes for these lowertemperature cases (not shown) were at radii of 2.1 and 1.9µm, respectively. At temper-atures below 230 K, the size distribution of the ice particles corresponds approximatelyto that of the initial size distribution of supercooled water, indicating that homogeneousnucleation predominates and liquid-to-solid mass transfer growth is not significant. This5
is the expected consequence of the strong temperature dependences of both the nu-cleation rate and the mass transfer growth rate.
4.2 Nucleation temperature determination from retrievals
The volume size distributions of supercooled water and ice were used to calculate thevolume fraction of ice – defined as the integrated volume concentration of ice particles10
divided by the sum of the integrated volume concentrations of ice and water particles– formed at each candidate freezing temperature. The resulting freezing curves foraerosol particles of each initial size are shown in Fig. 5. The curves for small andmedium droplets overlap (dashed black line), and are shifted to slightly warmer tem-peratures than that for large droplets (solid grey line). We define the temperature at the15
mid-point of the curve, where the volume fraction of ice is 0.5, to be the homogeneousnucleation point. For each particle size, the nucleation temperature is approximately236 K, in excellent agreement with values from previous work (Anderson et al., 1980;Cziczo and Abbatt, 1999; Demott and Rogers, 1990). Errors in the volume fractionfrozen range from 2 to 3% in the plateau regions, where the samples are predomi-20
nantly supercooled droplets or ice, to 10% near the nucleation point, where the phasecomposition is most sensitive to small fluctuations in temperature. Based on the latter,the upper limit for errors in the volume fraction of ice is illustrated by the error bar inFig. 5.
The dependence of the volume fraction of ice on the candidate freezing temperature25
shows the evolution of the freezing process. However, the competition between homo-geneous nucleation and mass transfer complicates the determination of the nucleationrate from these data, because the change in the volume of ice particles results from
22904
ACPD9, 22883–22927, 2009
Volume nucleationrates for
homogeneousfreezing
M. E. Earle et al.
Title Page
Abstract Introduction
Conclusions References
Tables Figures
J I
J I
Back Close
Full Screen / Esc
Printer-friendly Version
Interactive Discussion
both processes. To isolate the contribution of homogeneous nucleation from that ofmass transfer growth so that the nucleation rate coefficients could be calculated, it wasnecessary to use a microphysical model (see Sect. 3) that contained both processes.
4.3 Nucleation rate determination from model simulations
Freezing experiments performed at different candidate freezing temperatures corre-5
sponded to different cross-sectional, mass-averaged temperature profiles obtainedfrom a combination of direct measurements and high resolution CFD simulations(Sect. 2.4). Each experiment was interpreted in a separate model run. The input datafor each run consisted of the measured initial and final supercooled water and/or iceaerosol particle distributions, the temperature profile, and the initial guesses for the pa-10
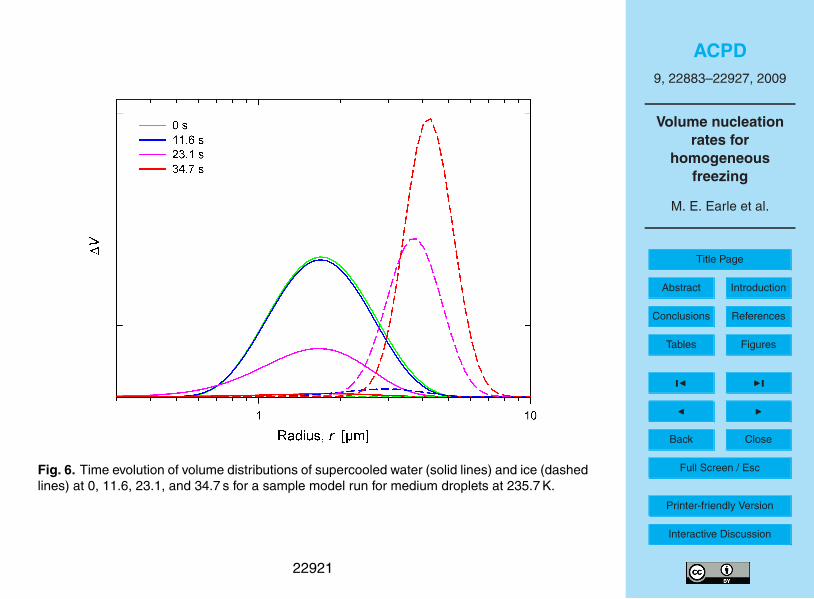
rameters AV , BV , αw and αice. An example of the evolution of the volume distributions ofsupercooled water and ice that the model obtains for a freezing experiment performedat a candidate freezing temperature of 235.7 K is shown in Fig. 6 for medium-sizeddroplets generated by atomization. The corresponding temperature profile and evo-lution of the far-field pressure (Eq. 9), the number fraction of droplets nucleated, and15
volume fraction of ice (determined from the distributions) are given in Fig. 7.The initial volume distribution of supercooled water droplets in Fig. 6 (solid green
curve) has a maximum at a radius of ∼1.7µm. As the aerosol travels to a region oflower temperature (Fig. 7), the volume density of water droplets decreases while thatof ice particles increases. Figure 6 shows that the ice particles become larger due20
to mass transfer following freezing; the mode radii are 2.9 and 3.7µm after residencetimes of 11.6 and 23.1 s, respectively. The final sample, calculated for a 34.7 s resi-dence time, is composed almost entirely of ice particles (red dashed line; mode radiusof 4.2µm), with some residual water droplets.
The freezing experiment shown in Fig. 6 exemplifies a “partially frozen” case in which25
some liquid water droplets remain in the aerosol when it crosses the infrared detectionbeam. This corresponds to the vertical part of the freezing curve in Fig. 5, for whichthe volume fractions of ice are less than unity. Because water and ice are present
22905

ACPD9, 22883–22927, 2009
Volume nucleationrates for
homogeneousfreezing
M. E. Earle et al.
Title Page
Abstract Introduction
Conclusions References
Tables Figures
J I
J I
Back Close
Full Screen / Esc
Printer-friendly Version
Interactive Discussion
simultaneously, these partially frozen experiments are preferable to cases where all ofthe water droplets freeze before detection in the lowermost section of the flow tube.In the absence of liquid water droplets, the kinetic timescale over which nucleation oc-curred is uncertain, and the mass accommodation coefficients required for the correctdescription of diffusion-limited mass transfer cannot be properly constrained. Accord-5
ingly, subsets of experiments with partially frozen aerosols for each initial droplet sizewere selected for subsequent model analysis: three experiments for small droplets atdifferent candidate freezing temperatures, five experiments for medium droplets, andthree experiments for large droplets.
Because ice particle growth by mass transfer is significant for partially frozen sam-10
ples, the model runs corresponding to these experiments should be sensitive to thevalues of the mass accommodation coefficients αw and αice, which determine the mag-nitudes of the gas-phase diffusion coefficients D∗
v (r li ) and D∗v (rsi ), respectively (see
Sect. 4.1). To demonstrate this sensitivity, a series of model runs were performedin which the values of αw and αice were varied independently to find their influence15
on the value of χ . The results for the experiment with partially frozen, medium-sizeddroplets at 235.7 K are shown in Fig. 8. In this case, the best fit between the measuredand calculated ice and water size distributions (minimum value of χ ) was obtained withαw=0.020 and αice=0.038. The trends displayed in Fig. 8 are representative of thoseobserved for aerosols with smaller and larger droplet sizes. The steeper minimum in20
χ as a function of αice indicates that the results are more sensitive to changes in theaccommodation coefficient on ice than to changes in αw. The variations in Fig. 8 showthat these experiments can be used to estimate the mass accommodation coefficients– at least under our experimental conditions.
Fits to experimental distributions calculated from model runs for supercooled droplets25
with a mode radius of 1.7µm (medium-sized droplets) are shown in Fig. 9. The dis-tributions producing the minimum value of χ are shown in each case. The associatedvalues of JV , calculated from the resulting values of AV and BV , are plotted in Fig. 10.
22906
ACPD9, 22883–22927, 2009
Volume nucleationrates for
homogeneousfreezing
M. E. Earle et al.
Title Page
Abstract Introduction
Conclusions References
Tables Figures
J I
J I
Back Close
Full Screen / Esc
Printer-friendly Version
Interactive Discussion
As seen in the lower panel of Fig. 7, the largest number of droplets nucleates ina narrow range of temperatures (∼0.25 K) above the lowest temperature to which theparticles are exposed in the AFT. This is due to the very strong temperature depen-dence of JV , which changes by about two orders of magnitude per degree Kelvin (seeFig. 10). To obtain values of JV over as wide a temperature range as possible, all five5
of the partially frozen experiments for medium droplets were fitted simultaneously, us-ing a single set of minimization parameters. The result of this group fit is plotted asthe solid curve in Fig. 10, showing the temperature dependence of the nucleation rateassuming that nucleation occurs within the droplet volume for samples in which mostdroplets have radii at or about 1.7µm. Strictly speaking, this JV (T ) curve applies only10
over the temperature range from 234.8 K to 236.2 K; that is, from the minimum tem-perature in the experiment performed at the lowest AFT wall temperature of 235.3 K to0.25 K warmer than the minimum temperature in the experiment conducted at the high-est wall temperature of 236.5 K (see Fig. 10). It should be noted that the minima in thetemperature profiles are slightly lower than the set-point (average) wall temperatures15
because of the cooling configuration, which is responsible for the ±0.5 K axial gradientalong tube sections.
Model fits to retrieved volume distributions from experiments with partially-frozensamples of small and large droplets, with mode radii of 1 and 2.9µm, respectively,are shown in Fig. 11. The corresponding JV (T ) curves obtained from group fits to20
experiments for each droplet size are plotted in Fig. 12. The valid temperature rangesfor JV (T ) are 235.0 to 235.8 K for small droplets and 234.8 to 235.8 K for large droplets.The JV (T ) curve derived from the group fit to medium droplet experiments (Fig. 10) isplotted alongside those for small and large droplets in Fig. 12.
The values of χ , AV , BV , αw and αice obtained from the group fits for each droplet25
size are given in Table 1. The values of AV and BV can be used in Eq. (5) to calculatevalues of JV (T ), the temperature-dependent volume nucleation rate constant, over thetemperature range of our experiments. Averaging the compiled values of mass accom-modation coefficients, weighted by the number of freezing experiments used in each
22907
ACPD9, 22883–22927, 2009
Volume nucleationrates for
homogeneousfreezing
M. E. Earle et al.
Title Page
Abstract Introduction
Conclusions References
Tables Figures
J I
J I
Back Close
Full Screen / Esc
Printer-friendly Version
Interactive Discussion
group fit, results in αw=0.054 and αice=0.031.
4.4 Comparison of nucleation rate coefficients
Values of JV (T ) from previous studies of droplets created in an expansion chamber(Demott and Rogers, 1990) and levitated in a cooled electrodynamic balance (Duftand Leisner, 2004; Kramer et al., 1999; Stockel et al., 2005) are plotted in Fig. 12 for5
comparison. The water droplets examined in these experiments ranged in size fromabout 5 to 50µm. The values of JV (T ) determined in the present study agree well withthose of Stockel et al. (2005) in terms of both temperature dependence and magnitude,essentially extending their values to lower temperatures. The temperature dependenceof our results is similar to that obtained by Kramer et al. (1999) – which is supported by10
the results of Duft and Leisner (2004) – and to that of the curve of Pruppacher (1995),but the absolute values are somewhat lower. The Pruppacher recommendation is a fitto earlier experimental data, including those of DeMott and Rogers (1990), which agreewith our values at low temperature, but have a different temperature dependence.
The droplet radii in each of the previous studies considered above are larger than15
the ∼4µm threshold for surface nucleation proposed by Duft and Leisner (2004). Thedroplet size distributions in the present study, however, all have mode radii below thisthreshold, allowing one to consider the applicability of classical nucleation theory forsuch droplets. In addition, all experiments in this study were performed in the sameexperimental apparatus under similar experimental conditions, allowing one to assess20
the size dependence of JV (T ) with minimal contribution from systematic errors.For a classical, volume-based freezing process, the nucleation rate depends on the
droplet volume (function of r3), and the rate coefficient JV (T ) should be independent ofdroplet radius. This is not the case for the JV (T ) curves for small, medium, and largedroplets in the present study. It is evident from Fig. 12 that for these curves, the mag-25
nitude of JV (T ) increases with decreasing droplet radius for a given temperature. Thissize dependence can potentially be attributed to the contribution of surface nucleationto the total nucleation rate, as considered in Eq. (1). As the droplet size decreases,
22908

ACPD9, 22883–22927, 2009
Volume nucleationrates for
homogeneousfreezing
M. E. Earle et al.
Title Page
Abstract Introduction
Conclusions References
Tables Figures
J I
J I
Back Close
Full Screen / Esc
Printer-friendly Version
Interactive Discussion
the surface-to-volume ratio increases, which could increase the contribution from JS .These results suggest that classical nucleation theory cannot adequately describe thefreezing of small, micrometre-sized supercooled water droplets, consistent with previ-ous considerations of a droplet size threshold for surface nucleation (Duft and Leisner,2004).5
5 Conclusions
The freezing of micrometre-sized water aerosol droplets with mode radii of 1.0, 1.7,and 2.9µm was studied as a function of temperature in a cryogenic AFT apparatus.Analysis of experimental extinction spectra using a previously-reported characteriza-tion procedure provided the size distributions and phase composition of the aerosol10
samples. The temperature dependence of the volume fraction of ice formed in thesamples indicated a homogeneous nucleation point of approximately 236 K for eachdroplet size, in good agreement with previous literature reports.
An aerosol microphysics model was used to determine values of the temperature-dependent, volume-based homogeneous nucleation rate coefficient, JV (T ), from ex-15
perimental measurements. Mass accommodation coefficients for water molecules onliquid water,αw , and ice, αice, were obtained from the model fits to experimental mea-surements. The fits were particularly sensitive to the value of αice, which is a keyparameter in cloud models (e.g. Cotton et al., 2007; Jensen et al., 1998) because itinfluences the value of the vapour-phase diffusion coefficient, and thus the rate of ice20
particle growth via mass transfer. Mass accommodation coefficients from model fitsto groups of experiments for each droplet size were averaged to obtain αw=0.054 andαice=0.031.
The JV (T ) curves determined for droplets with mode radii of 1.0, 1.7, and 2.9µmshow a distinct size dependence, with the magnitude of JV (T ) increasing with decreas-25
ing droplet size. This indicates that the freezing of these droplets cannot be describedsolely using the classical, volume-based nucleation theory; rather, the contribution of
22909
ACPD9, 22883–22927, 2009
Volume nucleationrates for
homogeneousfreezing
M. E. Earle et al.
Title Page
Abstract Introduction
Conclusions References
Tables Figures
J I
J I
Back Close
Full Screen / Esc
Printer-friendly Version
Interactive Discussion
surface nucleation appears to increase with decreasing droplet size, reflecting highersurface-to-volume ratios. These results are consistent with the suggestion by Duft andLeisner (2004) that the surface nucleation rate could become comparable to the volumerate at radii below approximately 4µm.
Surface nucleation of small droplets will modulate the formation of cirrus clouds,5
altering the concentrations and sizes of ice crystals that would be produced as com-pared to volume-only nucleation scenarios. This has potentially important ramificationsfor bulk parameterizations in numerical models, which typically employ temperature-and composition-dependent formulations for the homogeneous nucleation rate coeffi-cient based solely on the classical, volume-based approach (Karcher and Lohmann,10
2002; Liu and Penner, 2005). Any contribution from a surface-based process will alterthe predicted characteristics of ice formation and growth, and in turn, the predictedcloud microphysical and radiative properties. Further work is required to develop asize-dependent parameterization for homogeneous nucleation that accounts for bothvolume- and surface-based processes, as considered in a related manuscript (Kuhn et15
al., 2009).
Acknowledgements. This research was supported by the Natural Sciences and EngineeringResearch Council of Canada, the Canadian Foundation for Climate and Atmospheric Science,and the Ontario Research and Development Challenge Fund. The authors would also like tothank Alex Zasetsky for invaluable input throughout this project, Brendan Pinto and Monica Har-20
vey for assistance with the experimental measurements and microphysics model, and WaydeJohnson for conducting the CFD analysis of our AFT.
References
Anderson, R. J., Miller, R. C., Kassner, J. L., and Hagen, D. E.: A study of homogeneouscondensation-freezing nucleation of small water droplets in an expansion cloud chamber, J.25
Atmos. Sci., 37, 2508–2520, 1980.Bohren, C. F. and Huffman, D. R.: Absorption and Scattering of Light by Small Particles, John
Wiley and Sons, Inc., New York, 530p., 1983.22910
ACPD9, 22883–22927, 2009
Volume nucleationrates for
homogeneousfreezing
M. E. Earle et al.
Title Page
Abstract Introduction
Conclusions References
Tables Figures
J I
J I
Back Close
Full Screen / Esc
Printer-friendly Version
Interactive Discussion
Butorin, G. T. and Skripov, V. P.: Crystallization in supercooled water, Kristallografiya, 17, 379–384, 1972.
Chelf, J. H. and Martin, S. T.: Homogeneous ice nucleation in aqueous ammonium sulfateaerosol particles, J. Geophys. Res., 106, 1215–1226, 2001.
Choularton, T. W. and Latham, J.: Measurements of deposition coefficient for ice, and its appli-5
cation to cirrus seeding, Q. J. Roy. Meteorol. Soc., 103, 307–318, 1977.Clapp, M. L., Miller, R. E., and Worsnop, D. R.: Frequency-dependent optical-constants of water
ice obtained directly from aerosol extinction spectra, J. Phys. Chem., 99, 6317–6326, 1995.Cotton, R. J., Benz, S., Field, P. R., Mohler, O., and Schnaiter, M.: Technical Note: A numerical
test-bed for detailed ice nucleation studies in the AIDA cloud simulation chamber, Atmos.10
Chem. Phys., 7, 243–256, 2007,http://www.atmos-chem-phys.net/7/243/2007/.
Cziczo, D. J. and Abbatt, J. P. D.: Deliquescence, efflorescence, and supercooling of ammoniumsulfate aerosols at low temperature: implications for cirrus cloud formation and aerosol phasein the atmosphere, J. Geophys. Res., 104, 13781–13790, 1999.15
Demott, P. J. and Rogers, D. C.: Freezing nucleation rates of dilute-solution droplets measuredbetween −30-degrees-C and −40-degrees-C in laboratory simulations of natural clouds, J.Atmos. Sci., 47, 1056–1064, 1990.
Djikaev, Y. S., Tabazadeh, A., Hamill, P., and Reiss, H.: Thermodynamic conditions for thesurface-stimulated crystallization of atmospheric droplets, J. Phys. Chem. A, 106, 10247–20
10253, 2002.Duft, D. and Leisner, T.: Laboratory evidence for volume-dominated nucleation of ice in super-
cooled water microdroplets, Atmos. Chem. Phys., 4, 1997–2000, 2004,http://www.atmos-chem-phys.net/4/1997/2004/.
Glickman, T.: Glossary of meteorology, American Meteorological Society, Boston, 855p., 2000.25
Haynes, D. R., Tro, N. J., and George, S. M.: Condensation and evaporation of H2O on icesurfaces, J. Phys. Chem., 96, 8502–8509, 1992.
Heymsfield, A. J., Miloshevich, L. M., Schmitt, C., Bansemer, A., Twohy, C., Poellot, M. R.,Fridlind, A., and Gerber, H.: Homogeneous ice nucleation in subtropical and tropical convec-tion and its influence on cirrus anvil microphysics, J. Atmos. Sci., 62, 41–64, 2005.30
Hinds, W. C.: Aerosol technology: properties, behavior, and measurement of airborne Particles,Wiley-Interscience, Toronto, 483p., 1999.
Houzelot, J. L. and Villermaux, J.: Mass-transfer in annular cylindrical reactors in laminar-flow,
22911
ACPD9, 22883–22927, 2009
Volume nucleationrates for
homogeneousfreezing
M. E. Earle et al.
Title Page
Abstract Introduction
Conclusions References
Tables Figures
J I
J I
Back Close
Full Screen / Esc
Printer-friendly Version
Interactive Discussion
Chem. Eng. Sci., 32, 1465–1470, 1977.Hung, H. M., Malinowski, A., and Martin, S. T.: Ice nucleation kinetics of aerosols containing
aqueous and solid ammonium sulfate particles, J. Phys. Chem. A, 106, 293–306, 2002.Hung, H. M. and Martin, S. T.: Apparent freezing temperatures modeled for several experimen-
tal apparatus, J. Geophys. Res.-Atmos., 106, 20379–20394, 2001.5
Jensen, E. J., Toon, O. B., Tabazadeh, A., Sachse, G. W., Anderson, B. E., Chan, K. R., Twohy,C. W., Gandrud, B., Aulenbach, S. M., Heymsfield, A., Hallett, J., and Gary, B.: Ice nucleationprocesses in upper tropospheric wave-clouds observed during SUCCESS, Geophys. Res.Lett., 25, 1363-1366, 1998.
Karcher, B. and Lohmann, U.: A parameterization of cirrus cloud formation: homogeneous10
freezing of supercooled aerosols, J. Geophys. Res.-Atmos., 107, AAC 4-1–AAC 4-10, 2002.Khalizov, A., Earle, M. E., Johnson, W. J. W., Stubley, G. D., and Sloan, J. J.: Develop-
ment and characterization of a laminar aerosol flow tube, Rev. Sci. Instrum., 77, 033102,doi:10.1063/1.2175958, 2006a.
Khalizov, A. F., Earle, M. E., Johnson, W. J. W., Stubley, G. D., and Sloan, J. J.: Modeling of15
flow dynamics in laminar aerosol flow tubes, J. Aerosol Sci., 37, 1174–1187, 2006b.Kramer, B., Hubner, O., Vortisch, H., Woste, L., Leisner, T., Schwell, M., Ruhl, E., and Baum-
gartel, H.: Homogeneous nucleation rates of supercooled water measured in single levitatedmicrodroplets, J. Chem. Phys., 111, 6521–6527, 1999.
Kuhn, T., Earle, M. E., Khalizov, A. F., and Sloan, J. J.: Size dependence of volume and surface20
nucleation rates for homogeneous freezing of supercooled water droplets, Atmos. Chem.Phys. Discuss., 9, 22929–22953, 2009,http://www.atmos-chem-phys-discuss.net/9/22929/2009/.
Lagarias, J. C., Reeds, J. A., Wright, M. H., and Wright, P. E.: Convergence properties of theNelder-Mead simplex method in low dimensions, Siam J. Optimiz., 9, 112–147, 1998.25
Lawson, R. P., Baker, B. A., Pilson, B., and Mo, Q.: In situ observations of the microphysicalproperties of wave, cirrus, and anvil clouds, Part II: cirrus clouds, J. Atmos. Sci., 63, 3186–3203, 2006.
Li, Y. Q., Davidovits, P., Shi, Q., Jayne, J. T., Kolb, C. E., and Worsnop, D. R.: Mass and thermalaccommodation coefficients of H2O(g) on liquid water as a function of temperature, J. Phys.30
Chem. A, 105, 10627–10634, 2001.Liou, K. N.: Influence of cirrus clouds on weather and climate processes: a global perspective,
Mon. Weather Rev., 114, 1167–1199, 1986.
22912
ACPD9, 22883–22927, 2009
Volume nucleationrates for
homogeneousfreezing
M. E. Earle et al.
Title Page
Abstract Introduction
Conclusions References
Tables Figures
J I
J I
Back Close
Full Screen / Esc
Printer-friendly Version
Interactive Discussion
Liu, X. and Penner, J. E.: Ice nucleation parameterization for global models, Meteorol. Z., 14,499–514, 2005.
Magee, N., Moyle, A. M., and Lamb, D.: Experimental determination of the depositioncoefficient of small cirrus-like ice crystals near-50 degrees C, Geophys. Res. Lett., 33,L17813, doi:10.1029/2006GL026665, 2006.5
Prakash, A., Bapat, A. P., and Zachariah, M. R.: A simple numerical algorithm and softwarefor solution of nucleation, surface growth, and coagulation problems, Aerosol Sci. Tech., 37,892–898, 2003.
Pratte, P., Van Den Bergh, H., and Rossi, M. J.: The kinetics of H2O vapor condensation andevaporation on different types of ice in the range 130–210 K, J. Phys. Chem. A, 110, 3042–10
3058, 2006.Pruppacher, H. R.: A new look at homogeneous ice nucleation in supercooled water drops, J.
Atmos. Sci., 52, 1924–1933, 1995.Pruppacher, H. R. and Klett, J. D.: Microphysics of Clouds and Precipitation, Kluwer Academic
Publishers, Boston, 954p., 1998.15
Shaw, R. A. and Lamb, D.: Experimental determination of the thermal accommodation andcondensation coefficients of water, J. Chem. Phys., 111, 10659–10663, 1999.
Stockel, P., Weidinger, I. M., Baumgartel, H., and Leisner, T.: Rates of homogeneous ice nu-cleation in levitated H2O and D2O droplets, J. Phys. Chem. A, 109, 2540–2546, 2005.
Tabazadeh, A., Djikaev, Y. S., Hamill, P., and Reiss, H.: Laboratory evidence for surface nu-20
cleation of solid polar stratospheric cloud particles, J. Phys. Chem. A, 106, 10238–10246,2002a.
Tabazadeh, A., Djikaev, Y. S., and Reiss, H.: Surface crystallization of supercooled water inclouds, P. Natl. Acad. Sci. USA., 99, 15873–15878, 2002b.
Taborek, P.: Nucleation in emulsified supercooled water, Phys. Rev. B, 32, 5902–5906, 1985.25
Turnbull, J. and Fisher, J. C.: Rate of nucleation in condensed systems, J. Chem. Phys., 17,71–73, 1949.
Villermaux, J.: Diffusion in a cylindrical reactor, Int. J. Heat Mass Transfer, 14, 1963–1981,1971.
Zasetsky, A. Y., Earle, M. E., Cosic, B., Schiwon, R., Grishin, I. A., McPhail, R., Pancescu, R.30
G., Najera, J., Khalizov, A. F., Cook, K. B., and Sloan, J. J.: Retrieval of aerosol physicaland chemical properties from mid-infrared extinction spectra, J. Quant. Spectrosc. Ra., 107,294–305, 2007.
22913

ACPD9, 22883–22927, 2009
Volume nucleationrates for
homogeneousfreezing
M. E. Earle et al.
Title Page
Abstract Introduction
Conclusions References
Tables Figures
J I
J I
Back Close
Full Screen / Esc
Printer-friendly Version
Interactive Discussion
Zasetsky, A. Y., Khalizov, A. F., Earle, M. E., and Sloan, J. J.: Frequency dependent complexrefractive indices of supercooled liquid water and ice determined from aerosol extinctionspectra, J. Phys. Chem. A, 109, 2760–2764, 2005.
Zasetsky, A. Y., Khalizov, A. F., and Sloan, J. J.: Characterization of atmospheric aerosols frominfrared measurements: simulations, testing, and applications, Appl. Optics, 43, 5503–5511,5
2004a.Zasetsky, A. Y., Khalizov, A. F., and Sloan, J. J.: Local order and dynamics in supercooled
water: a study by IR spectroscopy and molecular dynamic simulations, J. Chem. Phys., 121,6941–6947, 2004b.
22914

ACPD9, 22883–22927, 2009
Volume nucleationrates for
homogeneousfreezing
M. E. Earle et al.
Title Page
Abstract Introduction
Conclusions References
Tables Figures
J I
J I
Back Close
Full Screen / Esc
Printer-friendly Version
Interactive Discussion
Table 1. Minimization parameters from group fits for each droplet size.
Radius χ AV BV αw αice(µm) (J) (J/K)
1.0 3.68·10−3 −2.592393·10−18 −1.186721·10−20 0.054 0.0301.7 3.50·10−3 −2.527704·10−18 −1.159562·10−20 0.063 0.0302.9 2.14·10−3 −2.386266·10−18 −1.100254·10−20 0.039 0.032
22915

ACPD9, 22883–22927, 2009
Volume nucleationrates for
homogeneousfreezing
M. E. Earle et al.
Title Page
Abstract Introduction
Conclusions References
Tables Figures
J I
J I
Back Close
Full Screen / Esc
Printer-friendly Version
Interactive Discussion
Fig. 1. Setup of cryogenic aerosol flow tube apparatus showing the three alternative configu-rations for aerosol generation.
22916
ACPD9, 22883–22927, 2009
Volume nucleationrates for
homogeneousfreezing
M. E. Earle et al.
Title Page
Abstract Introduction
Conclusions References
Tables Figures
J I
J I
Back Close
Full Screen / Esc
Printer-friendly Version
Interactive Discussion
Fig. 2. Volume size distributions of supercooled water droplets after conditioning at 240 K. Thedroplets have mode radii of 1.0µm (small), 1.7µm (medium), and 2.9µm (large), correspond-ing to the generation methods of heterogeneous condensation, atomization, and nebulization,respectively (Fig. 1).
22917

ACPD9, 22883–22927, 2009
Volume nucleationrates for
homogeneousfreezing
M. E. Earle et al.
Title Page
Abstract Introduction
Conclusions References
Tables Figures
J I
J I
Back Close
Full Screen / Esc
Printer-friendly Version
Interactive Discussion
Fig. 3. Experimental extinction spectra obtained from freezing experiments using mediumdroplets generated by atomization at different candidate freezing temperatures. The spectracalculated from the retrieved size distributions are overlaid in black.
22918

ACPD9, 22883–22927, 2009
Volume nucleationrates for
homogeneousfreezing
M. E. Earle et al.
Title Page
Abstract Introduction
Conclusions References
Tables Figures
J I
J I
Back Close
Full Screen / Esc
Printer-friendly Version
Interactive DiscussionFig. 4. Volume size distributions obtained using the aerosol retrieval procedure with the exper-imental spectra from freezing experiments using medium droplets in Fig. 3. The correspondingcandidate freezing temperatures are indicated for the individual experiments.
22919

ACPD9, 22883–22927, 2009
Volume nucleationrates for
homogeneousfreezing
M. E. Earle et al.
Title Page
Abstract Introduction
Conclusions References
Tables Figures
J I
J I
Back Close
Full Screen / Esc
Printer-friendly Version
Interactive Discussion
Fig. 5. Freezing curves determined from volume size distributions for experiments using eachinitial droplet size.
22920
ACPD9, 22883–22927, 2009
Volume nucleationrates for
homogeneousfreezing
M. E. Earle et al.
Title Page
Abstract Introduction
Conclusions References
Tables Figures
J I
J I
Back Close
Full Screen / Esc
Printer-friendly Version
Interactive Discussion
Fig. 6. Time evolution of volume distributions of supercooled water (solid lines) and ice (dashedlines) at 0, 11.6, 23.1, and 34.7 s for a sample model run for medium droplets at 235.7 K.
22921

ACPD9, 22883–22927, 2009
Volume nucleationrates for
homogeneousfreezing
M. E. Earle et al.
Title Page
Abstract Introduction
Conclusions References
Tables Figures
J I
J I
Back Close
Full Screen / Esc
Printer-friendly Version
Interactive Discussion
Fig. 7. Axial temperature profile and time evolution of far-field water vapour pressure, num-ber fraction of droplets nucleated, and volume fraction of ice calculated by the model for therun at 235.7 K (medium droplets). The solid squares indicate the times for which the volumedistributions of supercooled water and ice are shown in Fig. 6.
22922

ACPD9, 22883–22927, 2009
Volume nucleationrates for
homogeneousfreezing
M. E. Earle et al.
Title Page
Abstract Introduction
Conclusions References
Tables Figures
J I
J I
Back Close
Full Screen / Esc
Printer-friendly Version
Interactive Discussion
Fig. 8. Variation of χ with changes in mass accommodation coefficients αw and αice for therepresentative case of a partially frozen experiment for medium droplets at 235.7 K.
22923

ACPD9, 22883–22927, 2009
Volume nucleationrates for
homogeneousfreezing
M. E. Earle et al.
Title Page
Abstract Introduction
Conclusions References
Tables Figures
J I
J I
Back Close
Full Screen / Esc
Printer-friendly Version
Interactive Discussion
Fig. 9. Model fits to experimentally-measured distributions from partially frozen samples(medium droplets). The corresponding candidate freezing temperatures are indicated for theindividual experiments.
22924

ACPD9, 22883–22927, 2009
Volume nucleationrates for
homogeneousfreezing
M. E. Earle et al.
Title Page
Abstract Introduction
Conclusions References
Tables Figures
J I
J I
Back Close
Full Screen / Esc
Printer-friendly Version
Interactive Discussion
Fig. 10. Volume-based nucleation rate coefficients, JV , determined from single and group fitsto partially frozen experiments for medium droplets. The open diamonds indicate the lowesttemperature reached in each freezing experiment, and the dashed lines show the temperaturedependence of JV to 0.25 K above the minimum temperature.
22925
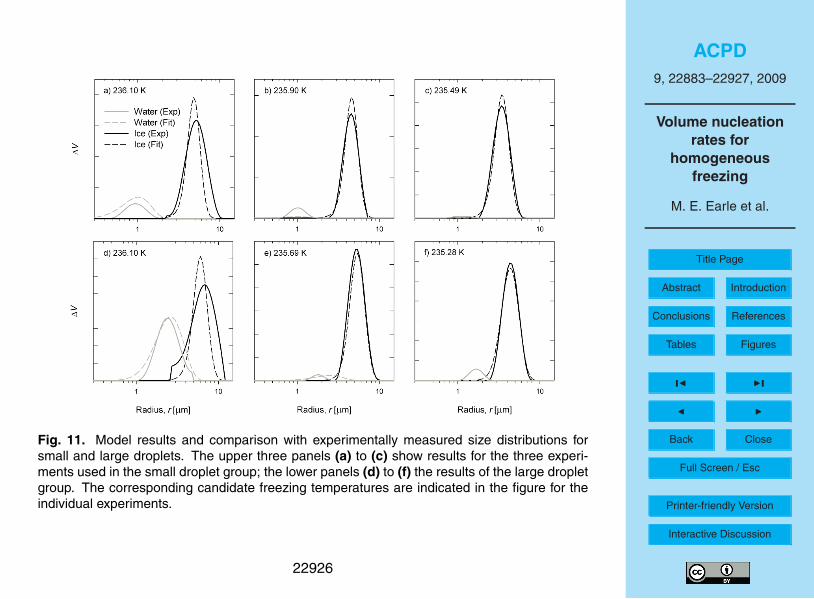
ACPD9, 22883–22927, 2009
Volume nucleationrates for
homogeneousfreezing
M. E. Earle et al.
Title Page
Abstract Introduction
Conclusions References
Tables Figures
J I
J I
Back Close
Full Screen / Esc
Printer-friendly Version
Interactive Discussion
Fig. 11. Model results and comparison with experimentally measured size distributions forsmall and large droplets. The upper three panels (a) to (c) show results for the three experi-ments used in the small droplet group; the lower panels (d) to (f) the results of the large dropletgroup. The corresponding candidate freezing temperatures are indicated in the figure for theindividual experiments.
22926

ACPD9, 22883–22927, 2009
Volume nucleationrates for
homogeneousfreezing
M. E. Earle et al.
Title Page
Abstract Introduction
Conclusions References
Tables Figures
J I
J I
Back Close
Full Screen / Esc
Printer-friendly Version
Interactive Discussion
Fig. 12. Volume-based homogeneous nucleation rate coefficients, JV (T ), determined frommodel fits to groups of experiments for small, medium, and large droplets. Literature values ofJV (T ) determined using levitated droplets in electrodynamic balances (squares) and expansioncloud chambers (triangles) are shown for comparison.
22927