volume 7, issue 5 informational graphics · informational graphics. the visual dimension. volume 7,...
TRANSCRIPT
[ABCDE]
© 2008 THE WASHINGTON POST COMPANYJanuary 8, 2008
INSIDEThe Priceof Protection27Making a
SmarterCard22Invasion
of the Critters19
VoluMe 7, ISSue 5
Meet theGraphicseditor8
Informational GraphicsThe Visual Dimension

VoluMe 7, ISSue 5
An Integrated Curriculum For The Washington Post Newspaper In education Program
January 8, 2008�
© 2008 THE WASHINGTON POST COMPANY
Lesson: Informational graphics communicate information quickly and accurately, explain complex ideas, and draw the reader into text.
Level: Low to highSubjects: Art, Computer Graphics, Mathematics, ScienceRelated Activity: Language Arts, Geography, History, Technology
NIE Online Guide Editor — Carol Lange Art Editor — Carol Porter
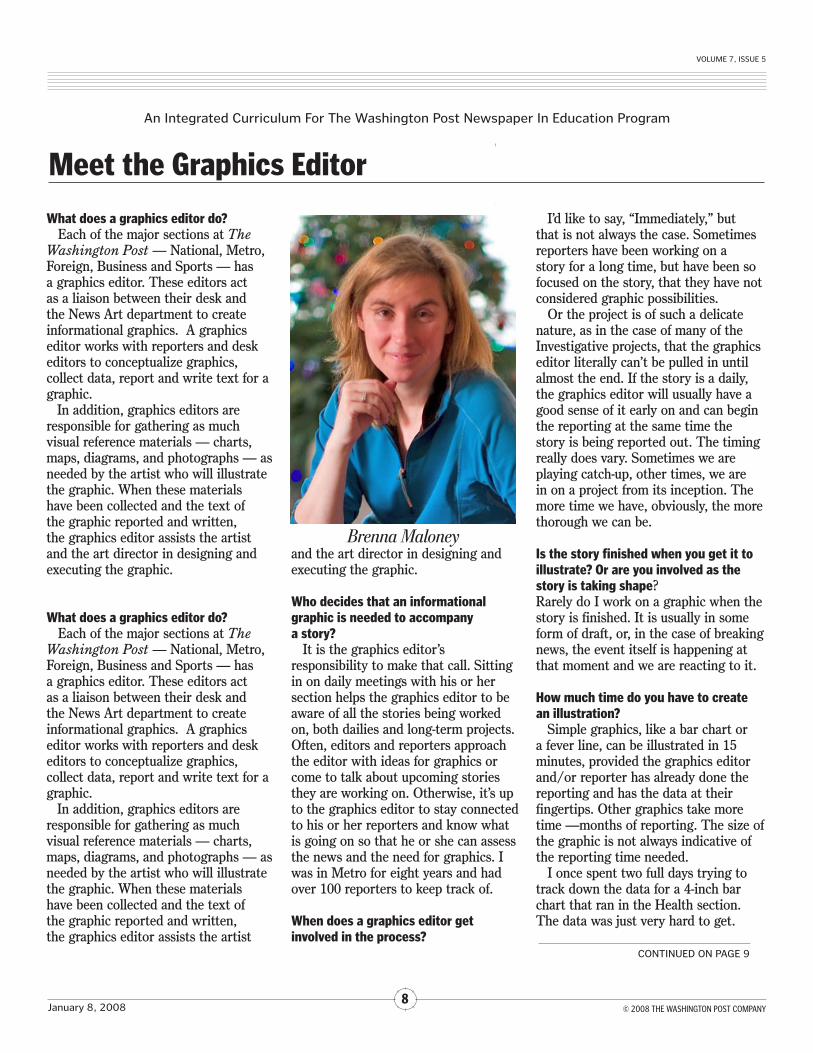
Contributing to this guide: KidsPost Deputy Editor Brenna Maloney drew upon her experience as Metro graphics editor and Features graphics editor at The Washington Post and graphics editor at National Geographic Magazine to answer all of our questions. She provides insight into the role of the graphics editor, working as a liaison between major sections of the newspaper and News Art’s artists and cartographers.
Washington Post News Art Assistant Managing Editor Michael Keegan advised and gave his full support to this project.
Send comments about this guide to: Margaret Kaplow, Educational Services Manager, [email protected]
A Word About Informational Graphics
Cave drawings, mathematic charts, troop movement diagrams and Metro maps. Through the ages, humans have instinctively known that visuals communicate information quickly.
Informational graphics are an important tool in communicating news and explaining complex ideas. The News Art department of The Post produces thousands of artworks each year — the maps, charts and informational graphics that help readers comprehend stories quickly.
These are drawn by hand, mixed media or computer assisted. “Our latest interest is in 3-dimensional graphics software that gives us the ability to model, for example, anything from the international space station to a mosquito. Our cartographers are experimenting with GIS-based mapping systems and satellite photography,” states Michael Keegan, AME/News Art.
They are the work of 4 managers, 2 designers, 6 informational graphics specialists, 3 cartographers, 10 feature section designers, 2 part-time staff and 5 graphics editors (assigned to National, Metro, Foreign, Business, Food, Home, Health and Sports). They please the eye, inform and educate Post readers every day.
The examples that are included in this guide reflect the variety and types of informational graphics to be found in The Post. Use them in art and language arts, biology and health, mathematics and science, history and technology classes. They reflect career opportunities and inter-disciplinary studies. They are sources of information, models and inspiration for projects.
VoluMe 7, ISSue 5
An Integrated Curriculum For The Washington Post Newspaper In education Program
January 8, 2008�
© 2008 THE WASHINGTON POST COMPANY
CoNTINued oN PAGe �
The informational graphics, also called infographics, in this guide stand alone to communicate information and model interdisciplinary projects. Select from the suggested activities ones that are appropriate for the age of your students, time available and curriculum fit.
Define InfographicsGive students The Post. With a
crayon or marker they are to circle in each section anything that is not a headline, story, photograph and caption or an advertisement. What remains are maps, art illustrations, charts and graphs. This is the work of the News Art department.
The artists and cartographers in News Art create the visuals that communicate ideas that can be hard to understand with words alone.
These informational graphics — maps, charts and graphs (fever-line, pie or bar), timelines, flow diagrams, poll charts and art illustrations help readers comprehend stories quickly. Teachers may use “Informational Graphics Collection” at this time to acquaint students with the many types of devices.
Read the Graphic CartoonEditorial cartoons are often based
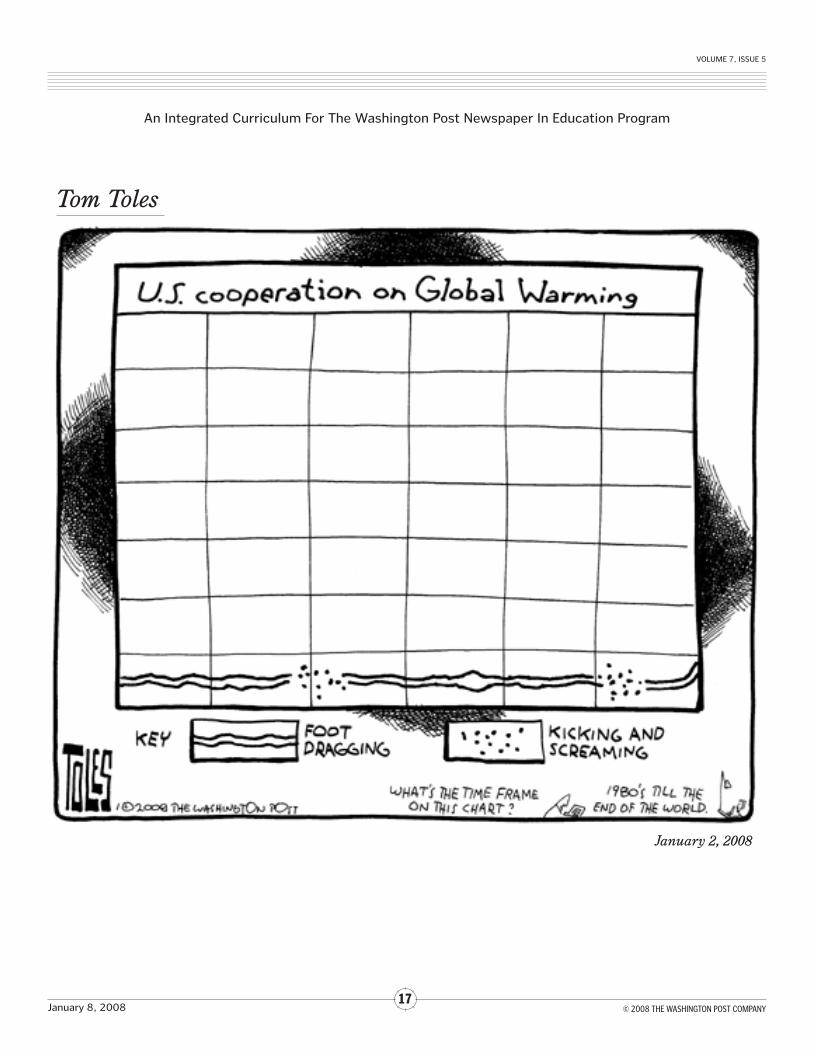
on events and actions. Although they have a point of view, they are more than the cartoonist’s opinion. Research and the results of studies inform the images that appear before the reader. Give students “Test: Interpret This Graph” by Washington Post editorial cartoonist Tom Toles. Questions that you may discuss include:• What is the topic of the graph?
• What does the graph indicate?• How does this graph differ from
an informational graph that News Art or students might prepare on the same topic? [Toles includes no statistics, no time frame, no source of data.]
• Who is taking the test?• What additional message is
conveyed through word choice (“tall,” “short,” and “like”) in the written response?
• From the continuation of the “answer” found in the lower right of the box, what do students believe is Toles’ perspective? Ask them to write a brief summary of his main idea.
• Do students agree with Toles’ point of view? Why?
• Is the graph an effective device to convey his commentary in compact, visual format?Teachers might provide students
with the facts, scores from international testing in math and science covering a ten- to 25-year period. Have students plot the numbers. Do they indicate the same decline or has Toles exaggerated to make his point?
Meet a Graphics EditorThe liaison between the reporters
in the sections of The Washington Post and the News Art department is the graphics editor. Read and discuss our interview with Brenna Maloney, former Metro graphics editor and Features graphics editor for The Washington Post and new deputy editor, KidsPost.
Maloney gives insight into the job and the process of creating an informational graphic. In addition
What Does That Mean?
Informational graphics are visual presentations of data, complex ideas, locations and functions. They are the graph, chart or art communicating ideas that can be hard to understand with words alone.
At The Washington Post, the News Art department creates the infographs — maps, charts, and illustrations that help readers comprehend stories quickly.
A map can be as simple as intersecting streets or as detailed as a relief map in which mountains, ice flow and animal movement are represented.
Charts, whether fever-line, pie or bar, with clarity display numeric relationships that may be hard to describe succinctly in a story. Timelines, flow diagrams and poll charts illustrate detailed information.
Informational graphics place readers at the scene.
They show the physical layers and complicated movements of machines and humans, inanimate objects and living beings.
Informational Graphics: The Visual Dimension
VoluMe 7, ISSue 5
An Integrated Curriculum For The Washington Post Newspaper In education Program
January 8, 2008�
© 2008 THE WASHINGTON POST COMPANY
to a focus on a career, the interview can be used in conjunction with graphics for which she was the graphics editor and/or reporter: “Chew on This,” “Invasion of the Critters,” and “Sinus Surgery.”
You might ask students to prepare an organization chart of News Art based upon information provided in the interview. Compare it with the organizational chart provided in this guide. (See “Informational Graphics Collection.”)
Review the Types of InfographicsDistribute “Informational
Graphics Collection” Students are to find examples of the devices listed. Teachers may follow-up this activity with an application/decision making problem. Give them data from your current study. Ask students to create an informational graphic using the data, selecting the best format in which to present the data.
Illustrate a ConceptThe successful informational
graphic draws the reader to and into the story, explains complex ideas and makes the point quickly. As part of a unit of study or research project, teachers could require students to produce an informational graphic. In this guide, we provide two examples of informational graphics and an editorial cartoon on the topic of global warming.
Before giving students the infographics, teachers may wish to read the opening paragraphs of the science news articles that these illustrate. (See “Climate Change Brings Risk of More Extinctions.”) What information is conveyed by the reporter?
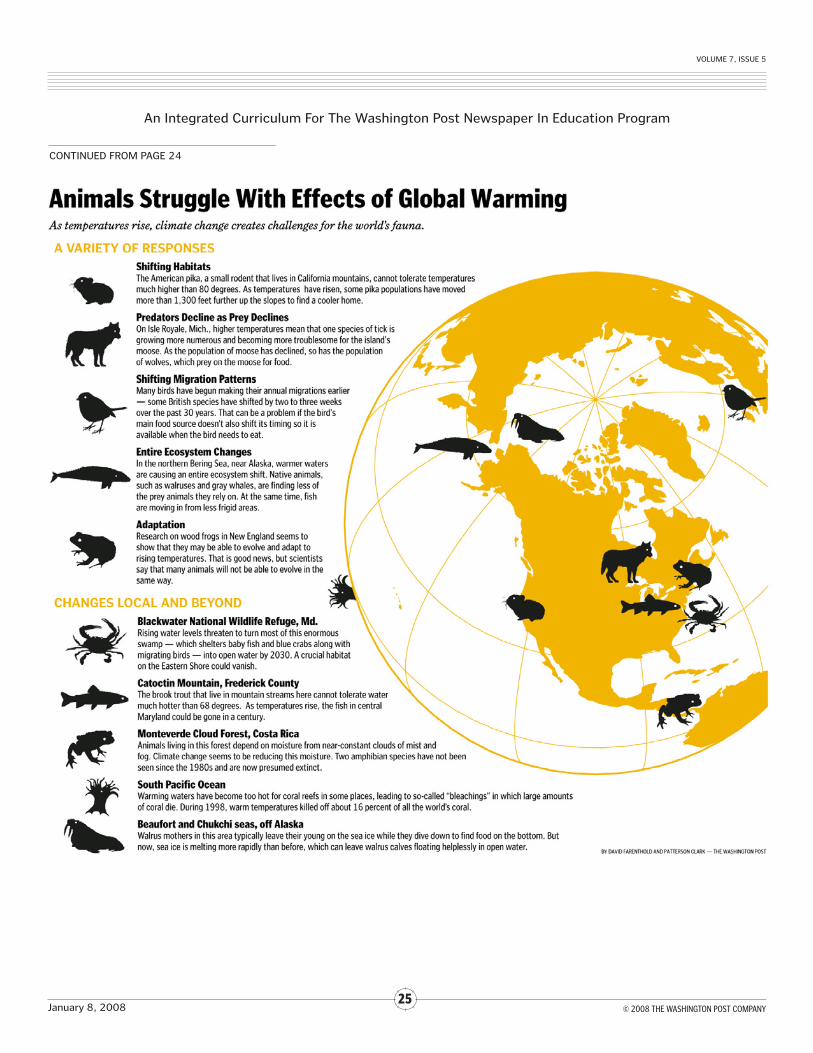
Science reporter David A. Fahrenthold covers the risk of extinction caused by the alteration of natural ecosystems. Give students “Animals Struggle With Effects of Global Warming” (third in the monthly series, In the Greenhouse). Looking only at the globe portion and headline, can students tell where and what animals are “struggling”? What do they already know about any of these regions? Read and discuss the explanatory copy. Note and discuss the use of black, stylized images and one color.
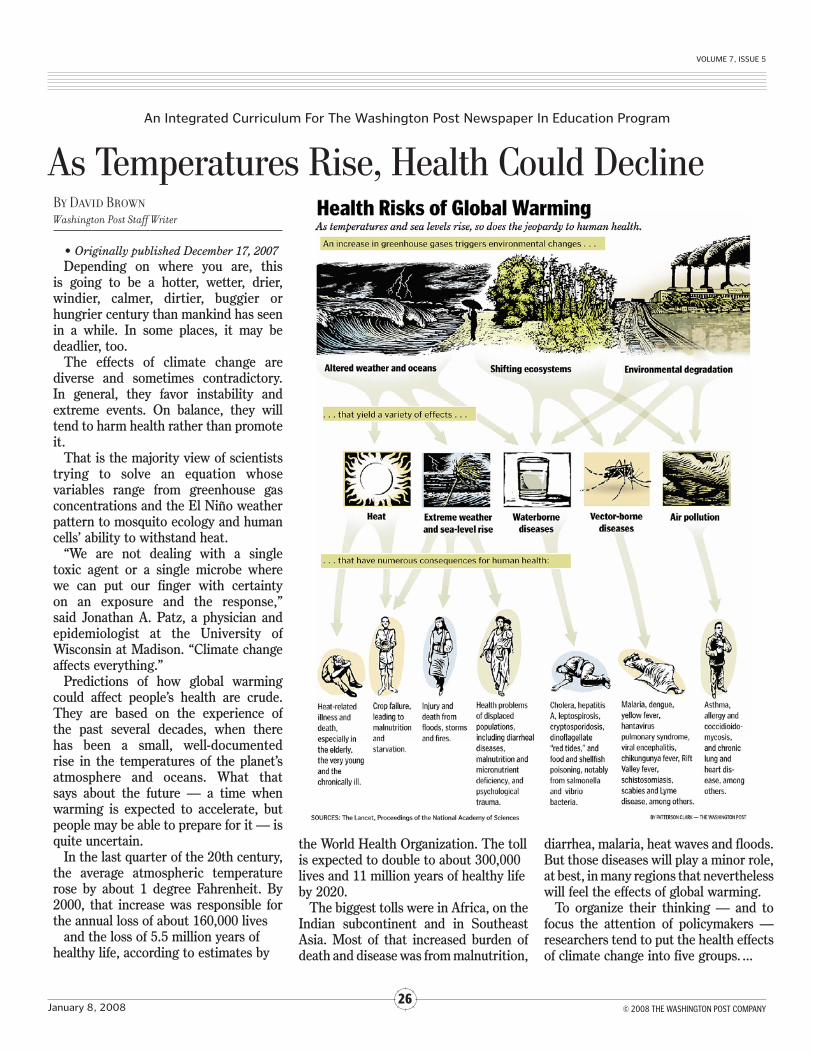
“As Temperatures Rise, Health Could Decline” (fifth in the series) is written by Post reporter David Brown. Discuss what is understood about the impact of climate change on human health as presented in the opening paragraphs of the article. The remainder of the article reports on the five areas into which researchers group health effects — heat stress, extreme weather, air pollution, waterborne and food-Borne Disease, and Vector-Borne Disease. News Art artist Patterson Clark illustrates the concepts in the “Health Risks of Global Warming” informational graphic. • Discuss the concepts presented in
the top portion of the illustration.• Brown notes that researchers,
aware of policymakers, have organized their findings in accessible groupings. Are the five main groups apparent to students who view the infograph?
• In what ways do the arrows and human figures assist in conveying the health risks?
A political dimension of global warming is addressed in editorial
CoNTINued FroM PAGe � Read About It
CoNTINued oN PAGe 5
The Newspaper Designer’s HandbookTim HarrowerMcGraw-Hill, 2007In its sixth edition, the step-by-step guide includes creation of maps, charts and diagrams as well as layout and typography guides. The examples are excellent and the suggested exercises develop student skills.
A Practical Guide to Graphics Reporting: Information Graphics for Print, Web and BroadcastJennifer George-PalilonisFocal Press, 2006How to create diagrams, charts, maps and other information graphics. Includes CD-ROM with interactive, animated information graphics.
The Best of Newspaper DesignSociety of News DesignRockport Publishers, annualA collection of professional winners in categories including art and illustration, news, and information graphics
VoluMe 7, ISSue 5
An Integrated Curriculum For The Washington Post Newspaper In education Program
January 8, 2008�
© 2008 THE WASHINGTON POST COMPANY
cartoonist Tom Toles’ Jan. 2, 2008, cartoon. He does not provide much of the data one would expect in a fever-line presentation. The reader, in the lower right corner, even calls attention to his failure to provide a time frame; Toles’ response re-enforces his less than optimistic point of view. Discuss with students the international documents and current context of the cartoon. • Why are the keys essential to
understanding the illustration?• In what ways does having
knowledge of fever-line charts help convey Toles’ point of view?
• Toles has a very sparse style. Some cartoonists would have added lines to show the most active countries on the chart to serve as a contrast to the U.S. policies. Would this have conveyed the message more clearly? What if other countries and another key that indicated swiftness of signing documents and level of involvement were added?
Practice Presenting DataWhat should one use? A bar
or pie chart, fever-line or chart? “Visualize the Numbers” is a template for circle, line and bar charts. Provide students with data drawn from a news, science, business or sports article — or have them read the article to collect the data. Give students data that might appear on standardized testing; ask them to select the appropriate template and plot data.
Analyze the Effect of DesignExamine several informational
graphics to study the impact of color on the design and on the reader’s response. After discussion, students could be asked to write
a one-page analysis of the use and impact of black and white and colors in infographics.
For practice, give students “Sight for Your Eyes: What Do Colors Mean?” • If only black and white were
available for printing, would this article have the same impact? Would infographics even have been used?
• How important are the illustrations in full color?
• There are several color swatches in “Some Other Colors.” What if four of them had been used instead of red, blue, green and yellow in the larger panel?Use the other example from
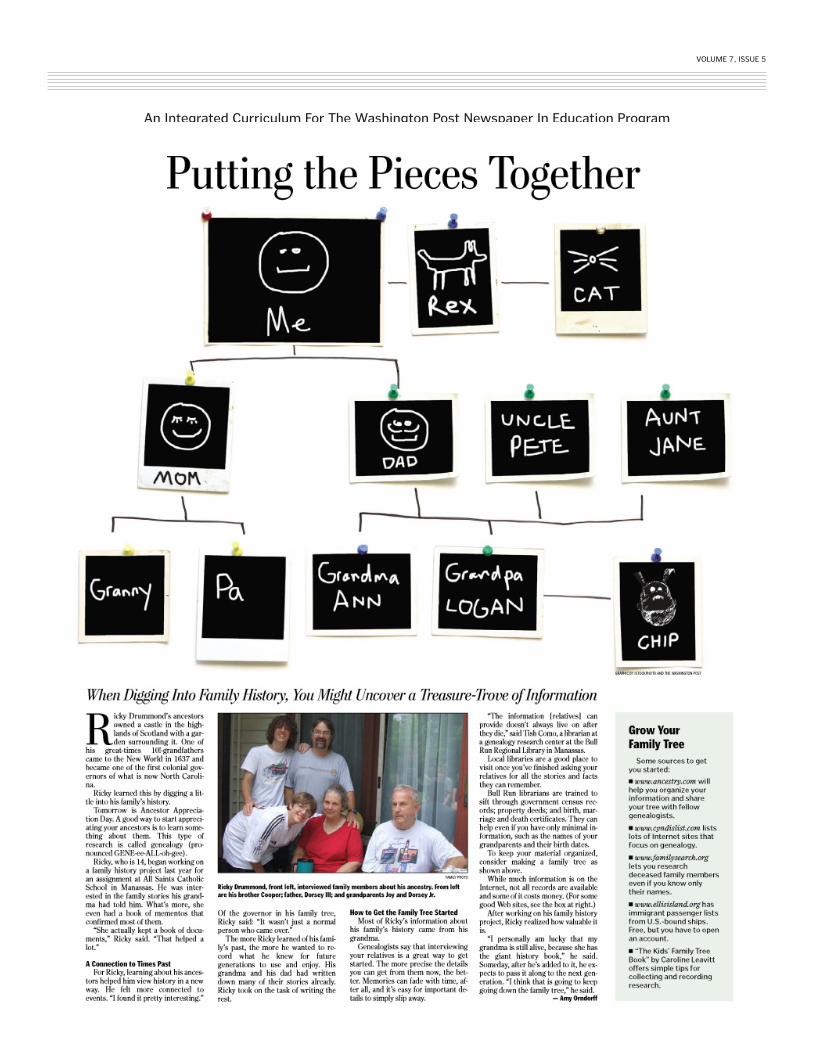
KidsPost in this guide, “Putting Pieces Together” to compare and contrast the design elements. Typography as well as color might be discussed. Contrast the tones of the two graphics. The topic of creating a family tree could be presented in a very traditional manner. How does the artist’s style influence the mood?
Organize Your GroupUse both the KidsPost “Putting
the Pieces Together” and the News Art organizational chart as examples. Students might be asked to create an organizational chart of the legislative branch of government, your school system or a club to which they belong. How does typography and type of line influence the tone?
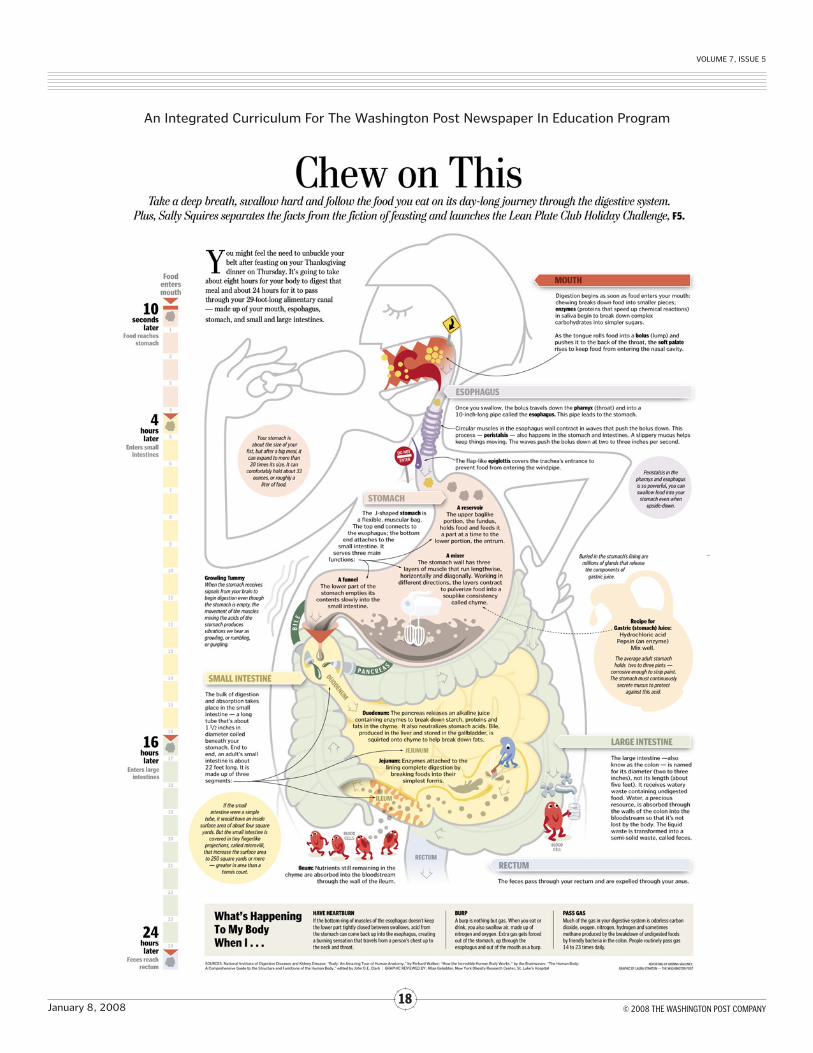
Chew on ThisLaura Stanton took a whimsical
look at the digestion process. Read Graphic Editor Brenna Maloney’s comments about this work. (See “Meet the Graphic Artist.”) Does the illustration need
CoNTINued FroM PAGe � Graphics & Design
www.aiga.org/American Institute of Graphic ArtsThe professional association for design site is rich in visual stimulus. Be sure to view the Inspiration section archives.
www.snd.orgThe Society of News DesignSND’s mission is to enhance communication through excellence in visual journalism. Publishes The Best of Newspaper Design. Explore the site for resources (in print, video, PDF and podcast formats).
www.spj.org/sdxa2002b.aspSociety of Professional JournalistsSPJ Sigma Delta Chi awards include Informational Graphics.
www.societyillustrators.orgSociety of IllustratorsSite includes video archive of lectures and online exhibit. Begun in 1901, its first monthly dinners were attended by such prominent illustrators as Howard Pyle, Maxfield Parrish, N.C. Wyeth, Charles Dana Gibson, Frederic Remington and special guests like Mark Twain and Gloria Swanson.
www.spd.orgSociety of Publication DesignersWeb site has helpful Resources section. SPD encourages artistic excellence by judging annually the work of thousands of design professionals in the United States and abroad. “The activities of SPD promote the art director’s role as visual journalist and partner in the editorial process — the partner responsible for telescoping and shaping information, the one who gives tone to an editorial voice.”
CoNTINued oN PAGe �
VoluMe 7, ISSue 5
An Integrated Curriculum For The Washington Post Newspaper In education Program
January 8, 2008�
© 2008 THE WASHINGTON POST COMPANY
to be anatomically correct in this context? If the text is accurate, do readers/students get the same understanding of the process of digestion? Discuss the importance of knowing one’s audience when creating an informational graphic.
Face a Problem“Sinus Surgery: It Was All in
His Head” is a more anatomically correct illustration, including a photograph and computer model of the patient’s skull. This information graphic comes closer to the work of a medical illustrator. This informational graphic could be used in a biology, technology, advanced art or pre-med course.
Discussion in a biology course would cover defining and locating sinuses, detailing the ailment and attempted remedies. In a technology course, the focus could be on the use of computer imaging, CR scans, cameras and the microdebrider that both removes minute particles and shaves tissue. In a pre-med course, additional dialogue would be spent on the knowledge, precision and steady hand of the surgeon.
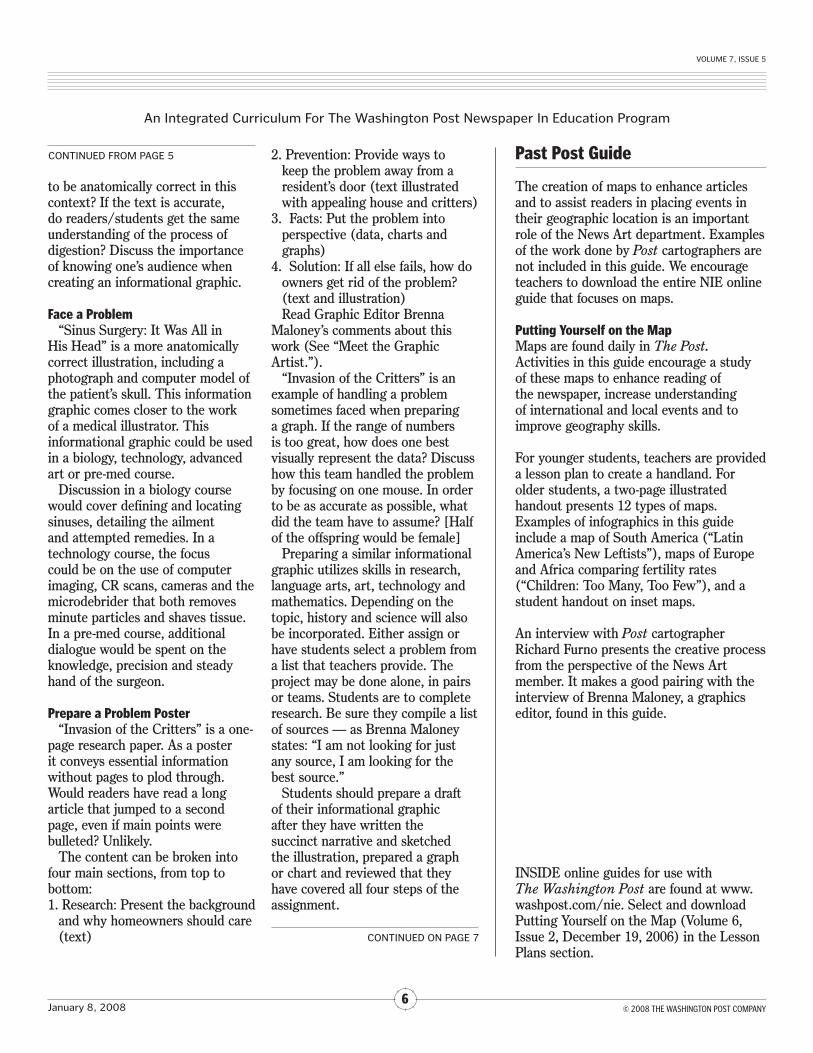
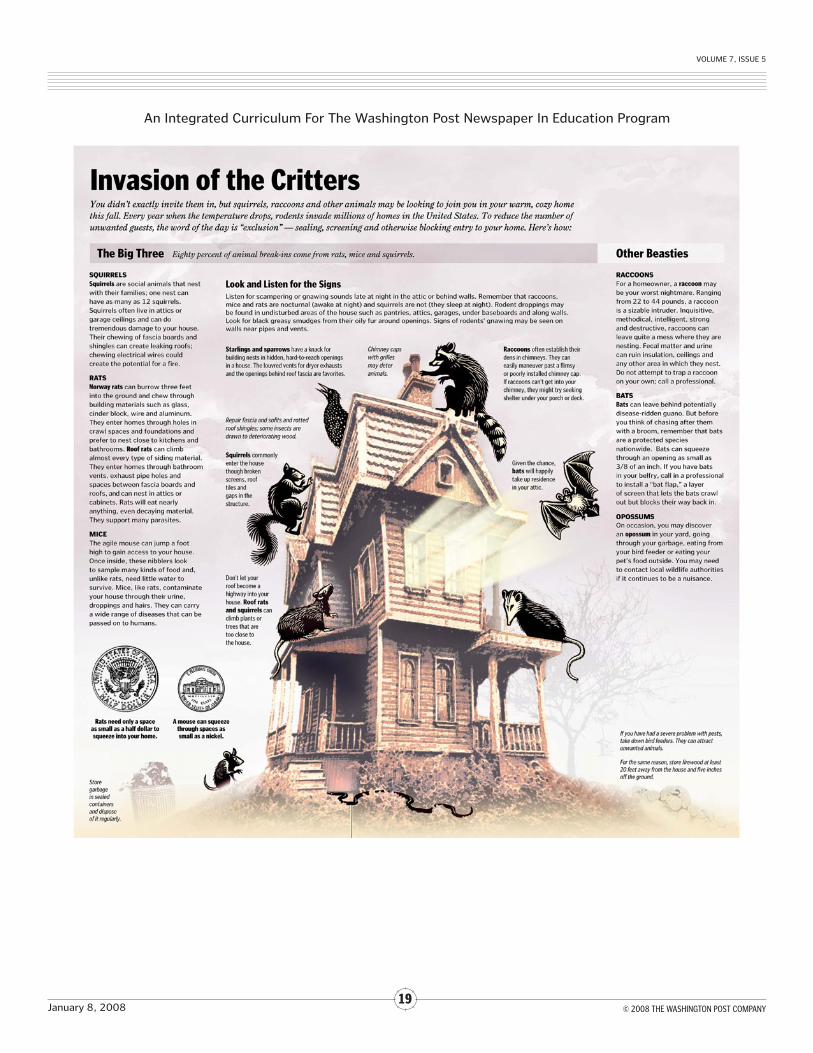
Prepare a Problem Poster“Invasion of the Critters” is a one-
page research paper. As a poster it conveys essential information without pages to plod through. Would readers have read a long article that jumped to a second page, even if main points were bulleted? Unlikely.
The content can be broken into four main sections, from top to bottom:1. Research: Present the background
and why homeowners should care (text)
2. Prevention: Provide ways to keep the problem away from a resident’s door (text illustrated with appealing house and critters)
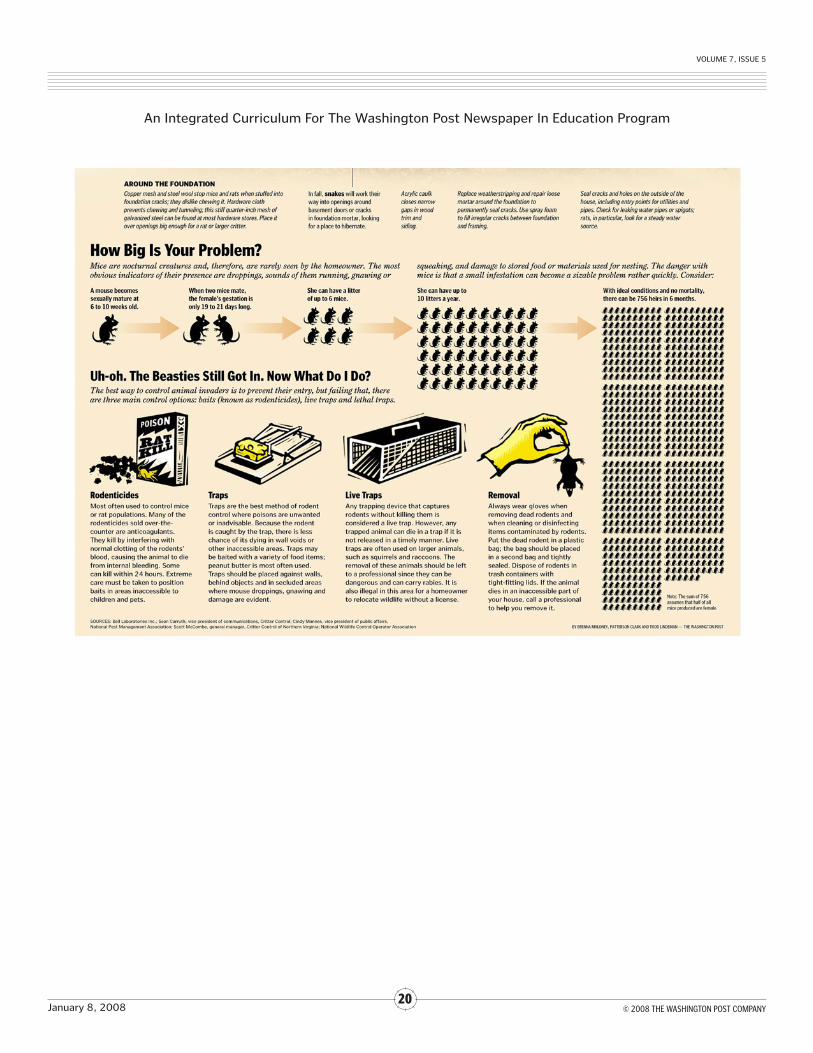
3. Facts: Put the problem into perspective (data, charts and graphs)
4. Solution: If all else fails, how do owners get rid of the problem? (text and illustration)Read Graphic Editor Brenna
Maloney’s comments about this work (See “Meet the Graphic Artist.”).
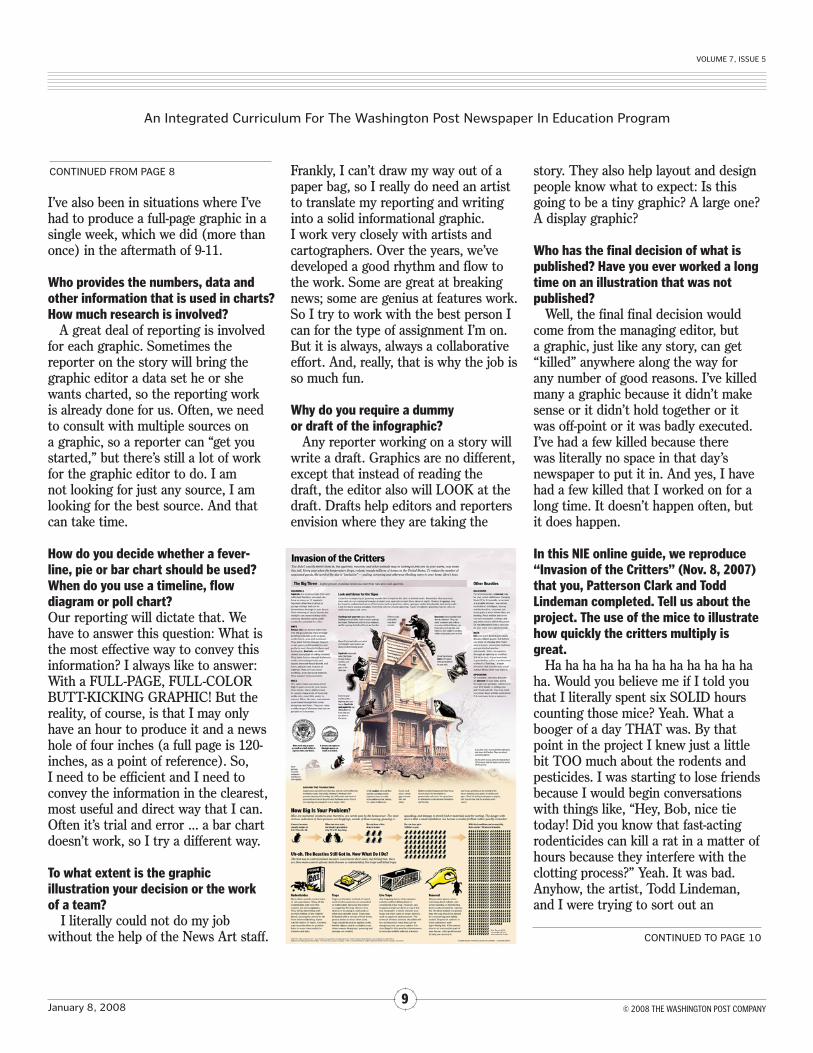
“Invasion of the Critters” is an example of handling a problem sometimes faced when preparing a graph. If the range of numbers is too great, how does one best visually represent the data? Discuss how this team handled the problem by focusing on one mouse. In order to be as accurate as possible, what did the team have to assume? [Half of the offspring would be female]
Preparing a similar informational graphic utilizes skills in research, language arts, art, technology and mathematics. Depending on the topic, history and science will also be incorporated. Either assign or have students select a problem from a list that teachers provide. The project may be done alone, in pairs or teams. Students are to complete research. Be sure they compile a list of sources — as Brenna Maloney states: “I am not looking for just any source, I am looking for the best source.”
Students should prepare a draft of their informational graphic after they have written the succinct narrative and sketched the illustration, prepared a graph or chart and reviewed that they have covered all four steps of the assignment.
CoNTINued FroM PAGe 5
CoNTINued oN PAGe 7
Past Post Guide
The creation of maps to enhance articles and to assist readers in placing events in their geographic location is an important role of the News Art department. Examples of the work done by Post cartographers are not included in this guide. We encourage teachers to download the entire NIE online guide that focuses on maps.
Putting Yourself on the MapMaps are found daily in The Post. Activities in this guide encourage a study of these maps to enhance reading of the newspaper, increase understanding of international and local events and to improve geography skills.
For younger students, teachers are provided a lesson plan to create a handland. For older students, a two-page illustrated handout presents 12 types of maps. Examples of infographics in this guide include a map of South America (“Latin America’s New Leftists”), maps of Europe and Africa comparing fertility rates (“Children: Too Many, Too Few”), and a student handout on inset maps.
An interview with Post cartographer Richard Furno presents the creative process from the perspective of the News Art member. It makes a good pairing with the interview of Brenna Maloney, a graphics editor, found in this guide.
INSIDE online guides for use with The Washington Post are found at www.washpost.com/nie. Select and download Putting Yourself on the Map (Volume 6, Issue 2, December 19, 2006) in the Lesson Plans section.
VoluMe 7, ISSue 5
An Integrated Curriculum For The Washington Post Newspaper In education Program
January 8, 2008�
© 2008 THE WASHINGTON POST COMPANY
Package the Court“Another Milestone for Stevens” is
a good example of packaging several forms of informational graphics to give a statistical sketch of a Supreme Court Justice. Review and discuss the different kinds of information that is provided. This was published November 16, 2007. When will Stevens have served the ninth-longest tenure?
Government students could be assigned other Supreme Court justices (past and present) to create a similar informational graphic package.
Get Smart How do they do that? In this case, how will the new SmarTrip card be able to compute all fares and special passes and allow riders to automatically add money?
An evaluation of the infographic would include:• Is the card recognizable to current
users? Does this help draw attention of the Metro rider to the article?
• How many layers compose the card? Do we know the exact number or get
a sense of the type of information embedded or printed on layers?
• Does the text provide enough information to explain how the card
will work?
Compare and Contrast Give students “The Price of Protection.” Looking first at the three illustrations, compare and contrast the protective wear worn by soldiers in the three wars. Note the details and number of items that can be contrasted from headgear to footwear. Use the data given to crunch the numbers. Do students’ numbers
correlate with those given in the text? Using the most recent figures on military having served in Iraq and Afghanistan, those that were injured and those who died, compare costs to those reported on November 13, 2007, when this ran in The Post. Student teams could be asked to research Revolutionary War, Civil War and Spanish American War uniforms, their expense and casualty/injury rates. They will need to convert expenses to inflation-adjusted dollars. Having the best sources for data is an important aspect of creating an infographic. With students review the Defense Manpower Data Center online material. Where else would you go to gather accurate data for the project?
CoNTINued FroM PAGe �
Artist’s Production Notes
Laura Stanton: Smarter Card
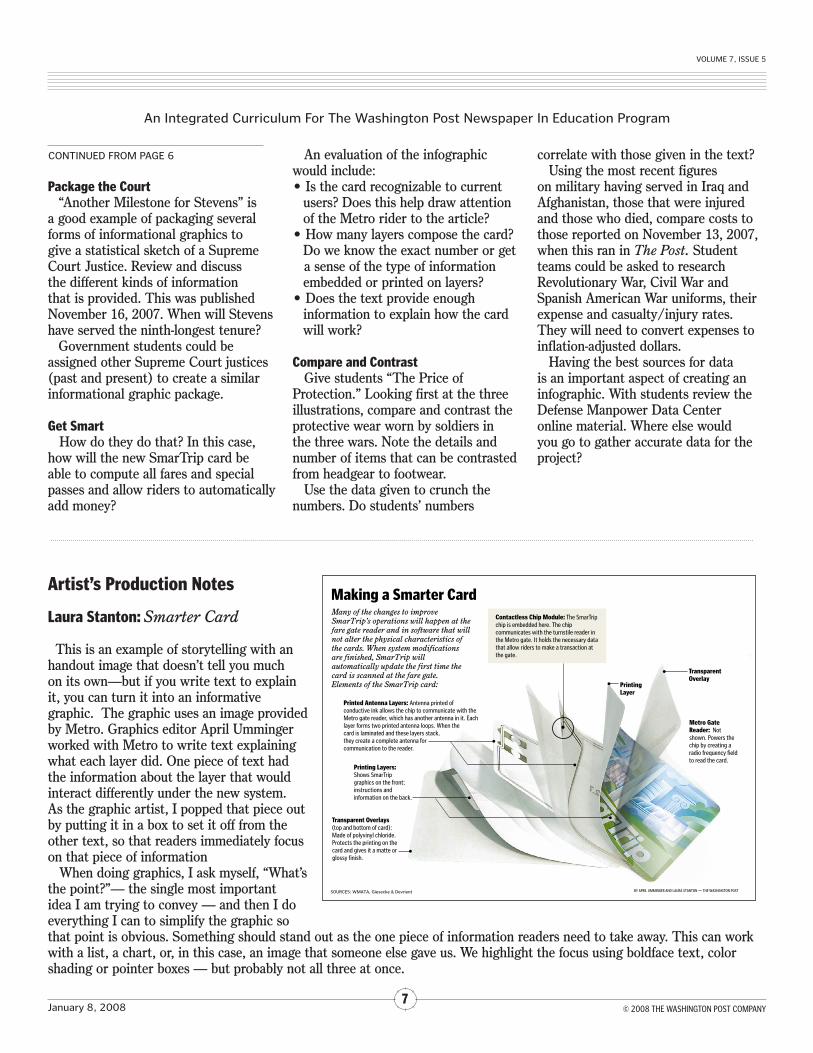
This is an example of storytelling with an handout image that doesn’t tell you much on its own—but if you write text to explain it, you can turn it into an informative graphic. The graphic uses an image provided by Metro. Graphics editor April Umminger worked with Metro to write text explaining what each layer did. One piece of text had the information about the layer that would interact differently under the new system. As the graphic artist, I popped that piece out by putting it in a box to set it off from the other text, so that readers immediately focus on that piece of information When doing graphics, I ask myself, “What’s the point?”— the single most important idea I am trying to convey — and then I do everything I can to simplify the graphic so that point is obvious. Something should stand out as the one piece of information readers need to take away. This can work with a list, a chart, or, in this case, an image that someone else gave us. We highlight the focus using boldface text, color shading or pointer boxes — but probably not all three at once.
DISTRICTEDITION
Commuter
DAILY 12-09-07 DC M1 C1 CMYK
By Lena H. SunWashington Post Staff Writer
Metro’s electronic SmarTrip cards are nogeniuses, but the agency hopes to make themMensa ready over the next year. New technol-ogy will allow the cards to compute all faresand special passes that Metro and most of itsregional bus partners offer, and make it fareasier to add money for trips.
As it stands, SmarTrip cards can’t do toomuch: Riders can use them to pay for a singlebus or subway ride and to park at Metro lots,most of which do not accept any other form ofpayment.
The cards cannot factor an array of specialpasses — such as Metrorail’s 7-Day Fast Pass,Montgomery County’s Ride-About and Alex-
andria’s DASH Pass — that many riders useto save money. So riders who park and usespecial passes must carry SmarTrip cards andold-fashioned paper cards. It costs Metroabout $500,000 a year for paper fare cards.
Technology upgrades will enable the elec-tronic cards to calculate special passes, al-lowing riders to ditch their paper cards andsaving the agency money.
To put money on the cards, riders mustnow use machines in subway stations or onbuses. Each trip deducts from their total, likea debit card.
The new technology will enable riders toautomatically add money to SmarTrip cardsthe same way drivers do with the popular E-
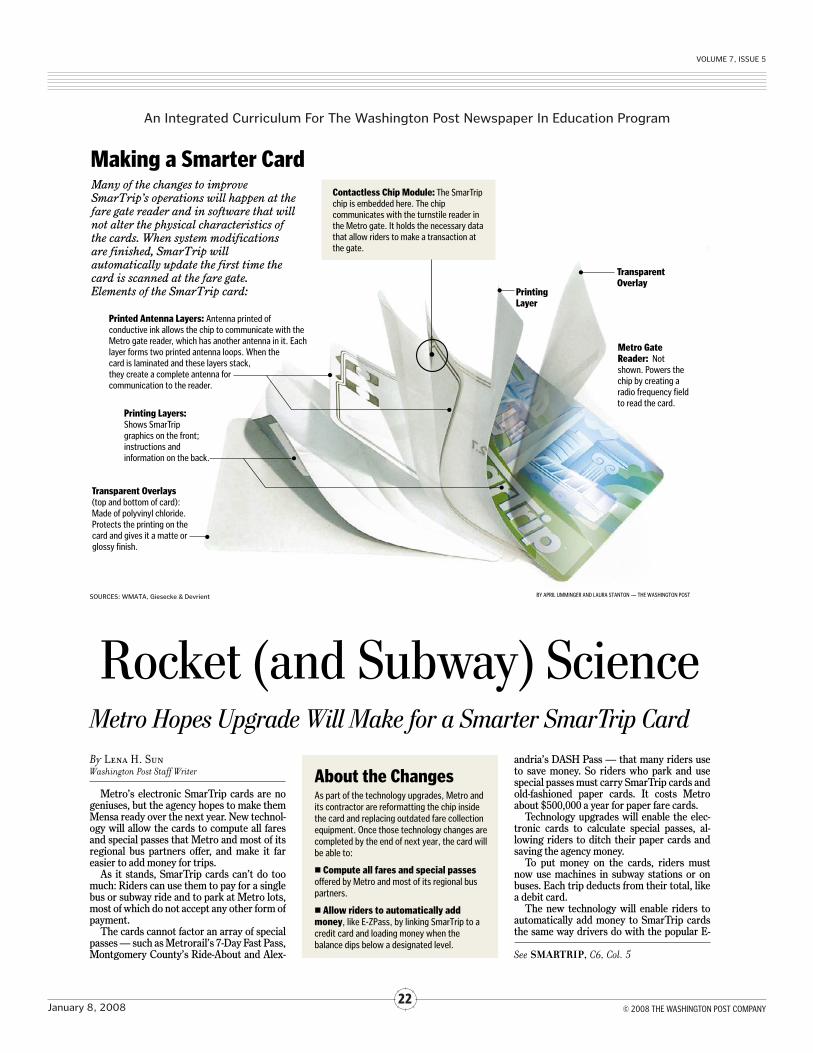
Many of the changes to improve SmarTrip’s operations will happen at the fare gate reader and in software that will not alter the physical characteristics of the cards. When system modifications are finished, SmarTrip will automatically update the first time thecard is scanned at the fare gate. Elements of the SmarTrip card:
Transparent Overlays(top and bottom of card): Made of polyvinyl chloride. Protects the printing on the card and gives it a matte or glossy finish.
Printing Layers:Shows SmarTripgraphics on the front; instructions and information on the back.
Contactless Chip Module: The SmarTrip chip is embedded here. The chip communicates with the turnstile reader in the Metro gate. It holds the necessary data that allow riders to make a transaction atthe gate.
Metro Gate Reader: Notshown. Powers the chip by creating a radio frequency field to read the card.
TransparentOverlay
PrintingLayer
Printed Antenna Layers: Antenna printed of conductive ink allows the chip to communicate with theMetro gate reader, which has another antenna in it. Each layer forms two printed antenna loops. When the card is laminated and these layers stack, they create a complete antenna for communication to the reader.
Making a Smarter Card
SOURCES: WMATA, Giesecke & Devrient BY APRIL UMMINGER AND LAURA STANTON — THE WASHINGTON POST
Rocket (and Subway) ScienceMetro Hopes Upgrade Will Make for a Smarter SmarTrip Card
As part of the technology upgrades, Metro and its contractor are reformatting the chip inside the card and replacing outdated fare collection equipment. Once those technology changes are completed by the end of next year, the card willbe able to:
ª Compute all fares and special passesoffered by Metro and most of its regional bus partners.
ª Allow riders to automatically add money, like E-ZPass, by linking SmarTrip to a credit card and loading money when the balance dips below a designated level.
About the Changes
See SMARTRIP, C6, Col. 5
O nce, we made special tripsdowntown this time of year,lining up to gape at mechanical
bears eating porridge, Victorian catscelebrating in the snow and toy soldiersguarding over our happy holidays.
Now, those same jumbo-size windowsin re-purposed downtown departmentstore buildings offer views of advertisingsigns, old photos and waiters grinding$12 guacamole.
This is progress?The grand old animated Christmas
window displays of the sort that oncehad Woodies, Hecht’s, Garfinckel’s andLansburgh’s competing to demonstratetheir creative extravagance are now
relegated to nostalgic memories, scenesin old movies and on New York’s FifthAvenue (and even there, the competingstores’ windows are all produced by onecompany).
The reasons for the demise of theChristmas window are well-known: Thedecline of the downtown departmentstore, the rise of windowless big-boxretailing, the replacement offamily-owned local shops by big nationalchains and the triumph of convenienceover showmanship.
“It was an amenity of thewalking-around town,” says William“Larry” Bird, a Smithsonian curatorwhose new book, “Holidays on Display,”
MARC FISHER
As Holiday Windows Have Vanished,A Bit of Winter Enchantment Has, Too
1950 PHOTO OF WOODWARD & LOTHROP WINDOWS — THE WASHINGTON POST
See FISHER, C6, Col. 1
tells the story of the art and business ofthe window shows. “Department storeslived and died by their windows. Theyspared no expense. This was the secularcreche.”
Oddly enough, in this era in whichtechnology has made it possible topersonalize retailing as never before,consumers expect less in the way ofservice and splendor. Businesses thatonce rose or fell on their ability to lavishcustomers with service — airlines,supermarkets, department stores — nowcompete to cut costs to the bone. Anynotion of romance in shopping has
Obituaries
Albert Viton, 94United Nations official wasalso a prolific writer onMiddle East issues. C7
Robert Carroll Vandivier, 82The former minister becamean advocate for the mentallyill and, later, for peace. C8
Index
LOTTERIES................................C4OBITUARIES .........................C7-8DEATH NOTICES................C8-10
Today’s Forecast
WEATHER...............................C12
36°9 a.m.
37°Noon
44°5 p.m.
47°9 p.m.
By Lena H. SunWashington Post Staff Writer
Days before the Metro board is scheduled to make a fi-nal decision on the largest proposed increases in subwayfares and parking fees, members from Maryland have of-fered an alternative that would soften the impact on sub-urban and long-distance rush-hour riders.
The Maryland proposal, which is being circulatedamong board members, seeks smaller increases in long-distance trips and parking hikes. Its backers say the planwould raise almost the same amount of money because itassumes that fewer riders will abandon the system be-cause of higher fares.
A decision on fares is expected Thursday, but if boardmembers don’t reach a consensus, it could be delayed.Metro officials have warned that delays will mean evenhigher increases later.
At public hearings last month, 150 people testified and272 more submitted written comments to the board.More than two-thirds were riders from Maryland andVirginia. Nearly half said the proposed increases weretoo high; nearly half also said unreliable bus and rail
service, poor communication about delays and malfunc-tioning escalators and elevators were among the reasonsfare increases were not justified, according to a Metro re-port.
Nearly one-fourth of all riders called the proposals un-fair to those who park and long-distance commuterstraveling during rush hours. Even the handful who sup-ported increasing fares said bus and off-peak subway rid-ers should share more of the costs.
About 13 percent of customers said the increaseswould hurt low- and middle-income riders like them-selves who could not afford to live in the District andhave moved to outlying suburbs.
“This takes into account our need to raise the neces-sary revenue while reflecting the comments in the publichearings,” said Maryland board member Peter Benja-min, referring to the latest plan. It has the support of theother voting Maryland member, board Chairman Eliza-beth Hewlett, and state Transportation Secretary JohnD. Porcari, he said.
Virginia members had mixed reactions. Chris Zim-
Md. Plan Would Lower Increases in Long-Distance Trips, Parking
See METRO, C6, Col. 1
Alternative Metro Fare Hikes ProposedBy Theresa Vargasand Michael LarisWashington Post Staff Writers
The Virginia Tech community hasreacted by the thousands over thepast few days to photographs postedon the Internet that show a couple ofPennsylvania State University stu-dents dressed up in Halloween cos-tumes mocking the April massacre.
Comments about the photos,which show students wearing blood-ied, bullet-riddled Virginia Techclothing, intensified on Facebook asmore people learned about them.What began as a volatile reaction,however, seemed to turn into a les-son of “rising above” the incident byyesterday.
“We rose above the very personwho killed our friends and family.We showed our incredible powerthen to will over negativity, and cando it again,” read the message fromVirginia Tech PhD student Ken Stan-ton yesterday at the top of a Face-book site called “People against thiscostume.” “While this incident in-volved students at Penn State, we
CostumesOf Cho VictimsRile Va. TechCommunity
See PHOTOS, C5, Col. 1
They’re just little thingsthat if fixed couldimprove our commute. Ina new feature, we’ll takeyour ideas to those incharge. C2
C1CMYK
C1CMYK
ABCDE][
METROSunday, December 9, 2007 DC M1
C
Also Today
THE DISTRICT
A Twist on DevelopmentIn Columbia HeightsWhen the city condemnedtheir building, a groupof women fought back. A1
Christmas Gone WildRevelers wearing holidaycostumes put a rowdy spinon the season. C4
Anacostia Cafe in JeopardyCustomers rally to try to savea neighborhood fixture. C3
Shifts in Library SystemSeveral employees let go;others retire in overhaul. C12
MARYLANDA Plea in Mortgage CrisisThe Rev. Jesse Jackson visitshard-hit Prince George’s to call for a remedy. A14
Firms Protest Sales TaxComputer services compa-nies want a levy passed in thespecial session repealed. C11
Sexual Assaults ExaminedAnnapolis and other militaryacademies focus of study. C3
VIRGINIAThree Seek U.S. House SeatA special election on Tuesdaywill determine who willreplace Jo Ann Davis (R),who died recently. C5
By Nikita StewartWashington Post Staff Writer
The District could become thefirst jurisdiction in the country to li-cense pharmaceutical sales repre-sentatives, a move a council membersays would help protect doctors andpatients from disreputable agentswho drive up the costs of prescrip-tion drugs.
The drug industry says the moveis unnecessary because it overlapswith federal laws.
The D.C. Council is set to voteTuesday on member David A. Cata-nia’s SafeRx Act, which would alsoban pharmaceutical manufacturersfrom using doctors’ prescriptiondata for marketing purposes with-out the doctors’ knowledge.
At issue, Catania (I-At Large) andhis allies say, is an industry whoserepresentatives can mislead doctorsand patients into buying the mostexpensive drugs on the market,shunning reasonably priced gener-ics or drugs that could be just as ef-fective. Because the agents’ salariesare dependent on sales, they some-times give the wrong impressionsabout drugs and present themselvesas medical professionals, Cataniasaid.
Other professions are licensed,Catania said — why not pharmaceu-
LicensingSought In DrugIndustryBill TargetsSales Agents
See LICENSING, C4, Col. 2
An Integrated Curriculum For The Washington Post Newspaper In education Program
January 8, 2008�
© 2008 THE WASHINGTON POST COMPANY
VoluMe 7, ISSue 5
What does a graphics editor do? Each of the major sections at The Washington Post — National, Metro, Foreign, Business and Sports — has a graphics editor. These editors act as a liaison between their desk and the News Art department to create informational graphics. A graphics editor works with reporters and desk editors to conceptualize graphics, collect data, report and write text for a graphic.
In addition, graphics editors are responsible for gathering as much visual reference materials — charts, maps, diagrams, and photographs — as needed by the artist who will illustrate the graphic. When these materials have been collected and the text of the graphic reported and written, the graphics editor assists the artist and the art director in designing and executing the graphic.
What does a graphics editor do? Each of the major sections at The Washington Post — National, Metro, Foreign, Business and Sports — has a graphics editor. These editors act as a liaison between their desk and the News Art department to create informational graphics. A graphics editor works with reporters and desk editors to conceptualize graphics, collect data, report and write text for a graphic.
In addition, graphics editors are responsible for gathering as much visual reference materials — charts, maps, diagrams, and photographs — as needed by the artist who will illustrate the graphic. When these materials have been collected and the text of the graphic reported and written, the graphics editor assists the artist
and the art director in designing and executing the graphic.
Who decides that an informational graphic is needed to accompany a story? It is the graphics editor’s responsibility to make that call. Sitting in on daily meetings with his or her section helps the graphics editor to be aware of all the stories being worked on, both dailies and long-term projects. Often, editors and reporters approach the editor with ideas for graphics or come to talk about upcoming stories they are working on. Otherwise, it’s up to the graphics editor to stay connected to his or her reporters and know what is going on so that he or she can assess the news and the need for graphics. I was in Metro for eight years and had over 100 reporters to keep track of.
When does a graphics editor get involved in the process?
I’d like to say, “Immediately,” but that is not always the case. Sometimes reporters have been working on a story for a long time, but have been so focused on the story, that they have not considered graphic possibilities. Or the project is of such a delicate nature, as in the case of many of the Investigative projects, that the graphics editor literally can’t be pulled in until almost the end. If the story is a daily, the graphics editor will usually have a good sense of it early on and can begin the reporting at the same time the story is being reported out. The timing really does vary. Sometimes we are playing catch-up, other times, we are in on a project from its inception. The more time we have, obviously, the more thorough we can be.
Is the story finished when you get it to illustrate? Or are you involved as the story is taking shape?Rarely do I work on a graphic when the story is finished. It is usually in some form of draft, or, in the case of breaking news, the event itself is happening at that moment and we are reacting to it.
How much time do you have to create an illustration? Simple graphics, like a bar chart or a fever line, can be illustrated in 15 minutes, provided the graphics editor and/or reporter has already done the reporting and has the data at their fingertips. Other graphics take more time —months of reporting. The size of the graphic is not always indicative of the reporting time needed. I once spent two full days trying to track down the data for a 4-inch bar chart that ran in the Health section. The data was just very hard to get.
CoNTINued oN PAGe 9
Meet the Graphics Editor
Brenna Maloney
VoluMe 7, ISSue 5
An Integrated Curriculum For The Washington Post Newspaper In education Program
January 8, 2008�
© 2008 THE WASHINGTON POST COMPANY
I’ve also been in situations where I’ve had to produce a full-page graphic in a single week, which we did (more than once) in the aftermath of 9-11.
Who provides the numbers, data and other information that is used in charts? How much research is involved? A great deal of reporting is involved for each graphic. Sometimes the reporter on the story will bring the graphic editor a data set he or she wants charted, so the reporting work is already done for us. Often, we need to consult with multiple sources on a graphic, so a reporter can “get you started,” but there’s still a lot of work for the graphic editor to do. I am not looking for just any source, I am looking for the best source. And that can take time.
How do you decide whether a fever-line, pie or bar chart should be used?When do you use a timeline, flow diagram or poll chart?Our reporting will dictate that. We have to answer this question: What is the most effective way to convey this information? I always like to answer:With a FULL-PAGE, FULL-COLOR BUTT-KICKING GRAPHIC! But the reality, of course, is that I may only have an hour to produce it and a news hole of four inches (a full page is 120-inches, as a point of reference). So, I need to be efficient and I need to convey the information in the clearest, most useful and direct way that I can. Often it’s trial and error … a bar chart doesn’t work, so I try a different way.
To what extent is the graphic illustration your decision or the work of a team? I literally could not do my job without the help of the News Art staff.
Frankly, I can’t draw my way out of a paper bag, so I really do need an artist to translate my reporting and writing into a solid informational graphic. I work very closely with artists and cartographers. Over the years, we’ve developed a good rhythm and flow to the work. Some are great at breaking news; some are genius at features work. So I try to work with the best person I can for the type of assignment I’m on. But it is always, always a collaborative effort. And, really, that is why the job is so much fun.
Why do you require a dummy or draft of the infographic? Any reporter working on a story will write a draft. Graphics are no different, except that instead of reading the draft, the editor also will LOOK at the draft. Drafts help editors and reporters envision where they are taking the
story. They also help layout and design people know what to expect: Is this going to be a tiny graphic? A large one? A display graphic?
Who has the final decision of what is published? Have you ever worked a long time on an illustration that was not published? Well, the final final decision would come from the managing editor, but a graphic, just like any story, can get “killed” anywhere along the way for any number of good reasons. I’ve killed many a graphic because it didn’t make sense or it didn’t hold together or it was off-point or it was badly executed. I’ve had a few killed because there was literally no space in that day’s newspaper to put it in. And yes, I have had a few killed that I worked on for a long time. It doesn’t happen often, but it does happen.
In this NIE online guide, we reproduce “Invasion of the Critters” (Nov. �, �00�) that you, Patterson Clark and Todd Lindeman completed. Tell us about the project. The use of the mice to illustrate how quickly the critters multiply is great. Ha ha ha ha ha ha ha ha ha ha ha ha ha. Would you believe me if I told you that I literally spent six SOLID hours counting those mice? Yeah. What a booger of a day THAT was. By that point in the project I knew just a little bit TOO much about the rodents and pesticides. I was starting to lose friends because I would begin conversations with things like, “Hey, Bob, nice tie today! Did you know that fast-acting rodenticides can kill a rat in a matter of hours because they interfere with the clotting process?” Yeah. It was bad. Anyhow, the artist, Todd Lindeman, and I were trying to sort out an
CoNTINued FroM PAGe 8
CoNTINued To PAGe 10
VoluMe 7, ISSue 5
An Integrated Curriculum For The Washington Post Newspaper In education Program
January 8, 200810
© 2008 THE WASHINGTON POST COMPANY
effective way to illustrate how serious a rodent problem can become if left alone. But we were getting tangled up in the math. If you start with two rats and they mate and she had six babies but only half of them are girls …. Well, we were into advanced algebra in no time. So, I contacted two separate rat experts and tried to work through the numbers over the phone. It was a nightmare. But it HAD to be correct. Readers will look at a graphic like that and they WILL COUNT EACH RAT and try the math themselves. You really, really need to be certain of what you are putting into a graphic. Six hours later, we were.
We also include “Chew on This”(Nov. �0, �00�) in this guide. The credits indicate that you did the reporting and Laura Stanton did the graphic. How did you work as a team and who provides the information that is published? I can easily say that Laura Stanton is one of the greatest newspaper artists in the known universe and every single graphics editor, to a man, would agree. On the digestion piece, I had done tons and tons of reporting, but there was not enough time to illustrate this piece in an anatomically correct way. Laura came to the rescue with a more relaxed approach. Why not make the art fun, she suggested? The text already had that bent, so her feature-y approach to the art made it a hit. (Only one small
regret … even though the art is not drawn to scale or anatomically correct, our epiglottis really is too low and we heard about that from readers. A lot of readers.)Do you have a favorite project or illustration? Why do you like it? I really do love working on full-page graphics. I like having that large canvas to tell a story exclusively through visuals. I find this work intense and challenging.
What training did you have? I have a bachelor’s degree in something called public and corporate communications (which included a lot of journalism, English, writing and communications courses) and a master’s degree in journalism. I was teaching journalism to high schoolers in the non-profit world before I came to the graphics world. I answered an ad that ran in The Post: Knight-Ridder Tribune (now McClatchy Tribune) was looking for a “graphics reporter.”
CoNTINued FroM PAGe9
About the Graphics Editor
Brenna Maloney earned a bachelor’s degree from Butler University in Indianapolis and a master’s degree from Michigan State University in East Lansing. She was a graphics reporter for Knight-Ridder Tribune (now McClatchy Tribune) for 4 years before becoming metro graphics editor at The Washington Post. After 8 years at The Post, Maloney became the first graphics editor for National Geographic Magazine. A year later, missing newspaper work, she returned to The Post as features graphic editor for the Health, Food and Home sections. She is currently deputy editor for KidsPost. She lives in Washington, D.C., with her husband and two young sons.
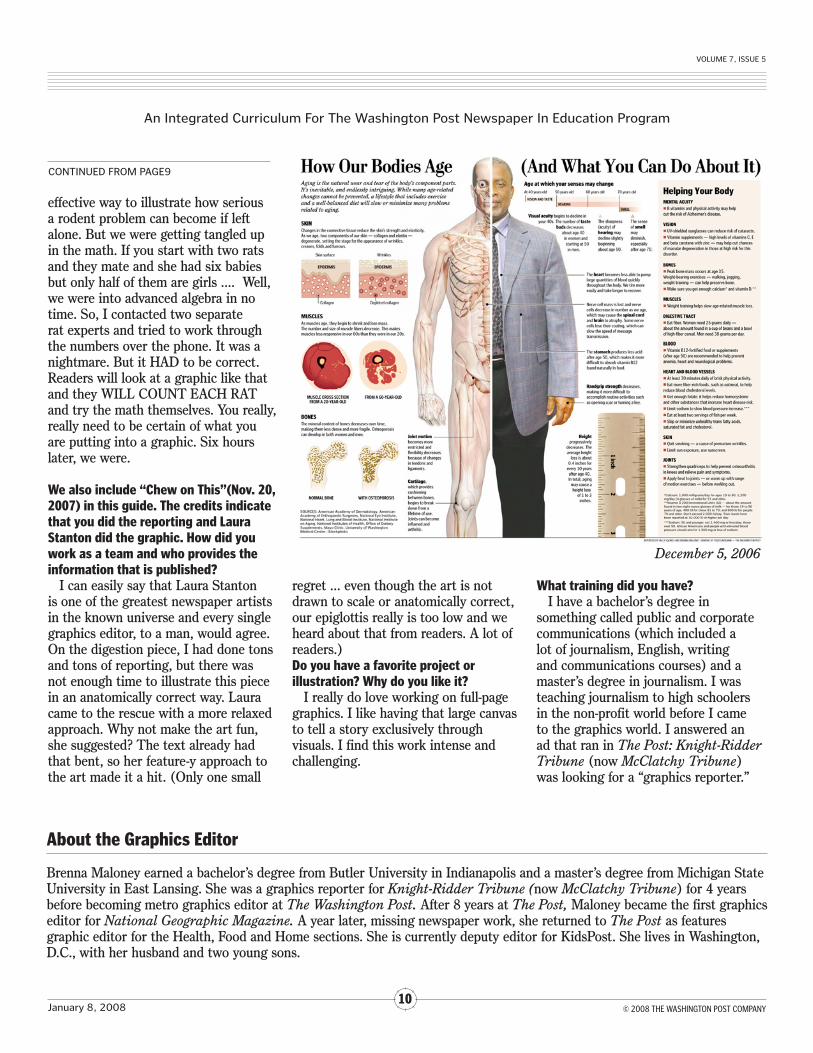
December 5, 2006
Name _______________________________________________________________ Date _____________________________
Bar graph
Line or fever-line graph
Line or bar graph indicating positive and negative values
Pie chart
Labeled drawing or graphic
Text placed in close proximity to a
supportive illustration or other visual, forming a unit
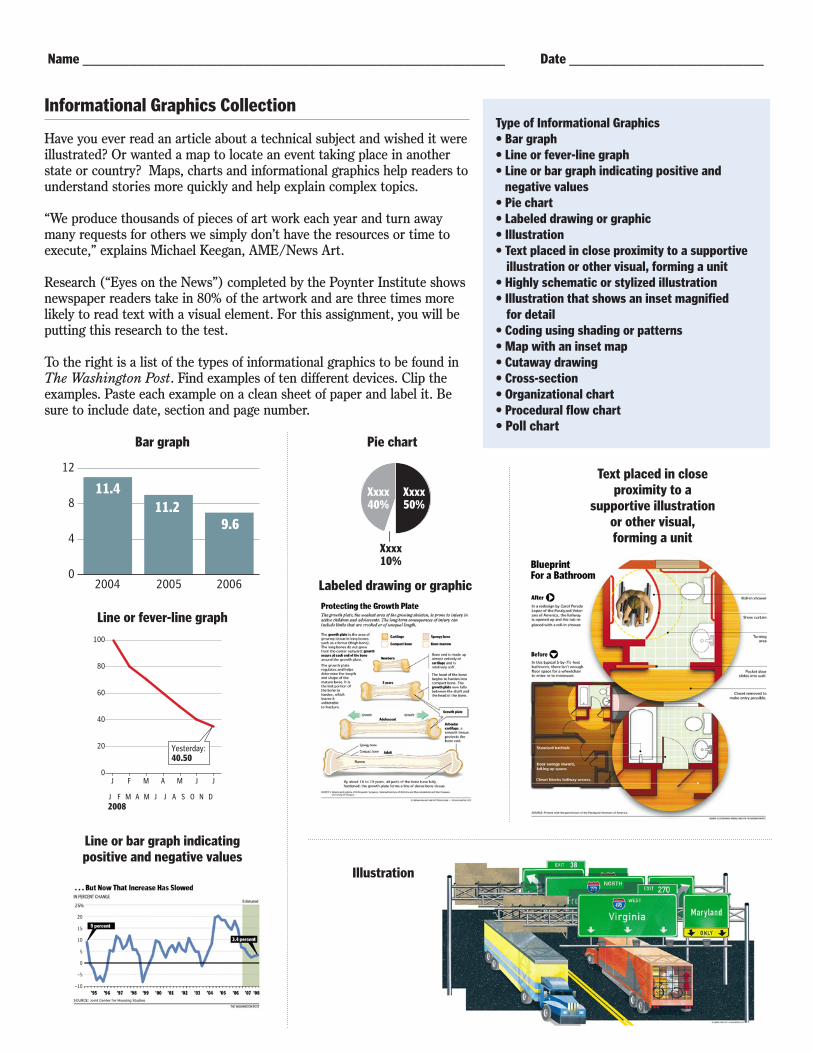
Informational Graphics Collection
Have you ever read an article about a technical subject and wished it were illustrated? Or wanted a map to locate an event taking place in another state or country? Maps, charts and informational graphics help readers to understand stories more quickly and help explain complex topics.
“We produce thousands of pieces of art work each year and turn away many requests for others we simply don’t have the resources or time to execute,” explains Michael Keegan, AME/News Art.
Research (“Eyes on the News”) completed by the Poynter Institute shows newspaper readers take in 80% of the artwork and are three times more likely to read text with a visual element. For this assignment, you will be putting this research to the test.
To the right is a list of the types of informational graphics to be found in The Washington Post. Find examples of ten different devices. Clip the examples. Paste each example on a clean sheet of paper and label it. Be sure to include date, section and page number.
0
20
40
60
80
100
Yesterday:40.50
J J JF M A M
J J JF M A A S O N DM2008
Xxxx50%
Xxxx40%
Xxxx10%
0
4
8
12
SOURCE: Some Organization
THE WASHINGTON POST
2004 2005 2006
9.6
Headline Subhead hereSubhead here
11.411.2
Illustration
Type of Informational Graphics• Bar graph• Line or fever-line graph• Line or bar graph indicating positive and negative values• Pie chart• Labeled drawing or graphic• Illustration• Text placed in close proximity to a supportive
illustration or other visual, forming a unit• Highly schematic or stylized illustration• Illustration that shows an inset magnified for detail• Coding using shading or patterns• Map with an inset map• Cutaway drawing• Cross-section• Organizational chart• Procedural flow chart• Poll chart
Name _______________________________________________________________ Date _____________________________
Map with an inset map
Unit chart: Coding using shading or patterns
Detail
ANNEARUNDELCO.
Ches.Bay
P.G.CO.
MD.VA.
D.C.
MONT.CO.
HOW.CO.
Balt.
CALCO.
Bay Hills
10
MILE
503012
450
179
ST.M
ARGA
RETS RD.
bayhillsMAP PROOFDesk: Real EstateRun Date: 01 / 05 / 08Size: 11p0 x 3.5”Artist: Karklis @ 4-4289
CCI-SLUG filename.XTN(dropped / / 07)
Arnold
BAYHILLSDR.
RITCHIE HWY.
CapeSaint
Claire
Annapolis
MagothyRiver
Ches.Bay
M A R Y L A N D
BY LARIS KARKLIS — THE WASHINGTON POST
SevernRiver
COLLEGEPKW
Y.
SHOR
E
ACRES RD.
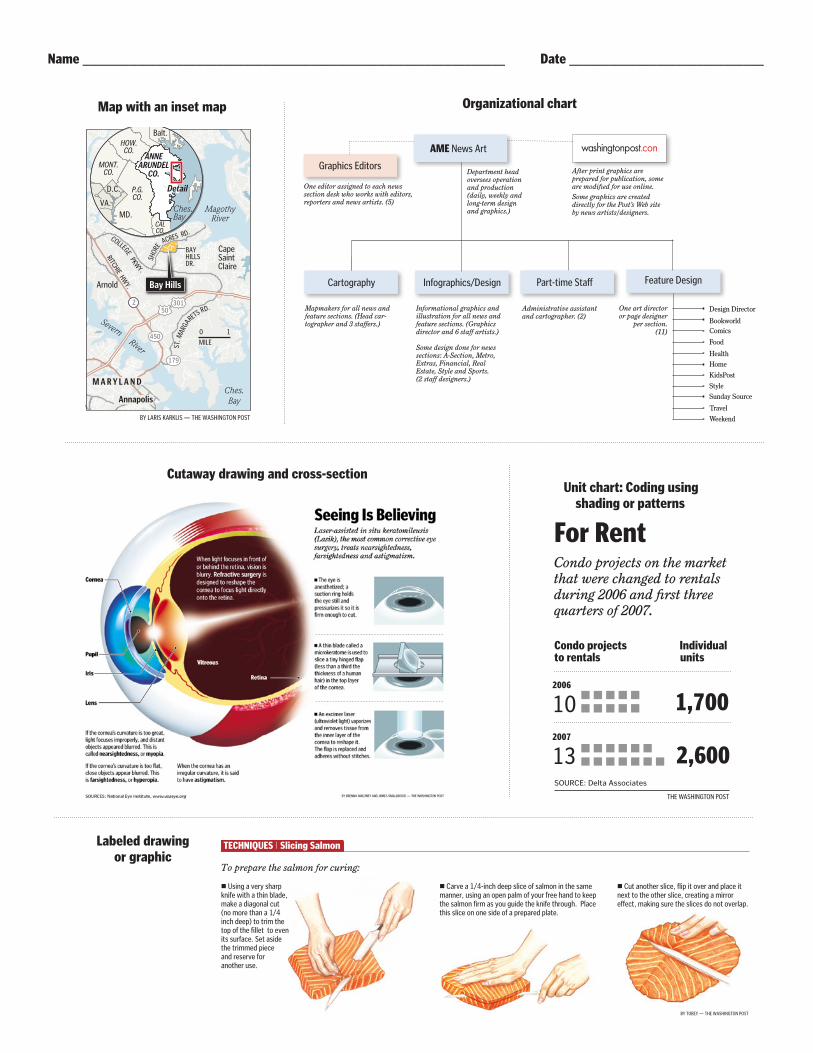
For RentCondo projects on the market that were changed to rentals during 2006 and fi rst three quarters of 2007.
SOURCE: Delta Associates
THE WASHINGTON POST
■ ■ ■ ■ ■■ ■ ■ ■ ■
■ ■ ■ ■ ■ ■ ■ ■ ■ ■ ■ ■ ■
Condo projects Individualto rentals units
1,700
2,600
2006
102007
13
Graphics Editors
One editor assigned to each news section desk who works with editors, reporters and news artists. (5)
Cartography Feature Design
BookworldComics
Food
HealthHome
StyleSunday Source
Travel
KidsPost
Weekend
Mapmakers for all news and feature sections. (Head car-tographer and 3 staffers.)
One art directoror page designer
per section. (11)
AME News Art
Department head oversees operation and production (daily, weekly and long-term design and graphics.)
Informational graphics and illustration for all news and feature sections. (Graphics director and 6 staff artists.)
Some design done for news sections: A-Section, Metro, Extras, Financial, Real Estate, Style and Sports. (2 staff designers.)
Infographics/Design
Design Director
After print graphics areprepared for publication, some are modified for use online. Some graphics are created directly for the Post’s Web site by news artists/designers.
Part-time Staff
Administrative assistant and cartographer. (2)
Organizational chart
Cutaway drawing and cross-section
TECHNIQUES | Slicing Salmon
ª Using a very sharp knife with a thin blade, make a diagonal cut (no more than a 1/4 inch deep) to trim the top of the fillet to even its surface. Set aside the trimmed pieceand reserve foranother use.
ª Carve a 1/4-inch deep slice of salmon in the same manner, using an open palm of your free hand to keep the salmon firm as you guide the knife through. Place this slice on one side of a prepared plate.
ª Cut another slice, flip it over and place it next to the other slice, creating a mirror effect, making sure the slices do not overlap.
BY TOBEY — THE WASHINGTON POST
To prepare the salmon for curing:
Labeled drawing or graphic

Name _______________________________________________________________ Date _____________________________
Visualize the Numbers
Select from the templates the one that is best to present the data you have collected and analyzed. The scale on the vertical axis of the chart should be indicated in equal increments. Be sure to include the source of your information.
-8-6-4-202468
10
165
BAR CHART This chart compares two or more items side by side. Bars are used to represent the data. Place the bars in logical order: alphabetical, chronological or ranked by size. Each item may be labeled either inside the bar or at an end. Always start the lowest value at zero (0) on left scale. More complex charts may include negative numbers. Establish a baseline of zero. The negative numbers fall below the baseline and need a minus sign. Positive numbers are above the baseline and do not need a plus sign.
SOURCE:
PIE CHART This chart represents the parts that make up a whole. The whole totals 100% of something. Segments (or pie slices) divide the circle into accurate proportions, so 25% of the total would be one-quarter of the pie. You can label inside or outside of the pie. Shade or color-code for clearer distinction.
HeadlineExplanation
SOURCE:
...........
(Something)
(Something)
(Something)
(Something)
SOURCE: Justice Department
BY TOBEY — THE WASHINGTON POST
Arresting the Crime RateAfter two years of rising reports of violent crime, the latest statistics show a decrease in the first half of 2007.
Violent crime Specific areas of violent crimeHomicide Forcible rape Robbery
’04 ’05 ’06 ’07 ’04 ’05 ’06 ’07 ’04 ’05 ’06 ’07 ’04 ’05 ’06 ’07
–2%
–5.7
1.4
–5.0–6.1
–1.8
*
* Less than one-tenth of 1 percent.
Percentages represent the change from the first half of the previous year.
HeadlineExplanation
–1.1 –1.2

An Integrated Curriculum For The Washington Post Newspaper In education Program
January 8, 20081�
© 2008 THE WASHINGTON POST COMPANY
VoluMe 7, ISSue 5
VoluMe 7, ISSue 5
An Integrated Curriculum For The Washington Post Newspaper In education Program
January 8, 20081�
© 2008 THE WASHINGTON POST COMPANY

VoluMe 7, ISSue 5
An Integrated Curriculum For The Washington Post Newspaper In education Program
January 8, 20081�
© 2008 THE WASHINGTON POST COMPANY
December 6, 2007
Tom Toles
VoluMe 7, ISSue 5
An Integrated Curriculum For The Washington Post Newspaper In education Program
January 8, 20081�
© 2008 THE WASHINGTON POST COMPANY
January 2, 2008
Tom Toles
VoluMe 7, ISSue 5
An Integrated Curriculum For The Washington Post Newspaper In education Program
January 8, 20081�
© 2008 THE WASHINGTON POST COMPANY
VoluMe 7, ISSue 5
An Integrated Curriculum For The Washington Post Newspaper In education Program
January 8, 20081�
© 2008 THE WASHINGTON POST COMPANY
VoluMe 7, ISSue 5
An Integrated Curriculum For The Washington Post Newspaper In education Program
January 8, 2008�0
© 2008 THE WASHINGTON POST COMPANY
VoluMe 7, ISSue 5
An Integrated Curriculum For The Washington Post Newspaper In education Program

VoluMe 7, ISSue 5
An Integrated Curriculum For The Washington Post Newspaper In education Program
January 8, 2008�1
© 2008 THE WASHINGTON POST COMPANY
Sinus Surgery: It Was All in His HeadSinuses are air-filled cavities in the skull that allow mucus to drain into the nasal passages. But they can get infected. And reinfected. In Seth Hamblin’s case, years of chronic sinus infections led him down the path to image-guided endoscopic sinus surgery and, eventually, to better breathing.
BY BRENNA MALONEY AND LAURA STANTON — THE WASHINGTON POST
Ethmoidsinuses
Deeper in the skull
behind the eyes
Maxillarysinuses
Behind the cheeks
Sphenoid sinuseDeep in the center
of the skull(not shown)
Frontal sinusesPositionedbehind the forehead
Infection in the Sinuses Surgery Gives Relief
The sinuses are lined by mucus-secreting cells that keep the inside of the nose moist and protect it from dust and pollutants.
Tiny hair cells called ciliapropel the mucus toward the back of the nose and throat, where it is swallowed.
Each sinus is connected to the nasal passages by a small opening in bone called an ostium.
If bacteria infects the sinus cavities, the linings’ membranes become inflamed (sinusitis), blocking the ostia and preventing proper drainage.
For some people, like Seth, this can become a chronic condition. Over several years, he had run the gantlet of treatments: decongestants, antihistamines, nasal steroid sprays, antibiotics and extended antibiotics. Nothing gave lasting relief until his doctor recommended surgery.
The aim of the surgery is to remove diseased tissue and open the natural sinus drainage pathways while preserving as much of the normal anatomy as possible.
Before surgery, a computerized model of Seth’s skull and sinuses was created with a series of CT scans. The scans revealed heavy blockages of his ethmoid and maxillary sinuses. (Dark areas indicate unblocked passages.)
Area blocked by sinusitis
Example of cleared area
Maxillary Maxillary
Ethmoid
CiliaMucus
A microdebrider and endoscopewere fed through Seth’s nose and into his sinus cavity. The instruments were equipped with sensors that transmitted infared signals. Software integrated this data with the CT scans, providing his surgeon with a “real time” view of the precise location of the instruments. With this enhanced view, Seth’s surgeon could reach the damaged areas without causing harm to surrounding tissue.
Microdebrider
SOURCE: Washington ENT Group
For this type of surgery, precision is key: If the surgical field is unclear, surgeons can lose their bearings and risk damaging orbital tissues, the optic nerve or the internal carotid artery — all of which can be a millimeter away.
THE TOOLS
MicrodebriderCuts or "shaves" soft tissue with a rotating inner blade.
Built-in suction continuously removes tissue and main-tains a clear surgical field.
Endoscope
Camera
Like a miniature telescope, it provides a close-up view of the immediate surface area and eliminates the need for an external incision.
SINUSPROOF3Desk: HEALTHRun Date: 12 / 11 / 07Size: 47p7 x 57p1 ” Artist: NAME
CCI–SLUG: filename.XTN(dropped //06)
VoluMe 7, ISSue 5
An Integrated Curriculum For The Washington Post Newspaper In education Program
January 8, 2008��
© 2008 THE WASHINGTON POST COMPANY
DISTRICTEDITION
Commuter
DAILY 12-09-07 DC M1 C1 CMYK
By Lena H. SunWashington Post Staff Writer
Metro’s electronic SmarTrip cards are nogeniuses, but the agency hopes to make themMensa ready over the next year. New technol-ogy will allow the cards to compute all faresand special passes that Metro and most of itsregional bus partners offer, and make it fareasier to add money for trips.
As it stands, SmarTrip cards can’t do toomuch: Riders can use them to pay for a singlebus or subway ride and to park at Metro lots,most of which do not accept any other form ofpayment.
The cards cannot factor an array of specialpasses — such as Metrorail’s 7-Day Fast Pass,Montgomery County’s Ride-About and Alex-
andria’s DASH Pass — that many riders useto save money. So riders who park and usespecial passes must carry SmarTrip cards andold-fashioned paper cards. It costs Metroabout $500,000 a year for paper fare cards.
Technology upgrades will enable the elec-tronic cards to calculate special passes, al-lowing riders to ditch their paper cards andsaving the agency money.
To put money on the cards, riders mustnow use machines in subway stations or onbuses. Each trip deducts from their total, likea debit card.
The new technology will enable riders toautomatically add money to SmarTrip cardsthe same way drivers do with the popular E-
Many of the changes to improve SmarTrip’s operations will happen at the fare gate reader and in software that will not alter the physical characteristics of the cards. When system modifications are finished, SmarTrip will automatically update the first time thecard is scanned at the fare gate. Elements of the SmarTrip card:
Transparent Overlays(top and bottom of card): Made of polyvinyl chloride. Protects the printing on the card and gives it a matte or glossy finish.
Printing Layers:Shows SmarTripgraphics on the front; instructions and information on the back.
Contactless Chip Module: The SmarTrip chip is embedded here. The chip communicates with the turnstile reader in the Metro gate. It holds the necessary data that allow riders to make a transaction atthe gate.
Metro Gate Reader: Notshown. Powers the chip by creating a radio frequency field to read the card.
TransparentOverlay
PrintingLayer
Printed Antenna Layers: Antenna printed of conductive ink allows the chip to communicate with theMetro gate reader, which has another antenna in it. Each layer forms two printed antenna loops. When the card is laminated and these layers stack, they create a complete antenna for communication to the reader.
Making a Smarter Card
SOURCES: WMATA, Giesecke & Devrient BY APRIL UMMINGER AND LAURA STANTON — THE WASHINGTON POST
Rocket (and Subway) ScienceMetro Hopes Upgrade Will Make for a Smarter SmarTrip Card
As part of the technology upgrades, Metro and its contractor are reformatting the chip inside the card and replacing outdated fare collection equipment. Once those technology changes are completed by the end of next year, the card willbe able to:
ª Compute all fares and special passesoffered by Metro and most of its regional bus partners.
ª Allow riders to automatically add money, like E-ZPass, by linking SmarTrip to a credit card and loading money when the balance dips below a designated level.
About the Changes
See SMARTRIP, C6, Col. 5
O nce, we made special tripsdowntown this time of year,lining up to gape at mechanical
bears eating porridge, Victorian catscelebrating in the snow and toy soldiersguarding over our happy holidays.
Now, those same jumbo-size windowsin re-purposed downtown departmentstore buildings offer views of advertisingsigns, old photos and waiters grinding$12 guacamole.
This is progress?The grand old animated Christmas
window displays of the sort that oncehad Woodies, Hecht’s, Garfinckel’s andLansburgh’s competing to demonstratetheir creative extravagance are now
relegated to nostalgic memories, scenesin old movies and on New York’s FifthAvenue (and even there, the competingstores’ windows are all produced by onecompany).
The reasons for the demise of theChristmas window are well-known: Thedecline of the downtown departmentstore, the rise of windowless big-boxretailing, the replacement offamily-owned local shops by big nationalchains and the triumph of convenienceover showmanship.
“It was an amenity of thewalking-around town,” says William“Larry” Bird, a Smithsonian curatorwhose new book, “Holidays on Display,”
MARC FISHER
As Holiday Windows Have Vanished,A Bit of Winter Enchantment Has, Too
1950 PHOTO OF WOODWARD & LOTHROP WINDOWS — THE WASHINGTON POST
See FISHER, C6, Col. 1
tells the story of the art and business ofthe window shows. “Department storeslived and died by their windows. Theyspared no expense. This was the secularcreche.”
Oddly enough, in this era in whichtechnology has made it possible topersonalize retailing as never before,consumers expect less in the way ofservice and splendor. Businesses thatonce rose or fell on their ability to lavishcustomers with service — airlines,supermarkets, department stores — nowcompete to cut costs to the bone. Anynotion of romance in shopping has
Obituaries
Albert Viton, 94United Nations official wasalso a prolific writer onMiddle East issues. C7
Robert Carroll Vandivier, 82The former minister becamean advocate for the mentallyill and, later, for peace. C8
Index
LOTTERIES................................C4OBITUARIES .........................C7-8DEATH NOTICES................C8-10
Today’s Forecast
WEATHER...............................C12
36°9 a.m.
37°Noon
44°5 p.m.
47°9 p.m.
By Lena H. SunWashington Post Staff Writer
Days before the Metro board is scheduled to make a fi-nal decision on the largest proposed increases in subwayfares and parking fees, members from Maryland have of-fered an alternative that would soften the impact on sub-urban and long-distance rush-hour riders.
The Maryland proposal, which is being circulatedamong board members, seeks smaller increases in long-distance trips and parking hikes. Its backers say the planwould raise almost the same amount of money because itassumes that fewer riders will abandon the system be-cause of higher fares.
A decision on fares is expected Thursday, but if boardmembers don’t reach a consensus, it could be delayed.Metro officials have warned that delays will mean evenhigher increases later.
At public hearings last month, 150 people testified and272 more submitted written comments to the board.More than two-thirds were riders from Maryland andVirginia. Nearly half said the proposed increases weretoo high; nearly half also said unreliable bus and rail
service, poor communication about delays and malfunc-tioning escalators and elevators were among the reasonsfare increases were not justified, according to a Metro re-port.
Nearly one-fourth of all riders called the proposals un-fair to those who park and long-distance commuterstraveling during rush hours. Even the handful who sup-ported increasing fares said bus and off-peak subway rid-ers should share more of the costs.
About 13 percent of customers said the increaseswould hurt low- and middle-income riders like them-selves who could not afford to live in the District andhave moved to outlying suburbs.
“This takes into account our need to raise the neces-sary revenue while reflecting the comments in the publichearings,” said Maryland board member Peter Benja-min, referring to the latest plan. It has the support of theother voting Maryland member, board Chairman Eliza-beth Hewlett, and state Transportation Secretary JohnD. Porcari, he said.
Virginia members had mixed reactions. Chris Zim-
Md. Plan Would Lower Increases in Long-Distance Trips, Parking
See METRO, C6, Col. 1
Alternative Metro Fare Hikes ProposedBy Theresa Vargasand Michael LarisWashington Post Staff Writers
The Virginia Tech community hasreacted by the thousands over thepast few days to photographs postedon the Internet that show a couple ofPennsylvania State University stu-dents dressed up in Halloween cos-tumes mocking the April massacre.
Comments about the photos,which show students wearing blood-ied, bullet-riddled Virginia Techclothing, intensified on Facebook asmore people learned about them.What began as a volatile reaction,however, seemed to turn into a les-son of “rising above” the incident byyesterday.
“We rose above the very personwho killed our friends and family.We showed our incredible powerthen to will over negativity, and cando it again,” read the message fromVirginia Tech PhD student Ken Stan-ton yesterday at the top of a Face-book site called “People against thiscostume.” “While this incident in-volved students at Penn State, we
CostumesOf Cho VictimsRile Va. TechCommunity
See PHOTOS, C5, Col. 1
They’re just little thingsthat if fixed couldimprove our commute. Ina new feature, we’ll takeyour ideas to those incharge. C2
C1CMYK
C1CMYK
ABCDE][
METROSunday, December 9, 2007 DC M1
C
Also Today
THE DISTRICT
A Twist on DevelopmentIn Columbia HeightsWhen the city condemnedtheir building, a groupof women fought back. A1
Christmas Gone WildRevelers wearing holidaycostumes put a rowdy spinon the season. C4
Anacostia Cafe in JeopardyCustomers rally to try to savea neighborhood fixture. C3
Shifts in Library SystemSeveral employees let go;others retire in overhaul. C12
MARYLANDA Plea in Mortgage CrisisThe Rev. Jesse Jackson visitshard-hit Prince George’s to call for a remedy. A14
Firms Protest Sales TaxComputer services compa-nies want a levy passed in thespecial session repealed. C11
Sexual Assaults ExaminedAnnapolis and other militaryacademies focus of study. C3
VIRGINIAThree Seek U.S. House SeatA special election on Tuesdaywill determine who willreplace Jo Ann Davis (R),who died recently. C5
By Nikita StewartWashington Post Staff Writer
The District could become thefirst jurisdiction in the country to li-cense pharmaceutical sales repre-sentatives, a move a council membersays would help protect doctors andpatients from disreputable agentswho drive up the costs of prescrip-tion drugs.
The drug industry says the moveis unnecessary because it overlapswith federal laws.
The D.C. Council is set to voteTuesday on member David A. Cata-nia’s SafeRx Act, which would alsoban pharmaceutical manufacturersfrom using doctors’ prescriptiondata for marketing purposes with-out the doctors’ knowledge.
At issue, Catania (I-At Large) andhis allies say, is an industry whoserepresentatives can mislead doctorsand patients into buying the mostexpensive drugs on the market,shunning reasonably priced gener-ics or drugs that could be just as ef-fective. Because the agents’ salariesare dependent on sales, they some-times give the wrong impressionsabout drugs and present themselvesas medical professionals, Cataniasaid.
Other professions are licensed,Catania said — why not pharmaceu-
LicensingSought In DrugIndustryBill TargetsSales Agents
See LICENSING, C4, Col. 2
VoluMe 7, ISSue 5
An Integrated Curriculum For The Washington Post Newspaper In education Program
January 8, 2008��
© 2008 THE WASHINGTON POST COMPANY
Originally published November 16, 2007
0
10
0
0
10
0
THE WASHINGTON POST
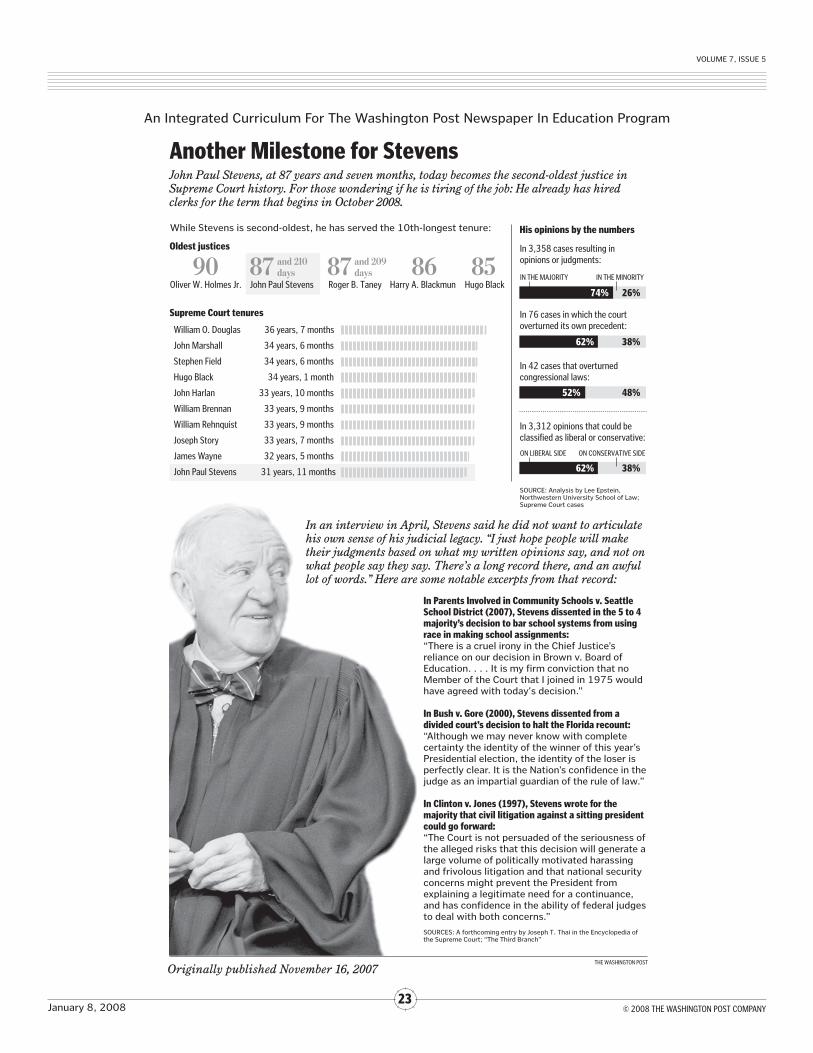
Another Milestone for StevensJohn Paul Stevens, at 87 years and seven months, today becomes the second-oldest justice in Supreme Court history. For those wondering if he is tiring of the job: He already has hired clerks for the term that begins in October 2008.
In an interview in April, Stevens said he did not want to articulate his own sense of his judicial legacy. “I just hope people will make their judgments based on what my written opinions say, and not on what people say they say. There’s a long record there, and an awful lot of words.” Here are some notable excerpts from that record:
In Parents Involved in Community Schools v. Seattle School District (2007), Stevens dissented in the 5 to 4 majority’s decision to bar school systems from using race in making school assignments:“There is a cruel irony in the Chief Justice’s reliance on our decision in Brown v. Board of Education. . . . It is my firm conviction that no Member of the Court that I joined in 1975 would have agreed with today's decision.”
In Bush v. Gore (2000), Stevens dissented from a divided court’s decision to halt the Florida recount:“Although we may never know with complete certainty the identity of the winner of this year’s Presidential election, the identity of the loser is perfectly clear. It is the Nation’s confidence in the judge as an impartial guardian of the rule of law.”
In Clinton v. Jones (1997), Stevens wrote for the majority that civil litigation against a sitting president could go forward:“The Court is not persuaded of the seriousness of the alleged risks that this decision will generate a large volume of politically motivated harassing and frivolous litigation and that national security concerns might prevent the President from explaining a legitimate need for a continuance, and has confidence in the ability of federal judges to deal with both concerns.”
William O. Douglas 36 years, 7 months
John Marshall 34 years, 6 months
Stephen Field 34 years, 6 months
Hugo Black 34 years, 1 month
John Harlan 33 years, 10 months
William Brennan 33 years, 9 months
William Rehnquist 33 years, 9 months
Joseph Story 33 years, 7 months
James Wayne 32 years, 5 months
John Paul Stevens 31 years, 11 months
SOURCES: A forthcoming entry by Joseph T. Thai in the Encyclopedia of the Supreme Court; “The Third Branch”
His opinions by the numbers
Oldest justices
Supreme Court tenures
In 3,358 cases resulting in opinions or judgments:
26%74%
IN THE MAJORITY IN THE MINORITY
ON LIBERAL SIDE ON CONSERVATIVE SIDE
0
10
0
In 3,312 opinions that could be classified as liberal or conservative:
38%62%
0
10
0
In 76 cases in which the court overturned its own precedent:
48%52%
In 42 cases that overturned congressional laws:
38%62%
While Stevens is second-oldest, he has served the 10th-longest tenure:
90Oliver W. Holmes Jr.
87John Paul Stevens
87Roger B. Taney
86Harry A. Blackmun
85Hugo Black
and 209 days
and 210 days
SOURCE: Analysis by Lee Epstein, Northwestern University School of Law; Supreme Court cases
VoluMe 7, ISSue 5
An Integrated Curriculum For The Washington Post Newspaper In education Program
January 8, 2008��
© 2008 THE WASHINGTON POST COMPANY
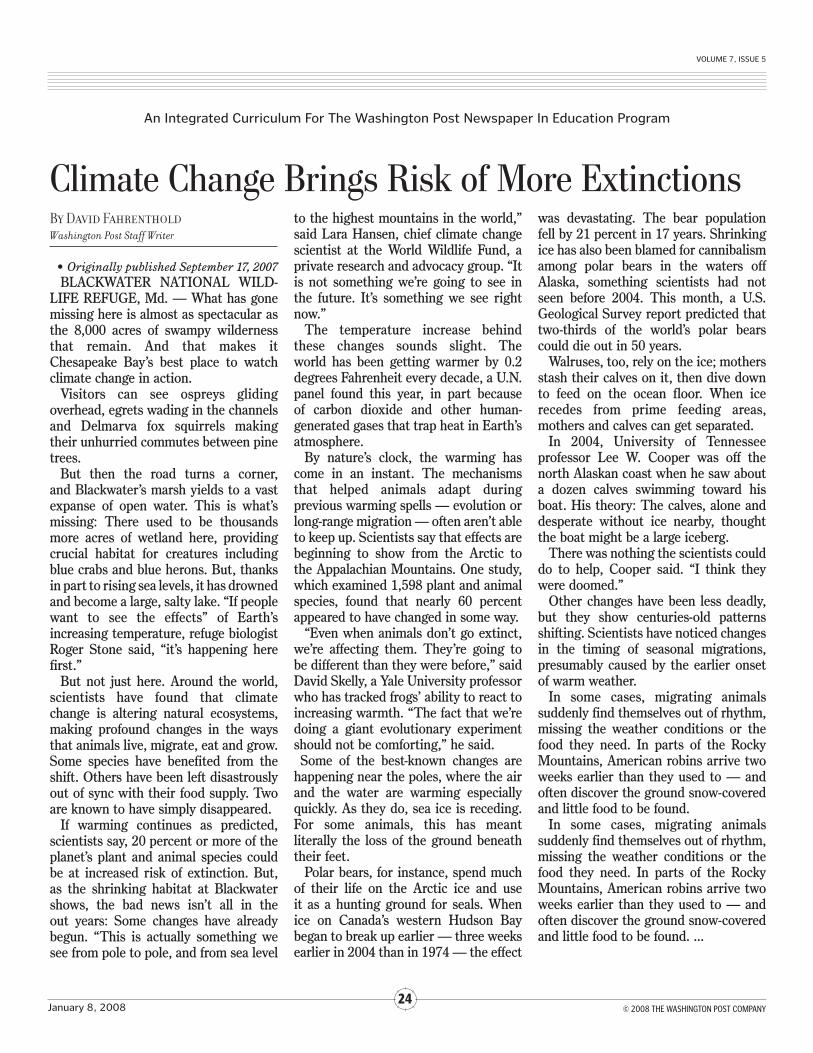
By David FahrentholdWashington Post Staff Writer
• Originally published September 17, 2007 BLACKWATER NATIONAL WILD-
LIFE REFUGE, Md. — What has gone missing here is almost as spectacular as the 8,000 acres of swampy wilderness that remain. And that makes it Chesapeake Bay’s best place to watch climate change in action.
Visitors can see ospreys gliding overhead, egrets wading in the channels and Delmarva fox squirrels making their unhurried commutes between pine trees.
But then the road turns a corner, and Blackwater’s marsh yields to a vast expanse of open water. This is what’s missing: There used to be thousands more acres of wetland here, providing crucial habitat for creatures including blue crabs and blue herons. But, thanks in part to rising sea levels, it has drowned and become a large, salty lake. “If people want to see the effects” of Earth’s increasing temperature, refuge biologist Roger Stone said, “it’s happening here first.”
But not just here. Around the world, scientists have found that climate change is altering natural ecosystems, making profound changes in the ways that animals live, migrate, eat and grow. Some species have benefited from the shift. Others have been left disastrously out of sync with their food supply. Two are known to have simply disappeared.
If warming continues as predicted, scientists say, 20 percent or more of the planet’s plant and animal species could be at increased risk of extinction. But, as the shrinking habitat at Blackwater shows, the bad news isn’t all in the out years: Some changes have already begun. “This is actually something we see from pole to pole, and from sea level
to the highest mountains in the world,” said Lara Hansen, chief climate change scientist at the World Wildlife Fund, a private research and advocacy group. “It is not something we’re going to see in the future. It’s something we see right now.”
The temperature increase behind these changes sounds slight. The world has been getting warmer by 0.2 degrees Fahrenheit every decade, a U.N. panel found this year, in part because of carbon dioxide and other human-generated gases that trap heat in Earth’s atmosphere.
By nature’s clock, the warming has come in an instant. The mechanisms that helped animals adapt during previous warming spells — evolution or long-range migration — often aren’t able to keep up. Scientists say that effects are beginning to show from the Arctic to the Appalachian Mountains. One study, which examined 1,598 plant and animal species, found that nearly 60 percent appeared to have changed in some way.
“Even when animals don’t go extinct, we’re affecting them. They’re going to be different than they were before,” said David Skelly, a Yale University professor who has tracked frogs’ ability to react to increasing warmth. “The fact that we’re doing a giant evolutionary experiment should not be comforting,” he said. Some of the best-known changes are happening near the poles, where the air and the water are warming especially quickly. As they do, sea ice is receding. For some animals, this has meant literally the loss of the ground beneath their feet.
Polar bears, for instance, spend much of their life on the Arctic ice and use it as a hunting ground for seals. When ice on Canada’s western Hudson Bay began to break up earlier — three weeks earlier in 2004 than in 1974 — the effect
was devastating. The bear population fell by 21 percent in 17 years. Shrinking ice has also been blamed for cannibalism among polar bears in the waters off Alaska, something scientists had not seen before 2004. This month, a U.S. Geological Survey report predicted that two-thirds of the world’s polar bears could die out in 50 years.
Walruses, too, rely on the ice; mothers stash their calves on it, then dive down to feed on the ocean floor. When ice recedes from prime feeding areas, mothers and calves can get separated.
In 2004, University of Tennessee professor Lee W. Cooper was off the north Alaskan coast when he saw about a dozen calves swimming toward his boat. His theory: The calves, alone and desperate without ice nearby, thought the boat might be a large iceberg.
There was nothing the scientists could do to help, Cooper said. “I think they were doomed.”
Other changes have been less deadly, but they show centuries-old patterns shifting. Scientists have noticed changes in the timing of seasonal migrations, presumably caused by the earlier onset of warm weather.
In some cases, migrating animals suddenly find themselves out of rhythm, missing the weather conditions or the food they need. In parts of the Rocky Mountains, American robins arrive two weeks earlier than they used to — and often discover the ground snow-covered and little food to be found.
In some cases, migrating animals suddenly find themselves out of rhythm, missing the weather conditions or the food they need. In parts of the Rocky Mountains, American robins arrive two weeks earlier than they used to — and often discover the ground snow-covered and little food to be found. ...
Climate Change Brings Risk of More Extinctions
VoluMe 7, ISSue 5
An Integrated Curriculum For The Washington Post Newspaper In education Program
January 8, 2008��
© 2008 THE WASHINGTON POST COMPANY
CoNTINued FroM PAGe 2�
VoluMe 7, ISSue 5
An Integrated Curriculum For The Washington Post Newspaper In education Program
January 8, 2008��
© 2008 THE WASHINGTON POST COMPANY
By David BrownWashington Post Staff Writer
• Originally published December 17, 2007Depending on where you are, this
is going to be a hotter, wetter, drier, windier, calmer, dirtier, buggier or hungrier century than mankind has seen in a while. In some places, it may be deadlier, too.
The effects of climate change are diverse and sometimes contradictory. In general, they favor instability and extreme events. On balance, they will tend to harm health rather than promote it.
That is the majority view of scientists trying to solve an equation whose variables range from greenhouse gas concentrations and the El Niño weather pattern to mosquito ecology and human cells’ ability to withstand heat.
“We are not dealing with a single toxic agent or a single microbe where we can put our finger with certainty on an exposure and the response,” said Jonathan A. Patz, a physician and epidemiologist at the University of Wisconsin at Madison. “Climate change affects everything.”
Predictions of how global warming could affect people’s health are crude. They are based on the experience of the past several decades, when there has been a small, well-documented rise in the temperatures of the planet’s atmosphere and oceans. What that says about the future — a time when warming is expected to accelerate, but people may be able to prepare for it — is quite uncertain.
In the last quarter of the 20th century, the average atmospheric temperature rose by about 1 degree Fahrenheit. By 2000, that increase was responsible for the annual loss of about 160,000 lives
and the loss of 5.5 million years of healthy life, according to estimates by
the World Health Organization. The toll is expected to double to about 300,000 lives and 11 million years of healthy life by 2020.
The biggest tolls were in Africa, on the Indian subcontinent and in Southeast Asia. Most of that increased burden of death and disease was from malnutrition,
diarrhea, malaria, heat waves and floods. But those diseases will play a minor role, at best, in many regions that nevertheless will feel the effects of global warming.
To organize their thinking — and to focus the attention of policymakers — researchers tend to put the health effects of climate change into five groups. ...
As Temperatures Rise, Health Could Decline
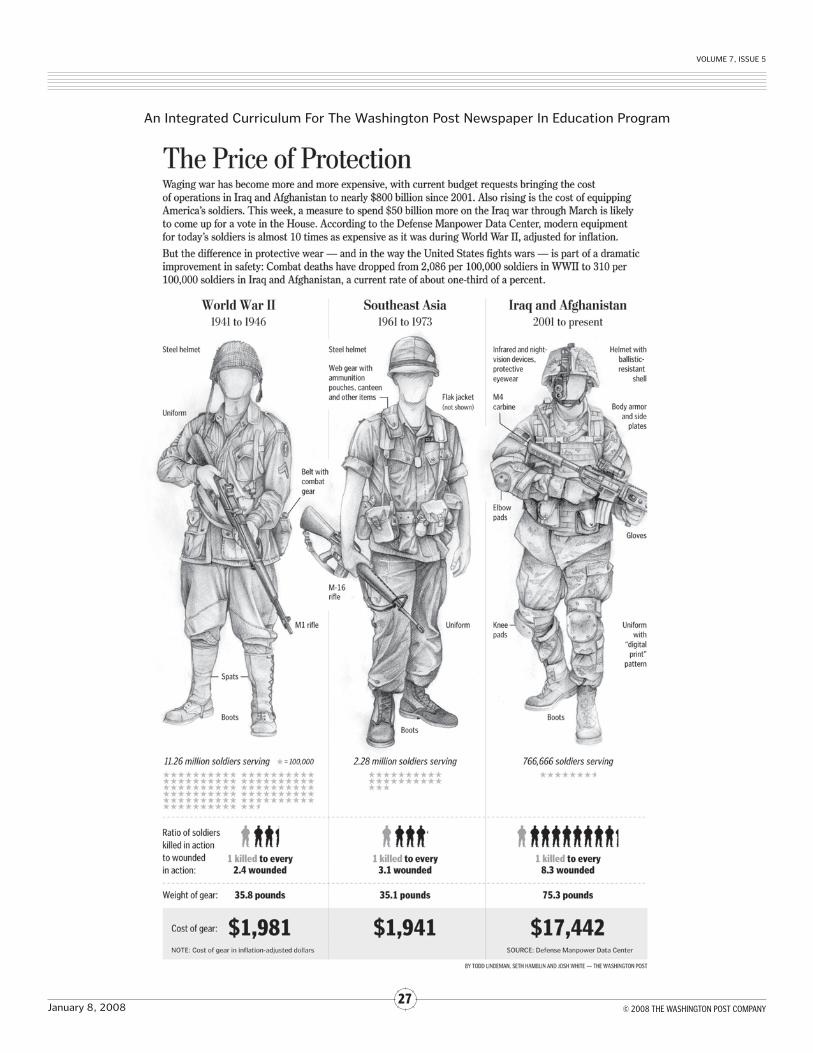
VoluMe 7, ISSue 5
An Integrated Curriculum For The Washington Post Newspaper In education Program
January 8, 2008��
© 2008 THE WASHINGTON POST COMPANY
VoluMe 7, ISSue 5
An Integrated Curriculum For The Washington Post Newspaper In education Program
January 8, 2008��
© 2008 THE WASHINGTON POST COMPANY
Maryland
Academic Content Standards
Virginia Washington, D.C.
The Maryland Voluntary State Curriculum Content Standards can be found online at http://mdk12.org/assessments/vsc/index.html.
Standards of Learning currently in effect for Virginia Public Schools can be found online at www.pen.k12.va.us/VDOE/Superintendent/Sols/home.shtml.
Mathematics: Analyze Data
a) Interpret tablesb) Interpret box-and-whisker plotsc) Interpret scatter plotsd) Interpret circle graphs(Standard 4.0, Knowledge of Statistics, Grade 8)
Visual Arts: Students will demonstrate the ability to organize knowledge and ideas for expression in the production of art 2) Demonstrate ways the elements of art and principles of design are manipulated to communicate ideas (Grade 6, Standard 3.0 Creative Expression and Production)
Reading: Analyze graphic and informa-tional aids that contribute to meaning (Grade 7, Standard 2.0: Comprehen-sion of Informational Text, Indicator 2, Objectives b and c)
Mathematics: The student, given a problem situation, will collect, organize, and display a set of numerical data in a variety of forms, using bar graphs, stem-and-leaf plots, and line graphs, to draw conclusions and make predictions. (Probability and Statistics, Grade 5, 5.18)
Visual Arts: The student will create works of art by representing and interpreting ideas from other fields of knowledge (Visual Communication and Production, Grade 7, 7.11)
Visual Arts: The student will analyze the effect the elements of art and the principles of design have on the communication of ideas. (Judgment and Criticism, Grade 8, 8.16)
Mathematics: Organize and describe distributions of data by using a number of different methods, including frequency tables, histograms, standard line and bar graphs, stem-and-leaf displays, scatter plots, and box-and-whisker plots. (Probability and Statistics, PS.8)
Reading/English Language Arts: Synthesize information from multiple sources (e.g., maps, illustrations, schematic diagrams, manuals, product information, consumer publications) to draw conclusions about the ideas presented. (Document and Procedural Text, 10.IT-DP.6)
Social Studies, Geography: Students use map and globe skills to determine the absolute locations of places and interpret information available through a map or globe’s legend, scale, and symbolic representations. (2.1)
Visual Arts: Each student will be able to make connections between visual arts, the other content areas, careers and the artist’s role in society (Standard 6, Making Connections)
Learning Standards for DCPS are found online at www.k12.dc.us/dcps/Standards/standardsHome.htm.