volume 4, issue 3, march 2015 issn 2319 - 4847 ... · volume 4, issue 3, march 2015 issn 2319 -...
TRANSCRIPT
International Journal of Application or Innovation in Engineering & Management (IJAIEM) Web Site: www.ijaiem.org Email: [email protected]
Volume 4, Issue 3, March 2015 ISSN 2319 - 4847
Volume 4, Issue 3, March 2015 Page 230
ABSTRACT
This paper documents the management practices, trends and recommend the best way forward to manage groundwater in the county. It mapped licensed boreholes and developed spatial discrimination maps; assessed trends in practices such as borehole locations, drilling depths and interviewed WRMA staff on compliance and challenges faced. 2,632 boreholes were mapped and hotspots analysis were performed to elucidate statistically significant borehole density and water abstraction hotspots. Proximity analyses also showed a 6% increase in the number of boreholes that lie within 100 m from each other from 2011 to 2013 whereas analyses on drilling depths indicated that an average increase of 170 m from 1930 to 2013 and this was attributed to pollution of the upper aquifer and potentially competition for groundwater. This study also elucidated that the low level of compliance is mainly driven by the county’s population increase which drives other exigent contributing factors that include: increased water demand; intermittent piped supply; unclear legal framework; poor enforcement of supportive regulations; lack of a publicly available groundwater database for decision making; low capacity of the regulator; apparent groundwater availability that allows errand drillers to forego due processes, and low level of awareness of residents and boreholeowners. Keywords: Groundwater, Historical Data, GIS, Spatial Analysis, Management Practice
1.INTRODUCTION Groundwater plays an important role in supplementing the surface water supply in Nairobi County. Nairobi County faces frequent challenges in sustaining a consistent water supply to its residence due to illegal connections and outdated infrastructure[1],[3], [5] and [7]. The county lies in the Nairobi Aquifer Suite which is a multi-layered system of aquifers caused by successive volcanic flows extending from Kiambu to Kajiado County[4]. However groundwater itself in Nairobi faces challenges which include low water quality, saline intrusion, over exploitation and limited knowledge of its availability and this reduces its utility as observed by, [5]. Several studies have been undertaken primarily to enumerate the number of boreholes in the county with a focus on elucidating the situation on borehole location in regards to compliance. This is because whilst current regulations donot give a specific distance that should be maintained between boreholes, the Water Resources Management Authority (WRMA) uses a guiding distance of 100 m. Studies such as [6], enumerated 2,132 boreholes within the county which was an increase from 1,150 in the mid-2000s observed by [7] whereas both [6] and [7] pointed out that there may be significantly more boreholes within the county due to illegal drilling and non-participation of borehole owners in the enumeration studies. It has been generally observed in [1] and[5] that groundwater is extensively and intensively exploited in Nairobi County and there is thus a need to develop better management regimes to ensure its sustainability. There have several studies to enumerate and identify areas of concern in terms of borehole (BH) locations and groundwater abstraction such as [7] which identified Parklands, Westlands, Eastleigh and the Central Business District as areas of concern. However there hasn’t been any studies that have presented spatiotemporal and historical statistics of borehole locations in the county. This study undertook a spatiotemporal analysis of borehole locations in the decades between 1930 and 2013 within the different Sublocations that existed in the county in the year 2006. This enabled this study to give a better understanding of the present day trends by fortifying them with a historical statistical background.
2.METHODOLOGY
2.1Study Area The study area was the County of Nairobi in the Republic of Kenya, which was formerly Nairobi Province. Nairobi County lies between longitude 37.106805° and 36.650011°; latitude -1.164925° and -1.456459°, and occupies an area of about 696 km2 and is shown in Plate 2 1. Nairobi’s altitude varies between 1,600 and 1,850 m asl with its western part falling on high ground (approximately 1700–1800 m asl) and with rugged topography, whereas its eastern side is generally low-lying (approximately 1600 m asl) and flat.
Spatiotemporal Analysis of Borehole Locations in Nairobi County 1930-2013
Nato Linus Simiyu1, Simeon Otieno Dulo2
1Corresponding Author, Department of Civil and Construction Engineering,University of Nairobi
2Senior Lecturer, Department of Civil and Construction Engineering,University of Nairobi

International Journal of Application or Innovation in Engineering & Management (IJAIEM) Web Site: www.ijaiem.org Email: [email protected]
Volume 4, Issue 3, March 2015 ISSN 2319 - 4847
Volume 4, Issue 3, March 2015 Page 231
Hydraulically the county falls in the greater Athi River Catchment, with its main drainage following the regional slope of the volcanic rocks towards the east, while subsidiary internal drainage into the Rift region is confined to the western part. The lava plains east of the line Ruiru-Nairobi-Ngong are underlain by a succession of lava flows alternating with lakebeds, streams deposits, tuffs and volcanic ash. These plains, comprising mainly the Athi plains and the northern section of the Kapiti plain, extend westwards, rising from 4900 feet (1493 m) at the Athi River to 6000 feet (1829 m) in the faulted region near Ngong, [1] and [8].
Source: ESRI, DigitalGlobe, GeoEye, EarthStar Geographics, CNES/Airbus DS, USDA, USGS, AEX, Getmapping, Aerogrid, IGN, IGP, swisstopo and the GIS User Community, 2013.
Plate 2 1: Nairobi County
Administratively the county is divided into 8 divisions namely: Westlands, Kasarani, Dagoretti, Kibera, Makadara, Nairobi Central (Central Business District), Pumwani and Embakasi. In these divisions sub-divisions are generally named after neighbourhoods and they are over 50 sub-divisions in Nairobi, [1]. 2.2Datasets This study obtained four key datasets which were used to perform the analysis and they included:
1. A database extract of the BHs in WRMA’s BH database which had 3,762BH records for the entire Nairobi Aquifer Suite (NAS) from 1930 to 2011.
2. A listing of BH coordinates from WRMA’s current BH registration system which has 3,016BHs records in the entire NAS from 2007 to 2013.
3. A KML file of BHs, used by WRMA to assess the proximity of BHs when as part of the permit application, which 2,925 BHs from 2007 to 2013.
4. A GIS Shapefile of Kenya’s Sublocations in 2006 obtained from GADM (www.gadm.org) and contained 62 Sublocations.
Each of these datasets included temporal data which curtailed the date of either when the BHdrilling was completed or when an abstraction permit was applied or issued.These were taken to be date or temporal data of the BH. This temporal data was available for 3,600 entries (95.72%) of the database extract included temporal data for when the drilling works were completed for 3,600 entries (95.72%). In the listing of BH coordinates and the KML file the temporal data was available for all entries. On the spatial aspect the database extract had a range locational information which included the following and available as by the percentages given: UTM Coordinates (11.65%), DMS Coordinates (24.14%), DD Coordinates (8.61%), Locality (83.01%) and Area Information (47.78%). On the other hand the BH Listing and KML file had coordinates available for all entries. 2.3.Data Preparation
2.3.1Data Sorting and Assessment The data was prepared for analysis in MS Excel firstly by sorting and assessing them particularly the BH Database Extract and the List of BH Coordinates and secondly assessing the adequacy and coverage the two datasets in terms of location and dates. These datasets were merged in a spreadsheet and duplicates identified in a three-fold assessment in which the first identification of duplicate entries was based on a scrutiny of WRMA permit numbers, coordinates, dates and names of BH owners. The second identification was based on names of BH owners and coordinates, and the third identification was based on the coordinates alone. The identified duplicate entries were removed from the table and on each identification the entries were sorted and MS Excel’s method of formatting duplicate entries differently was used to identify them. The KMZ file of BHs was converted to a Shapefile, using Global Mapper’s Export method, which was

International Journal of Application or Innovation in Engineering & Management (IJAIEM) Web Site: www.ijaiem.org Email: [email protected]
Volume 4, Issue 3, March 2015 ISSN 2319 - 4847
Volume 4, Issue 3, March 2015 Page 232
then accessed in ArcGIS and its entries were exported to a database file (.DBF file). The database file was then accessed in MS Excel and used to identify BH which may have been present in the KMZ file but not in the other two datasets using the three-fold assessment of duplicates. 2.3.2.BH Mapping In preparation for mapping the coordinates in the resultant table were then analysed for their consistency and accuracy those with discrepancies were removed. A table of BHs with utilizable coordinates resulted and it was prepared to create a feature class in ArcGIS by splitting it into two separate tables curtailing the BHs which were to be mapped using UTM and Decimal Degrees (DD) coordinates. In the case of the entries from the database extract the best coordinates were used to categorize into either of these two tables where the entries had both UTM and Decimal Degree coordinates. Also these two tables’ headers (attribute categories) were formatted in a syntax that was parsable by ArcGIS’s Create Feature Class from XY Table Tool. A shapefile was created in the geodatabase for each of the two tables using the Create Feature Class from XT Table tool in ArcGIS. The UTM shapefile/feature class had a UTM Arc 1960 Zone 37S projection whereas the DD Shapefile/feature class had the WGS 1984 geographic coordinate system. The latter shapefile was projected to the UTM Arc 1960 Zone 37S PCS and both were added to a BH Feature Dataset in the geodatabase. They were then merged to result in a feature class of all mapped BHs Figure) which was then clipped using the Nairobi County feature class/shapefile to produce a feature class containing only the BHs located within the boundaries of the County.
Figure 2-1: Combined Mapped BHs
A spatial join was then performed to add attributes of administrative units (District, Division, Location and Sublocation) to each BH depending on its location. These Nairobi County BHs were then exported to MS Excel and combined with the unmapped BHs from the Database Extract. The resultant table was used to count the BHs in each administrative unit using the BH’s location from the spatial join and the original administrative location of the unmapped BHs using their location and locality attributes. In this process unmapped BHs which had no information on these two attributes were ignored and whilst the information was added to the last administrative unit identifiable. This resulted in a categorization of administrative or location information based on all the available data. 2.3.3Temporal Data Interpolation The temporal data for the resultant BHs was taken from the available entries of the attributes of: work completed date and application date. These were firstly assessed to identify those were consistent and usable, whereas those that weren’t were discarded. A table of the resultant BHs (which had location information and temporal information) was then created and used to sum the number of BHs drilled in each decade from the oldest BH in 1930 to the most recent in 2013, in each of the sub locations of the shapefile. This table was then joined to the shapefile using the Sublocations’ unique identifier as the link and spatiotemporal maps were then created for each decade. 2.4.Data Analysis A general analysis was of measuring the distribution of BHs amongst all the decades was performed in addition to elucidating the trend on the number BHs drilled each year within the temporal boundaries of this study. A two fold assessment was undertaken to give the spatiotemporal trend and situation of BH development, in each decade in

International Journal of Application or Innovation in Engineering & Management (IJAIEM) Web Site: www.ijaiem.org Email: [email protected]
Volume 4, Issue 3, March 2015 ISSN 2319 - 4847
Volume 4, Issue 3, March 2015 Page 233
amongst the Sublocations. The first assessment regarded the distribution of BHs in the particular decade whereas the second assessment considered the total distribution at the end of the decade.
3.RESULTS
3.1BOREHOLE DEVELOPMENT From the mapping and integration of temporal data into the BHs at total of 2,554 BHs were established to have been drilled between 1930 and 2013 and this was 97.04% of the total BHs identified to be in Nairobi. Of this value 32 BHs were only located to be in Nairobi but their Sublocation was not identifiable from the available information. The number of BHs drilled per year was plotted against their respective years and it was observed that the number of BHs increased with time. Additionally it was also observed that there were several peaks in the number of BHs drilled per year between 1942 and 1954, 1972 and 1984, 1992 and 1999 and the most significant between 2002 and 2013 (Figure). It was calculated that approx. 64% of all BHs were drilled between 2009 and 2013. The cumulative BHs was also plotted against time and a powertrend line of y=0.7039x1.6295 was deduced with a R2 value of 0.9284.
Figure3-1: BHs and Time 1930-2013
3.2.BOREHOLE Decadal Spatial Temporal Distribution Aggregating the number of BHs drilled per decade produced a similar trend as observed in Figure whereby 81.6% of all BHs were drilled between 1990 and 2013. A power trend line of y=17.746x2.0216 was calculated with an R2 value of 0.9473 as shown inFigure3-1. .
Figure3-1: Decadal BH Distribution
3.2.1THE PERIOD 1930-1939 In this period a total of 14BHs were drilled in Eastleigh North (2), Karen (3), Riruta (1), Umoja (1), Spring Valley/Upper Parklands (3) and the remaining 4 were only located to be in the County. The distribution resulted in an

International Journal of Application or Innovation in Engineering & Management (IJAIEM) Web Site: www.ijaiem.org Email: [email protected]
Volume 4, Issue 3, March 2015 ISSN 2319 - 4847
Volume 4, Issue 3, March 2015 Page 234
average of 0.23 BHs per Sub-location drilled at a rate of 1.4 BHs/Sub-location/yr resulting in a spatial density of 0.02 BHs/km2. The number of BHs per Sub-location drilled in this period is shown in Figure 3-2 whereby these Sub-locations fall in the West and Central areas of the County. 3.2.2THE PERIOD 1940-1949 Between 1940 and 1949 the number of BHs in the County increased by the development of 91BHs drilled at a rate of 0.15 BHs/Sub-location/yrmainly in the Central and Westerly regions of the County as shown by Figure 3-2. Majority of these BHs were drilled in Karen, Loresho/Kyuna and Riruta and this brought the total number of BHs in the County to 105 as shown inFigure 3-4. The distribution of the total number of BHs at the end of the decade was largely influenced by the 1940s decade in which more BHs were drilled as compared to the previous decade.
Figure 3-2: BHs Drilled 1930-1939 Figure 3-3: BHs Drilled 1940-1949
By 1949 the spatial density of BHs in the county was increased to 0.15 BHs/Km2 with an average distribution of 1.69 BHs per Sub-location. 3.2.3THE PERIOD 1950-1959 In this decade a total of 141 BHs were drilled at a rate of 0.23 BH/Sub-location/yr with majority of them being drilled in Karen, Langata and Loresho/Kyuna. Whilst the majority of BHs drilled in this period lied in the Western and North-West regions of the County a more uniform distribution was observed in the other regions as shown in Figure 3-6 whereas on average 2.27 BHs were drilled per Sub-location.
Figure 3-4: Total BHs 1949 Figure 3-5: BHs Drilled 1950-1959
The total number of BHs in the County at the end of decade stood at 246 and theirdistribution was greatly influenced by the BHs drilled in the latter two decades whereby most of these BHs were in Embakasi, Langata, Loresho/Kyuna and Karen Figure 3.7.At the end of this period the number of BH per Sub-location stood at 3.97 with a spatial density of 0.35 BH/Km2.
International Journal of Application or Innovation in Engineering & Management (IJAIEM) Web Site: www.ijaiem.org Email: [email protected]
Volume 4, Issue 3, March 2015 ISSN 2319 - 4847
Volume 4, Issue 3, March 2015 Page 235
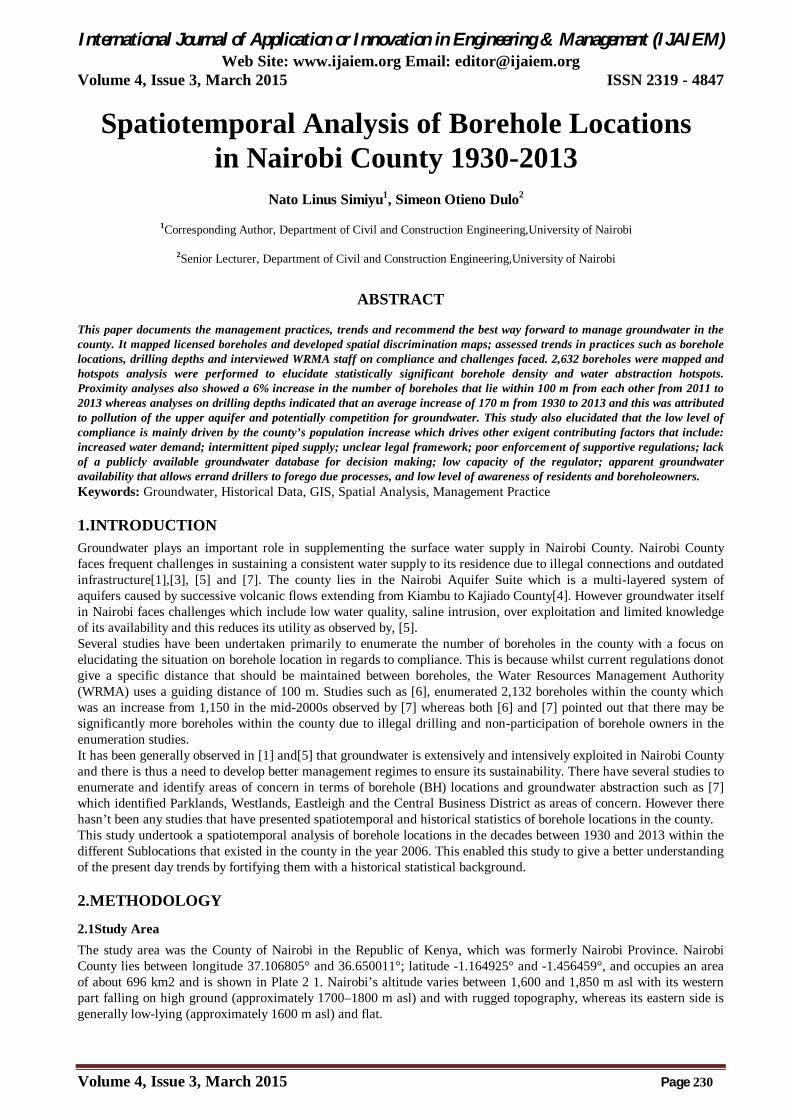
3.2.4THE PERIOD 1960-1969 This period had a significantly low number of BHs drilled whereby only 12 were drilled at a rate of 0.02 BH/Sub-location/yr with most of them, 4 BHs, being drilled in Embakasi, whilst all other BHs were distributed equally in 8 Sub-locations as shown in. Figure3-8.
Figure 3-6: Total BHs 1959 Figure 3-7: BHs Drilled 1960-1969
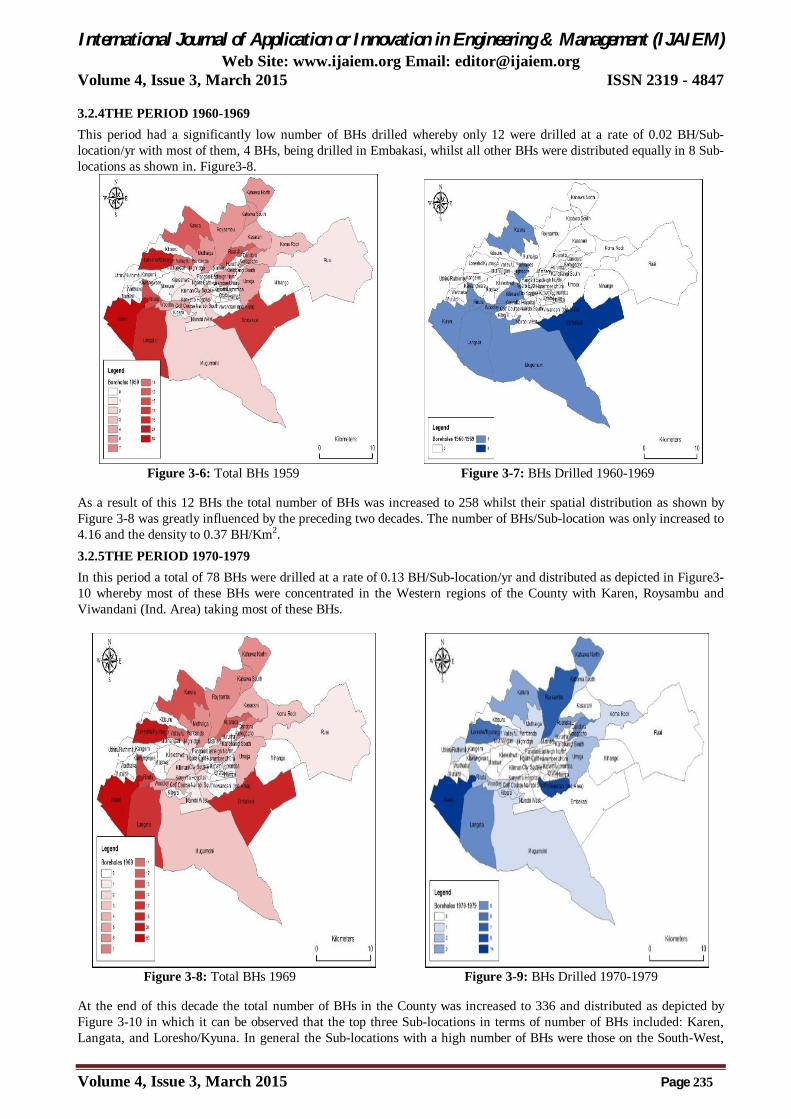
As a result of this 12 BHs the total number of BHs was increased to 258 whilst their spatial distribution as shown by Figure 3-8 was greatly influenced by the preceding two decades. The number of BHs/Sub-location was only increased to 4.16 and the density to 0.37 BH/Km2. 3.2.5THE PERIOD 1970-1979 In this period a total of 78 BHs were drilled at a rate of 0.13 BH/Sub-location/yr and distributed as depicted in Figure3-10 whereby most of these BHs were concentrated in the Western regions of the County with Karen, Roysambu and Viwandani (Ind. Area) taking most of these BHs.
Figure 3-8: Total BHs 1969 Figure 3-9: BHs Drilled 1970-1979
At the end of this decade the total number of BHs in the County was increased to 336 and distributed as depicted by Figure 3-10 in which it can be observed that the top three Sub-locations in terms of number of BHs included: Karen, Langata, and Loresho/Kyuna. In general the Sub-locations with a high number of BHs were those on the South-West,

International Journal of Application or Innovation in Engineering & Management (IJAIEM) Web Site: www.ijaiem.org Email: [email protected]
Volume 4, Issue 3, March 2015 ISSN 2319 - 4847
Volume 4, Issue 3, March 2015 Page 236
South-East and North. Additionally in this decade the number of BH/Sublocation was increased to 5.42 with a spatial density of 0.48 BH/Km2. 3.2.6THE PERIOD 1980-1989 In this decade the number of drilled increased as compared to the previous two decades such that 133 BHs were drilled as shown by Figure 3 12 and at a rate of 0.21 BH/Sublocation/yr. Whilst more BHs were drilled in the Southern Sub-locations (Karen, Langata, Mugumoini, Embakasi and Viwandani (Ind Area), a rather uniform distribution occurred in the northern and central Sub-locations.
Figure 3-10: Total BHs 1979 Figure 3-11: BHs Drilled 1980-1989
This decade increased the total BHs in the County to 469 distributed as illustrated in Figure 3-12, whereby a ring of high BHs per Sub-location can be observed stretching from southwest to southeast in Embakasi, then north through Umoja to northwest. At the end of the decade the number of BH/Sub-location was increased to 7.56 and the density to 0.67 BH/Km2. 3.2.7.THE PERIOD 1990-1999 In this period a total of 239 BHs were drilled at a rate of 0.39 BH/Sub-location/yr, distributed as shown in Figure 3 14 whereas most of these were in Muthaiga, Viwandani (Ind. Area), Karen, Langata and Embakasi. Whilst the southerly Sub-locations had more BHs in this period drilling was generally spread across the County wherein less BHs were observed in the central region of County..
Figure 3-12: Total BHs 1989 Figure 3-13: BHs Drilled 1990-1999
This period also increased the number of BHs in the County to 708 and fortified the Sub-locations with the most BHs to be: Karen, Langata, Embakasi, Viwandani (Ind. Area) and Loresho/Kyuna as shown by Figure 3-14. By the end of 1999 there were 11.4 BH/Sublocation with a density of 1.02 BH/Km2.

International Journal of Application or Innovation in Engineering & Management (IJAIEM) Web Site: www.ijaiem.org Email: [email protected]
Volume 4, Issue 3, March 2015 ISSN 2319 - 4847
Volume 4, Issue 3, March 2015 Page 237
3.2.8THE PERIOD 2000-2009 In this decade 432 BHs were drilled in Nairobi at a rate of 0.7 BH/Sublocation/yr which was a significant increase as compared to the previous decades. The top four Sub-locations in which these BHs were drilled included: Embakasi, SP Valley/Parklands, Karen and Langata, whereas these BHs were generally drilled across the County with the central region having least BHs drilled as compared to the other regions as shown by Figure 3 16.
Figure 3-14: Total BHs 1999 Figure 3-15: BHs Drilled 2000-2009
The total number of BHs was increased to 1,140 distributed as shown by Figure 3-16 and the trend established in the previous decade continued further with Karen, Langata, Mugumoini, Embakasi, Viwandani (Ind. Area) and Loresho/Kyuna being the Sub-locations with the most BHs. Similarly to the end of the previous decade the central Sub-locations around Eastleigh had less BHs as compared to the other regions.At the end of this decade there were 18.39 BH/Sub-location with a density of 1.64 BH/Km2
3.2.9THE PERIOD 2010-2013 This period saw the most BHs drilled as compared to the other periods of this study. In total 1,414 BHs were drilled at a rate of 5.7 BH/Sub-location/yr in this period and distributed as depicted by Figure 3 18, whereby the most were drilled in Langata, Muthaiga, Kilimani, Highridge and Embakasi. It can also be observed that the central Sub-locations had less BHs drilled as compared to the other regions.
Figure 3-16: Total BHs 2009 Figure 3-17: BHs Drilled 2010-2013
The BHs drilled in this period increased the number of BHs in the County to 2,554 and largely influenced their distribution since the BHs drilled in this period represented 55.4% of the total BHs at the end of 2013. Figure 3-18 presents the spatial distribution of these 2,554 BHs whereby it can observed that the Western region of the county
International Journal of Application or Innovation in Engineering & Management (IJAIEM) Web Site: www.ijaiem.org Email: [email protected]
Volume 4, Issue 3, March 2015 ISSN 2319 - 4847
Volume 4, Issue 3, March 2015 Page 238
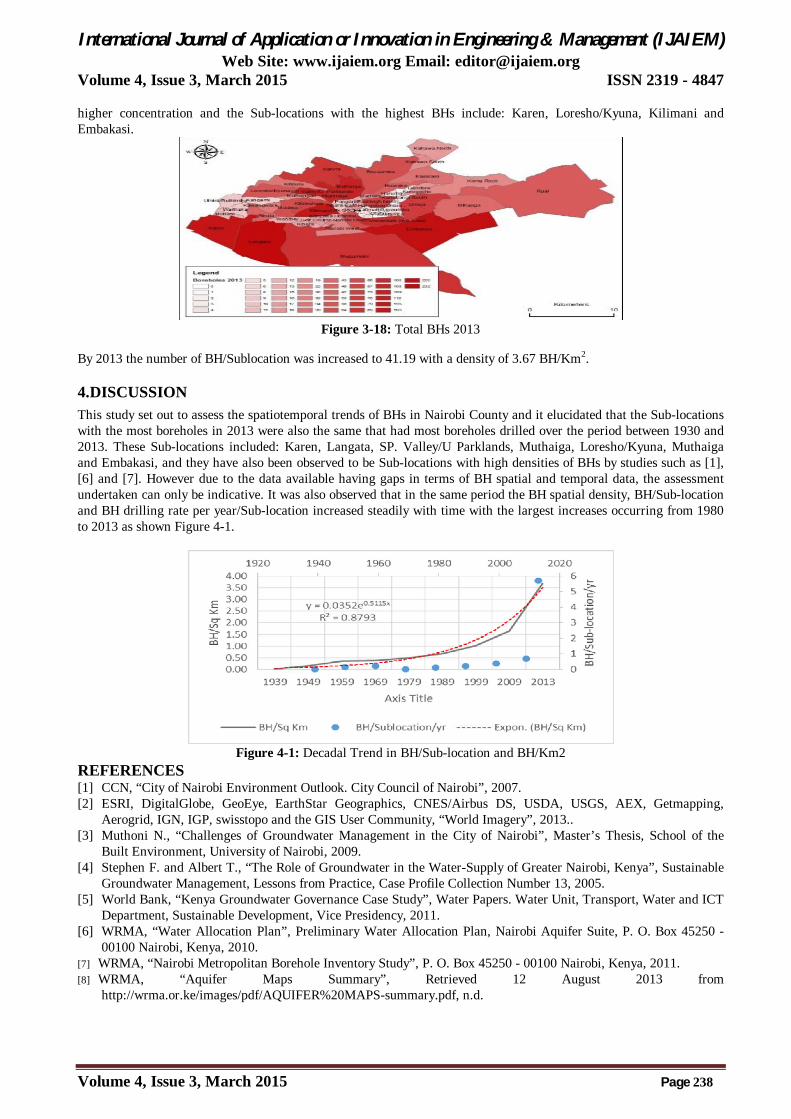
higher concentration and the Sub-locations with the highest BHs include: Karen, Loresho/Kyuna, Kilimani and Embakasi.
Figure 3-18: Total BHs 2013
By 2013 the number of BH/Sublocation was increased to 41.19 with a density of 3.67 BH/Km2.
4.DISCUSSION This study set out to assess the spatiotemporal trends of BHs in Nairobi County and it elucidated that the Sub-locations with the most boreholes in 2013 were also the same that had most boreholes drilled over the period between 1930 and 2013. These Sub-locations included: Karen, Langata, SP. Valley/U Parklands, Muthaiga, Loresho/Kyuna, Muthaiga and Embakasi, and they have also been observed to be Sub-locations with high densities of BHs by studies such as [1], [6] and [7]. However due to the data available having gaps in terms of BH spatial and temporal data, the assessment undertaken can only be indicative. It was also observed that in the same period the BH spatial density, BH/Sub-location and BH drilling rate per year/Sub-location increased steadily with time with the largest increases occurring from 1980 to 2013 as shown Figure 4-1.
Figure 4-1: Decadal Trend in BH/Sub-location and BH/Km2
REFERENCES [1] CCN, “City of Nairobi Environment Outlook. City Council of Nairobi”, 2007. [2] ESRI, DigitalGlobe, GeoEye, EarthStar Geographics, CNES/Airbus DS, USDA, USGS, AEX, Getmapping,
Aerogrid, IGN, IGP, swisstopo and the GIS User Community, “World Imagery”, 2013.. [3] Muthoni N., “Challenges of Groundwater Management in the City of Nairobi”, Master’s Thesis, School of the
Built Environment, University of Nairobi, 2009. [4] Stephen F. and Albert T., “The Role of Groundwater in the Water-Supply of Greater Nairobi, Kenya”, Sustainable
Groundwater Management, Lessons from Practice, Case Profile Collection Number 13, 2005. [5] World Bank, “Kenya Groundwater Governance Case Study”, Water Papers. Water Unit, Transport, Water and ICT
Department, Sustainable Development, Vice Presidency, 2011. [6] WRMA, “Water Allocation Plan”, Preliminary Water Allocation Plan, Nairobi Aquifer Suite, P. O. Box 45250 -
00100 Nairobi, Kenya, 2010. [7] WRMA, “Nairobi Metropolitan Borehole Inventory Study”, P. O. Box 45250 - 00100 Nairobi, Kenya, 2011. [8] WRMA, “Aquifer Maps Summary”, Retrieved 12 August 2013 from
http://wrma.or.ke/images/pdf/AQUIFER%20MAPS-summary.pdf, n.d.