volume 1 land use plan of jagna 2011-2020 page -...
TRANSCRIPT

Volume 1 – Land Use Plan of Jagna 2011-2020 Page - 1

Volume 1 – Land Use Plan of Jagna 2011-2020 Page - 2
INTRODUCTION The Local Government Code of 1991 otherwise known as the Republic Act No. 7160 has
established two principles that serve as the basis for land use planning for local
governments. The policy embodied the “genuine and meaningful local autonomy” to the
Local Government Unit to enable them to attain the fullest development as a self-reliant
community with the utilization of limited resources as they become more productive
partners in nation building.
Furthermore, it is affirmed in Section 1 of Executive Order No. 72 series of 1993 providing
the mandate for Local Government Unit to prepare their respective Comprehensive Land
Use Plan (CLUP), which will effectively translate national/regional and provincial policies into
local or municipal plans, program and policies. Its formulation, adoption and modification of
said plan shall be in accordance with the Provincial Development and Physical Framework
Plan of Bohol (PDPFP).
It is on this premise that the Comprehensive Land Use Plan was initiated and undertaken
jointly by the Municipal Land Use Technical Working Group of Jagna under the leadership of
Hon. Fortunato R. Abrenilla and Hon. Exuperio C. Lloren and in collaboration with the
Provincial Government of Bohol thru the Provincial Planning and Development Office.
The CLUP of Jagna becomes the official document adopted by the local government as a
policy prime-mover that will serve as a guidepost and blueprint in addressing pressing issues
and concerns as well as physical and land use development of the municipality as envision
by the stakeholders in the coming years. It is comprehensive in the sense that it embraces
the entire territorial jurisdiction of the municipality as it addresses multi-faceted concerns of
various sectors. Secondly, it is comprehensive as it translates the development goals,
objective and policies into spatial plan indicating the proper allocation of land resources
taking into account the sustainable development without risk to the environment.

Volume 1 – Land Use Plan of Jagna 2011-2020 Page - 3
The CLUP document is presented and structured into three volumes:
Volumes Description of the Content
Volume 1 This volume comprises the formal and substantive elements of the CLUP and Zoning Ordinance based on the HLURB Guidelines which includes the following.
Preliminary Pages
Brief Profile of the Municipality (General Information) which states the following: Brief History of the Municipality Human Resources/Demographic Characteristics as to size, growth rate,
density, distribution, labor force, etc Physical Features as to geographic location, territorial jurisdiction and
barangay subdivision Physical/Infrastructure Resources e.g. inventory of maps and tables for
the transportation network, social services, utilities (power, water, communication, solid waste management and economic structure
Existing Land Use and Land Use Trends
Comparative and Competitive Advantages
Priority Issues and Concerns
Functional Role of the Municipality
Vision, Mission, Goals, Objectives and Strategies
Land Use Plan (General/Urban both Existing and Proposed)
Priority Local Development Investment Programming (10-year LDIP)
It contains the discussion and interpretation on how the municipality evolved to its present state of development as well as the overall physical characteristics as well as the prevailing existing situation of the political, social, economic infrastructure and environment, which help shaped the present municipal state of development. It also discussed other factors in growth and trend that will help the present local condition with due regards to the emerging trends in future use of the land. The land uses are consistent with the planning standard of the Housing Land Use Regulatory Board (HLURB).
The 10-year Local Development Investment Program (LDIP) and the Zoning Ordinance of the municipality, both of which underwent the required multi-sectoral consultation and public hearing as mandated under the local government code and the physical land use planning guidelines.
Volume 2 Volume 2 presents the locally enacted ordinance which embodies the regulations affecting the uses allowed or disallowed in each zone or district, and the conditions and deviations legally allowed from the requirements of the ordinance.
Volume 3 Volume 3 comprises the detailed documentation of the sectoral studies

Volume 1 – Land Use Plan of Jagna 2011-2020 Page - 4
conducted that provides the bases in the updating of the CLUP. The presentation and documentation includes demography and the major five (5) development sectors: 1) environment, 2) social, 3) economic, 4) infrastructure and 5) development administration.
Objectives
Pursuant to the development thrust of the Municipality of Jagna and consistent with the national, regional, and provincial goals and policies affecting land use the following objectives of this Comprehensive Land Use Plan were set forth.
General Objective
To promote sustainable development in areas like social, economic, infrastructure, local governance and environment.
Specific Objectives
To promote land areas for future development such as settlement, agro-industrialization, ecotourism, waste and garbage disposal, urban use and other suitable land uses in the municipality.
To provide guidance for correct location for future development without compromising the primary concern on health, safety, welfare and convenience of the people.
To sustain the ecological balance of the environment.
To provide access by the population to economic opportunities and basic services.
To identify properly the constrained and other high risks areas prone to natural hazards like flooding, tsunami, landslide and among others in order to prevent negative impacts to the environment
PLANNING AREA
The planning area is defined by the political boundaries of the Municipality of Jagna, comprising of 33 barangays that covers an approximate area of 12,063 hectares and the municipal waters extending three kilometers from shoreline for coastal LGU. Therefore, the CLUP shall cover both the land and water resources of the municipality.
PLANNING PERIOD
This Comprehensive Land Use Plan of the Municipality covers a period of ten (10) years, from 2011-2020. It may be reviewed every three (3) years coinciding with the term of the locally elected officials for their appreciation and for continuity of the plan implementation.

Volume 1 – Land Use Plan of Jagna 2011-2020 Page - 5
Such review will provide an opportunity for the incumbent or incoming new elected officials to harmonize the new administration’s development agenda with the approved CLUP which will then be basis for budget preparation and fund sourcing mechanism.
LEGAL BASIS
The legal basis in the preparation of the Comprehensive Land Use Plan is stipulated in Article 41, (a) of Republic Act 7160, otherwise known as the Local Government Code of 1991 which states that “ Subject to applicable laws, rules and regulations, cities and municipalities shall continue to prepare and update their respective comprehensive land use plans enacted through zoning ordinances”. Furthermore under Section 47 of RA 7160(2)(iv), which provides to “ Enact Integrated Zoning Ordinances in consonance with the approved Comprehensive Land Use Plan subject to the existing laws rules and regulation.
LINKAGE OF CLUP TO PDPFP OF BOHOL
In the preparation of this plan all effort were made to ensure that the plan is aligned with in the Provincial Development and Physical Framework Plan (PDPFP) of Bohol and consistent with and in support to our overarching development framework, the H.E.A.T. Bohol and L.I.F.E. H.E.L.P.S. Strategies and to the other higher level plans which serve as a guiding premise. Planning goals, objectives and policies of HLURB were likewise utilized to ensure conformity with the standards embodied by the agency.
The point of connectivity between the province and the municipalities is the respective land use plans of provinces and municipalities. State regulation of land use implies that there must be vertically integrated physical framework plans from the national down to the municipal level. Therefore, the long-term CLUP of a municipality should be consistent with its higher level counterparts: the PDPFP, RPFP and finally the NFPP, which represents the provincial, regional and national physical framework plans.
The basic rationale for the review of the CLUPs of the component cities and municipalities by the Provincial Land Use Committee (PLUC) is to ensure vertical and horizontal integration and linkage of CLUPs and consistency of land use policies among adjoining LGUs. Therefore, the National Government Agencies are required to coordinate or consult with LGUs before undertaking their projects within the local territorial jurisdiction (Based on Section 26 and 27 of the Local Government Code).
METHODOLOGY
The planning process employed in the preparation of the Comprehensive Land Use Plan of Jagna calls for the collective effort of all municipal, provincial and national line agencies stationed or assigned in the municipality. It focuses on the baseline information of data updating and generation and analysis of the social, economic, infrastructure, local governance, physical natural features and environmental activities of the municipality. The formation of the Municipal Technical Working Committee provides greater access to the required information and data. Planning workshop and series of activities were conducted to ensure full participation of the different sectors especially in the analysis of data, which

Volume 1 – Land Use Plan of Jagna 2011-2020 Page - 6
often cut-across the different dimensions of the sectoral requirement. All reactions and comments generated were noted and considered before the final draft was submitted for approval to the Local Chief Executive and the Sangguniang Bayan and to the Provincial Land Use Committee and Sangguniang Panlalawigan.
APPROACHES USED TO CLUP UPDATING
The Local Government Unit of Jagna adopted a combination of bottoms-up and top-bottom approach and the integration of Gender Responsive and Disaster Risk Reduction Management approach in the updating of the Municipal Comprehensive Land Use Plan. It is further presented below:
Approaches Description
Integration of Barangay Development Plans
Under the Local Government Code of 1991, the Barangay Development Councils are tasked to prepare Barangay Development Plans to be submitted to the Sannguniang Bayan for review and approval. Thus, the integration of Barangay Development Plans into the municipal plan is one methodology which the LGUs can adopt in the formulation of the CLUP. Furthermore, the integration aims to harmonize development goals and objectives of all barangays in the municipality of Jagna. It also identifies and reconciles inconsistencies and incompatibilities in land use proposals among adjacent barangays.
Top to Bottom Approach
In the absence of barangay and municipal development plans, the local planners adopt the top to bottom approach to planning. In this case, the Provincial Development and Physical Framework Plan (PDPFP) of Bohol may serve as basis and framework in the formulation or updating of the Municipal CLUP without precluding consultation with component LGUs. In the absence of the PDPFP, other higher level plans like Medium Term Development and Physical Framework Plans in the Region and National can be used as the bases for the updating of the CLUP. Likewise, detailed area-specific plans such as coastal management plans, solid waste, forest land use, culture and heritage plans, disaster risk reduction management shall be considered and integrated in the preparation or updating of the CLUP which shall be subject to the review and harmonization with the municipal vision, goals and objectives.
The integration of gender and explicit consideration of development (social, economic, physical, cultural and political forces that determines how differently women
Volume 1 – Land Use Plan of Jagna 2011-2020 Page - 7
Gender Responsive Population and Development
and men participate in, benefit from and control resources and activities. The combined gender-responsive and participatory approach in the entire planning and decision-making process from plan formulation/updating, plan implementation and monitoring and evaluation is a manifestation of good governance that will bring us closer to our goal of having men and women equally contributing to and benefiting from development. The utilization of gender-responsive planning approach ensures or provides a mechanism for integrating sustainable indicators in planning.
Mainstreaming Disaster Risk Reduction Management to Land Use Plan
Updating of CLUPs and CDPs should be based on the Joint Memorandum Circular (JMC No. 001 s. 2009 on CLUP and CDP Harmonization issued by DILG and HLURB to mainstream Disaster Risk Management and Climate Change Adaptation to local planning processes. The integration of disaster risk parameters in the CLUP processes shall start from the data generation and analysis, goal formulation, strategy and land use policy formulation, enforcement and implementation.
ACKNOWLEDGEMENT
The Municipal Government of Jagna would like to express its sincerest gratitude to the Provincial Government of Bohol thru the Provincial Planning and Development Office for the technical inputs during the crafting of the Comprehensive Land Use Plan. Special thanks to the members of the Municipal Technical Working Group (MTWG), composed of representatives from the municipal executive and legislative branches and the national agencies for their perseverance, diligent, commitment and participation during the seemingly endless discussions in the spirit of volunteerism in providing valuable inputs, guidance and encouragement and showed relentless support towards the finalization of the plan. Composition of Sectoral CLUP-TWGs:
Sector Agency
Representative/s
Social Services (health, education, sanitation and nutrition, social welfare, housing and shelter, population, culture & arts)
MSWD – Lead Office KKJ-LCW
Chairperson: Ms. Marcionila Reyes Vice Chairperson: Nimfa A. Lloren Members:

Volume 1 – Land Use Plan of Jagna 2011-2020 Page - 8
RHU 1 RHU 2 DepEd LCR TESDA Chairman, SB Committee on Health
Dr. Arnold Dasio M. Cagulada Dr. Emilio Raymund Claudio Ms. Delfina L. Ola-a Lovella E. Acebes Engr. Wenifredo Salas Kag. Bonifacio J. Virtudes Jr.
Environment & Natural Resources (forestry, mining; coastal - fishery and aquatic resources; solid and liquid waste mgt; karst mgt; pollution-air, land and water; and climate change)
MPDC – Lead Agency Member, SB Committee on Zoning & Land Use DENR-Forester MAsO ISWM Action Officer CRM/MPA/MFARMC Member, SB Committee on Environment & Natural Resources
Chairperson: Engr. Gerry V. Araneta Vice Chairperson: Kag. Jesus B. Acedillo Members: Manuel Cadeliña Ma. Esterlina G. Ando Melba A. Bucog Rufino Jamisola Kag. Teofisto C. Pagar, Sr.
Economic (agriculture – crops, livestock and fishery; trade and commerce; micro-enterprise and cottage industries; eco-tourism, labor and employment; and cooperatives)
MAO – Lead Agency Market Operation Supervisor MAsO MARO Municipal Tourism Officer
Chairperson: Camilo A. Rizano Vice Chairperson: Engr. Peter M. Jamero Members: Diosdada Rañises Ethel Abrau Ms. Elizabeth O. Balaba

Volume 1 – Land Use Plan of Jagna 2011-2020 Page - 9
Chairperson, SB Committee on Tourism MPIO Member, SB Committee on Trade & Industry
Kag. Cesar M. Cagulada Catalino B. Berro Kag. Godofredo P. Okit Sr.
Development Administration (local governance; public finance; public order and safety, sports and recreation)
MTO – Lead Agency MBO MAcO HRMO PNP MLGOO MTC ABC Pres; Member, SB Committee on Zoning & Land Use Member, SB Committee on Zoning & Land Use
Chairperson: Raymund F. Cuadra Vice Chairperson: Zenaida Galorio Members: Ms. Brigida B. Aceron Zenaida A. Galorio Efrena A. Buenafe PS/Insp. Mercedarious Balabat Mr. Lito O. Dajalos Nilo D. Sajot Kag. Cirilo C. Acedo Kag. Rodrigo Lloren
Infrastructure & Utilities (transportation – roads & bridges; water resources; communications; energy; drainage & sewerage)
MEngO – Lead Agency Vice Chairperson, SB Committee on Zoning & Land Use Chairperson, SB Committee on Zoning & Land Use Waterworks Office BOHECO II
Chairperson: Engr. Josefina S. Rañoa Vice Chairperson: Kag. Alberto A. Cabrestante Members: Kag. Jesus B. Acedillo Bernardo Baja Engr. Eugene Tan
Fast Facts About Jagna

Volume 1 – Land Use Plan of Jagna 2011-2020 Page - 10
History
General Information
Homepage/Website : http://jagna.lgu.ph Land Area : 12,063 hectares or 120.63 square kilometers Currency : Philippine Peso (Php) Political Administrative : Located in 3
rd Congressional District
Barangays/villages : 33 barangays clustered into 3: 1. Metro Jagna (8 urban/coastal barangays) 2. Coastal Jagna (14 barangays) 3. Upland Jagna (17 barangays)
Location : Southern Seaboard Distance from Tagbilaran : 63.2 kilometers Language : Almost Jagnaanon can speak and write English Topography : Varies from level to steeply sloping, with land elevation ranging
from 0 to nearly 900 meters above sea level Climate : Generally Fair Average Temperature : 78˚Farenheit or 26˚ Celsius. Southwest
monsoon is from April to September, northeast monsoon from October to May, southeast monsoon is June to September and seasonal winds/northeast trade occurs from October to December
Population : 32,034 (NSO 2007) Sex Ratio : 1:1.03 Population Growth : 0.61% Number of households : 5,957 Business/Industry : 277 Banks/Lending : 3 Pawnshops : 6 Tourist Arrivals : 18, 500 persons Major Agri. Products : Coconut, rice, corn, vegetables, fruits, rootcrops Communications : BLECS, Jagna Community Radio, Radio Natin FM Station in Jagna
owned by MBC, COMMEL Relay station on Mayana, CRUZTELCO, San Miguel Cable TV, SMART, Sun Cellular, Globelines, Government-owned Telecom
Poverty Incidence : 10.51% (2005 PDMS Survey); 17.44% (2009 PDMS) Protected Areas : 1,863 hectares (PP 881) Agricultural Area : 8, 354 hectares Major Livestock &Poultry : Poultry, swine, carabao, cattle, goat Primary Schools : 3 Elementary Schools : 21 Secondary Schools : 7 Tertiary/college : 2 Literacy Rate : 98% Number of Hospitals : 2 Barangay Health Stations : 33 Day Care Centers : 34 Senior Citizen Affairs Office: 1
Volume 1 – Land Use Plan of Jagna 2011-2020 Page - 11
Jagna is one of the fastest growing municipalities located on the southeastern seaboard in Bohol Island. It has a state-of-the art modern Roro port which is a gateway to Mindanao. According to the historical records, the name of Jagna was derived from the legendary vernacular exclamation “NI JAGNA NA” which means “the oil being cooked is almost done”. Centuries ago, a massive of school of “TIGUE” fish struck the awe of the people as the sea where the BOHO river emptied itself shaked and bubbled due to the action of the fish (du-ot). The concentrated shaking and bubbling action of the sea was likened to a boiled coconut milk almost ripening itself to become a coconut oil. Therefore, in the dialect, the natives in the town call this almost-oil stage “ni hagna na”. Thus, the village named “Hagna” was born. But the Spaniards went further and they identified the place as “San Miguel de Hagna”. Yet to be explained is why Hagna had been, and still is, spelled “Jagna”. Currently the name of the town evolved. Jagna appears in the document as early as March 15, 1565 when Miguel Lopez de Legazpi was driven by unfavorable winds ad tides towards Jagna bay after his expedition left Camiguin Island heading for Butuan. He found the natives to be unfriendly because of their experience with the Portuguese a few years back.
Three days later, the first mass in Bohol was celebrated in Jagna shores by Fr. Andres Urdaneta and other friars aboard the flagship “San Pedro” as it also underwent repairs prior to its invasion in Cebu. Captain Martin de Goite who was with Legaspi's fleet was sailing the coastline of Jagna one night when he accidentally encountered a large parao which was loaded with rice and ubi. The said parao was left unguarded because upon seeing the poop-boat (batel) of Capt. Goite, all the natives jumped overboard. Those pre-Spanish natives of Jagna may have relative blood and contemporaries of those natives whose bones were excavated in Basdio, Guindulman, Bohol The Jesuits may have come to this town in 1596 but it was only in 1631 when Fr. Jose Sanchez, S.J. founded the parish and town simultaneously with “San Miguel de Archangel” as the patron saint. Jagna was first settled by immigrants from Loboc, who transformed the wide valley into rice paddies. It became a prosperous community. It was arrival of Fr. Jose Sanchez, S.J. in Jagna, the group was supposed to migrate to Mindanao riding on their sailboats called “bilos” but because of the bad weather, they were forced to seek shelter in Jagna. However this brief refuge turned into a permanent stay as they found Jagna attractive and an ideal place for living.
One of the earliest existing documents that can support the claim of Jagna as a town founded earlier than what other historians had been claiming for is the “Vocabulario de la Lengua Bisaya Conpuesto” authored by the Jesuit priest Fr. Matheo Sanchez which was written in 1618 but was only published in Manila in the year 1711. On page 215 of the said document, it clearly states;

Volume 1 – Land Use Plan of Jagna 2011-2020 Page - 12
Hagna up f un. Cienaga, es tambien un Pueblo de Bohol por otro nombre San Miguel
Translated as: Hagna , a marshy moor; it is also a town in Bohol the other name of which is San Miguel.
Through to a forced labor, a church of stone was built and was completed in 1809 and a big convent was completed in 1878. The first floor of this convent was used as a classroom. However, the people also built a seven-room school building which at present houses the primary classes of the public school. Religious instruction was the most important subject of the curriculum during the Spanish Regime. The children were required to read the caratilla and doctrina and memorized the prayers and failure to do so was punished with a whip or with a ferule. When the Philippine Revolution broke out, the people fought against the Spaniards. And in the resistance movement against the United States, many soldiers from Jagna, armed with bolos and spears were killed in the battle of Lonoy. The American troops annihilated some 106 ill-clad, bolo-armed foot soldiers of the insurrection without firing a single shot.. But they showed their love of freedom and nobly defended it with their lives. When peace was restored, schools were opened and education was free including books, paper and pencils. Because of the limited teachers, the people who had finished the fourth grade were asked to teach. A historical marker from the Philippine Historical Commission now stands on the site of the massacre. During World War II, the Japanese occupied the town. At first the soldiers were quite friendly, but as the war progressed, they became fierce and cruel. They imprisoned the civilians especially the relatives of the Bohol guerrillas. They even captured and bayoneted many people in the town. When Bohol was split into two independent dioceses in 1988, Jagna was made a component parish of the diocese of Tagbilaran. Without the benefit of plebiscite or referendum, the people of Jagna woke up one day in 1990, knowing thus, that their town now belongs to Diocese of Talibon. The sad speaking intonation of the people of Jagna became sadder when they learned of their transfer from a short distance diocese to a remotely-seated diocese of Talibon. The traditional show of veneration of the people of Jagna to the patron saint, Saint Michael de Archangel dates as back as time immemorial. Hospitality of Jagna has no limit. PHYSICAL CHARACTERISTICS

Volume 1 – Land Use Plan of Jagna 2011-2020 Page - 13
Geography and Location
Jagna is situated along the southeastern coast of Bohol facing Mindanao Sea. It is located 63.2 kilometers from the capital city of Tagbilaran, bounded on the north by the municipality of Sierra Bullones, blue waters of Jagna Bay on the south, and the towns of Duero and Garcia Hernandez on the east and west respectively. It has 33 barangays with a total land area of 12,063 hectares.
As a result of the process undertaken through the Barangay Development Planning through Participatory Rural Appraisal, the Municipality of Jagna is subdivided into three major categories.
The urban area of Jagna, appropriately called the Metro Jagna cluster is composed of the barangays of Bunga Mar, Can-upao, Looc, Pagina, Canjulao, Poblacion, Tejero and Pangdan. It covers a total land area of 316.05 hectares equivalent to 2.62% of the total area of the municipality.
The Coastal Jagna cluster is composed of barangays located along the coast fronting the Jagna Bay, other than those already classified as part of the Metro Jagna. It covers a total land area of 747.04 hectares or 6.19% and include Alejawan, Cantagay, Can-uba, Ipil, Larapan, Naatang, Nausok, , Tubod Mar.
Ninety one percent (91%) of the total land area of Jagna is considered to comprise the Upland Jagna cluster. With a total land area of 10, 999.91 hectares, it covers the barangays of Balili, Boctol, Bunga Ilaya, Buyog, Cabungaan, Calabacita, Cambugason, Can-ipol, Cantuyoc, Faraon, Kinagbaan, Laca, Lonoy, Malbog, Mayana, Odiong and Tubod Monte.
Topography The municipality is predominantly comprised of steep hills and mountains. The coastal areas are normally flat, but less than a kilometer away from the shoreline, the slope changes from gently sloping to steep hills and mountains. 14.13% of the total land area is classified as level or nearly level. 28.62% on the other hand, is gently sloping to moderately sloping. While the rest of the area comprising the remainder of the 57.25% is classified as hills to steep mountains. Based on the slope classification, those areas identified as moderately sloping to mountains are classified as public or forestland areas. And for those level or gently sloping areas, they are classified as Alienable and Disposable lands. Forestlands using this classification will cover 59.42% of the total land area of the municipality.
Table 1 Slope Classification by Percentage

Volume 1 – Land Use Plan of Jagna 2011-2020 Page - 14
Municipality of Jagna
SLOPES (%) DESCRIPTION AREAS (has) % TOTAL
0 – 3 Level to nearly level 1,704.66 17.25
3 – 8 Gently sloping to undulating 210.00 1.67%
8 – 18 Moderately sloping to rolling 3,425.04 28.62
18 – 30 Rolling to hills 2,076.25 17.18
30 – 50 Steep hills and mountains 2,821.95 23.39
50 – above Very steep hills and mountains 2,011.88 16.68
Total 12,063.00 100.00
Source: Bureau of Soil and Water Management Region 7 Based on the slope category, those areas having slopes of 18% and above area classified as public or forestland. Those areas with slope of below 18% are classified as Alienable and Disposable (A&D) lands. Forestlands using this classification will cover 59.42% of the total land area of the municipality. Areas with slope of 50% and above will be categorized as protection forest. Protection forest would then cover 17% of the total land area. Soil Type Soil composition in the area is of two types, namely, Calape Clay Loam and Annam Clay as indicated in the table below. Calape clay loam comprises 5.71% and occupies most of the urban area, while Annam clay covering 94.29% of the total land area. Table 2 Soil Classification Municipality of Jagna
SOIL TYPE AREA (sq.m.) % TOTAL
Calape Clay Loam 689.38 5.71
Annam Clay 11,373.52 94.29
T o t al 12,063.00 100.00
Source: Bureau of Soil and Water Management Region 7 Karst Karst is defined as a terrain with special landforms and drainage characteristics due to greater solubility of certain rocks in natural waters than is common. KARST formation one of which is the Sierra–Bullones limestone occupies 63.77% of Jagna’s Land Area. It is capped by a massive limestone strongly correlating with the barili formation of South Central Cebu. It is overlain with white marl. Maribojoc limestone is the youngest tertiary limestone in the province, it is a non–fossiliferous, porous limestone which exhibits poor bidding or none at all. In Jagna, it dips gently seaward and shows rubbly to conglomerate limestone beds suggesting shallow marine environment of disposition. Climate and Weather Pattern

Volume 1 – Land Use Plan of Jagna 2011-2020 Page - 15
Jagna falls under Type II climate classification described as having no pronounced dry season but with a very pronounced maximum rain period. Maximum rainfall is observed to occur on the months of August, September and October, even extending until December. Located along or very near the eastern coast, as characterized by areas under Type II classification, Jagna is prone to the northeast monsoon (amihan). Based on the results of the Coastal Resource Management (CRM) survey in March 2002, the northeast monsoon season is from October to May while the southeast monsoon (habagat) starts in June and ends in September.
Rivers and River Basins Based on the Water Supply, Sanitation and Sewerage Sector Master Plan (W4SMP) for Bohol, the Municipality of Jagna has several short rivers and creeks. The rivers along coastal area, which all have parallel course have their headwaters in the elevated terrain in the southern lower part of the municipality and it discharges over a short distance into the Mindanao Sea. Other rivers have their headwaters in mountainous portion in northern part of the municipality, flowing towards west and southwest of Garcia-Hernandez (within Manaba River Basin) and towards northwest in Sierra Bullones (within Inabanga River Basin and towards south and southeast in Jagna (within Alejawan River Basin). The Alejawan River is the longest river in Jagna which has headwaters in the inland mountainous portion and flows to the eastern part and drain directly to Mindanao Sea. It is further mentioned that the municipality is located within the three (3) major rivers in Bohol: 1) Alejawan River is 69.28 square kilometers or 39% of the total length of the river basin; 2) Manaba River is 12.52 square kilometers or 13% of the total length of the river basin and; 3) Inabanga River is 11.77 square kilometers or 1.89% of the total river basin. The river network system is moderately developed in the coastal area and well developed in the central portion of the town. But, in the northern inland mountainous range, the river network system is poorly developed which indicates that in the northern upland part of the municipality, most of the runoff can infiltrate into underground and form aquifers while in the central and coastal portion the water upstream is drained into the rivers and transported into the sea. The surface water runoff in the 3 major river basin in Alejawan, Manaba and Inabanga is (estimated to 792mm/yr/sq.m; 906mm/yr/sq.m; and 728mm/yr/sq.m respectively) within the municipal area is estimated to 204,854 cubic meter per day on the average which is sufficient to cover the projected water demand of 9,925 cum/day for the irrigation. Water Resources. The Municipal Government of Jagna is also conserving and protecting the abundant water resources of the municipality. This prompted the LGU to enact the following: the Environment Code, the Coastal Resource Management Code, the Local Fishery Code and the Marine Protected Area Plans. Fish wardens and Bantay Dagat Task Forces have been organized and deputized for the enforcement of these codes. Certainly, enactment and implementation of these codes attributed to the garnering of Jagna of the award as Best LGU on SWM Enforcement and Implementation and it becoming an appropriate learning site on SWM implementation in the province. Table 3: Existing Surface Water Municipality of Jagna

Volume 1 – Land Use Plan of Jagna 2011-2020 Page - 16
SURFACE WATER LOCATION CLASSIFICATION
Alejawan River Boundary of Jagna and Duero Public Water
Balili Spring Balili Public Water
Kinahugan Cabungaan Public Water
Lonoy Spring Lonoy Public Water
Odiong Odiong Public Water
Lonoy Creek Lonoy Public Water
Source: Municipal Engineer's Office LGU Jagna 2007
Surface water in Lonoy is one of the major water sources of the town proper. The Tinubdan Spring in Lonoy is the main source of potable water drawn by gravity down to the water reservoirs located in Barangay Canukso, Cambugason and in Tejero. Other use of surface water is for the irrigation of the rice fields and farms in the barangay. The municipality may experience water scarcity especially during summer time or in season where there were only few rains. During this time there is a schedule of water service delivery in some areas like Canjulao and Can-upao. The water system uses chlorine to purify water in the absence of filtration process to make it potable. Due to population and economic growth there is a need to protect and conserve the water resources.
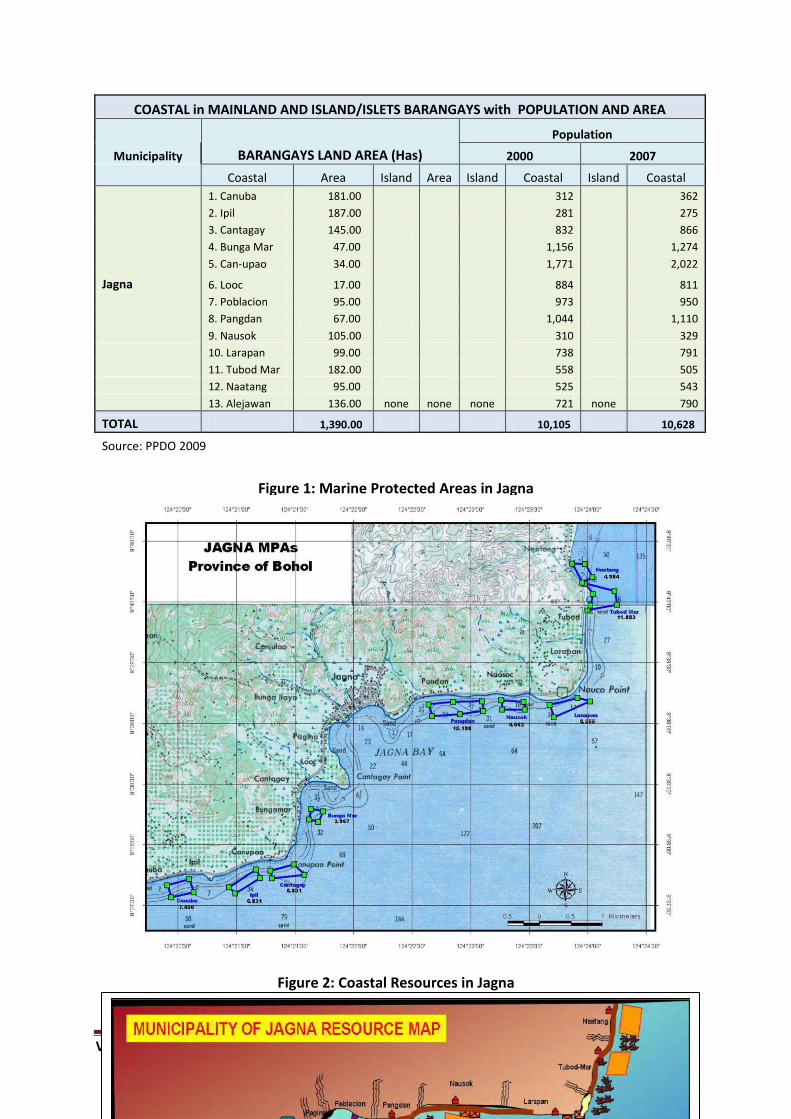
Coastal Resources. The Municipality of Jagna has a total of thirteen (13) coastal barangays with a coastline of 14 kilometers stretching from Barangay Can-uba to barangay Alejawan with rich coastal resources, mangroves, sea grasses, corals and beaches. It has a population of 10,628 or roughly 33% of the total population in the town living in the coastal zone as shown in Table Table 4. Among the known beaches of Jagna are Can-uba Beach, Bunga Mar Beach, Pangdan’s Paseo del Mar, Delilah’s Rock Resort, Batong-buhay Can-upao Beach and Alejawan Beach. Record shows that the municipality has 146 fish species belonging to 27 families, of which 2.83% are target fish species while 96.78% are non-target species. The target fishes are those mostly favored by fishers either for food of their own or for the market. The non-target fishes are those which are not targeted for food because of its small size, but sometimes targeted for aquarium fish trade for export due to colourful appearance. Damselfishes of family Pomacentridae and anthias of Anthiinae are the non-target species abundant in the area. Sea urchins (tujom) and sea stars, different species of oysters, crown of fish sea star, sea cucumbers and giant clams are among the invertebrates thriving in the area.
Marine Protected Areas. The municipality had established nine (9) marine protected sanctuaries in coastal barangays of Can-uba, Ipil, Cantagay, Bunga Mar, Pangdan, Nausok, Tubod-Mar, Larapan and Naatang. The Coastal Law Enforcement Council is now operational in the protection and management of the coastal resources in the municipality. Bantay Dagat Task Force and Fish Wardens are now operating in the coastal areas of the town, to apprehend illegal practices of the fisherfolks. They are supported with the units seaborne patrol facilities. Table 4: Coastal Profile Municipality of Jagna
Volume 1 – Land Use Plan of Jagna 2011-2020 Page - 17
COASTAL in MAINLAND AND ISLAND/ISLETS BARANGAYS with POPULATION AND AREA
BARANGAYS LAND AREA (Has)
Population
Municipality 2000 2007
Coastal Area Island Area Island Coastal Island Coastal
1. Canuba 181.00 312 362
2. Ipil 187.00 281 275
3. Cantagay 145.00 832 866
4. Bunga Mar 47.00 1,156 1,274
5. Can-upao 34.00 1,771 2,022
Jagna 6. Looc 17.00 884 811
7. Poblacion 95.00 973 950
8. Pangdan 67.00 1,044 1,110
9. Nausok 105.00 310 329
10. Larapan 99.00 738 791
11. Tubod Mar 182.00 558 505
12. Naatang 95.00 525 543
13. Alejawan 136.00 none none none 721 none 790
TOTAL 1,390.00 10,105 10,628
Source: PPDO 2009
Figure 1: Marine Protected Areas in Jagna
Figure 2: Coastal Resources in Jagna

Volume 1 – Land Use Plan of Jagna 2011-2020 Page - 18
Biological Resources Mangroves. Naturally grown mangroves of 400 stands of Bakhaw (Rhizophora sp.) and 30 trunks of Pagatpat (Sonneratia alba) exist only along the coastline of Barangay Can-upao. Assessment results show that majority (70%) of the Bakhaw species are classified matured while the pagatpat species has more or less equal percentage of young and mature trees. Seagrass. Participatory coastal resource assessment results conducted by BEMO and CRMP TWG in April 2002 show that there are six (6) species of seagrasses in the coast of Jagna. Barangays Can-uba and Naatang have substantial seagrass cover as well as Barangay Ipil, Can-upao and Pangdan. These seagrasses grow mostly on rocks and rocky surfaces. Estuaries. The municipality has five major estuaries. These are located in Barangays Alejawan, Pangdan, in barangay-boundaries of Pagina-Looc and Pagina-Poblacion, and in barangay Can-upao. Secondary small estuaries also exist in Barangays Poblacion, Larapan, Looc, Can-uba, Can-upao and Naatang.
Mineral Resources. The municipality of Jagna has rich potential sources in limestone deposit, a very important component for cement production, all of these areas are outside the timberland or forestland area. The most part of the municipality is covered by Sierra Bullones bedrock formation, which is capped by massive limestone strongly correlating with the barili formation of South Central Cebu. In fact in previous years Barangay Malbog used to engage in quarrying of limestone for hollow block component production but due to the existing provincial law that prohibits any form of quarrying, the said practice has been stopped. Quarry of limestone in the area of Malbog and Laca generates income for the locality from the permit issued from the provincial government, as mandated by the Local Government Code there will be share of 30% for the municipality and 40% for the barangay. The lot owners and the local people had benefited from this activity e.g. employment and

Volume 1 – Land Use Plan of Jagna 2011-2020 Page - 19
among others. Another quarry site is located in barangay Boctol where serpentine mineral is extracted and mainly used by the Department of Public Works and Highway for the maintenance of roads.
Nickel, a hard malleable silvery metallic element that is resistant to corrosion and used in alloys is also found in the municipality. Sand and gravel operation is devolved to the LGU per DAO-30, series of 1993. With these resources the local government unit of Jagna has an opportunity to increase revenue sources, provide livelihood and increase income of the people. Table 5 below shows the list of permittees with corresponding type of mineral extraction in the area. Based on the assessment there are potential sources for mining in the municipality of Jagna. They are located in barangays Laca, Cantoyoc and Boyog which are outside the watershed areas with an estimated area of 200 hectares Table 5: Inventory of Existing Mineral Resources Municipality of Jagna
Name of Permittee
Mineral Location Areas Duration of Permit Remarks Start End
Sofronio Abrea Limestone Malbog 0.96 11-05-04 01-05-05 Expired
Domingo Chua Limestone Malbog 3.40 Expired
Rustico Virtudazo Limestone Laca 0.60 08-22-05 08-22-06 Expired
Isidro Sajulga Limestone Malbog 1.40 02-13-06 02-13-07 Expired
Manuelito Varquez Limestone Malbog 1.84 08-08-07 10-06-07 Expired
Source: Bohol Environment Management Office 2008
Land Use Potential
The Municipality of Jagna has a total land area of 12,063 hectares, which constitutes 2.93% of the total land area of the province. It is generally classified into two: 1) alienable and disposable land is 10,200 hectares or 85 percent of the municipal area, and 2) timberland or forestland is 1,863 hectares or 15 percent of the total land area. However, the said existing land area used in planning is consistent with the NAMRIA, Land Management Bureau and still subject to change if the municipality has already approved its cadastral survey. The protection forests in the municipality are the areas declared as National Integrated Protected Areas System (NIPAS Act 7586) under Presidential Proclamation No. 881 otherwise known as Alejawan-Cansuhay-Anibongan Watershed Forest Reserve (ACARWFR). The areas are situated in barangays Odiong, as National Park; Boctol, as Natural Monument; Mayana, as Wildlife Sanctuary; and Lonoy, as Strict Nature Reserve which comprises a total area of 1,863 hectares (please refer to Table 6). All of the forestland areas are under the jurisdiction of DENR, CENRO Tagbilaran. The enactment of the Municipal Environment Code of Jagna had shown a tangible result in safeguarding and protecting the municipal physical and natural resource-based assets which is the key links to poverty reduction and good environmental governance. Table 6: General Land Classification Municipality of Jagna

Volume 1 – Land Use Plan of Jagna 2011-2020 Page - 20
Land Classification Location Area (has) % Total
Alienable and Disposable(A & D) all barangays 10,200 85%
Timberland or Forestland Presidential Proclamation 881
dated March 20, 1992 as ACARWFR
Lonoy, Odiong Boctol, Mayana
1,863
15%
T o t a l 12,063 100%
Source: DENR Land Classification 2007 Development Constrained Areas Hazard and Disaster risk Areas Based on the rapid and community assessment conducted by PHIVOLCs and OCD under the READY project in February 2007, the municipality of Jagna is susceptible to some disaster and hazards risk. Among them are flooding, rain-induced landslide, tsumani, liquefaction and storm surges as shown in Table 7 illustrates the areas vulnerable to hazard and disaster risk.
Table 7: Natural Hazards/Disaster Prone Areas Municipality of Jagna
Type of Natural Hazards
Location Remarks
1. Flood prone Alejawan, Bunga Mar, Cabungaan, Can-upao, Looc, Naatang, Pagina, Poblacion, Tejero
2. Rain-Induced Landslide
Faraon, Bunga Ilaya, Canjulao, Tejero, Pangdan, Cambugason, Naatang, Alejawan, Can-ipol, Cabungaan, Laca, Balili, Lonoy Tubod Monte, Cantuyoc, Ipil, Boctol, Malbog, Odiong, Nausok, Calabacita, Mayana
Highly susceptible to rain-induced landslide
Bunga Ilaya, Pangdan, Alejawan, Cambugason, Cabungaan
Prone to landslide accumulation
3. Tsunami Can-uba, Ipil, Cantagay, Bunga Mar, Bunga Ilaya, Can-upao, Looc, Poblacion, Pagina, Tejero, Pangdan, Alejawan, Naatang
4. Liquefaction Can-uba, Ipil, Cantagay, Bunga Mar, Bunga Ilaya, Can-upao, Looc, Poblacion, Pagina, Tejero, Cambugason, Alejawan, Naatang, Pangdan
Highly susceptible to liquefaction
5. Storm Surges Tejero, Poblacion, Pagina, Looc Inundations of 4-12 meters
Poblacion, Pagina, Looc, Can-upao, Bunga Mar, Cantagay, Ipil
Inundations of 1-4 meters
Source: Administrative, NAMRIA, PHIVOLCS-DOST, OCD (READY Project)
Flood Prone Areas. Most flooding in the municipality of Jagna occurs on floodplains. These are natural water storage areas containing rivers or creeks that flow continuously or intermittently. Historically, the easy access to water the easy access to water and the rich

Volume 1 – Land Use Plan of Jagna 2011-2020 Page - 21
diversity and fertility of the flood plains have always attracted by human settlements. Hence, with the ever-increasing human intervention in the upstream catchments, the downstream consequences and risks increase. It is observed that the flood prone areas with state height of floods that range from 0.4 meters to 1.2 meters high during heavy rains, more so during high tides, are in the barangays of Looc (0.4m), Tejero (0.5m), Pagina (1m), Pondol, Poblacion (1m) and Bunga Mar (1.2m) see Table 8. Since flooding is a natural hazard and it is affected annually by intensive tropical weather patterns which resulted to a very significant financial cost and personal hardship within the affected areas in the municipality. It is also often exacerbated by ignorant and negligent human intervention in the environment. Based on this information the LGU of Jagna can make better choices about residential environment and business investment. Therefore land use planning is recognized as being the best means of avoiding or minimizing future flooding problems that stress risk to life and property damage. Strict and uncompromising enforcement of strategies and controls to counter flooding is very vital.
Table 8: Frequency and Occurrence of Flooding
Municipality of Jagna
Barangay
Frequency Remarks (state height of floods
and other relevant information)
Annually Every 5 years
Every 10 years
Every 100 years
Alejawan 0.60 m
Bunga Mar 0.25 m
Cabungaan 0.50 m
Can-upao 0.50 m
Looc 0.40 m
Naatang 0.60 m
Pagina 0.50 m
Poblacion 0.50 m
Tejero 0.25 m
Source: MPDC LGU Jagna 2007
Results of MGB Assessment to Flooding
Based on result of the field geo-hazard survey conducted by the Mines and Geosciences Bureau (MGB-Region VII) in October 2-13, 2006, the Municipality of Jagna is vulnerable to flooding as shown in Table 9. There are eight (8) barangays that are susceptible to flooding which describes as to the type and the cause of the hazard. Table 9: Results of assessment of the ten (10) Barangays Susceptible to Flooding
Barangay Type of
Flooding Cause of
Flooding/Remarks Recommendations
Bunga Mar Sheet flooding and riverine flooding
Poor drainage, water, coming from Bgys. BungaIlaya and Laca
Provide adequate and appropriate drainage facilities, regulate/control development of upstream/catchment area
Poblacion Riverine Flooding common during Provide adequate and

Volume 1 – Land Use Plan of Jagna 2011-2020 Page - 22
Flooding heavy rains aggravated during high tide when floodwaters are blocked by tidal waters, poor drainage system.
appropriate drainage facilities, regulate/control development of upstream/catchment area
Tejero Sheet and Riverine Flooding
Flooding common during heavy rains up to 0.5 meter depth, aggravated during high tide when floodwaters are blocked by tidal waters, poor drainage system.
Provide adequate and appropriate drainage facilities, regulate/control development of upstream/catchment area
Looc Sheet Flooding
Local flooding coming from rice paddies
Provision of adequate drainage facilities
Pangdan Sheet and Riverine Flooding
Local flooding at Purok 7, aggravated during high tide, poor drainage system
Provision of adequate drainage facilities
Kinagbaan Sheet and Riverine Flooding
Flooding at creek bounding with Bgy. Bunga Ilaya due to debris clogging the small culvert.
Change to bigger concrete box culvert
Cambugason Riverine Flooding
Flood prone area near banks of Alejawan river, 3 houses located near the river bank
Constant communication and landslide updates with upland Barangay Mayana. Evacuation of residents with houses near banks of Alejawan River during heavy and continuous rains
Lonoy Riverine Flooding
Flood prone area near banks of Alejawan river, about 10 houses located near the river bank
Constant communication and landslide updates with upland Barangay Mayana. Evacuation of residents with houses near banks of Alejawan River during heavy and continuous rains
Alejawan Riverine Flooding
Flood prone area near banks of Alejawan river. Flooding in the low-lying area near highway due to newly elevated highway with small existing circular culverts
Constant communication and landslide updates with upland Barangay Mayana. Evacuation of residents with houses near banks of Alejawan River during heavy and continuous rains. Change to bigger culverts near highway to prevent flooding.
Landslide Areas. The Mines and Geosciences Bureau (MGB-Region VII) had conducted a rapid field geo-hazard assessment in the forty-eight (48) municipalities in the Province of Bohol Island. In October 2-13, 2006, the rapid field assessment in the municipality of Jagna was conducted which focused on barangays that are located on foot slopes, mid slopes and

Volume 1 – Land Use Plan of Jagna 2011-2020 Page - 23
mountain ridges. Each barangay was rated on the following scale: a) low, b) moderate and c) high landslide susceptibility as describe on Table 10.
Table 10: Results of Assessments of the Thirty-Three (33) Barangays Municipality of Jagna, Bohol
Barangay Landslide
Susceptibility Rating
Recommendations
Mayana High
Monitor progress of mass movement (e.g landslide, tension cracks),develop an early warning device system, identify evacuation site, observe for rapid increase/decrease in Bangwalog/Alejawan river water levels,possibly accompanied by increased turbidity (soil content), observed saturated ground or seeps in areas that are not typically wet and constant communication and updates with nearby downslope barangays.
Mayana High
Regular monitoring of progress of mass movement (landslide and tension cracks) especially during heavy and continuous rains at Bgy. Malbog proper, which have affected about 24 houses. Identify evacuation site if situation becomes serious.
Calabacita High
Monitor progress of mass movement (e.g. landslide, tension cracks) at Sitio Katiwihan that has already affected 5 houses and at Sitios Ilawod and Napo. Residents are advised to vacate the affected areas during heavy and continuous rains.
Tubod Monte
High
Monitor progress of mass movement (e.g. landslide, tension cracks) at Sitio Kago-ko, Purok 2 and at Purok 1, develop an early warning device system and identify evacuation site.
Boctol High
Monitor progress of mass movement (e.g. landslide, tension cracks)near the boundaries of Bgy. Boctol and Mayana, within the limestone cliffs and forest zone, develop an early warning device system.
Balili Moderate
Observe for presence of mass movement (e.g. landslide, tension cracks), observe for saturated ground or seeps in areas that are not typically wet and constant communication and updates with nearby barangays.
Buyog Moderate
Observe for presence of mass movement (e.g. landslide, tension cracks), observe for saturated ground or seeps in areas that are not typically wet and constant communication and updates with nearby barangays.
Cantuyoc Moderate Monitor progress of mass movement (e.g. landslide, tension cracks) at road cut at Sitio Taytay especially during heavy and continuous rains.
Odiong Moderate Observe for presence of mass movement (e.g landslide, tension cracks), observe for saturated ground or seeps in

Volume 1 – Land Use Plan of Jagna 2011-2020 Page - 24
areas that are not typically wet and constant communication and updated with nearby barangays. Constant declogging of debris of spillway to prevent flooding.
Alejawan Moderate
Monitor progress of mass movement (e.g. landslide, tension cracks) at roadcut near boundary with Bgy. Cambugason. Observe for rapid increase/decrease in water levels of Alejawan River, possibly accompanied by increased turbidity (soil content). Constant communication and landslide updates with upland Barangay Mayana.
Canjulao Moderate
Monitor progress of mass movement (e.g. landslide, tension cracks) of inactive landslide caused by quarry operation at Purok 3. Observe presence of mass movement (e.g. landslide, tension cracks)
Kinagbaan Moderate Monitor progress of inactive landslide along barangay road at Sitio Tinakbasan. Observe for presence of mass movement (e.g landslide, tension cracks)
Bunga Mar Low Observe for presence of mass movements (e.g. landslide, tension cracks)
Lonoy Low
Observe for presence of mass movements (e.g. landslide, tension cracks) Observe for rapid increase/decrease in water levels of Alejawan River, possibly accompanied by increased turbidity (soil content). Constant communication and landslide updates with upland Barangay Mayana.
Cambugason Low
Observe for presence of mass movements (e.g. landslide, tension cracks) Observe for rapid increase/decrease in water levels of Alejawan River, possibly accompanied by increased turbidity (soil content). Constant communication and landslide updates with upland Barangay Mayana
Can-ipol Low Observe for presence of mass movements (e.g. landslide, tension cracks)
Cabungaan Low
Observe for presence of mass movements (e.g. landslide, tension cracks) Observe for rapid increase/decrease in water levels of Alejawan River, possibly accompanied by increased turbidity (soil content). Constant communication and landslide updates with upland Barangay Mayana.
Laca Low Observe for presence of mass movements (e.g. landslide, tension cracks)
Bunga Ilaya Low Observe for presence of mass movements (e.g. landslide, tension cracks)
Naatang Low Observe for presence of mass movements (e.g. landslide, tension cracks)
Tubod Mar Low Observe for presence of mass movements

Volume 1 – Land Use Plan of Jagna 2011-2020 Page - 25
(e.g. landslide, tension cracks)
Larapan Low Observe for presence of mass movements (e.g. landslide, tension cracks)
Nausok Low Observe for presence of mass movements (e.g. landslide, tension cracks)
Pangdan Low Observe for presence of mass movements (e.g. landslide, tension cracks)
Tejero Low Observe for presence of mass movements (e.g. landslide, tension cracks)
Poblacion Low Observe for presence of mass movements (e.g. landslide, tension cracks)
Looc Low Observe for presence of mass movements (e.g. landslide, tension cracks)
Pagina Low Observe for presence of mass movements (e.g. landslide, tension cracks)
Can-upao Low Observe for presence of mass movements (e.g. landslide, tension cracks)
Cantagay Low Observe for presence of mass movements (e.g. landslide, tension cracks)
Ipil Low Observe for presence of mass movements (e.g. landslide, tension cracks)
Faraon Low Observe for presence of mass movements (e.g. landslide, tension cracks)
Can-uba Low Observe for presence of mass movements (e.g. landslide, tension cracks)
Source: MBG-7 Geo-hazard Assessment 2007
Tsunami and Liquefaction Prone Areas. As expected thirteen (13) barangays located in coastal zone are exposed to tsunami. These are located in Can-uba, Ipil, Cantagay, Bunga Mar, Bunga Ilaya, Can-upao, Looc, Poblacion (Pondol), Tejero, Pangdan, Alejawan and Naatang.
Storm Surges. There are eight (8) barangays in Jagna that are susceptible to storm surges. Barangay Tejero, Poblacion (Pondol), Pagina and Looc has an inundation ranging from 4-12 meters and barangay Can-upao, Bunga Mar, Cantagay and Ipil has 1-4 meters inundations.
Fault Line Zone. Minor and major fault lines are evident on the island as shown by terraced
encarpments occurring in its southern and central parts. Earthquakes have been felt in the
municipality but only an average of one perceptible shock is reported each year.
Figure 3: Tsunami Hazard Map in Jagna

Volume 1 – Land Use Plan of Jagna 2011-2020 Page - 26
Figure 4: Liquefaction Hazard Map in Jagna
Figure 5: Storm Surge Hazard Map in Jagna

Volume 1 – Land Use Plan of Jagna 2011-2020 Page - 27
Figure 6: Ground Shaking Hazard Map in Jagna
Climate Pattern. Figure below shows an average of 20 typhoons hit the Philippines every year, based on official statistics on the frequency of typhoons (source: PAG-ASA, DOST).

Volume 1 – Land Use Plan of Jagna 2011-2020 Page - 28
There are two major seasons in the Philippines: (1) the rainy season, from June to November; and (2) the dry season, from December to May. According to PAG-ASA, the dry season may be subdivided further into (a) the cool dry season, from December to February; and (b) the hot dry season, from March to May. Typhoons usually happen during the rainy season. In 2007, for instance, almost all of the typhoons (except 1) happened between July and November. It is then recommended for farmers to insure their crops regularly given the unforecast weather change.
Figure 7: Frequency of Cyclone in Jagna
Local Climate Change
The climate is changing. The earth is warming up, and there is now overwhelming scientific consensus that it is happening, and that it is human-induced. With global warming on the increase and species and their habitats on the decrease, chances for ecosystems to adapt naturally are diminishing. In Jagna, people are now aware of the change in temperature, like most of the farmers commenting that the rainy or dry seasons are now difficult to predict. Farm production may vary and there will also be a change of output potentials. Even to our fishermen, they also attest that the climate change affects their catches and the common fish catch in Jagna differs in season. Awareness of the concept of climate change for agriculture is now integrated and being considered in their production. Rising temperature, erratic weather conditions, frequent occurrence of landslides and flash floods are just few of the concrete evidence that climate change is unfolding and happening. Impacts of this change have affected our forestry, biodiversity, water, agricultural and fishery resources and even cultural assets. It has a wide-range adverse impact on human health with significant loss of life. Thus, for sustainability, these resources should be managed to cushion the negative effects brought about by the said climate change. There is really a need to Act Locally to solve the global problem on climate change by finding solutions at all levels (individual, community, local and national government, private sector, non-government organizations and among others).
POPULATION

Volume 1 – Land Use Plan of Jagna 2011-2020 Page - 29
Population Size. The total population of Jagna based on the 2007 Census of Population and Housing, was 32,034, an increase of 1,391 over the 2000 census results (Table 11). From only 13,123 in 1903, the population had almost doubled in the 1990’s, after 88 years. During most of its history, Jagna's population has increased slowly. The highest increase was recorded during the 1970 Census with an annual population growth rate of 2.22 percent. At the present rate of 0.61 percent, it will take more than a hundred years before it doubles its current population.
Table 11: HISTORICAL GROWTH OF POPULATION Census Years 1903-2007
Year Population Population Change Annual Growth
Rate Difference Percent
Aug 1, 2007 32,034 1,391 4.54% 0.61%
May 1, 2000 30,643 1,289 4.39% 0.82%
Sept 1, 1995 29,354 3,192 12.20% 1.60%
May 1, 1990 26,162 2,668 11.36% 1.49%
May 1, 1980 23,494 1,599 7.30% 0.98%
May 1, 1975 21,895 2,277 11.61% 1.53%
May 6, 1970 19,618 2,886 17.25% 2.22%
Feb 15, 1960 16,732 493 3.04% 0.41%
Oct 1, 1948 16,239 868 5.65% 0.76%
Jan 1, 1939 15,371 1,161 8.17% 1.09%
Dec 31, 1918 14,210 1,087 8.28% 1.10%
Mar 2, 1903 13,123
2000-2007 0.61
1995-2000 0.92
1995-2007 0.74
Source: Census of Population, National Statistics Office (NSO)
Household Population and Growth Rate by Barangay. Population growth has an effect in every facet of life, from settlement patterns to the price of basic commodities. As a result, it will have an impact in the design of policies, plans and programs that respond to the needs of the people. In 2007, the annual population growth rate (APGR) of the Municipality of Jagna was only 0.61% for the period 2000 to 2007. Its population is projected to reach 34,101 in 2018, assuming current APGR (Table 8). Jagna’s Migration Rate is computed at 0.52 percent, translated to 169 persons between the same period or about 24 persons annually. Jagna’s population was growing at only 0.087 percent through natural increase. Among the thirty-three (33) barangays of Jagna Municipality, Brgy. Canjulao had the biggest population in 2007, but Brgy. Cambugason was the fastest growing in terms of population growth with an APGR of 2.34 percent between the period 2000-2007. There were four (4) other barangays having APGR greater than 2 percent namely, Brgys. Tejero, Tubod Monte, Can-uba and Malbog while twelve (12) other barangays exhibited APGR greater than one (1) percent. This includes the

Volume 1 – Land Use Plan of Jagna 2011-2020 Page - 30
barangays of Bunga Ilaya, Can-upao, Buyog, Bunga Mar, Can-ipol, Alejawan and Canjulao. Table 12: TOTAL & HOUSEHOLD POPULATION, NUMBER OF HOUSEHOLDS & ANNUAL
POPULATION GROWTH RATE (APGR) BY BARANGAY, 2000 & 2007
Barangay Total Population Household 1 APGR 2
2000-2007 2007 2000 Population Number
A. Urban 11,560 10,785 10,773 2,067
1. Bunga Mar 1,274 1,156 1,156 215 1.35%
2. Canjulao 2,634 2,423 2,423 461 1.16%
3. Can-upao 2,022 1,771 1,771 333 1.84%
4. Looc 811 884 884 173 -1.18%
5. Pagina 1,330 1,313 1,313 233 0.18%
6. Pangdan 1,110 1,044 1,044 213 0.85%
7. Poblacion 950 973 973 195 -0.33%
8. Tejero 1,429 1,221 1,209 244 2.19%
B. Rural 20,474 19,858 19,846 3,890
1. Alejawan 790 721 721 155 1.27%
2. Balili 1,223 1,268 1,268 246 -0.50%
3. Boctol 1,073 1,114 1,114 219 -0.52%
4. Bunga Ilaya 833 726 726 148 1.91%
5. Buyog 325 289 289 63 1.63%
6. Cabungaan 1,178 1,116 1,116 193 0.75%
7. Calabacita 1,506 1,439 1,439 267 0.63%
8. Cambugason 899 760 760 161 2.34%
9. Can-ipol 420 382 382 72 1.32%
10. Cantagay 866 832 832 159 0.55%
11. Cantuyoc 826 805 805 164 0.36%
12. Can-uba 362 312 312 72 2.07%
13. Faraon 525 489 489 104 0.98%
14. Ipil 275 281 281 66 -0.30%
15. Kinagbaan 414 408 408 77 0.20%
16. Laca 248 340 340 59 -4.26%
17. Larapan 791 738 738 127 0.96%
18. Lonoy 1,225 1,266 1,266 236 -0.45%
19. Malbog 1,018 880 880 186 2.03%
20. Mayana 1,861 2,074 2,062 374 -1.48%
21. Naatang 543 525 525 106 0.47%
22. Nausok 329 310 310 63 0.82%
23. Odiong 1,057 1,038 1,038 216 0.25%
24. Tubod Mar 505 558 558 117 -1.37%
25. Tubod Monte 1,382 1,187 1,187 240 2.12%
Total 32,034 30,643 30,619 5,957 Source: Census of Population, National Statistics Office (NSO)

Volume 1 – Land Use Plan of Jagna 2011-2020 Page - 31
Sex Composition. Age and sex are the most basic characteristics of population with every population exhibiting different age and sex composition. This can have a considerable impact on the population’s social and economic situation, both present and future. The sex composition of a locality’s population affects the incidence of births, deaths and marriages. These will have implications on spatial mobility and work participation as well as the occupational structure of the locality. Sex Ratio. The 2000 population census data for the municipality of Jagna reveal that there were 15,605 males and 15,038 females. Per age groupings, there were more males than females in the age group 0 to 59 years while females dominated the rest of the age groups (Table 13). The sex ratio at birth in Jagna Municipality in the 2000 census at 104 males for every 100 females was almost the same as the 1995 figure of 101.4. Brgy. Can-uba has the highest predominance of males among its population compared to the other barangays with a sex ratio of 149.6 males for every 100 females while Brgy. Can-ipol’s women outnumber the men in their population at 8 men for every 10 women, making it the most predominantly women barangay in Jagna.
Table 13: AGE DISTRIBUTION OF POPULATION BY SEX, 2000
Source: 2000 Population Census, National Statistics Office
Age Group Age Distribution
(%) Both Sexes Male Female
All Ages 30,643 15,605 15,038
Under 1 2.26% 692 375 317
1 - 4 8.79% 2,692 1,427 1,265
5 - 9 11.24% 3,444 1,799 1,645
10 - 14 11.11% 3,405 1,703 1,702
15 - 19 9.95% 3,050 1,642 1,408
20 - 24 8.72% 2,672 1,391 1,281
25 - 29 7.65% 2,345 1,193 1,152
30 - 34 6.96% 2,134 1,067 1,067
35 - 39 5.87% 1,798 908 890
40 - 44 5.20% 1,592 846 746
45 - 49 4.24% 1,298 665 633
50 - 54 3.98% 1,220 612 608
55 - 59 3.78% 1,158 565 593
60 - 64 3.30% 1,012 478 534
65 - 69 2.52% 772 359 413
70 - 74 1.95% 598 260 338
75 - 79 1.23% 376 167 209
80 & over 1.26% 385 148 237
0-17 39.46% 12,093 6,285 5,808
18 & 0ver 60.54% 18,550 9,320 9,230
15-64 59.65% 18,279 9,367 8,912
Below 15 33.39% 10,233 5,304 4,929
65 & Above 6.95% 2,131 934 1,197
Aged 15-49 47.73% 7,177
Volume 1 – Land Use Plan of Jagna 2011-2020 Page - 32
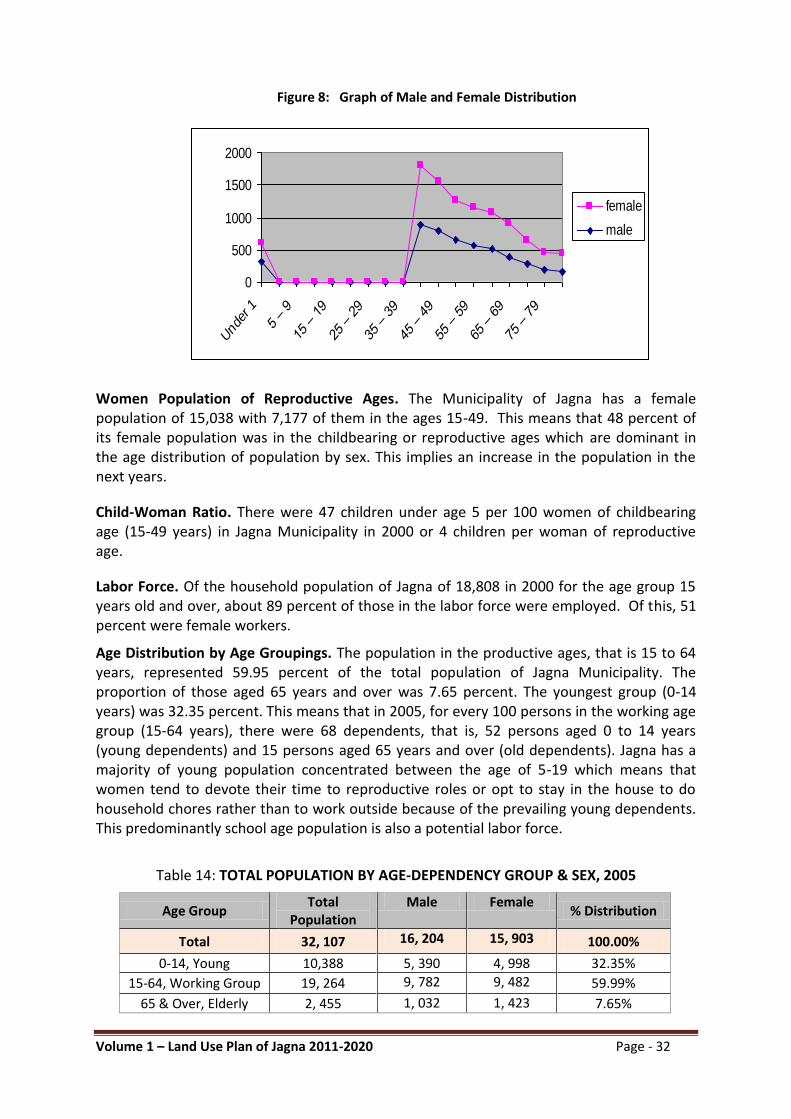
Women Population of Reproductive Ages. The Municipality of Jagna has a female population of 15,038 with 7,177 of them in the ages 15-49. This means that 48 percent of its female population was in the childbearing or reproductive ages which are dominant in the age distribution of population by sex. This implies an increase in the population in the next years.
Child-Woman Ratio. There were 47 children under age 5 per 100 women of childbearing age (15-49 years) in Jagna Municipality in 2000 or 4 children per woman of reproductive age.
Labor Force. Of the household population of Jagna of 18,808 in 2000 for the age group 15 years old and over, about 89 percent of those in the labor force were employed. Of this, 51 percent were female workers.
Age Distribution by Age Groupings. The population in the productive ages, that is 15 to 64 years, represented 59.95 percent of the total population of Jagna Municipality. The proportion of those aged 65 years and over was 7.65 percent. The youngest group (0-14 years) was 32.35 percent. This means that in 2005, for every 100 persons in the working age group (15-64 years), there were 68 dependents, that is, 52 persons aged 0 to 14 years (young dependents) and 15 persons aged 65 years and over (old dependents). Jagna has a majority of young population concentrated between the age of 5-19 which means that women tend to devote their time to reproductive roles or opt to stay in the house to do household chores rather than to work outside because of the prevailing young dependents. This predominantly school age population is also a potential labor force.
Table 14: TOTAL POPULATION BY AGE-DEPENDENCY GROUP & SEX, 2005
Age Group Total
Population Male Female
% Distribution
Total 32, 107 16, 204 15, 903 100.00%
0-14, Young 10,388 5, 390 4, 998 32.35%
15-64, Working Group 19, 264 9, 782 9, 482 59.99%
65 & Over, Elderly 2, 455 1, 032 1, 423 7.65%
0
500
1000
1500
2000
Under 1
5 – 9
15 – 19
25 – 29
35 – 39
45 – 49
55 – 59
65 – 69
75 – 79
female
male
Figure 8: Graph of Male and Female Distribution

Volume 1 – Land Use Plan of Jagna 2011-2020 Page - 33
SPATIAL DISTRIBUTION
Urbanization and Distribution. In 2000, the municipality of Jagna was mainly a rural area with only 56 persons living in the urban area per 100 persons in the rural area. The patterns of and dispersal of population within an area indicate the manner by which the population is distributed.
o Percent Urban. In 2007, Jagna Municipality had an urban population of 11,560 representing 36.09 percent of the total population of the municipality (Table 14). This means that for every 100 residents in Jagna, 36 live in the urban areas. An upward trend is noted in 2007 compared to 2000, implying increasing urbanization of Jagna Municipality. Of the 33 barangays of Jagna Municipality, eight (8) barangays are classified by the Municipality as urban namely, Brgys. Bunga Mar, Canjulao, Can-upao, Looc, Pagina, Pangdan, Poblacion and Tejero occupying a total land area of 553 hectares or 8 percent of total municipal area.
o Percent Rural. Rural population of Jagna Municipality comprises 64 percent of total municipal population (Table 14). Twenty-five (25) of the 33 barangays of the municipality are classified by the Municipality as rural, making it predominantly rural in 2007.
Table 14a: POPULATION DENSITY BY BARANGAY, 2007
Barangay Population,
2007 Percent (%) Population
Area (hectares)
Percent (%) Area
Density (Persons/ hectares)
Jagna 32,034 12,063.0 2.66
Urban 11,560 36.09% 552.86 4.58% 20.9
1. Bunga Mar 1,274 3.98% 47.42 0.39% 26.9
2. Canjulao 2,634 8.22% 125.61 1.04% 21.0
3. Can-upao 2,022 6.31% 63.53 0.53% 31.8
4. Looc 811 2.53% 42.66 0.35% 19.0
5. Pagina 1,330 4.15% 19.48 0.16% 68.3
6. Pangdan 1,110 3.47% 122.67 1.02% 9.0
7. Poblacion 950 2.97% 14.14 0.12% 67.2
8. Tejero 1,429 4.46% 117.35 0.97% 12.2
Barangay Population,
2007 Percent (%) Population
Area (hectares)
Percent (%) Area
Density (Persons/ hectares)
Rural 20,474 63.91% 6,268.45 51.96% 3.27
1. Alejawan 790 2.47% 156.55 1.30% 5.0
2. Balili 1,223 3.82% 1,010.68 8.38% 1.2
3. Boctol 1,073 3.35% 322.95 2.68% 3.3
4. Buyog 325 1.01% 116.40 0.96% 2.8
5. Bunga Ilaya 833 2.60% 357.70 2.97% 2.3

Volume 1 – Land Use Plan of Jagna 2011-2020 Page - 34
6. Cabungaan 1,178 3.68% 188.98 1.57% 6.2
7. Calabacita 1,506 4.70% 580.90 4.82% 2.6
8. Cambugason 899 2.81% 246.12 2.04% 3.7
9. Can-ipol 420 1.31% 70.33 0.58% 6.0
10. Cantagay 866 2.70% 74.48 0.62% 11.6
11. Cantuyoc 826 2.58% 309.63 2.57% 2.7
12. Can-uba 362 1.13% 28.30 0.23% 12.8
13. Faraon 525 1.64% 100.92 0.84% 5.2
14. Ipil 275 0.86% 81.80 0.68% 3.4
15. Kinagbaan 414 1.29% 124.69 1.03% 3.3
16. Laca 248 0.77% 237.92 1.97% 1.0
17. Larapan 791 2.47% 113.98 0.94% 6.9
18. Lonoy 1,225 3.82% 292.69 2.43% 4.2
19. Malbog 1,018 3.18% 311.51 2.58% 3.3
20. Mayana 1,861 5.81% 408.27 3.38% 4.6
21. Naatang 543 1.70% 59.76 0.50% 9.1
22. Nausok 329 1.03% 123.18 1.02% 2.7
23. Odiong 1,057 3.30% 459.86 3.81% 2.3
24. Tubod Mar 505 1.58% 109.02 0.90% 4.6
25. Tubod Monte 1,382 4.31% 381.86 3.17% 3.6
Source of Population Data: National Statistics Office; Source of Land Area Data : DENR
Population Density. Population density indicates the pattern of population distribution which can serve as an indicator of urbanization of an area. The gross population density of Jagna was computed at 3 persons living per hectare but its built-up density was estimated at 4.70 persons per hectare classifying Jagna as a Low Density Area (Table 14). Built-up density is significantly higher in Brgy. Pagina at 68 persons per hectare and Brgy. Poblacion at 67 persons per hectare along with most of the urban barangays of the municipality. Brgy. Buyog is the least densely populated barangay in Jagna. Population density in the urban areas of Jagna are 7 times higher than that of the rural areas at 21 persons per hectare in the urban area and 3 persons per hectare in the rural area.
Percentage of Population by Geographic Classification. Jagna Municipality has twelve (12) coastal barangays, seventeen (17) upland barangays and three (3) lowland barangays. About 35 percent of the population of Jagna is living along the coast while a greater number (51%) are found in the upland area (Table 15). A movement of its population from the upland to the lowland is noted between the period 2000 and 2007.
Table 15: TOTAL POPULATION AND PERCENTAGE BY GEOGRAPHIC DISTRIBUTION
Census of 2000 & 2007: Municipality of JAGNA

Volume 1 – Land Use Plan of Jagna 2011-2020 Page - 35
Geographic Classification Total Population % Population Distribution %
Change Aug. 1, 2007 1-May-00 Aug. 1, 2007 1-May-00
Jagna Municipality 32,034 30,643
Coastal Barangays (Brgys. Alejawan, Cantagay, Canuba, Can-upao, Bunga Mar, Ipil, Naatang, Nausok, Pagina, Pangdan, Poblacion and Tubod Mar)
11,167 10,680 34.86% 34.85% 0.01%
Lowland Barangays (Brgys. Bunga Ilaya, Canjulao and Tejero)
4,896 4,370 15.28% 14.26% 1.02%
Upland Barangays (Brgys. Balili, Boctol, Buyog, Cabungaan, Calabacita, Cambugason, Can-ipol, Cantuyoc, Tubod Monte, Faraon, Odiong, Kinabaan, Laca, Larapan, Lonoy, Malbog and Mayana)
15,971 15,593 49.86% 50.89% -1.03%
Source of Population data: National Statistics Office (NSO)
Population Projections
Population Projection by Barangay. The projected population of Jagna Municipality within the plan period is shown in Table 8 of volume 3 of the sectoral studies. The municipality is projected to increase to 35,304 in 2020, assuming the same growth rate of 0.61 percent. Brgys. Canjulao and Can-upao are still projected to have the biggest population size assuming that no big economic developments will be introduced in the other barangays.
Population Projection by Age Group (Table 9 of volume 3 of the sectoral studies). Per the 2000 Census of Population by the National Statistics Office, the largest share of Jagna’s total population belong to the age group 5-19 years old which is about 32 percent of its total municipal population. These are the school-going age population age-groups of the municipality in which, by 2020, will increase to 11,405 from 9,899.
Population Projection of Potential Labor Force. Given no new major economic activities that will be introduced in the planning period 2010-2020, Jagna’s potential labor force is projected to reach to almost 24 thousand by the end of 2020 (Table 16).
Table 16: PROJECTED LABOR FORCE, 2011-2020 Municipality of JAGNA

Volume 1 – Land Use Plan of Jagna 2011-2020 Page - 36
Year Projected Labor Force*
2000 20,410
2008 21,480
2009 21,627
2010 21,778
2011 21,933
2012 22,092
2013 22,256
2014 22,423
2015 22,594
2016 22,770
2017 22,949
2018 23,133
2019 23,322
2020 23,514 * Projections computed by PPDO based on population data source from NSO Census 2000
Household and Family Characteristics. Households and families are the basic units in which most people live. Trends in the number type, and composition of households are important especially in determining municipal services to be provided.
Growth of Number of Households and Average Household Size. The average annual rate of change in the number of households for the municipality of Jagna was steadily increasing from 1.72 percent (1990 to 1995) to 1.80 percent from 1995 to 2000. However, its average household size1 was nearly the same at an average of 5 persons per household during the same periods. In the 2000 Census, Brgy. Larapan had the largest household size at 5.81 while Brgy. Ipil had the least average household size at 4.26 members per household (Table 17).
Table 17: HOUSEHOLD POPULATION, NUMBER OF HOUSEHOLDS & AVERAGE HOUSEHOLD SIZE BY BARANGAY, 2000
Barangay Households (HH) 2000
Barangay Households (HH) 2000
Population Number Ave.
HH Size Population Number
Ave. HH Size
BOHOL 1,134,733 209,588 5.41 BOHOL 1,134,733 209,588 5.41
Jagna 19,485 3,639 5.35 Jagna 11,134 2,318 4.80
1 Larapan 738 127 5.81 18 Tejero 1,209 244 4.95
2 Cabunga-an 1,116 193 5.78 19 Naatang 525 106 4.95
3 Laca 340 59 5.76 20 Tubod Monte 1,187 240 4.95
1 This ratio estimate is based on the assumption that the total number of household population is evenly distributed among all existing households in the municipality.

Volume 1 – Land Use Plan of Jagna 2011-2020 Page - 37
4 Pagina 1,313 233 5.64 21 Nausok 310 63 4.92
5 Mayana 2,062 374 5.51 22 Cantuyoc 805 164 4.91
6 Calabacita 1,439 267 5.39 23 Buyog 726 148 4.91
7 Bunga Mar 1,156 215 5.38 24 Pangdan 1,044 213 4.90
8 Lonoy 1,266 236 5.36 25 Odiong 1,038 216 4.81
9 Can-upao 1,771 333 5.32 26 Tubod Mar 558 117 4.77
10 Can-ipol 382 72 5.31 27 Malbog 880 186 4.73
11 Kinagbaan 408 77 5.30 28 Cambugason 760 161 4.72
12 Canjulao 2,423 461 5.26 29 Faraon 489 104 4.70
13 Cantagay 832 159 5.23 30 Alejawan 721 155 4.65
14 Balili 1,268 246 5.15 31 Bunga Ilaya 289 63 4.59
15 Looc 884 173 5.11 32 Can-uba 312 72 4.33
16 Boctol 1,114 219 5.09 33 Ipil 281 66 4.26
17 Poblacion (Pondol)
973 195 4.99 Source: 2000 Census of Population and Housing, NSO
Percentage of Household by Sex of Household Head. In the census of 2000, majority of Jagna’s households were headed by males with only 16 percent of its households headed by females (Table 18). Most of these household heads belonged to the age groups 30-59 for males and 40-79 for females.
Table 18: NUMBER OF HOUSEHOLDS BY AGE GROUP, SEX OF HOUSEHOLD HEAD
AND HOUSEHOLD SIZE, 2000
Age Group Number of Households
Household Size Average Household
Size 1 2 3 4 5 6 7 8 & Over
Both Sexes 5,957 334 618 741 940 896 784 622 1,022 5.14
Below 20 12 1 4 2 1 0 2 1 1 4.00
20 - 29 392 15 40 86 114 66 44 18 9 4.11
30 - 39 1,205 37 75 147 219 224 200 155 148 5.17
40 - 49 1,326 50 60 108 197 222 217 165 307 5.82
50 - 59 1,234 68 107 142 173 178 159 129 278 5.44
60 - 69 1,015 68 155 142 144 131 99 97 179 4.96
70 - 79 595 72 123 90 70 62 51 45 82 4.33
80 & over 178 23 54 24 22 13 12 12 18 3.82
Male 4,986 178 446 588 811 787 709 562 905 5.34
Below 20 8 3 1 2 1 1 4.88
20 - 29 373 14 38 80 109 64 43 17 8 4.12
30 - 39 1,148 33 63 135 212 214 197 149 145 5.23
40 - 49 1,218 35 50 96 173 207 205 162 290 5.94
50 - 59 1,016 41 74 105 146 148 139 112 251 5.67
60 - 69 753 29 100 106 100 108 79 83 148 5.29

Volume 1 – Land Use Plan of Jagna 2011-2020 Page - 38
70 - 79 370 18 83 56 58 37 36 30 52 4.56
80 & over 100 8 35 10 12 9 8 8 10 3.99
Female 971 156 172 153 129 109 75 60 117 4.09
Below 20 4 1 1 2 2.25
20 - 29 19 1 2 6 5 2 1 1 1 3.95 30 - 39 57 4 12 12 7 10 3 6 3 3.98
40 - 49 108 15 10 12 24 15 12 3 17 4.44
50 - 59 218 27 33 37 27 30 20 17 27 4.36 60 - 69 262 39 55 36 44 23 20 14 31 4.03
70 - 79 225 54 40 34 12 25 15 15 30 3.96
80 & over 78 15 19 14 10 4 4 4 8 3.60
Source: 2000 Census of Population and Housing, NSO
Households Reporting Land Ownership2. Among the 10 percent sampled households in Jagna, about 40 percent of these households owned an agricultural land of which 2 percent was acquired as a beneficiary of CARP/Agrarian Reform. About 44 percent of the households sampled in Jagna Municipality had at least one land owned in 2000.
Social Clustering of Population
The race/ethnicity, language and heritage reveal much about the population’s origin and are often used in the administration of government programs.
Race / Ethnicity. The top largest ethnic groups in the municipality of Jagna are shown in Table 19. In the 2000 Census of Population, 89 percent of the population of Jagna was of Boholano origin with Cebuanos as the next largest group comprising 9 percent of its population. It is noted that among its residents, there are some cultural minority groups such as the Aeta/Ati, Maranao and Tausog, among others, living in Jagna.
Table 19: Household Population by Ethnicity and Sex: 2000
Ethnicity % to Total Both Sexes Male Female
JAGNA, Total 100.00% 30,619 15,587 15,032
Boholano 83.27% 25,495 12,940 12,555
Cebuano 8.05% 2,465 1,302 1,163
Not Reported 6.65% 2,037 1,033 1,004
Bisaya/Binisaya 0.37% 114 44 70
Other Local Ethnicity 0.36% 109 60 49
Maranao 0.14% 43 17 26
Abiyan 0.12% 37 19 18
Binukid/Bukidnon 0.10% 30 14 16
Butuanon 0.08% 25 11 14
Bugkalot 0.08% 24 14 10
Maguindanao 0.06% 19 10 9
2 This refers to a type of land owned by any member of the household.

Volume 1 – Land Use Plan of Jagna 2011-2020 Page - 39
Tagalog 0.05% 16 12 4 Source: Census of Population, National Statistics Office (NSO)
Language or Dialect Spoken. Several languages/dialects are spoken in the municipality as reported by NSO in its Census of 1995. The Boholano dialect is commonly used by by almost all of its population at 99.88% while only very few used other dialect.
Table 20: Household Population by Language or Dialect Spoken & Sex: 1995 Municipality of JAGNA
Language or Dialect Spoken Household Population % to Total
Boholano 32,070 99.88%
Hiligaynon- Ilonggo 8 0.02%
Tagalog 4 0.01%
Not stated 22 0.07%
Bicolano 2 0.01%
Source: Census of Population and Housing, National Statistics Office
Religious Affiliation. Jagna’s population is predominantly Roman Catholic comprising 89 percent of its population followed by the Aglipayans. The rest are divided among various religious denominations like Evangelicals, Adventists, other Protestants, among others.
Status of Well-being of Population. The current state of well-being of the population in the municipality is best shown by its socio-economic status and its capacity in terms of availability and access of basic social infrastructure, facilities and services. The socio-economic status of the municipality and the access of basic services were measured using the Poverty Database Monitoring System (PDMS), a tool for poverty diagnosis conducted at the household level. The survey consisted of twelve (12) indicators in 2005 which had been increased to twenty (20) in 2009. The synthesis of socioeconomic data and PDMS survey results highlights several points about the factors of well-being. For the Municipality of Jagna, the survey results, based on the comparative average value across indicators as shown in Table 21 and 21A. Among Jagna’s barangays, Brgy. Calabacita in 2005 and Brgy Boctol in 2009 has the highest poverty incidence among households at 16.91 and 23.03 percent respectivively which are considered poor or living below the income threshold of P10,200.00 per year. There were 16 barangays in Jagna Municipality with a poverty incidence among households of more than 10 percent in 2005 and 32 barangays in 2009. Based on a NSCB-World Bank report3, estimates of poverty incidence of Jagna was placed at 19.81 percent of families in 2003 and 32.31 percent of families in 2005, an increased of 12.5 percent. Out of 100 families, 32 were considered poor in 2005, compared to 20 in 2003. In that same report, Jagna ranked 41st of 47 municipalities and 1 city of Bohol as among the least poor municipalities of the province.
Table 21: Comparative Ranking of Poverty Incidence (%) by Barangay in 2005 and 2009
3 Source: Estimation of Local Poverty in the Philippines, National Statistical Coordination Board (NSCB)-World
Bank, Nov 2005
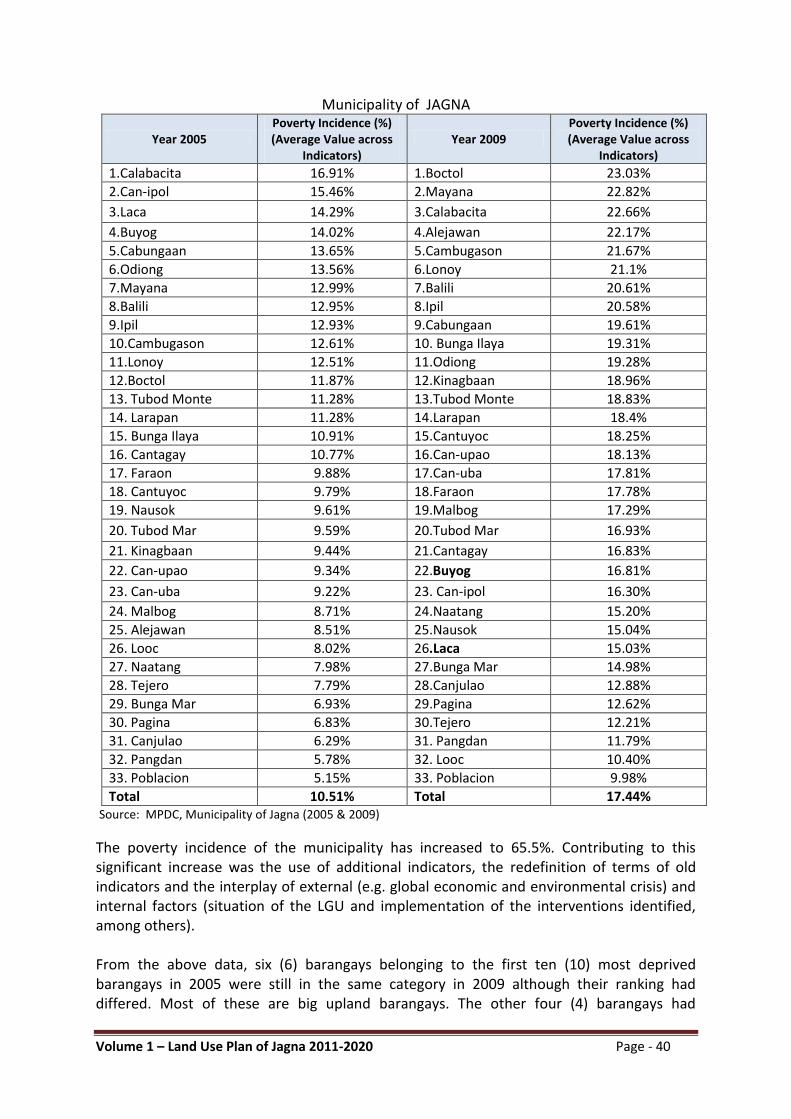
Volume 1 – Land Use Plan of Jagna 2011-2020 Page - 40
Municipality of JAGNA
Year 2005 Poverty Incidence (%) (Average Value across
Indicators) Year 2009
Poverty Incidence (%) (Average Value across
Indicators)
1.Calabacita 16.91% 1.Boctol 23.03%
2.Can-ipol 15.46% 2.Mayana 22.82%
3.Laca 14.29% 3.Calabacita 22.66%
4.Buyog 14.02% 4.Alejawan 22.17%
5.Cabungaan 13.65% 5.Cambugason 21.67%
6.Odiong 13.56% 6.Lonoy 21.1%
7.Mayana 12.99% 7.Balili 20.61%
8.Balili 12.95% 8.Ipil 20.58%
9.Ipil 12.93% 9.Cabungaan 19.61%
10.Cambugason 12.61% 10. Bunga Ilaya 19.31%
11.Lonoy 12.51% 11.Odiong 19.28%
12.Boctol 11.87% 12.Kinagbaan 18.96%
13. Tubod Monte 11.28% 13.Tubod Monte 18.83%
14. Larapan 11.28% 14.Larapan 18.4%
15. Bunga Ilaya 10.91% 15.Cantuyoc 18.25%
16. Cantagay 10.77% 16.Can-upao 18.13%
17. Faraon 9.88% 17.Can-uba 17.81%
18. Cantuyoc 9.79% 18.Faraon 17.78%
19. Nausok 9.61% 19.Malbog 17.29%
20. Tubod Mar 9.59% 20.Tubod Mar 16.93%
21. Kinagbaan 9.44% 21.Cantagay 16.83%
22. Can-upao 9.34% 22.Buyog 16.81%
23. Can-uba 9.22% 23. Can-ipol 16.30%
24. Malbog 8.71% 24.Naatang 15.20%
25. Alejawan 8.51% 25.Nausok 15.04%
26. Looc 8.02% 26.Laca 15.03%
27. Naatang 7.98% 27.Bunga Mar 14.98%
28. Tejero 7.79% 28.Canjulao 12.88%
29. Bunga Mar 6.93% 29.Pagina 12.62%
30. Pagina 6.83% 30.Tejero 12.21%
31. Canjulao 6.29% 31. Pangdan 11.79%
32. Pangdan 5.78% 32. Looc 10.40%
33. Poblacion 5.15% 33. Poblacion 9.98%
Total 10.51% Total 17.44% Source: MPDC, Municipality of Jagna (2005 & 2009)
The poverty incidence of the municipality has increased to 65.5%. Contributing to this significant increase was the use of additional indicators, the redefinition of terms of old indicators and the interplay of external (e.g. global economic and environmental crisis) and internal factors (situation of the LGU and implementation of the interventions identified, among others). From the above data, six (6) barangays belonging to the first ten (10) most deprived barangays in 2005 were still in the same category in 2009 although their ranking had differed. Most of these are big upland barangays. The other four (4) barangays had

Volume 1 – Land Use Plan of Jagna 2011-2020 Page - 41
graduated from the top ten (10) of which three (3) are considerably small. For the Metro Jagna area, it is only Barangay Can-upao which is considered the most deprived. The ranks of the barangays and their level of deprivation show that interventions have to be geared towards the upland and coastal barangays and the gains already achieved in improving the well-being of the people have to be sustained. In the PDMS survey of 2005, the top five (5) indicators with high incidence of deprivation were related to economic and social development concerns. The indicators on income threshold, food threshold, employment and school drop outs were highest in the upland barangays while tenure status was highest in Metro Jagna. Fifteen (15) upland and five (5) coastal barangays were listed in the Top 20 most deprived barangays. The 2009 PDMS survey consisted of twenty (20) indicators eight (8) of which are additional: two (2) of which are environmental concerns; five (5) are social and one (1) economic. The survey results revealed the following: 1. The top five (5) indicators with the highest incidence of deprivation are the water waste
and garbage disposals; health insurance, tenure status and sanitation.
2. The environmental concerns were significantly high in all of the barangays. For the garbage disposal, of the eight (8) Metro Jagna barangays availing of garbage collection, one (1) barangay belongs to the top 20 which are using environmentally unfriendly garbage disposal. The rest consist of twelve (12) upland and seven (7) coastal barangays. For the water waste disposal, the top 20 consist of thirteen (13) upland, five (5) coastal and two (2) Metro Jagna barangays.
3. For the health insurance indicator, thirteen (13) upland; five (5) coastal and two (2) Metro Jagna barangays belong to the top 20.
4. With the redefinition of terms on tenurial status and sanitation, these two indicators ranked fourth and fifth of total indicators of which the number of households not owning the lot where they live had increased to about 148% and those with unsanitary toilets which also increased to 390% . There is also an increase of about 50% in the number of households with makeshift materials.
5. There were improvements in the economic indicators particularly income and food threshold wherein about 50% of households are no longer below the income and food threshold. As to the unemployment indicator, there was about an 8% decrease in the number of unemployed persons compared to that in 2005. On the other hand, food shortage, an additional indicator was listed as number 7 of total indicators.
6. Improvements in the other indicators can also be noted as in the decrease in crime incidence and school drop-outs.
7. Child malnutrition increased to about 61.8% compared to 2005.
As in the 2005 PDMS survey, the Top 20 most deprived barangays based on the total poverty indicators consists of fourteen (14) upland barangays; five (5) coastal and one (1) Metro Jagna barangay. But compared in 2005, five (5) had moved out of the top 20 to include three (3) upland and two (2) coastal barangays. Seven (7) of the eight (8) Metro Jagna barangays have consistently remained as the least deprived barangays in the two surveys conducted. Based on the survey results, the environment-related indicators top the poverty list followed by economic and the different aspects of social development. Further, the interplay of these indicators vary in the different barangays with those in the upland

Volume 1 – Land Use Plan of Jagna 2011-2020 Page - 42
cluster mostly belonging to the most deprived and those in Metro Jagna as the least deprived barangays.
Table 21A: Comparative Ranking by Indicators in 2005 and 2009 Municipality of JAGNA
Comparative Ranking by Indicators 2005 2009
Indicators Percentage &
Rank Sectoral Concern
Indicators Percentage
& Rank Sectoral Concern
Income Threshold
1 – 41.87%* Economic Water Waste
Disposal 1 – 86.79% Environment
Food Threshold 2 -28.24%* Economic Garbage Disposal
2 - 60.85% Environment
Tenure Status 3 – 13.81%* Social
(housing) Health
Insurance 3 – 45.62%
Social (social welfare)
Unemployment 4 – 10.78% Economic Tenure Status 4 – 34.53%* Social (housing)
School Drop Outs
5 – 8.07% Social
(education) Sanitation 5 – 23.53%*
Social (basic utilities)
Crime Incidence
6 – 6.35% Social (public
safety) Income
Threshold 6 – 22.57%* Economic
Sanitation 7 – 4.32%* Social ( basic
utilities) Food Shortage 7 - 18.38% Economic
Water 8 – 3.05% Social (basic
utilities) Food Threshold 8 – 12.2%* Economic
Makeshift Housing
9 – 1.85% Social
(housing) Electricity 9 – 11.2%
Social (basic utilities)
Child Malnutrition
10 – 2.12% Social (health) Unemployment 10 – 10% Economic
Meals 11 – 0.19% Economic School Drop
Outs 11 – 7%
Social (education)
Child Mortality 12 – 0.11% Social (health) Crime Incidence 12 – 5.47% Social (public
safety)
Child
Malnutrition 13 – 3.43% Social (health)
Water 14 – 3.28% Social (basic
utilities)
Makeshift Housing
15 – 3.04% Social (housing)
Disability 16 – 1.58% Social (health)
Literacy 17 -0.91% Social
(education)
Maternal Mortality
18 – 0.3% Social (health)
Child Mortality 19 – 0.24% Social (health)
Meal Shortage 20 -0.16% Economic Source: MPDC, Municipality of Jagna (2005 & 2009)
Comparing the performance of the 2005 indicators in the 2009 survey period, the data reveal that there has been an improvement in the economic aspect particularly in the income and food threshold indicators which means that there has been a decrease in the number of households living below the threshold level. However, these households

Volume 1 – Land Use Plan of Jagna 2011-2020 Page - 43
including those living on the threshold or just above it are all vulnerable to various factors resulting from the global economic and environmental crisis. Meanwhile, the decrease in the school drop-outs indicator in the elementary schools can be attributed to the efforts of the Department of Education in the locality to respond to this problem. On the other hand, the rest of the 2005 indicators all belonging to social concerns fared negatively most particularly the tenurial status, sanitation and makeshift housing. The very significant variance in the above mentioned indicators is a result of the re-definition of terms for said indicators. The recent definitions have been adapted to conform to international standards. The indicators which were added in the 2009 survey focused more on environment and social concerns. Of the top ten, the indicators with the highest degree of deprivation were those related to the environment. For one, there has not yet been any intervention in water waste disposal while the implementation of the solid waste management is still within Metro Jagna. The tenurial status and sanitation indicators are in the fourth and fifth ranks respectively as a result of the revised definition of terms. To complete the top ten indicators showing the highest degree of deprivation were those related to economic concerns. The map indicates that the highest degree of deprivation across all indicators is mostly in the rural barangays, followed by those in the coastal areas. The least deprived are the Metro Jagna barangays.
Figure 9: AVERAGE ACROSS INDICATOR MAP LEGEND:
PHYSICAL/INFRASTRUCTURE RESOURCES
Transport
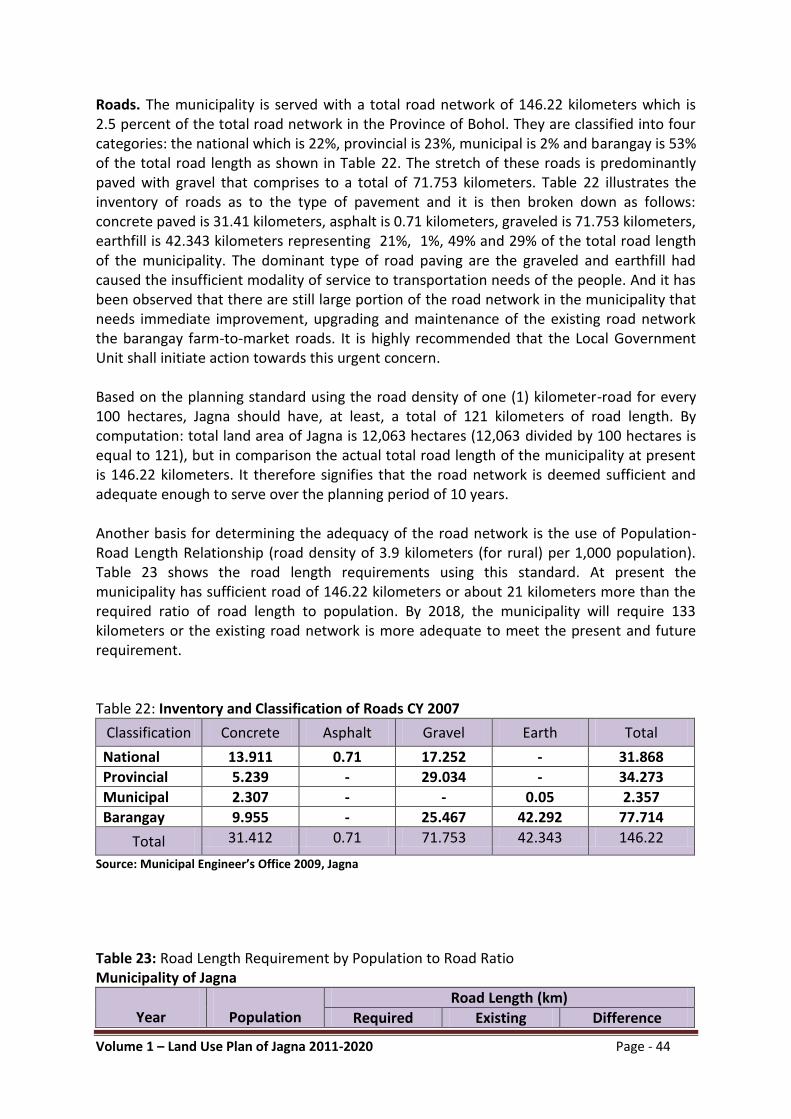
Volume 1 – Land Use Plan of Jagna 2011-2020 Page - 44
Roads. The municipality is served with a total road network of 146.22 kilometers which is 2.5 percent of the total road network in the Province of Bohol. They are classified into four categories: the national which is 22%, provincial is 23%, municipal is 2% and barangay is 53% of the total road length as shown in Table 22. The stretch of these roads is predominantly paved with gravel that comprises to a total of 71.753 kilometers. Table 22 illustrates the inventory of roads as to the type of pavement and it is then broken down as follows: concrete paved is 31.41 kilometers, asphalt is 0.71 kilometers, graveled is 71.753 kilometers, earthfill is 42.343 kilometers representing 21%, 1%, 49% and 29% of the total road length of the municipality. The dominant type of road paving are the graveled and earthfill had caused the insufficient modality of service to transportation needs of the people. And it has been observed that there are still large portion of the road network in the municipality that needs immediate improvement, upgrading and maintenance of the existing road network the barangay farm-to-market roads. It is highly recommended that the Local Government Unit shall initiate action towards this urgent concern. Based on the planning standard using the road density of one (1) kilometer-road for every 100 hectares, Jagna should have, at least, a total of 121 kilometers of road length. By computation: total land area of Jagna is 12,063 hectares (12,063 divided by 100 hectares is equal to 121), but in comparison the actual total road length of the municipality at present is 146.22 kilometers. It therefore signifies that the road network is deemed sufficient and adequate enough to serve over the planning period of 10 years. Another basis for determining the adequacy of the road network is the use of Population-Road Length Relationship (road density of 3.9 kilometers (for rural) per 1,000 population). Table 23 shows the road length requirements using this standard. At present the municipality has sufficient road of 146.22 kilometers or about 21 kilometers more than the required ratio of road length to population. By 2018, the municipality will require 133 kilometers or the existing road network is more adequate to meet the present and future requirement. Table 22: Inventory and Classification of Roads CY 2007
Classification Concrete Asphalt Gravel Earth Total
National 13.911 0.71 17.252 - 31.868
Provincial 5.239 - 29.034 - 34.273
Municipal 2.307 - - 0.05 2.357
Barangay 9.955 - 25.467 42.292 77.714
Total 31.412 0.71 71.753 42.343 146.22
Source: Municipal Engineer’s Office 2009, Jagna
Table 23: Road Length Requirement by Population to Road Ratio Municipality of Jagna
Year
Population
Road Length (km)
Required Existing Difference

Volume 1 – Land Use Plan of Jagna 2011-2020 Page - 45
2007 32,034 124.94 146.22 21.28
2018 34,101 133.00 146.22 13.22 Source: Jagna Municipal Engineer’s Office, 2009
A significant increase in length of the concreted portion of Jagna roads for the Provincial, Municipal, and Barangay Roads was funded by the Department of Agriculture, for the improvement of Farm to Market Roads. The barangay roads increased to 20.19% equivalent to 2,010 meters, There are barangays that don’t have barangay roads, instead they are passing through Provincial roads leading to their respective barangays like part of Bunga-Mar. The Junction Bunga-Mar, Bunga-Ilaya, Kinagbaan, Laca, Buyog, Balili, and Malbog Circumferential Provincial Road which intersect with the national road section an increase of 12.37 % equivalent to 648 m was realized. The Provincial government commits to giving a counterpart equivalent to the length being realized per barangay which is under negotiations with the contractor. Barangay Roads. The municipality has seventy eight (78) barangay roads which are mostly passable due to its good maintenance by the local officials, but some barangay roads are also not passable like the balikbayan barangay road which was affected by the landslide and which needs thousands of pesos of financial assistance for its rehabilitation so that the agricultural products from this sitio can easily be transported out. The nausok-Larapan barangay road has similar problems as well in which the Nausok portion is the only passable part by vehicles while the Larapan portion is not passable by any kind of vehicle. This road is the shortcut road going to its next Barangay Larapan. These problems remain because of the lack of funding and attention from the government, so if the government can fixed this problem and all barangay roads become passable then transporting agricultural products and transportation itself will no longer be a problem. Municipal Roads. Jagna has eight municipal roads, all of which are concreted and passable by trucks. These are in Metro Jagna only, located at Barangay Poblacion and Pagina,.Some municipal roads are connected to Provincial roads such as the Severo Salas St., Abrea st., Achacoso St., but they need rehabilitation because the old concrete is already dilapidated so it also needs funding from the government. Provincial Roads. There are fourteen (14) Provincial roads in this municipality and all are passable due to the government’s efforts to maintain the roads in passable condition. There are also some portions which were concreted due to the efforts of the Provincial government made possible by the Barangay officials’ asking for funding to the politicians and the farm to market road was also funded by the Department of Agriculture. National Road. The national road in the municipality is almost completely concreted due to the Strong Nautical Highway program of the government. The Tagbilaran East road is already completely concreted while the Jagna-Sierra-Bullones national road concreting is still on-going. When this development is completed, traveling along these roads will already become comfortable.
Bridges as to Type of Administration. The municipality has twenty-six (26) existing bridges, sixteen (16) of them are being maintained by the national government through the DPWH, four (4) were constructed and maintained by the provincial government thru the Provincial

Volume 1 – Land Use Plan of Jagna 2011-2020 Page - 46
Engineers Office (PEO) and six (6) are maintained by the municipal and barangays. The total length of the municipal bridge is 429.64 linear meters which represents 4.63 percent of the total length of Bohol bridges. It is basically classified into national, provincial, municipal and barangay bridges with corresponding length of 289.64, 69, 36 and 35 linear meters respectively (refer to Table 24). Table 24: Bridges by Type of Administration CY 2007
Type of Administration
Number Length by Type
Total Length (l.m.)
Percent to Total Concrete Steel Wood
National 16 274.40 15.24 - 289.64 67.4%
Provincial 4 62 - 7 69.00 16.0%
Municipal 3 - - 36 36.00 8.4%
Barangay 3 - - 35 35.00 8.2%
TOTAL 26 336.40 15.24 78 429.64 100%
Inventory of Existing Bridges. Table 25 shows the inventory of bridges in the municipality as to the type of construction. It is further illustrated that majority of the bridges are concreted and it is followed by wooden and steel type with a length distribution of 336.40 l.m. 0r 78%, 78 l.m. or 18% and 15.24 l.m. or 4% respectively from the total length of bridges in the municipality. It is imperative that the wooden type of bridges shall be upgraded to a more permanent type of bridge like concrete or steel type. Table 25: Existing Bridges, Location and Type of Construction Materials Used CY 2007 Municipality of Jagna
Bridge Name
Location/ Barangay
Type of Construction Materials Remarks/ General
Condition Concrete Steel Wood
L W LC L W LC L W LC
a. National Bridges
1. Alejawan Bridge Alejawan 48 7.3 20 RCDG - Good
2. Naatang Bridge Naatang 5 7.3 20 RC Deck Slab-Good
3. Tubod Mar Bridge Tubod Mar 5 6.7 20 RCDG - Good
4. Nausok Bridge Nausok 5 7.3 20 RCDG - Good
5. Pangdan Bridge II Pangdan 5 7.3 20 RCDG - Good
6. Pangdan Bridge I Pangdan 10 7.3 20 RCDG - Good
7. Pagina Bridge II Pagina 23.4 7.3 20 RCDG - Good
8. Pagina Bridge I Pagina 12 7.6 20 RCDG - Good
9. Bunga Mar Bridge II Bunga Mar 21 6.7 20 RCDG - Good
10 Canjulao Bridge Canjulao 18 7.3 20 SPG - Good
11 Carmoli Bridge Tubod Monte 15 7.3 20 RCDG - Good
12 Lubcanan Bridge Tubod Monte 15.2 4.2 3 T SS Bailey-Temp
13 Pangas Bridge Tubod Monte 8 6.7 20 RCDG - Good
14 Tubod Monte Bridge
Tubod Monte 7 6.7 20 RCDG - Good
15 Carapagan Bridge Can-ipol 50 7.3 20 SPG - Good
16 Mayana Bridge Mayana 42 7.3 20 RCDG - Good
b. Provincial Bridges
1. Cabungaan Bridge Cabungaan 25 7.3 20 Steel Modular-

Volume 1 – Land Use Plan of Jagna 2011-2020 Page - 47
Good
2. Odiong Bridge Odiong 7 4 3 T Timber - Good
3. Can-okso Bridge Cambugason 7 6.7 20 Box Culvert – Good
4. Lonoy-Cansuhay Br.
Lonoy-Cansuhay (Duero)
30 7.3
20 Steel Modular - Good
c. Barangay Bridges
1. Capahan Bridge Calabacita 10 3.6 1 T Timber - Passable
2. Larapan-Tubod Mar
Larapan-Tubod Mar
7 3.6 1 T
Timber - Good
3. Kaparian Bridge Alejawan-Cambugason
6 3.6 1 T
Timber - Not Passable
d. Municipal Bridges
1. Quezon Bridge Pagina(Seawall)-Looc(Market)
15 4.2 1 T
Bailey/Timber- Passable
2. Acha Bridge Pagina-Canjulao
15 3.6 1 T
Bailey/Timber - Not Passable
3. Calmayon Bridge Poblacion (Pondol)-Pagina
18 4.2 1 T
Bailey/Timber- Passable
Source: DPWH, PEO, MEO Legend : L = Length (meters) W = Width (meters) LC = Load Capacity (metric tons)
Land Transport Vehicles. The municipality is highly accessible either by means of land and sea transportation. In the year 2007, there are 15,243 transport vehicles regularly carry on their route in the different national, provincial, municipal and barangay roads within the municipality. Fourteen thousand two hundred forty six (14,246) of these are privately owned, nine hundred eleven (911) are public utility and eighty six (86) are government-owned. The number is expected to rise annually, considering the distance from Tagbilaran City to Jagna with concreted paved road. One can easily reach this town after an approximate 1½-hour travel from Tagbilaran by bus, van-for-hire (V-hire) or jeepney. There are thirty nine (39) bus lines like Dory Jagna Transit, Duero Transit, and Saint Jude Transit as well as transient buses plying the Jagna route at regular intervals. Transportation from the town proper to the hinterland barangays are available by means of hired motorcab, single motorcycles popularly known as “habal-habal” and small buses or jeepneys. Table 26: Inventory of Land Transport Vehicles CY 2007 Municipality of Jagna
Type of Vehicle Private Public Utility Government Total
Light Vehicles 1,929 220 40 2,189

Volume 1 – Land Use Plan of Jagna 2011-2020 Page - 48
Truck 486 3 14 503
Motorcycle 11,208 32 11,240
Bus 553 39 592
Tricycle 55 649 704
Trailer 15 15
Heavy Trucks none
TOTAL 14,246 911 86 15,243
Source: Land Transportation Office (LTO)
Bus Terminal and Parking Space. The available bus and jeepney terminal and parking facilities are located in Looc Public Market, and Poblacion at Municipal Plaza, Municipal Hall and Parish Church that can accommodate 79 vehicles. The existing terminal has no facilities except for parking space, which is in a temporary condition and made of concrete pavement. This situation has worsened because of the lack of terminals and parking areas in Metro Jagna. This is a major concern which should be considered in the infrastructure development plan.Based on the records from the local PNP there are forty three (43) road accidents happened in 2008. Vehicle accidents can be prevented once reckless driving is minimized or generally, the drivers are well disciplined. The conduct of regular orientation seminar to this effect shall likewise be given to the drivers and even vehicle operators. Sea Transportation. Presently, the Philippine Port Authority (PPA) is in vision to modernize its port facilities in the country. Fortunately the Port of Jagna had constructed a state-of-the-art passenger terminal, cargo terminal, the roll-on-roll-off port and the back-up area construction for container vans. This is actually part of the President Arroyo’s STRONG NAUTICAL HIGHWAY PROJECT as reflected in its national 10-point agenda. The port facilities in Jagna are the only one in Southeastern part of Bohol that serves as the gateway to Northern Mindanao. The PPA has managed seaport that straddles a major Visayas-Mindanao Sea-lane with ferryboats regularly plying from Jagna to Cagayan de Oro, Butuan City and Camiguin routes and vice-versa. Among the shipping lines that cater the passengers and cargos are Sulpicio Shipping Lines, Cebu Ferries, Gothong Shipping Lines, Para Seacat (fast craft) and Shuttle Ferries. Aside from this, commercial cargo ships and barge regularly ply the route transporting copra, cement, feeds, fertilizers and rice. With the inclusion of the Jagna Port as part of the nautical highway project of the current national development agenda being one of the flagship projects, the ongoing improvement of the area will greatly benefit the municipality. However, to complement the ongoing modernization program of the port, the Local Government Unit should also look into the upgrading, maintenance and “beautifying” the cluttered vicinity. There is a proposed Sangguniang Bayan Resolution submitted to the province to include the dilapidated provincial concrete road around Jagna Public Market, Jagna, Bohol in the Port Zone Delineation in (Figure 10 below) to the Philippine Ports Authority South Harbor Port Area Manila for its development. The provincial road around the Jagna Public Market intersects the Tagbilaran East Road, Jagna section which is the entrance to and exit from the Jagna wharf and also the Central Nautical Highway (Jagna-Sierra Bullones Road) are parts of the so called Strong Republic Nautical Highway. The Port of Jagna, Bohol is considered as the
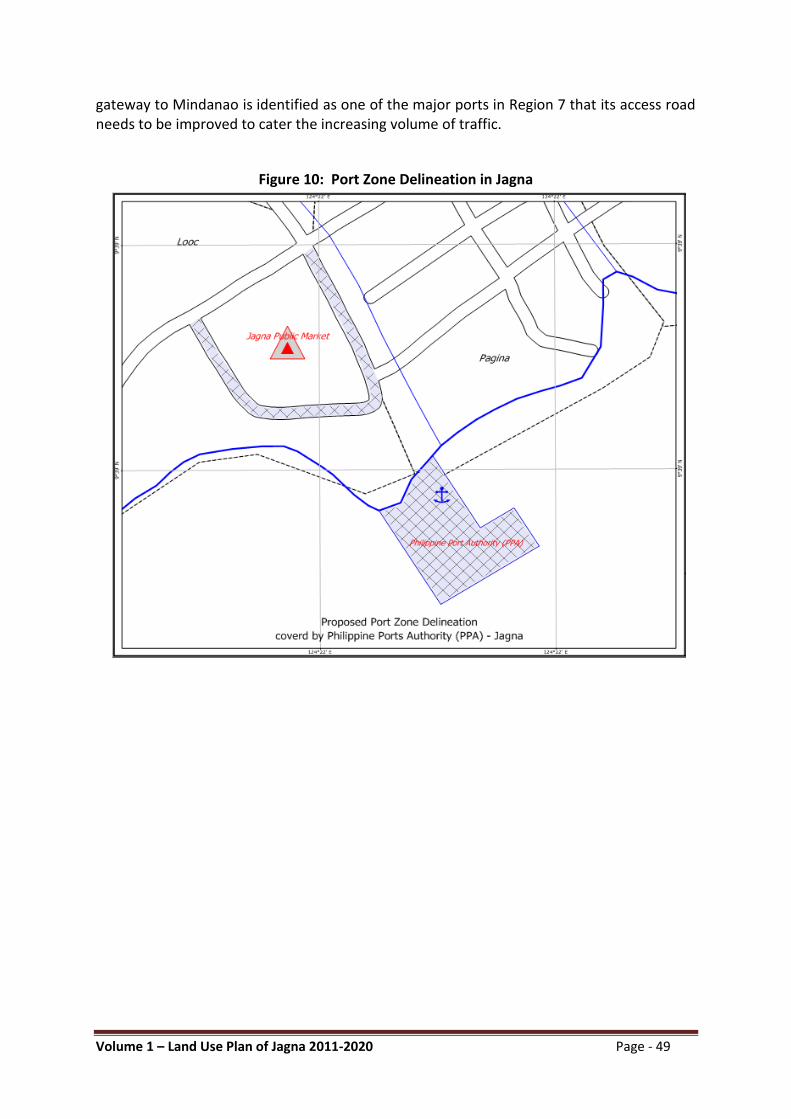
Volume 1 – Land Use Plan of Jagna 2011-2020 Page - 49
gateway to Mindanao is identified as one of the major ports in Region 7 that its access road needs to be improved to cater the increasing volume of traffic.
Figure 10: Port Zone Delineation in Jagna

Volume 1 – Land Use Plan of Jagna 2011-2020 Page - 50
SOCIAL SERVICES
Education. Compared to the other socio-economic sectors, education involves much more complex and multidimensional problems. Faced with financial constraints, governments, especially LGUs, are constraint to meet the ever-increasing social demands of the education sector with some adopting measures in order to rationalize the use of limited allocated resources. Under the Local Government Code of 1991, local government units share with the national government the responsibility of providing quality education in the locality as well as financing infrastructure facilities such as school buildings. It is a powerful instrument of economic, social and cultural change. A community cannot foster development without an educated population. Businesses, large or small, are unlikely to choose to invest in areas if skilled or trainable human resources are unavailable.
The Municipality of Jagna has a total of 33 learning institutions, both public and private, occupying a total land area of almost 41 hectares (Table 27). Basic Education is being provided by three (3) primary schools, twenty-one (21) elementary schools and seven (7) high schools strategically located in the municipality. Tertiary Education is offered by one (1) college (Bohol Institute of Technology is complete with an elementary, high school and college levels) and one (1) technical/vocational school managed by the Technical Education and Skills Development Authority (TESDA). Public schools provide majority of the basic education services in the municipality while private schools served mostly Jagna’s secondary and tertiary education levels. There are preparatory schools in the municipality consisting of 34 public Daycare Centers in the barangays which are managed privately. One private elementary school also has a daycare. The St. Therese Kindergarten School is a private preparatory school and in the current school year (2008-2009), the public elementary schools have opened their preparatory schools as mandated by the Department of Education. Almost all of the school buildings in Jagna Municipality are made of concrete with 32 percent of them with mixed concrete-wood/light materials. Unlike the private school buildings, the buildings of public schools in Jagna are only considered in usable condition with some requiring major repair and rehabilitation.
Table 27: SUMMARY OF SCHOOLS BY CATEGORY AND TYPE, 2008
Municipality of Jagna
Category Type/Number of Schools Area Occupied (square meters)
Public Private Total
Jagna 26 5 31 401,674
Primary 3 - 3 29,341
Elementary 19 2 21 314,509
Secondary 3 4 7 35,824
Tertiary - 1 1 20,000
Vocational 1 - 1 2,000 Source DepEd/TESDA
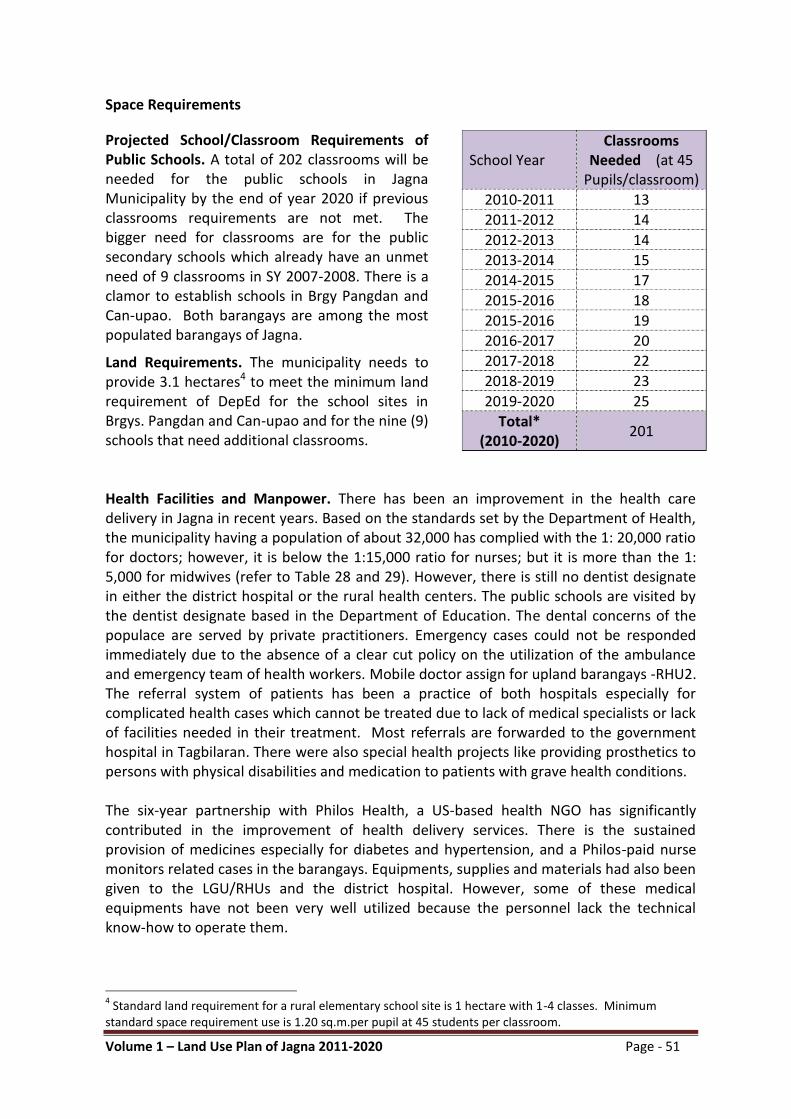
Volume 1 – Land Use Plan of Jagna 2011-2020 Page - 51
Space Requirements
Projected School/Classroom Requirements of Public Schools. A total of 202 classrooms will be needed for the public schools in Jagna Municipality by the end of year 2020 if previous classrooms requirements are not met. The bigger need for classrooms are for the public secondary schools which already have an unmet need of 9 classrooms in SY 2007-2008. There is a clamor to establish schools in Brgy Pangdan and Can-upao. Both barangays are among the most populated barangays of Jagna.
Land Requirements. The municipality needs to provide 3.1 hectares4 to meet the minimum land requirement of DepEd for the school sites in Brgys. Pangdan and Can-upao and for the nine (9) schools that need additional classrooms. Health Facilities and Manpower. There has been an improvement in the health care delivery in Jagna in recent years. Based on the standards set by the Department of Health, the municipality having a population of about 32,000 has complied with the 1: 20,000 ratio for doctors; however, it is below the 1:15,000 ratio for nurses; but it is more than the 1: 5,000 for midwives (refer to Table 28 and 29). However, there is still no dentist designate in either the district hospital or the rural health centers. The public schools are visited by the dentist designate based in the Department of Education. The dental concerns of the populace are served by private practitioners. Emergency cases could not be responded immediately due to the absence of a clear cut policy on the utilization of the ambulance and emergency team of health workers. Mobile doctor assign for upland barangays -RHU2. The referral system of patients has been a practice of both hospitals especially for complicated health cases which cannot be treated due to lack of medical specialists or lack of facilities needed in their treatment. Most referrals are forwarded to the government hospital in Tagbilaran. There were also special health projects like providing prosthetics to persons with physical disabilities and medication to patients with grave health conditions. The six-year partnership with Philos Health, a US-based health NGO has significantly contributed in the improvement of health delivery services. There is the sustained provision of medicines especially for diabetes and hypertension, and a Philos-paid nurse monitors related cases in the barangays. Equipments, supplies and materials had also been given to the LGU/RHUs and the district hospital. However, some of these medical equipments have not been very well utilized because the personnel lack the technical know-how to operate them.
4 Standard land requirement for a rural elementary school site is 1 hectare with 1-4 classes. Minimum
standard space requirement use is 1.20 sq.m.per pupil at 45 students per classroom.
School Year Classrooms
Needed (at 45 Pupils/classroom)
2010-2011 13
2011-2012 14
2012-2013 14
2013-2014 15
2014-2015 17
2015-2016 18
2015-2016 19
2016-2017 20
2017-2018 22
2018-2019 23
2019-2020 25
Total* (2010-2020)
201

Volume 1 – Land Use Plan of Jagna 2011-2020 Page - 52
Space Requirements. A total of four (4) hectares are needed for the different health infrastructure-support facilities to be undertaken by LGU-Jagna, broken down as follows: Botica sa Barangay two (2) hectare and Barangay Health Centers two (2) hectares.
Table 28: HEALTH PERSONNEL AND FACILITIES Jagna, Bohol (2009)
PERSONNEL
HOSPITAL RHU Private Clinics
TOTAL TBGDH LIM HOSPITAL RHU 1 RHU 2
Doctors 6 5 1 1 3 16
Nurses 12 13 1 1 27
Dentists 0 0 0 2 2
Nursing Aides 5 5 10
Midwives 1 1 7 6 15
Medical Technologies 3 1 1 5
Sanitary Inspectors 1 1
Optometrists 2 2
Total 27 25 11 8 7 78
Rooms 16 (6 private)
11 (2 private; 2 semi-private)
27
Bed Capacity 25 28 53 Source: MPDC, Municipality of Jagna (2009)
Table 29:BARANGAY HEALTH PROVIDERS AND FACILITIES Jagna, Bohol (2009)
Personnel
Barangay Health Centers cum Lying-in Facilities Barangays
Total
RHU 1(22 brgys) RHU 2 (11 brgys) Male Female
Midwives 7 6 13
Barangay Health Workers (BHW) 123 84 207
Barangay Nutrition Scholar (BNS) 33 33
Trained Hilot 3 12
Total 3 265
Sources: RHU 1 & 2, Municipality of Jagna (2009)
Housing. The implementation of RA 7279 otherwise known as the Urban Development and Housing Act and RA 7160 or the Local Government Code transferred more responsibilities to the local government units pertaining to its land use, housing and infrastructure development in their respective localities. As such, it becomes the principal implementing bodies with regard to shelter needs whereby they will be able to effectively and efficiently respond to the challenge of providing shelter to its homeless and underprivileged constituents. In the 2000 Census of Population and Housing by NSO on Jagna Municipality, there were a total of 5,903 occupied housing units for 5,957 households giving a ratio of 1.01 household to one occupied housing unit with an average of 5.14 persons per occupied housing unit. Majority of these units were single houses comprising 97 percent of total houses in the municipality. The Municipal PDMS in 2005 shows that of the 6,200 households surveyed, there were 115 or 1.80 percent households

Volume 1 – Land Use Plan of Jagna 2011-2020 Page - 53
with makeshift or temporary housing. Brgys. Calabacita and Cambugason had the most number of these makeshift houses. It was noted that the municipality of Jagna had a housing backlog of 490 dwelling units which includes the shortage in dwelling units due to existence of doubled-up households aside from substandard/unacceptable dwelling units that would need improvement/replacements. Compounding this problem are the 257 households with completely destroyed houses and 9 households with housing structure partly damaged by the recent landslide in Brgy. Mayana. Noted also is the in-migration of 18 Muslim households in Brgy. Pagina. Squatter areas are starting to sprout in Jagna. About 33 households are squatting near or along the river banks and coastal areas of the municipality. This brings the housing shortage to 807 houses. The Local Government Unit of Jagna has started identifying and negotiating for a relocation site. The LGU, somehow, is confronted with the lack of funds to buy lots and in the construction of housing units. Comparative data as presented in Table 30 illustrates the Housing and Basic Utilities Indicators derived from the PDMS survey conducted in 2005 and 2009.
Table 30: Comparative Report on Housing and Basic Utilities Indicators PDMS Survey of 2005 and 2009
Indicators 2005 2009 Remarks
Tenure on the house and the home lot
13.81% 34.53% Increased of 150% (Variance is due to the difference in definition of lot ownership in the 2 survey periods)
Makeshift housing 1.85% 3.04% Increased of 64.32%
Electricity 11.2% Not an indicator in 2005
Potable water 3.05% 3.28% Increased of 7.5%
Unsanitary Toilet 4.32% 23.53% Increased of 444.67% (Variance due to the difference in the definition of sanitary toilet in the 2 survey periods)
Source: PDMS survey results of 2005 and 2009, Municipality of Jagna
Housing Land Requirements. For the 51 housing backlog of Jagna, a total of 1.53 hectares will be needed using the standard of 300 sq m. per dwelling unit. For its future housing needs of 730 dwelling units, a total of 21.9 hectares will be required for the planning period 2010-2020. A total of 23.43 hectares is needed which includes the housing backlog in 2007 and future requirements for 2010-2020 (Table 31).
Table 31: PROJECTED POPULATION, HOUSEHOLDS AND DWELLING UNITS Municipality of Jagna
Year Current and Projection
Population Households Dwelling Units
2007 32,034 6,637 6,586
Housing Backlog, 2007 51
Housing Demand/Requirement
2010 32,560 6,851 265
2011 32,727 6,818 33
2012 32,901 6,854 36
2013 33,083 6,892 38
2014 33,271 6,931 39
Volume 1 – Land Use Plan of Jagna 2011-2020 Page - 54
2015 33,468 6,972 41
2016 33,671 7,014 42
2017 33,882 7,059 45
2018 34,101 7,104 45
2019 34,442 7,175 71
2020 34,786 7,247 72
Total 2010-2020 730
Social Welfare Services. Social welfare programs are categorized as social security, personal social services, and public assistance. These are extended to the community most particularly to children, out-of-school youth, women, the elderly, persons with disabilities, the distressed and those who are in difficult circumstances or in crisis situations. With a very small workforce and no Social Welfare Officer since 2006, the office and its related functionaries have extended basic services in response to the needs of its varied clientele. Presently, the municipality has 34 Day Care Centers with corresponding number of Day Care Workers. Barangay Canjulao has two (2) day care centers because of its large population. Each Day Care Worker serves two (2) sessions daily to pre-school children aged 3-5.11 years old. Of the thirty-four (34) Daycare Workers (DCW) and Daycare Centers (DCC), twenty-four (24) had been accredited for new tools and procedures. The accreditation ratings received were: fifteen (15) Very Satisfactory mark; four (4) Highly Satisfactory mark and five (5) Satisfactory mark. The remaining ten (10) DCW / DCC are still processing their accreditation pending compliance of requirements like repairs of Day Care Centers and DCWs who are under observation with technical supervision of the MSWDO.
Women Sector. In the 2009 PDMS survey, the women sector comprises 48.86% of the municipality’s total population. Women still continue to dominate the reproductive sphere in the gender roles, however; there is a growing number of those who are balancing this with their productive, community management and constituency-based politics roles as well. Married women especially those who are not gainfully employed are mainly into their reproductive role. But due to hard times when the principal source of income of the family cannot sustain their minimum basic needs, women are mostly engaged in subsistence livelihood just to have both ends meet. There are a significant number of women who are practicing their professions in the health and education sectors as well as those who are in business and in administrative and managerial positions in private institutions and government. A municipal-wide local council of women (Kahugpongan sa Kababayen-an sa Jagna-Local Council of Women, Inc.) which is registered with the Securities and Exchange Commission. It has a membership coming from the 33 barangays and six other municipal-level women organizations (both from private and government). Of the 33 barangay women organizations, eleven (11) are full-pledged organizations with two (2) which are registered with the Cooperative Development Authority and the other nine (9) are with the Department of Labor and Employment. Four (4) others are in the process of working for registration with DOLE. Of the other six (6) municipal-level organizations, one (1) is registered with SEC; another is with the DOLE/CDA and the other four (4) have not yet been accredited. The local council of women promotes women economic empowerment, women’s human rights and gender responsive

Volume 1 – Land Use Plan of Jagna 2011-2020 Page - 55
governance as the key to gender equality and women’s empowerment. Seventeen (17) women organizations are into different group enterprises such as food processing, production and marketing, lending and catering services. Trainings and seminars on food safety and hygiene, product development, marketing, and organization have been conducted to these groups by government entities. But there is much more to be done in terms of information, credit, technology, training and market for these livelihood activities to become viable and sustainable. In terms of governance, the table below shows that elective positions in the municipal and barangay government units are still dominated by male (refer Table 32). The elective positions at different levels of governance in the municipality show that 74% are held by men and only 26% or one fourth are for women. All the elective posts at the municipal level are occupied by men except for a woman municipal councilor who sits as ex-officio member being the President of the Federated Sanggunian Kabataan of the municipality. The appointive positions of secretary and treasurer of the barangay are dominated by women who occupy 73% of all positions compared to 27% held by men. There is a municipal–wide local council of women (Kahugpongan sa Kababayen-an sa Jagna-Local Council of Women, Inc.) which is registered with the Securities and Exchange Commission. It has a membership coming from the 33 barangays and six other municipal-level women organizations (both from private and government). Of the 33 barangay women organizations, eleven (11) are full-pledged organizations with two (2) which are registered with the Cooperative Development Authority and the other nine (9) are with the Department of Labor and Employment. Four (4) others are in the process of working for registration with DOLE. Of the other six (6) municipal-level organizations, one (1) is registered with SEC; another is with the DOLE/CDA and the other four (4) have not yet been accredited.
Table 32: Elected Municipal, Barangay and Sanggunian Kabataan Officials, Appointed Barangay Secretaries and Treasurers
Elective Position Number Male Female
Municipal Level
Mayor 1 1
Vice Mayor 1 1
Municipal Councilors 8 8
Barangay Level (33 brgy)
Punong Barangay 33 28 5
Barangay Kagawad 231 (less 3 unfilled positions) 163 65
SK Chairpersons 33 24 9
Total 307 (less 3 unfilled positions) 225 79
Appointive Positions (Barangays)
Secretary 33 10 23
Treasurer 33 8 25
Total 66 18 48 Source: MLGOO, Municipality of Jagna, 2009

Volume 1 – Land Use Plan of Jagna 2011-2020 Page - 56
Sports and Recreation. The officials and constituents of the municipality believe that sports or physical fitness activities as well as recreational activities contribute to the physical well-being of the inhabitants. This is manifested in the presence of basketball courts in all the thirty-three (33) barangays of the municipality. The youth are found to be the group mostly engaged in sports and recreational activities. And majority of them preferred the basketball game. There are thirty-four (34) existing basketball courts in the municipality, with some barangays having two or three basketball courts. These facilities were constructed to provide the young generation a venue for sports activities and to some extent cultural and even income-generating activities. These basketball courts also serve as multi purpose dryer. Other facilities serving as sports and recreational activities are the two (2) gymnasiums, two (2) tennis courts located in barangays Poblacion, Looc and Faraon seven (7) volleyball courts, twenty-one (21) playgrounds in the elementary schools, three (3) playgrounds in the secondary schools and the eight (8) multi-purpose/social halls in the barangays. These facilities serve as a venue for sports and cultural activities. It has also a privately-owned cockpit arena. Basketball, soccer, football, boxing, volleyball and badminton are considered as one of Jagna’s major sports. It is a favorite pastime and hobby of men of all age groups as well as the lawn tennis of some professionals in Metro Jagna. All barangays in the municipality have basketball courts and during the summer particularly in the month of May when fiestas are celebrated almost daily, basketball leagues are held led by the Sanggunian Kabataan. Invitational and commercial games are also held in the municipality. Protective Services (PNP and BFP). The Philippine National Police is mandated to enforce the law, prevent and control crimes, maintain peace and order, promote safety and internal security with the active support of the community. Ideally, 1,000 constituents shall be serviced by one PNP personnel. At present, the actual total number of policemen in Jagna is 18, falling short of the standard which must be 32 based on the actual population of 32,000 (1:1000 police to population ratio). The PNP station needs an additional 14 PNP personnel to conform with the standard. This personnel shortage could not be attributed to the Local Government Unit of Jagna since this is inherent to the PNP Organization. The number of PNP personnel assigned to the locality depends on the availability of police uniformed personnel at the provincial level. The limitation is temporarily addressed with the mobilization of the barangay tanods in every barangay and other support groups from civic organizations for the maintenance of peace in and order in the municipality. Despite the shortage of personnel, response time of PNP personnel is satisfactory. The Bureau of Fire Protection (BFP) which is mandated to prevent and suppress fires avoiding loss of life and damage to properties. There are thirteen (13) firemen personnel assigned in the municipality and they are complemented with two (2) serviceable fire trucks. With a ratio of 1:2000 (based on standard), the present firemen lack three (3) more. With the population increase, the municipality of Jagna still needs an additional four (4) firemen personnel to augment its existing work force in the Bureau of fire Protection. For its protective services, there are two existing fire hydrants in the municipality, the BFP also has two (2) handheld radios, one computer unit and a telephone system. These gadgets and equipment facilitated the extension of an effective and efficient service delivery by the BFP.

Volume 1 – Land Use Plan of Jagna 2011-2020 Page - 57
OTHER INFRASTRUCTURE UTILITIES Water Utilities. The municipality of Jagna is served with Level III, II and I water system. The source for Level III was drawn from the natural springs of Tinubdan Spring located in barangay Lonoy and Malbog spring with a capacity of 4,147 cubic meters/day and capacity 3,012 cubic meters/day respectively that provides water service to the upland barangay of Cambugason and Metro Jagna residents except the barangays of Bunga Mar and portion of Pangdan. There are fourteen (14) Level II water systems serving 1,890 households within the 14 barangays while there are still 487 households not being served by the water system. Records shows that there still 30 percent of the household population in Jagna with no access to safe and potable water. The municipal waterworks system upgraded the old and small pipes into bigger ones with a diameter of 6” blue pipes (PVC) with the length of 4 kilometers. A bigger water reservoir will be constructed in order to better provide the effective and efficient delivery of water service in the whole including the coastal barangays and Metro Jagna from barangay Ipil to Pangdan. Based on the data from the Municipal Water, Sewerage and Sanitation Master Plan (MW4SMP) Jagna has a total of 625 Level I water systems located in the thirty-two (32) barangays and it is broken down as follows: 473 shallow wells, 47 deep wells and 105 improved springs. This indicates that shallow aquifer is dominant in the municipality, while deeper aquifer occurs in elevated areas. The free flowing wells indicate artesian aquifer. The deepest well in the Level I system is located in Barangay Tubod Mar in Sierra Bullones Limestone at an elevation of 20-m amsl, which penetrates to 200-m below ground or about 180-m below main sea level. The potable water demand including domestic, industrial, institutional and commercial both in urban and rural population is estimated to 3,615 cubic meters/day in 1998 and it is projected to increase by 8,887 cubic meters/day in 2030. In 1998, the part of water demand for urban population is 51% it is projected to increase to 65% in 2030. Power Utilities. The electricity requirements in the municipality are served by BOHECO II through power generated by the National Power Corporation (NAPOCOR) and it is now managed by TRANSCO. All of the 33 barangays have access to electricity but there are many issues raised by the consumers due to high power or electricity rates per kilowatt hour, power fluctuations and power shortages especially in rural areas. Additional lighting facilities in some streets and places particularly in the commercial areas in Metro Jagna need to be addressed by the concerned agencies in coordination with the local government unit. The power utility providers like the electric cooperatives have been in the forefront of this effort to provide electricity to the rural areas. Residential areas are most numbered consumers of electricity in the municipality of Jagna, although their level of power consumption is significantly lower compared to industrial, commercial and institutional. The total average consumption of the municipality is 2,360.53 kilowatt-hour per month, and the bulked of consumption goes to industrial users with 1,824.28 kilowatt-hour per month. However, the possibility of an increased household served by the cooperative is very admissible because of the continuing extension of power distribution lines to the different puroks in every barangay. The organization of Barangay Power Association (BAPA) and ACA are instrumental in increasing household connection.

Volume 1 – Land Use Plan of Jagna 2011-2020 Page - 58
At present majority of the households in the municipality are using the combination of both electricity and kerosene for lighting with 95% and 5% of the total households respectively. However, in cooking, 78.26% of the total households are using firewood, 15.80% uses LPG and 3.41% uses kerosene. The projected power requirement in relation to an expected higher level of consumption due to economic activities during the plan period is now presented in Table 33. It is expected to increase from 408,904.2 kwh in the year 2010 to 1,060,592.1 kwh in the year 2020. It has been a continued thrust of the local government as well as the electric cooperative to energize 100% of the total households in all barangays. Table 33: Projected Power Requirements by Type of Connections for 2011-2020 in KWH Municipality of Jagna
Connection /User
Projected Power Requirement
2010 2011 2012 2013 2014 2015 2016 2017 2018 2019 2020
Domestic 259,942 285,936 314,530 345,983 380.581 418,639 460,503 506,554 557,209 612,930 674,223
Industrial 35,149 38,664 42,530 46,783 51,462 56,608 62,269 68,496 75,345 82,880 91,168
Commercial 72,670 79,937 87,931 96,724 106,397 117,037 128,740 141,614 155,776 171,353 188,489
Public Buildings
36,948
40,643
44,707
49,178
54,096
59,506
65,456
72,002
79,202
87,122
95,835
Streetlights 4,193 4,612 5,073 5,580 6,138 6,752 7,428 8,170 8,988 9,886 10,875.5
TOTAL 408,904 449,794 494,774 544.250 598,676 658,544 724,398 796,838 876,522 964,174 1,060,592
Source: BOHECO II
Communication. The major types of communication system in the municipality are available at the urban center. Radio facilities include Bohol Law Enforcement Communication System (BLECS), Jagna Community Radio in partnership by Philos Health in San Francisco, California and the Radio Natin FM station in Jagna owned by the Manila Broadcasting Company (MBC). Telecommunication and courier services are served by Luzon Brokerage Corporation (LBC), COMMEL Relay Station in Mayana, the Government-owned Telecom, the Cruz Telephone Company (CRUZTELCO), the San Miguel Cable TV, Smart, Sun Cellular Companies and Globelines Companies. Access to basic communication facilities such as telephone services, cellular phones including postal services is vital towards the development in a municipality. The entry of modern communication facilities complemented by courier services, telecommunication facilities and tri-media network has provided the people of Jagna a greater access to information and technology and faster business and personal contacts. However, the most pressing concern is the current communication facilities particularly the telephone network including the international networking (internet) and the facsimile services (fax). The existing facilities are very limited and their services are poor. It cannot respond to the demands of a fast developing urban municipality in Bohol. Mostly of the communication network facilities are owned by private firms. The best to have better communication system for the municipality is to open a new or partners with other telecommunication networks and investors and to upgrade the existing facilities to provide an efficient service to the public.

Volume 1 – Land Use Plan of Jagna 2011-2020 Page - 59
Waste Disposal Facility. Jagna has a 1.5 hectares existing dumpsite in Bunga Ilaya and Canjulao. However, the existing dumpsite has been ordered for closure since it violates R.A. 9003. The LGU in compliance with the law is now regulating the type of wastes being disposed into the facility. Only residual wastes are allowed for disposal. However, in compliance to R.A. 9003 the LGU has already allocated a four (4) hectare sanitary landfill at Barangay Tubod Mar where one (1) hectare has already been acquired for phase I project implementation. The topographic map and design of the facility is already in-place. The sanitary landfill Phase I is soon to commence. Eight barangays or 24% of the 33 barangays within the metro Jagna (Poblacion, Pagina, Tejero, Canjulao, Pandan, Looc, Can-upao and Bunga Mar) with a total of 1,316 households (HH) are into waste segregation and collection method of garbage disposal and they are availing the services of garbage truck, compactor and backhoe in the collection and waste segregation. The garbage collection services of the LGU are manned by twelve (12) staff hired by the LGU of Jagna. It is supported with 1 compactor, 1 garbage truck (non-serviceable) and 1 backhoe. Liquid Waste Disposal. The Municipality of Jagna is currently utilizing an outmoded slaughterhouse without proper liquid waste facility, making the vicinity unsanitary. Collection and disposal of waste is inconsistent and it is coupled with the clogging problem due to poor drainage, in which all of these factors would greatly affect negative impacts to the health of the people and marine resources. The PDMS survey conducted in 2009 revealed that there are 3,948 HHs or 62.7% of household population are using environmentally unfriendly garbage disposal which means that they are still burning and using open dumping garbage while 5,463 HHs or 86.76% of household population are using environmentally unfriendly waste water disposal meaning the water disposal flows from the sink to the ground, to a closed pit and to an open pit. Drainage, Sewerage and Sanitation. The municipality of Jagna has no drainage and sewerage system. This is a common occurrence among the 47municipality and one city in the province and even all throughout the country. Basically, the existing drainage in the town follows the alignment of the major urban road networks and along the highway. While on the hand, the existing septic tanks from the households are not connected due to the absence of sewerage system in the town. Considering that the geological composition of the municipality is highly permeable karstified limestone, the untreated liquid wastes will immediately percolate to the underground that will eventually create negative impacts to the surface and groundwater sources. The data on the data from the Municipal Health Office shows that there are 5,856 or 88.31% of the total households, have sanitary toilets. The rest are using closed pit or antipolo type representing 2.37%, 4.63% shared with other households, 0.06% with open pit and 4.63% with no toilet. It is therefore imperative that the LGU of Jagna shall take into consideration the implementation of the Municipal Drainage and Sewerage System or look for another short-term alternative like installation of sanitary “septic tanks”, enactment of existing policies and among others. Cemeteries. The municipality has 14 burial grounds located in 9 barangays comprising a total area of 4.5 hectares. Of the 14 cemeteries, 1 of them is managed by the municipal government, 8 are managed by the barangay, one (1) is run by the aglipay and 4 are managed by the church. However, these cemeteries are not properly managed due to massive expansion of sheds/structures within the cemeteries.
Volume 1 – Land Use Plan of Jagna 2011-2020 Page - 60
ECONOMIC STRUCTURE
Agriculture. Agriculture is one of the primary economic drivers of the municipality of Jagna with farming, fishing and livestock raising as its main economic activities. The present agricultural land area of the municipality represents 69.25 % of its total area. Out of the total of 8,353.39 hectares of agricultural land area only 4,183.63 hectares or 49.92% are presently used or devoted to crop production. The remaining 4,169.76 hectares of agricultural land is potential for other agricultural production or usage. Results of the PDMS survey in 2009 showed that 2,835 households or 45.02 % of the total number of households of Jagna are basically engaged in farming. The main agricultural crops grown in the municipality are coconut, rice, corn, root crops, vegetables, spices, bananas and fruit trees which are for cash and/or consumption. Cut- flowers and ornamentals have also become sources of income. Presently, Jagna is among the suppliers of some varieties of vegetables and spices as well as cutflowers in the province. This economic activity is considered family’s business whereby the father is the farm owner, mother and children are farm workers. In some cases women are hired as paid labor for specific lighter farm operations receiving equal daily wage as that of men. However, women spend most of their time doing household chores and yet they still manage to go in the farm and help their spouses.
Livestock and poultry production are one of the livelihoods in the municipality. It provides alternative source of income to farmers. However, it continues to be a backyard activity basically for home consumption. The municipality has no full-scale commercial livestock production although there are areas that can be tapped and suitable to pasture area. Fishing activities in the municipality’s coastal barangays produce fish products mostly for local markets. In 2007, volume of fish production from Jagna and Mindanao Sea reached 393.18 metric tons. Majority of the fish catch were sold either to the middlemen (57%) or directly sold to their neighbors (31%). Inland fishpond area is estimated at 1,259.20 square meters located in 8 barangays. The estimated average tilapia production is 25,184 kilograms per year. The establishment of three (3) marine protected areas (MPA) located Tubod Mar, Pangdan and Naatang, if properly designed and managed could meet various coastal and marine conservation needs by preserving habitat and important species.
Agricultural Support Facilities. The agricultural support facilities in Jagna are classified into two types: 1.) those that support production and 2.) Post harvest facilities. Production support facilities include irrigation system, farm implements, supply of farm inputs, agricultural credit and extension services. Other support facilities for agriculture include wheel tractors, hand tractors, plows, sprayers and some harrows. For the post harvest support facilities these include multi-purpose drying pavements, rice mills and warehouses. Although, the municipality lacks the amenities of post and pre-harvest facilities, agricultural schools/ technical institution, loan and credit facility for agriculture. Basketball courts can be converted and utilized into solar driers. Farm-to-markets roads have been constructed to pave way for easy accessibility of agricultural products to the market. The Municipal Agriculture office provides technical assistance to marine and inland fisheries. Among the assistance extended are supervision and strengthening of fishermen associations and cooperatives and assist them in the maintenance and

Volume 1 – Land Use Plan of Jagna 2011-2020 Page - 61
management of the coastal and marine resources. Livelihood trainings and seminars have been conducted to fishermen associations to capacitate and assist them in the management and monitoring of the livelihood projects such as eucheuma culture, tilapia dispersal and loan repayment. The Philippine Crop Insurance Company (PCIC) has been extending services under its insurance policy program to farmers and livestock raisers. Agricultural Extension Services are provided by the Municipal Agriculture Office (MAO) in the form of technical assistance and services to farmers, livestock and poultry raisers and fisherfolk
Irrigation Facilities. The presence of the small water-impounding projects provides the needed irrigation to irrigate the 358.50 hectares of rice producing area. Irrigation facilities in Jagna consist of Communal Irrigation Systems established by the National Irrigation Administration (NIA) in barangays Alejawan, Boctol, Cabungaan Cambugason and Lonoy. Other existing irrigation systems developed and being managed by the farmers associations are located in barangays Bunga Ilaya, Tubod Monte, Odiong, Balili, Calabacita and Mayana. Number of privately owned water pumps were installed to serve sizable farms of the owner. Hand Tractors and Power Tillers are increasingly replacing carabaos as draft animals. These farm implements are privately owned and are used for hire in a rental basis by most farmers during land preparation activities.
Industry. The present industries in the municipality are body building/assembling of motorelas and jeepneys, rice milling and food processing. Meanwhile, body-building shops that assemble motorelas used as public utility vehicles and also owner-type jeepneys in barangay Pangdan are also a flourishing industry. These assembly shops have given employment to skilled and semi-skilled workers. However, the local trading business is very active especially in the areas of retail of household and farm goods required and needed by the local population as well as those requirements of the adjacent localities. These retail businesses include retailing of household and farm products and the buying and selling of local surplus of agricultural and fishery products. Aside from calamay-making, the municipality does not have a strong cottage industry whose production can be classified as a major industry. Most of those are home-based activities, thus, its trend in terms of commercial volume is limited. Secondly, the absence of a more defined support mechanism for investment climate attracting more investors is not present.
The presence of mineral deposits that has attracted minor concessionaires is a potential for future major economic development that may catalyze for other economic activities. Based on the Industrial Land Intensity Standards with a standard area per person per industry classification, the present and projected industrial area requirement for light, medium and heavy industries are presented in the table below. The area requirement for year 2009 for light and medium industries, is 25.63 hectares and 80.09 hectares, respectively. Increasing in area by about 5% during the 10-year planning period. However, heavy industries are not allowed in the province, only light and medium industries that are not pollutive and hazardous to the environment is encouraged to be put up in the municipality.

Volume 1 – Land Use Plan of Jagna 2011-2020 Page - 62
Commerce and Trade. Commercial activities like wholesale and retail are largely concentrated in the Metro Jagna area where commercial establishments are mostly located. The opening of the new modern commercial building owned and operated by the municipal government provided an add-on to the potential of the municipality given its strategic location as well as the presence of a seaport providing as entry of goods and commodities. The completion of its phase 3 section or the 2nd floor of the main building is currently under way. It covers a land area of 0.6 hectare and is expected to have 232 stalls in the main building and 133 tables in the wet market. Most common wholesale products in the municipality are on fish, vegetables, dry goods, beverages, rice and feeds. The most common type of trading in Jagna is sari-sari stores, food vending, rice retailing and vending of agricultural product. There are also individuals who are producing at the same time selling their products. The presence of the Jagna Port that makes Jagna as the Gate Way to the mainland of Mindanao creates a big impact trading in the municipality. The present of this port made an access of more people and goods to come and pass that makes Jagna as the Trading Capital of the Southeastern part of the province. At present, there are 296 existing commercial establishments in Jagna based on the 2010 DTI business name registration records. These were able to employ hundreds of people. Establishments include banks and other lending institutions, business enterprises, distribution centers, lodging accommodation, funeral parlor, pawnshops and others. The following is the list of commercial establishments categorized as shown in table 34:
Table 34: Summary of Business Establishments Registered at DTI as of 2010
Number of registered retailers 145
Number of registered manufacturers 27
Number of registered services 114
Number of registered wholesalers 10
T o t a l 296
Source : Department of Trade and Industry, 2010
In the field of trading, manufacturing and processing the women are dominant compared to men not only in the urban area but also in the rural barangays (see Figure). This activity is mainly on retailing or vending and processing of food product. In the other feature men is majority in the services and agri-aqua sector. Most of this enterprise requires hard labor and big investment. In the food and beverage sector men and women are partly equal in the engagement.
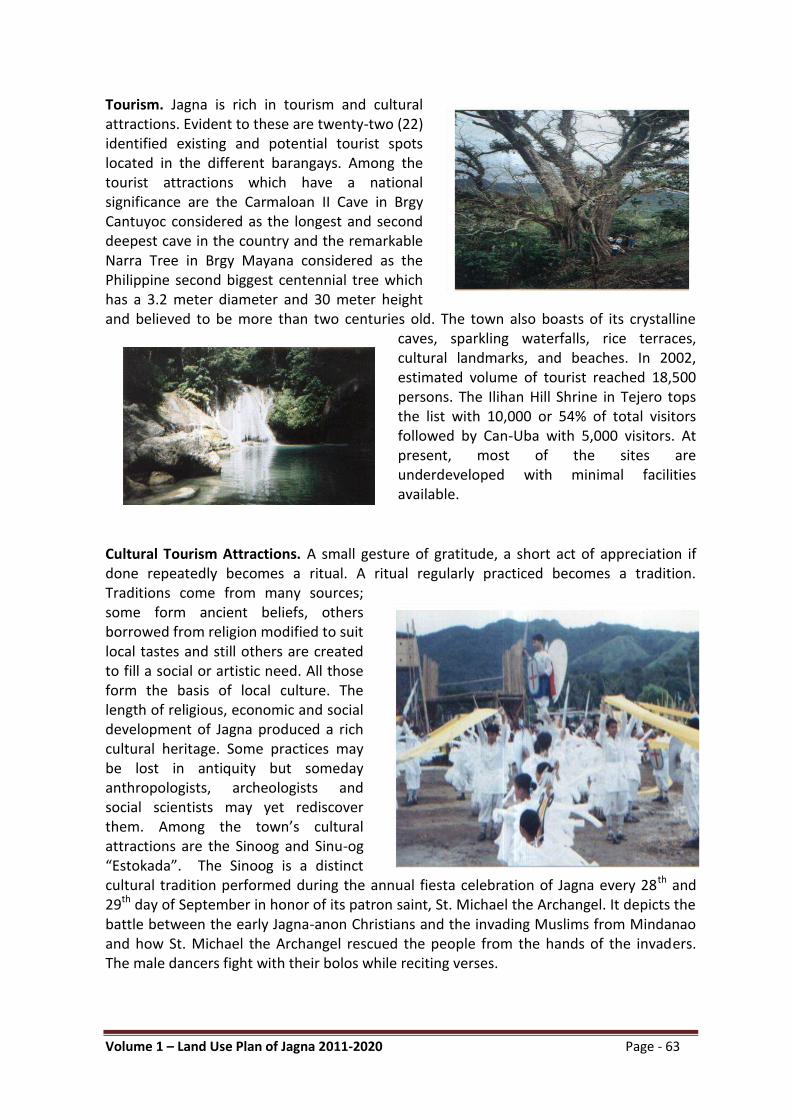
Volume 1 – Land Use Plan of Jagna 2011-2020 Page - 63
Tourism. Jagna is rich in tourism and cultural attractions. Evident to these are twenty-two (22) identified existing and potential tourist spots located in the different barangays. Among the tourist attractions which have a national significance are the Carmaloan II Cave in Brgy Cantuyoc considered as the longest and second deepest cave in the country and the remarkable Narra Tree in Brgy Mayana considered as the Philippine second biggest centennial tree which has a 3.2 meter diameter and 30 meter height and believed to be more than two centuries old. The town also boasts of its crystalline
caves, sparkling waterfalls, rice terraces, cultural landmarks, and beaches. In 2002, estimated volume of tourist reached 18,500 persons. The Ilihan Hill Shrine in Tejero tops the list with 10,000 or 54% of total visitors followed by Can-Uba with 5,000 visitors. At present, most of the sites are underdeveloped with minimal facilities available.
Cultural Tourism Attractions. A small gesture of gratitude, a short act of appreciation if done repeatedly becomes a ritual. A ritual regularly practiced becomes a tradition. Traditions come from many sources; some form ancient beliefs, others borrowed from religion modified to suit local tastes and still others are created to fill a social or artistic need. All those form the basis of local culture. The length of religious, economic and social development of Jagna produced a rich cultural heritage. Some practices may be lost in antiquity but someday anthropologists, archeologists and social scientists may yet rediscover them. Among the town’s cultural attractions are the Sinoog and Sinu-og “Estokada”. The Sinoog is a distinct cultural tradition performed during the annual fiesta celebration of Jagna every 28th and 29th day of September in honor of its patron saint, St. Michael the Archangel. It depicts the battle between the early Jagna-anon Christians and the invading Muslims from Mindanao and how St. Michael the Archangel rescued the people from the hands of the invaders. The male dancers fight with their bolos while reciting verses.

Volume 1 – Land Use Plan of Jagna 2011-2020 Page - 64
Land Use Plan
The Land Use Plan in the Municipality of Jagna is a guide or a framework for a more a detailed planning of the area. It is an appropriate and proper land resource management in a sustainable manner so that the people and the future generation can benefit from continuous land utilization. It is a policy-prime mover to maximize opportunities for creativity, innovation and flexibility in land allocation in consonance with the goals and objectives of the municipality. It gives a spatial or physical dimension to the final development strategy consisting of various integration of sectoral strategies. The plan shall serve as the basis for the development in the municipality that will guide investments in the future to be made by the national and provincial agencies, non-government organizations and private sector.
The land use plan of the municipality is framed as the guiding development concept on how the land resources shall be put and utilized into the proper use in the next ten years and onward. Any changes in a particular landscape and seascape shall be given high importance particularly on the environment and the natural resources, so that all activities will be in the context of sustainable development.
Basically, the Land Use Plan of Jagna contains the General and Urban Land Use both existing and proposed. In the context of general land use planning, objectives are determined by the land use planning principles and standards, environmental policies set forth in the various rules, regulations and legislations affecting the use of the land. In the urban land use planning, the objectives are determined by the interplay of economic, socio-cultural and consideration of public interests. Given the limited land and the constraint imposed by the presence of development projects, it would be most appropriate for the municipality to make an efficient and optimum use of its remaining land resources.
VISION
Jagna is the leading center of trade and sustainable agro-processing and ecotourism in Southeastern part of Bohol, with self-reliant men and women living a better quality of life, preserving their cultural heritage and efficiently managing natural resources through good governance.
MISSION In order to realize our vision and fulfill our aspirations, we therefore commit ourselves:
Institutionalization of good governance by transforming the local government unit into one that is committed to uphold, promote and protect the interest, rights and welfare of its people;
Preservation of our rich cultural heritage and the foundational values by embodying, respecting and espousing the traditions, practices and beliefs that characterized Jagna’s history, and built its present;
Promotion of Jagna as a municipality conducive to initiatives for economic development, tourism promotion and environmental protection.

Volume 1 – Land Use Plan of Jagna 2011-2020 Page - 65
Organization’s Value Statement
We are an organization bonded together by respect, honesty, discipline and hospitality, dedicated to provide sincere and transparent public service.
Overall Land Use Goal
The general goal of the land use plan of the Municipality of Jagna is to optimize the use land resources for development and progress of the community. To attain self-sufficiency, it has to develop its resources in a sustainable manner by tapping both the natural and capital assets with focus on the enhancement and increase of areas potential to agricultural productivity and agri-business; harnessing ecotourism and improving strategies for commerce and trade.
Objectives of Land Use Plan
To promote the efficient acquisition and equitable utilization, acquisition and disposition of land as a limited resource and a valuable commodity through a rational allocation and delineation of different uses according to their highest and best use;
To resolve land use related conflicts that may occur when there is incompatibility in the land use activities that either put stress on the natural environment or on the residents;
To minimize and resolve conflicts between and among government agencies related to the use, management and disposition of land;
To expand the urban area of the municipality by opening up more lands for urban use;
To identify terrestrial and aquatic ecosystems including the coastal zone for preservation, conservation, rehabilitation and upgrading and identify measures to ensure success ;
To improve the mobility and circulation systems by rehabilitating the existing barangay farm-to-market roads leading to the urban centers and also linking one barangay to another in the rural areas;
To extend the area available for business development in the municipality without congesting the area for commercial center and with due consideration of environmental sanitation ;
To effect an efficient settlement pattern for better access by the population to the basic services, facilities and utilities thus minimizing the problems of accessibility and congestion;
To allocate land uses that will promote productivity and environmental integrity by providing necessary areas for production and protection in a balanced manner for more sustainable growth;
Volume 1 – Land Use Plan of Jagna 2011-2020 Page - 66
To maintain the remaining lands with slope of less than 18% as agricultural land wherever they are free from other (non-agriculture) uses and not within the identified urban area;
To identify environmentally critical areas to deflect development, population centers and other high risk activities from locating in these areas and likewise point out constrained areas such as flood prone, flash flooding, landslide, unstable areas, fault line and other disaster risk areas;
Functional Role of the Town
The role of the Municipality of Jagna is identified as a major supplier of food in the province particularly in rice, corn, coconut, rootcrops and vegetables, fishery, livestock and calamay making that will contribute to the total development of the province.
Development Concepts
Alternative Spatial Strategies
The trend alternative reflects the probable scenario of Jagna if the existing conditions are allowed to continue and the direction of present activities will follow its natural course. Urbanization will essentially follow a linear pattern of growth or a ribbon type of development along the areas traversed by the national, provincial and municipal roads. The Barangays Poblacion, Pagina,Looc and Can-upao will be maintained as the central business district and will remain as the core urban growth in the municipality. However, there is a need to identify and define the direction of development towards the urbanizing barangays, wherein an expansion of built-up areas is applied as a sub-center that would serve as a production and marketing center of agricultural produced in the town. As a major trading center in the southeastern part of the province, the municipality would become the institutional and settlement center in Bohol. Due to urbanization process, a tremendous demand for land will be expected. Since development is highly concentrated in the urban areas, future activities like the basic services and facilities shall be provided to the strategic barangays mentioned and indicated in the land use plan. Farming and fishing will continue to be the primary economic activities of the people. Land resources will thus be used for agricultural production. Increase the number of hectares cultivated and the volume of agricultural crops, livestock and fishery production by adopting modern and environmentally-friendly technology and shall be guided by the concept on sustainable development and ecological protection. Demand for reclassification and conversion of agricultural land into its non-agricultural uses will still be minimal. The traditional farming practices using organic fertilizers shall be observed in order to have an ecological sustainable agro-industrial town. Crop productivity and quality shall likewise be improved and enhanced. Inter-cropping activities will be encouraged in lands suitable for agricultural crops and other commodities.
Settlement in the urban barangays will expand following the topography of the land that will complement with the residential development or proposed socialized housing in the municipality.
Volume 1 – Land Use Plan of Jagna 2011-2020 Page - 67
Cottage industry shall be improved and developed well by providing an advance technology including the quality products and marketing strategy in order to boost the economy of the municipality.
Access or road network system from the rural barangays to urban areas remains slightly difficult due to poor road condition and inadequate drainage. Roads shall be improved or if possible be cemented to make commerce and trade safe and fast.
Barangays in the urban and rural which are potential for eco-cultural tourism activities shall be improved and developed.
The disposal and management of waste shall be given due attention and importance by allocating space for final disposal and implement effective solid waste management.
Extensive areas of production forest will be utilized and parks and plaza shall be established.
Built-up areas in every barangay where infrastructure and utilities development are commonly concentrated and located are the center for social functions and activities.
Major Spatial Strategy
Considering the municipal development potentials, the spatial strategies that will serve as organizing concept for allocation of lands are the agricultural development, agro-processing, eco-tourism and marine recreation development. Based on the evaluation of alternatives, this will provide greater benefits and ensure economic growth to the attainment of the goals and objectives set forth in the CLUP.
For the future development, the economy of Jagna is anchored on its potential to become the economic growth center in the southeastern part of Bohol. The proposal is based in the following considerations:
The municipality of Jagna due to its being in the crossroad of the Bohol Circumferential Road and the Bohol Interior Road and it is the gateway to Mindanao makes it a natural gathering place of goods and people for trade and other purposes;
The presence of a seaport, when expanded, can play a vital role making the municipality as a point of entry and exit for goods and people from and to the bigger trading center in Cagayan de Oro City, Butuan City, Camiguin and from Cebu City.
Advance level of urbanization and commercial development;
Jagna is known for its cultural and heritage sites which are potential for ecological-cultural tourism development;
The identity of Jagna as one of the fastest growing municipalities in the province of Bohol.
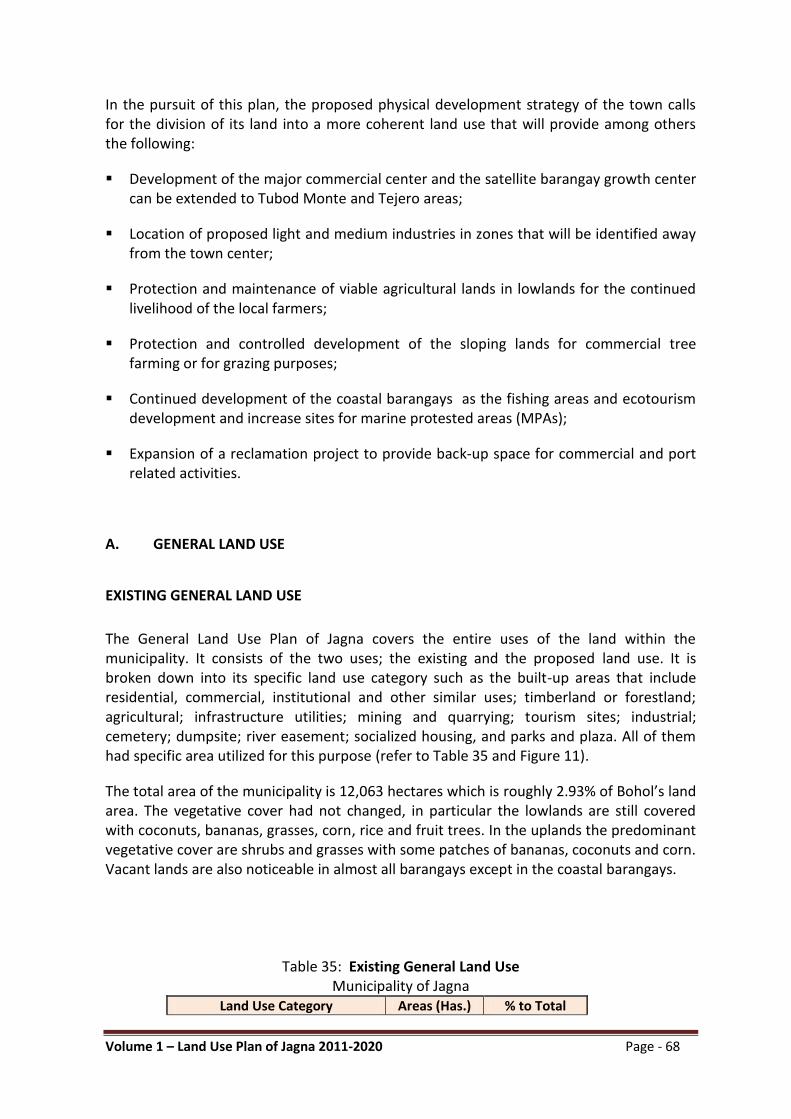
Volume 1 – Land Use Plan of Jagna 2011-2020 Page - 68
In the pursuit of this plan, the proposed physical development strategy of the town calls for the division of its land into a more coherent land use that will provide among others the following:
Development of the major commercial center and the satellite barangay growth center can be extended to Tubod Monte and Tejero areas;
Location of proposed light and medium industries in zones that will be identified away from the town center;
Protection and maintenance of viable agricultural lands in lowlands for the continued livelihood of the local farmers;
Protection and controlled development of the sloping lands for commercial tree farming or for grazing purposes;
Continued development of the coastal barangays as the fishing areas and ecotourism development and increase sites for marine protested areas (MPAs);
Expansion of a reclamation project to provide back-up space for commercial and port related activities.
A. GENERAL LAND USE
EXISTING GENERAL LAND USE
The General Land Use Plan of Jagna covers the entire uses of the land within the municipality. It consists of the two uses; the existing and the proposed land use. It is broken down into its specific land use category such as the built-up areas that include residential, commercial, institutional and other similar uses; timberland or forestland; agricultural; infrastructure utilities; mining and quarrying; tourism sites; industrial; cemetery; dumpsite; river easement; socialized housing, and parks and plaza. All of them had specific area utilized for this purpose (refer to Table 35 and Figure 11).
The total area of the municipality is 12,063 hectares which is roughly 2.93% of Bohol’s land area. The vegetative cover had not changed, in particular the lowlands are still covered with coconuts, bananas, grasses, corn, rice and fruit trees. In the uplands the predominant vegetative cover are shrubs and grasses with some patches of bananas, coconuts and corn. Vacant lands are also noticeable in almost all barangays except in the coastal barangays.
Table 35: Existing General Land Use Municipality of Jagna
Land Use Category Areas (Has.) % to Total

Volume 1 – Land Use Plan of Jagna 2011-2020 Page - 69
Area
Built-up Area 847.63 7.03%
Timberland/Forestland (Protection)
1,863.00 15.44%
Public Land (hilly mountains) 372.55 3.09%
Agricultural:
> Agricultural Production 4,183.63 34.68%
> Production Forest 4,169.76 34.57%
Roads/Other Infra Utilities 493.16 4.09%
Cemetery
6.40 0.05%
Mineral/Quarry
10.00 0.08%
Tourism
2.30 0.02%
River Easement/Buffer Area
80.00 0.66%
Open Space/Park and Plaza
2.00 0.02%
Socialized Housing
4.00 0.03%
Dumpsite
4.00 0.03%
Cockpit
2.00 0.02%
Slaughterhouse
0.20 0.00%
Reclamation Area
7.60 0.06%
Industrial
14.77 0.12%
T o t a l
12,063.00 100.00% Sources: MTWG-CLUP, Land Area: DENR Land Classification
Built-up Areas. The total built-up area within the municipality is composed of two groups; the urban and rural built-up, that covers 847.63 hectares or 7.03% of the total land area. It includes the residential, institutional and commercial areas. The concentration of the settlement structures in every barangay is built around the school buildings, barangay halls, along the roads and any other community basic facilities where social interaction and functions usually takes place.
Socialized Housing. The municipality of Jagna has identified the land area for housing development. It is located in barangay Canjulao containing an area of four (4) hectares.

Volume 1 – Land Use Plan of Jagna 2011-2020 Page - 70
Agricultural Areas. The town is blessed with the rich natural resources. It has a vast potential area for agriculture, associated with substantial water resources. The existing area potential for agricultural production is 8,353.39 hectares, which is 69.25 percent of the total land area of the municipality. The present agricultural area planted to various types of crops is roughly 3,500 hectares (refer to page 74-Table 4 of Volume 3).
Timberland or Forestland. The existing forestland area of the municipality is 1,863 hectares, which is equivalent to 15.44 percent of the total land area. These areas are covered with a Presidential Proclamation No. 881 the Alejawan-Cansuhay-Anibongan River Watershed Forest Reserve which is an initial component of the National Integrated Protected Areas System (NIPAS Act). Proper management of these areas should be exercised by the LGU in close coordination with the DENR.
Tourism. The Municipality of Jagna has seventeen (18) identified tourism sites with a consolidated area of 2.3 hectares. They are presently located at Barangay Poblacion (3), Cabungaan (1), Boctol (2), Odiong (2), Cantuyoc (1), Mayana (2), Can-uba (1), Larapan (2), Tubod Mar (1), Lonoy (1), Cantagay (1) and Malbog (1). The Little Baguio of Bohol is situated in Barangay Mayana.
Mining and Quarrying. The existing quarry sites cover a total area of ten (10) hectares. These are located in barangay Laca, Boctol and Malbog. All of these sites are situated outside the protected areas.
Road Network and Other Infra Facilities. The existing road network in the municipality is 493.16 hectares or 4.09% of the total land area of Jagna. It includes the existing roads in the rural and urban barangays being categorized as national, provincial, municipal and barangay roads.
Reclamation. The municipality of Jagna has an existing reclamation area of 7.60 hectares located in barangay Pagina.
River Easement/Buffer Zone Areas. River easement occupies a total area of eighty (80) hectares that stretches along the riverbanks within the urban and portion of the rural barangays where the river waterways traversed and the buffer area along the coastal zone of the municipality.
Dumpsite. At present the town has an existing dumpsite with an area of four (4) hectares and it is located portion in barangay Canjulao and Bunga Ilaya. At present only one (1) hectare is developed for waste disposal. (Can-ipol)
Open Space/Parks and Plaza. Parks and plaza is located at Poblacion with a consolidated area of 2.00 hectares.
Cockpit. A privately-owned cockpit in the town is located at Barangay Can-upao containing an area of two (2) hectares.
Cemetery. There are 15 existing cemeteries in the town covering a total land area of 6.40 hectares. They are presently located in the following barangays of Tejero (3), Balili (1), Laca (2), Boctol (2), Calabacita (1), Mayana (2), Odiong (1), Lonoy (2) and Buyog (1).

Volume 1 – Land Use Plan of Jagna 2011-2020 Page - 71
Slaughterhouse. The existing slaughterhouse is located in Barangay Tejero with an area of 0.2 of a hectare. PROPOSED GENERAL LAND USE The Proposed General Land Use Plan designates broad areas of the municipality into functional uses with their respective development regulations. It identifies areas suitable for urban development, agriculture, forestlands, and areas where development must be carefully regulated for conservation and preservation areas. The land capability classification and the soil suitability studies are use as basis in the formulation of the general land use plan.
Based on the sectoral studies and analysis of the existing situation and conditions of the land in Jagna, the land use plan will maintain the structure of the previous plan. The changes will only increase in the built-up area to accommodate the increasing urbanization trend of the municipality and the expected increase in its economic activities, provision of a new eco-tourism zone, sports and institutional zone. The municipality proposes the following land using which is determined based on the sectoral proposals, and it is computed using the standard from the Food and Agriculture Organization (FAO) Model from United Nations and the planning standards (see Table 36 and Figure 12).
Table 36: Proposed General Land Use
Land Use Category Areas (Has.) % to Total Area
Built-up Area 950.00 7.88%
Timberland/Forestland (Protection) 1,863.00 15.44%
Public Land (hilly mountains) 372.55 3.09%
Agricultural:
> Agricultural Production 4,183.63 34.68%
> Production Forest 3,977.32 32.97%
Roads/Other Infra Utilities 505.00 4.19%
Cemetery 6.40 0.05%
Mineral/Quarry 50.00 0.41%
Tourism 2.30 0.02%
River Easement/Buffer Area 80.00 0.66%
Open Space/Parks and Plaza 5.00 0.04%
Socialized Housing 4.00 0.03%
Dumpsite 4.00 0.03%

Volume 1 – Land Use Plan of Jagna 2011-2020 Page - 72
Cockpit 2.00 0.02%
Slaughterhouse 0.20 0.00%
Reclamation Area 7.60 0.06%
Industrial 50.00 0.41%
T o t a l 12,063.00 100.00%
Sources: MTWG-CLUP, Land Area: DENR Land Classification
Built-up Area. Based on the present and future development trend in the municipality, it is expected that the built-up area requirements will increase by 950 hectares 0r 7.88% due to the increase in population and the entry of new investment in the town. The rate of the increase in the urban built-up varies with the rural built-up. The changes are due to areas designated for institutional, residential, industrial and commercial. In the land use plan a 200 meters of the strip of land on both sides of the road and highways are designated as part of the built-up area. This is within the limit allowed under the Strategic Agricultural and Fisheries Zone prepared in the Agricultural and Fisheries Modernization Act. Socialized Housing. The same area of four (4) hectares utilized for socialized housing and it is located in Barangay Canjulao. Agricultural Area. The agricultural area, which includes the grassland, will reduce to (corrected)8,160.95 hectares, which is approximately 67.65 percent of the total land area. The estimated reduction area of 192.44 hectares shall be allocated for agro-processing development, residential, commercial and institutional and some other urban uses. The remaining agricultural area shall be properly preserved and managed to increase the productivity of the farmers in order to have a steady supply of agricultural products in the municipality and in the province in general. Land within the agricultural zone will be devoted mainly to crops production falling within the slope of 0 to 8 percent. Land with 8-18 percent can still be planted to crops but protection measures must be put in place. Timberland or Forestland. The forestland areas of the municipality are mostly within 18 to 50 degrees slope and it should be protected and preserved. The existing forestland area of 1,863 hectares is maintained for ecological balance purposes, and the land use of which will not be changed. The planting of trees for commercial purposes (production forest) shall be required in this zone, which are hilly and mountainous. Mining and Quarrying. The existing quarry and mining activities shall be increased to an area of 50 hectares. The sites are located in barangay Laca, Boctol and Malbog.
Industrial Zone. The presence of its port and the strategic location of the municipality as the end point of the Bohol Circumferential Road and the Bohol Interior Road in the eastern seaboard of the province will contribute to the future growth of the municipality as an alternate growth center in the southeastern part of Bohol. This makes it logical for industrial activities to be developed in the municipality especially in the area of agro-industrialization processing. The proposed area is located in Barangay Tejero with a designated area of 50 hectares. The proposal for mini-industrial estate is in conformity with the Bohol Second District Master Plan and anchored on the overarching development agenda of the province, which is HEAT Bohol and LIFE HELPS. The designated area is not drawn to scale (indicative only) which in the actual site it is outside the rain-induced landslide hazard. However, structural mitigating measures e.g. adoption of hazard-resilient
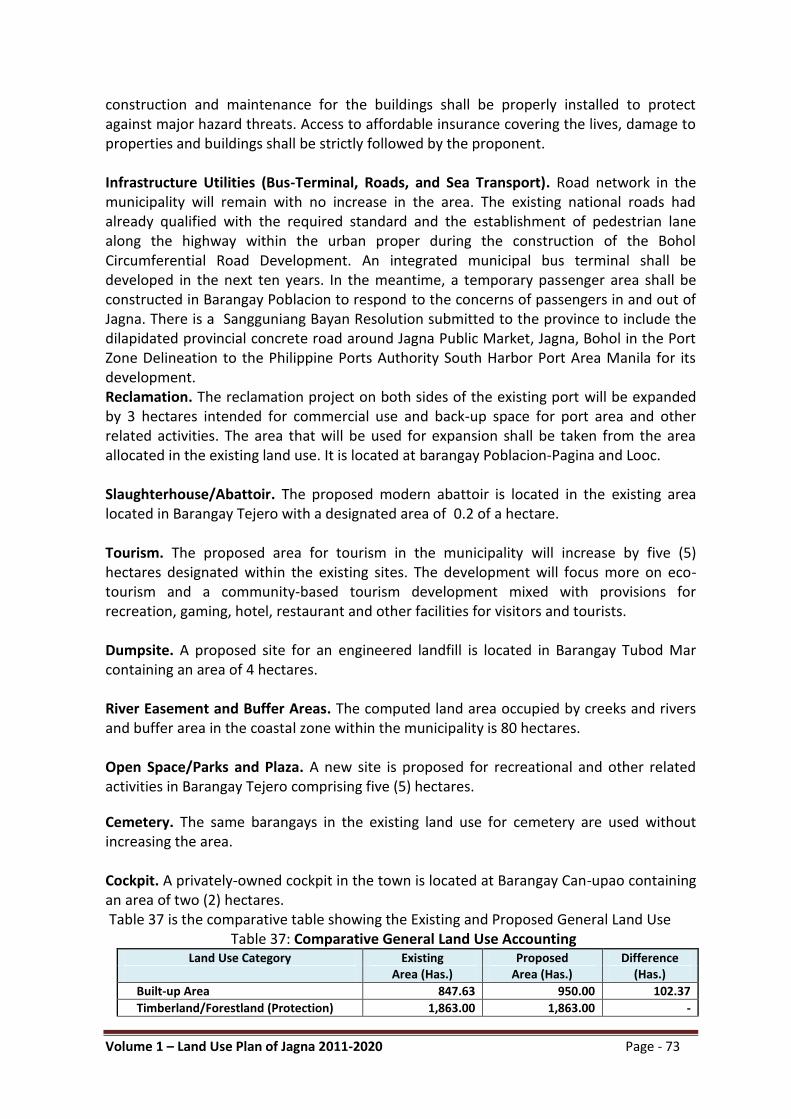
Volume 1 – Land Use Plan of Jagna 2011-2020 Page - 73
construction and maintenance for the buildings shall be properly installed to protect against major hazard threats. Access to affordable insurance covering the lives, damage to properties and buildings shall be strictly followed by the proponent. Infrastructure Utilities (Bus-Terminal, Roads, and Sea Transport). Road network in the municipality will remain with no increase in the area. The existing national roads had already qualified with the required standard and the establishment of pedestrian lane along the highway within the urban proper during the construction of the Bohol Circumferential Road Development. An integrated municipal bus terminal shall be developed in the next ten years. In the meantime, a temporary passenger area shall be constructed in Barangay Poblacion to respond to the concerns of passengers in and out of Jagna. There is a Sangguniang Bayan Resolution submitted to the province to include the dilapidated provincial concrete road around Jagna Public Market, Jagna, Bohol in the Port Zone Delineation to the Philippine Ports Authority South Harbor Port Area Manila for its development. Reclamation. The reclamation project on both sides of the existing port will be expanded by 3 hectares intended for commercial use and back-up space for port area and other related activities. The area that will be used for expansion shall be taken from the area allocated in the existing land use. It is located at barangay Poblacion-Pagina and Looc. Slaughterhouse/Abattoir. The proposed modern abattoir is located in the existing area located in Barangay Tejero with a designated area of 0.2 of a hectare. Tourism. The proposed area for tourism in the municipality will increase by five (5) hectares designated within the existing sites. The development will focus more on eco-tourism and a community-based tourism development mixed with provisions for recreation, gaming, hotel, restaurant and other facilities for visitors and tourists. Dumpsite. A proposed site for an engineered landfill is located in Barangay Tubod Mar containing an area of 4 hectares. River Easement and Buffer Areas. The computed land area occupied by creeks and rivers and buffer area in the coastal zone within the municipality is 80 hectares. Open Space/Parks and Plaza. A new site is proposed for recreational and other related activities in Barangay Tejero comprising five (5) hectares.
Cemetery. The same barangays in the existing land use for cemetery are used without increasing the area. Cockpit. A privately-owned cockpit in the town is located at Barangay Can-upao containing an area of two (2) hectares. Table 37 is the comparative table showing the Existing and Proposed General Land Use
Table 37: Comparative General Land Use Accounting Land Use Category Existing Proposed Difference
Area (Has.) Area (Has.) (Has.)
Built-up Area 847.63 950.00 102.37
Timberland/Forestland (Protection) 1,863.00 1,863.00 -

Volume 1 – Land Use Plan of Jagna 2011-2020 Page - 74
Public Land (hilly mountains) 372.55 372.55 -
Agricultural: -
> Agricultural Production 4,183.63 4,180.93 (2.70)
> Production Forest 4,169.76 3,977.32 (192.44)
Roads/Other Infra Utilities 493.16 505.00 11.84
Cemetery 6.40 6.40 -
Mineral/Quarry 10.00 50.00 40.00
Tourism 2.30 5.00 2.70
River Easement/Buffer Area 80.00 80.00 -
Open Space/Parks and Plaza 2.00 5.00 3.00
Socialized Housing 4.00 4.00 -
Dumpsite 4.00 4.00 -
Cockpit 2.00 2.00 -
Slaughterhouse 0.20 0.20 -
Reclamation Area 7.60 7.60 -
Industrial 14.77 50.00 35.23
T o t a l 12,063.00 12,063.00 0.00
Sources: MTWG-CLUP, Land Area: DENR Land Classification
Figure 12: Proposed General Land Use Map for CY 2012-2021
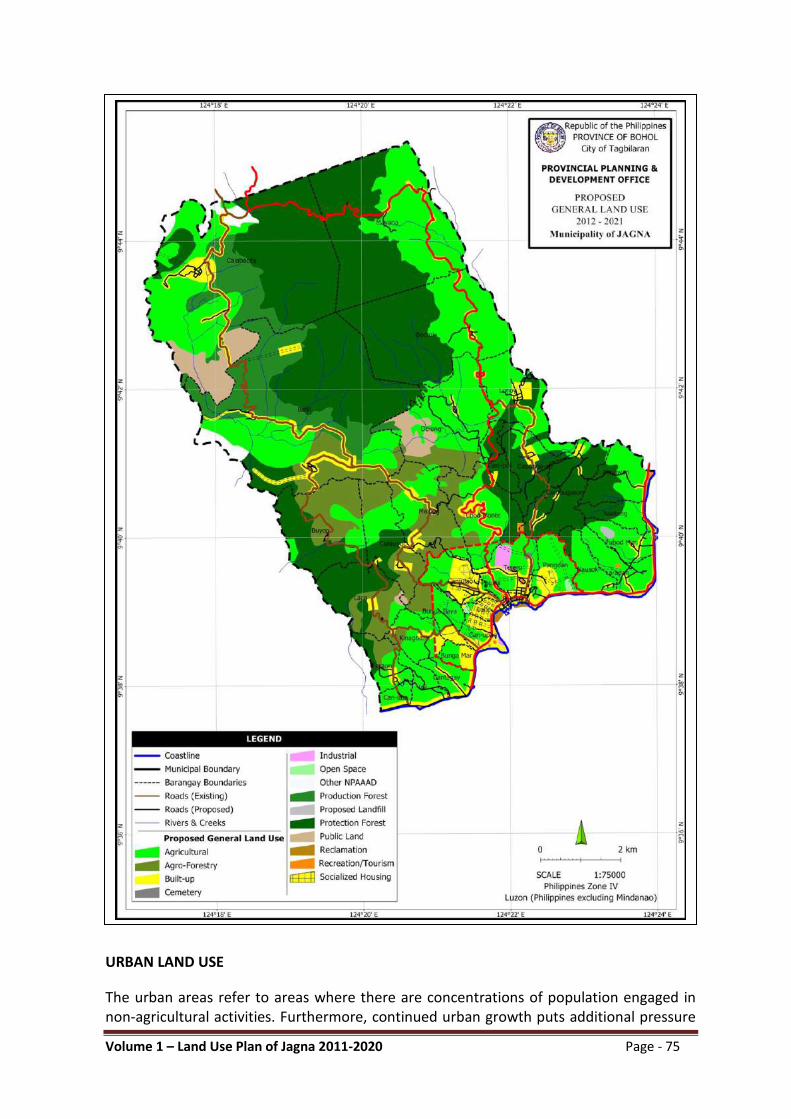
Volume 1 – Land Use Plan of Jagna 2011-2020 Page - 75
URBAN LAND USE
The urban areas refer to areas where there are concentrations of population engaged in non-agricultural activities. Furthermore, continued urban growth puts additional pressure

Volume 1 – Land Use Plan of Jagna 2011-2020 Page - 76
on urban services and utilities. In the urban land use planning, the objectives are generally based on the prescribed land using principles wherein environmental consideration shall be given more emphasis as well as the policies stated affecting the proper use of the land resources.
Existing Urban Land Use
The existing urban land limit in the municipality is designated in the eight (8) barangays with a consolidated area 409.15 hectares or 3.39 percent of the total land area. They are located in the whole area of Barangay Poblacion (57.21 ha); Bunga Mar (48.29ha); Can-upao (54.73ha); Looc (28.73ha); Pagina (20.20ha); and portion of Barangay Canjulao (80ha); Tejero (70ha) and Pangdan (50ha). These areas had always been centered around its public market, the institutional and the port area. The breakdown is clearly illustrated in Table 38 and Figure 13.
Table 38: Existing Urban Land Use Land Use Category Areas (Has.) % to Total Area
Residential 86.93 21.25%
Commercial 25.93 6.34%
Institutional 35.96 8.79%
Industrial 14.77 3.61%
Tourism 2.30 0.56%
Infra Utilities/Roads 60.00 14.66%
Agricultural 165.46 40.44%
Cemeteries 2.00 0.49%
Open Spaces/Parks Plaza 2.00 0.49%
Reclamation 7.60 1.86%
Slaughterhouse 0.20 0.05%
Socialized Housing 4.00 0.98%
Cockpit 2.00 0.49%
T o t a l 409.15 100.00%
Sources: MTWG-CLUP; Land Area: DENR Land Classification
Residential. The area utilized to residential is 86.93 hectares or 21.25% of the urban core in the municipality. Majority of the houses are located and concentrated along the municipal streets, provincial and national roads. Socialized Housing. The municipality has identified a site for socialized housing development. It is located in Barangay Canjulao containing an area of four (4) hectares.
Commercial. The commercial area within the urban core is 25.93 hectares. Commercial activities are concentrated in the public market as a central business district in the town. It is now moving towards other urban barangays following the main municipal road up to the junction of the highway. Mixed residential and commercial uses prevail along the streets adjacent to the main road and very little of the land identified as part of the urban remained not utilized. Agricultural. Agricultural land has a total area of 165.46 hectares or 40.44 % of the total designated urban area in the municipality.

Volume 1 – Land Use Plan of Jagna 2011-2020 Page - 77
Tourism. A consolidated land area of five (2.3) hectares are used for tourism development in the town. Expansion will focus in Barangay Bunga Mar and Can-upao utilizing the same area as indicated.
Open Space/Park and Plaza/Recreation. Parks and recreational area includes the existing municipal plaza, playground and tennis court occupying a total area of two (2) hectares. Institutional. Institutional areas occupy 35.96 hectares. It includes the area occupied by the municipal hall, government offices, churches, convent, health centers, hospital, day care centers, school buildings and other public buildings. Cockpit. The municipal cockpit is located in Barangay Can-upao with an area of 2 hectares.
Roads and other Infra Utilities. The total area for roads and other infra utilities within the urban core is sixty (60) hectares. This includes the national, provincial and municipal roads within the designated eight (8) barangays. Reclamation. The reclamation project is located at Barangay Pagina and Looc with an area of 7.60 hectares where the port area and other business-related activities are situated. Slaughterhouse/Abattoir. The existing slaughterhouse is located in Barangay Tejero with an area of 0.2 of a hectare. Cemetery. There are 3 existing cemeteries located in barangay Tejero with an area of 1.7 hectares.
Figure 13: Existing Urban Land Use Map
Proposed Urban Land Use
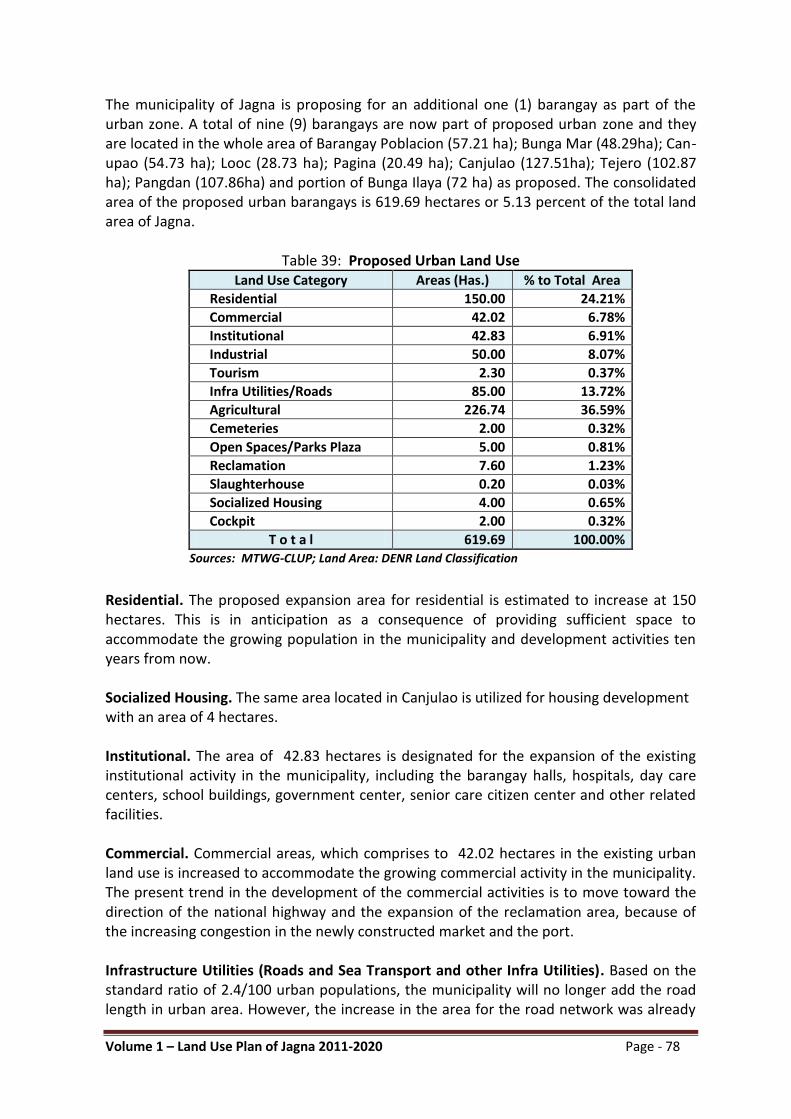
Volume 1 – Land Use Plan of Jagna 2011-2020 Page - 78
The municipality of Jagna is proposing for an additional one (1) barangay as part of the urban zone. A total of nine (9) barangays are now part of proposed urban zone and they are located in the whole area of Barangay Poblacion (57.21 ha); Bunga Mar (48.29ha); Can-upao (54.73 ha); Looc (28.73 ha); Pagina (20.49 ha); Canjulao (127.51ha); Tejero (102.87 ha); Pangdan (107.86ha) and portion of Bunga Ilaya (72 ha) as proposed. The consolidated area of the proposed urban barangays is 619.69 hectares or 5.13 percent of the total land area of Jagna.
Table 39: Proposed Urban Land Use
Land Use Category Areas (Has.) % to Total Area
Residential 150.00 24.21%
Commercial 42.02 6.78%
Institutional 42.83 6.91%
Industrial 50.00 8.07%
Tourism 2.30 0.37%
Infra Utilities/Roads 85.00 13.72%
Agricultural 226.74 36.59%
Cemeteries 2.00 0.32%
Open Spaces/Parks Plaza 5.00 0.81%
Reclamation 7.60 1.23%
Slaughterhouse 0.20 0.03%
Socialized Housing 4.00 0.65%
Cockpit 2.00 0.32%
T o t a l 619.69 100.00% Sources: MTWG-CLUP; Land Area: DENR Land Classification
Residential. The proposed expansion area for residential is estimated to increase at 150 hectares. This is in anticipation as a consequence of providing sufficient space to accommodate the growing population in the municipality and development activities ten years from now. Socialized Housing. The same area located in Canjulao is utilized for housing development with an area of 4 hectares. Institutional. The area of 42.83 hectares is designated for the expansion of the existing institutional activity in the municipality, including the barangay halls, hospitals, day care centers, school buildings, government center, senior care citizen center and other related facilities. Commercial. Commercial areas, which comprises to 42.02 hectares in the existing urban land use is increased to accommodate the growing commercial activity in the municipality. The present trend in the development of the commercial activities is to move toward the direction of the national highway and the expansion of the reclamation area, because of the increasing congestion in the newly constructed market and the port. Infrastructure Utilities (Roads and Sea Transport and other Infra Utilities). Based on the standard ratio of 2.4/100 urban populations, the municipality will no longer add the road length in urban area. However, the increase in the area for the road network was already

Volume 1 – Land Use Plan of Jagna 2011-2020 Page - 79
computed in consideration of the road setback, based on the standard that shall be followed including the allocation of pedestrian lanes within the urban zone along the national highway during the implementation of the circumferential road. It is anticipated in order to prevent the occurrence of road accidents and to regulate the traffic flow. The total area used for road development is 85 hectares. Slaughterhouse. The area allocated for the establishment of modern abattoir is 0.2 hectare located in Barangay Tejero. Agricultural. Agricultural areas will increase to 226.74 hectares, due to the increase of the number of barangays for the urban expansion. Parks/Plaza/Recreation. Outside of commercial, institutional and residential areas, the municipality designated an additional area of five (5) hectares in Barangay Tejero for a common use as recreation, which includes parks and playground. Cemeteries. The 2 hectares cemetery is located in Barangay Tejero and Bunga Ilaya with no plan for expansion.
Tourism. Expansion for tourism development in the town will soon to be identified. Industrial Zone. Mini Industrial zone is proposed at Barangay Tejero with an area of 50 hectares.
Table 40: Comparative Urban Land Use (Existing and Proposed) Land Use Category Existing Proposed Difference
Area (Has.) Area (Has.) (Has.)
Residential 86.93 150.00 63.07
Commercial 25.93 42.02 16.09
Institutional 35.96 42.83 6.87
Industrial 14.77 50.00 35.23
Tourism 2.30 2.30 -
Infra Utilities/Roads 60.00 85.00 25.00
Agricultural 165.46 226.74 61.28
Cemeteries 2.00 2.00 -
Open Spaces/Parks Plaza 2.00 5.00 3.00
Reclamation 7.60 7.60 -
Slaughterhouse 0.20 0.20 -
Socialized Housing 4.00 4.00 -
Cockpit 2.00 2.00 -
T o t a l 409.15 619.69 210.54
Sources: MTWG-CLUP; Land Area: DENR Land Classification

Volume 1 – Land Use Plan of Jagna 2011-2020 Page - 80
Figure 14: Proposed Urban Land Use of Jagna
Sectoral Policies
I. Settlement Policies
To guide the implementation of this comprehensive land use plan the following policies are hereby laid down. As a general policy, all settlements, whether Poblacion/Sub-centers or rural barangays, shall enjoy the same quantity and quality of services from the local government unit. a) Central Business District is located in the Poblacion,Pagin, Looc and Can-upao. As the
hub of activity, its standard of living will be greatly lifted through enhanced accessibility, physical features and quality of basic services. In cases of conflict in uses between agriculture and urban expansion, greater weight must be given to agriculture. Zoning Ordinance must identify proposed land uses and standards in the urban areas such as residential, commercial, industrial and institutional.
b) One sub-business district is strategically located in barangay Canjulao, Tejero and
Tubod Monte. It should be planned according to sound principles of site planning and sub-urban design. This sub-business district must complement the role of the central

Volume 1 – Land Use Plan of Jagna 2011-2020 Page - 81
business district and as such shall serve as catchment area for agriculture service-type of activities for a definite cluster of barangays.
II. Protection Land Use Policies The principle in protection land use is sustainability towards the creation of ecologically balanced communities. Lands and coastal areas whose use must be protected can be declared as lands under full protection and regulation. In the implementation of this policy, the participation of women and men shall be ensured in the planning and decision making process particularly in the identified protection areas (land and coastal). Among these areas declared are the following:
a) Network of Protected Areas for Agriculture and Agro-processing Development (NAPAAD): a.1. Rice production areas located in barangays Alejawan, Naatang, Looc, Bunga
Ilaya, Tejero, and part of Canjulao, Boctol, Lonoy, Cambugason,Cabungaan, Odiong, Mayana, Balili and Calabacita.
a.2 All irrigable areas in Barangay Alejawan, Boctol, Lonoy, Cabungaan, Cambugason and Balili.
b) Protected Areas
b.1 NIPAS located in barangays Lonoy, Odiong, Boctol and Mayana. b.2 All established marine protected areas with sanctuaries in coastal barangays
Can-uba, Ipil, Cantagay, Bunga Mar, Pangdan, Nausok, Tubod Mar, Larapan and Naatang.
b.3 Upland barangays with 50% slope
c) River Easement and Buffers c.1 Easement of 40 meters from bank of rivers traversing forest areas c.2 Easement of 20 meters from bank of rivers traversing agricultural areas c.3 Easement of 3 meters from bank of rivers traversing built-up areas
d) Environmentally Constrained Areas prone to natural hazards like flooding, earthquake, rain-induced landslide, tsunami and liquefaction as shown in Table 41. Table 41:Natural Hazards/Disaster Prone Areas
Type of Natural Hazards
Location Remarks
1. Flood prone Alejawan, Bunga Mar, Cabungaan, Can-upao, Looc, Naatang, Pagina, Poblacion, Tejero
2. Rain-Induced Landslide
Faraon, Bunga Ilaya, Canjulao, Tejero, Pangdan, Cambugason, Naatang, Alejawan, Can-ipol, Cabungaan, Laca, Balili, Lonoy Tubod Monte, Cantuyoc, Ipil, Boctol, Malbog, Odiong, Nausok, Calabacita, Mayana
Highly susceptible to rain-induced landslide

Volume 1 – Land Use Plan of Jagna 2011-2020 Page - 82
Bunga Ilaya, Pangdan, Alejawan, Cambugason, Cabungaan
Prone to landslide accumulation
3. Tsunami Can-uba, Ipil, Cantagay, Bunga Mar, Bunga Ilaya, Can-upao, Looc, Poblacion, Pagina, Tejero, Pangdan, Alejawan, Naatang
4. Liquefaction Can-uba, Ipil, Cantagay, Bunga Mar, Bunga Ilaya, Can-upao, Looc, Poblacion, Pagina, Tejero, Cambugason, Alejawan, Naatang, Pangdan
Highly susceptible to liquefaction
5. Storm Surges Tejero, Poblacion, Pagina, Looc Inundations of 4-12 meters
Poblacion, Pagina, Looc, Can-upao, Bunga Mar, Cantagay, Ipil
Inundations of 1-4 meters
Source: Administrative, NAMRIA, PHIVOLCS-DOST, OCD (READY Project) e) Environmentally Critical Areas. These areas shall be planned carefully where non-
suitable land uses should not be allowed in the identified watershed area.
III. Production Land Use Policies
The principle behind the use of production land is to optimize the production towards an increase in economic activity involving men and women, ushering a better life for the constituents. In the next ten years, planned production and marketing will be improved and enhanced in the agriculture sector. Program and projects shall be identified and developed for the non-agricultural sector for better economy of Jagna. Detailed studies on the suitability of crops, tree species, fish species and livestock raising should be undertaken immediately. Areas for multi-storey cropping and coconut farms, production forests, rice, fruits, rootcrops and vegetables catchment should be identified and developed. Tourist destination in barangays Poblacion, Cabungaan, Boctol, Odiong, Cantuyoc, Mayana, Can-uba,Cantagay Larapan, Tubod Mar, Lonoy, and Malbog shall be developed that would create job employment and maintain ecological balance development. Special Economic Zone (medium and light industries) shall be established in barangay Tejero.
IV. Infrastructure Policies The first policy objective is to support the production activities through irrigation, maintenance and improvement of existing facilities and construction of new irrigation system to irrigate the rice production areas in the municipality. Furthermore, it encourages the development of common service facilities for production, agro-processing , harvesting, marketing and storage facilities both for farming and fishing and agro-processing activities engaged by women and men. Production and distribution of organic fertilizers shall be promoted and prioritized to ensure sustainability of agricultural production without generating negative impacts to the environment. Communication and transportation

Volume 1 – Land Use Plan of Jagna 2011-2020 Page - 83
network should be improved as well as power and water supply. Inter-barangay road access should have a regular budget for the maintenance and improvement of all farm-to-market roads. To raise the general welfare of the people, waste management system should be established, potable and safe water supply shall be developed in all barangays as well as fire and safety protection facilities shall be improved and upgraded. V. Disaster Risk Reduction Management and Climate Change Adaptation (DRRM-CCA) Sensitive Land Use Policies
On Settlements: Vulnerable settlements particularly where there is the presence of a significant
number belonging to the vulnerable groups that cannot be relocated shall have an
operational community-based disaster management plan. Ensure that women and
other vulnerable groups are involved in the Hazard Vulnerability and Capacity
Assessment (HVCA) mapping and in the formulation of the disaster management
planning as well as in the conduct of Damage Assessment & Needs Assessment
(DANA) to ensure that their particular situation and specific needs are considered.
Residential use shall enjoy priority over all other uses in the allocation of hazard-
free areas.
Restrict or discourage development in hazard-prone areas.
Hazard-exposed settlements, urban and rural shall be located to safe areas.
Vulnerable settlements that cannot be relocated shall have an operational community-based disaster management plan.
Multi-storey dwellings shall be sited in safe areas determined by scientific studies, and for evacuation purposes during floods.
Limit development in environmentally sensitive areas such as steep slopes.
Regular monitoring and evaluation of structurally quality of dwellings shall be established in the municipality.
On Infrastructures:
Properly sited and designed so as not to become source of anthropogenic hazards themselves.
Minimized exposure to geo-hydrological hazards.
Volume 1 – Land Use Plan of Jagna 2011-2020 Page - 84
Retrofit old structures for adaptive reuse to preserve their historical or heritage value.
Establish civil works that assist nature to rehabilitate itself or to maintain its own integrity.
On Production Areas:
Industrial and commercial activities shall be properly located considering their potential traffic generation and pollution impact.
Strict zoning regulation shall be enforced on livestock and piggery houses located in residential areas.
Contour tillage and similar sustainable practices shall be strictly enforced among sloping land cultivators.
The effects of agricultural chemical residues shall be monitored and regulated.
Environmental impact rather than potential revenue shall be the primary consideration in granting permits for small-scale mining and quarrying.
Tourism projects shall be evaluated equally for their income generation potential as for the environmental degradation, displacement of local residents, and moral corruption that usually accompany these projects.
On Protection Areas:
Liberal allocation of open space in heavily populated areas shall be used as a vulnerability-reduction measure.
Encourage the maintenance of greenery in public and private lots not only for amenity but for its carbon sequestration function.
Environmentally critical and hazardous areas shall be properly demarcated and buffered.
The ecological function shall be paramount over economic and other considerations when allowing the use of protected areas
On Health and Well Being (including Human capital): Access to minimum standards in disaster response as set forth in the Humanitarian Charter including need for water, sanitation, nutrition, food, shelter, clothing, healthcare and others.
Physical ability to labor and good health maintained in normal times through adequate food and nutrition, hygiene and health care.

Volume 1 – Land Use Plan of Jagna 2011-2020 Page - 85
Food supplies and nutritional status secure (e.g. through reserve stocks of grain and other staple foods managed by communities, with equitable distribution system during food crises).
Access to sufficient quantity and quality of water for domestic needs during crises.
Community structures and culture support self confidence and can assist management of psychological consequences of disasters (trauma, PTSD).
Community health care facilities and health workers, equipped and trained to respond to physical and mental health consequences of disasters and lesser hazard events, and supported by access to emergency health services, medicines, etc.
On Sustainable Livelihoods
High level of economic activity and employment particularly among the vulnerable groups (ensuring that women have sustainable livelihood and income by providing them with skills training and inputs).
Equitable distribution of wealth and livelihood assets in community
Livelihood diversification (household and community level), including on-farm and off-farm activities in rural areas
Adoption of hazard-resistant agricultural practices (e.g. soil and water conservation methods, cropping patterns geared to low or variable rainfall, hazard-tolerant crops) for food security
Enterprises have business protection and continuity/recovery plans by including risk register management particularly of micro-enterprises
Local trade and transport links with markets for products, labor and services protected against hazards and other external shocks
On Physical Protection, Structural and Technical Measures
Community decisions and planning regarding built environment take potential natural hazard risks into account (including potential for increasing risks through interference with ecological, hydrological, geological systems) and vulnerabilities of different groups.
Security of land ownership/tenancy rights. Low/minimal level of homelessness and landlessness.
Safe locations: community members and facilities (homes, workplaces, public and social facilities) not exposed to hazards in high-risk areas and/or relocated away from unsafe sites.

Volume 1 – Land Use Plan of Jagna 2011-2020 Page - 86
Structural mitigation measures (embankments, flood diversion channels, water harvesting tanks, etc.) in place to protect against major hazard threats, built using local labor, skills, materials and appropriate technologies as far as possible.
Knowledge and take-up of building codes/regulations throughout community.
Adoption of hazard-resilient construction and maintenance practices for homes and community facilities using local labor, skills, materials and appropriate technologies as far as possible
Community capacities and skills to build, retrofit and maintain structures (technical and organizational).
Adoption of physical measures to protect items of domestic property (e.g. raised internal platforms and storage as flood mitigation measure, portable stoves) and productive assets (e.g. livestock shelters).
Adoption of short-term protective measures against impending events (e.g. emergency protection of doors/windows from cyclone winds)
Infrastructure and public facilities to support emergency management needs (e.g. shelters, secure evacuation and emergency supply routes). In appropriate cases, provide a separate center for women and their children at the maximum, or bath and toilet facilities and needed privacy for women, girl-child are provided for at the minimum. An emergency response for women and vulnerable groups shall be designed to include search and rescue operations, evacuation management and rehabilitation plans.
Resilient and accessible critical facilities (e.g. health centers, hospitals, police and fire stations - in terms of structural resilience, back-up systems, etc.)
Resilient transport/service infrastructure and connections (roads, paths, bridges, water supplies, sanitation, power lines, communications, etc.)
VI. Implementation Strategy The Comprehensive Land Use Plan is a document that will serve as a guide and reference by the Local Government Unit that will focus on priority areas of concern for detailed development and policy-making. It needs to be translated into a number of implementation documents, which are described below: A) Zoning Plan and Ordinance. This document shall cover the entire territorial jurisdiction
of the municipality both urban and rural barangays. Regulations pertaining to urban areas should not be limited to the nine (9) barangays of Poblacion, Bunga Mar, Can-upao, Looc, Pagina, Canjulao, Tejero, Pangdan and portion of Bunga Ilaya. There should be adequate protection of prime agricultural lands from premature or unnecessary conversion to urban uses.

Volume 1 – Land Use Plan of Jagna 2011-2020 Page - 87
B) Local Development Investment Program (LDIP). The LDIP implements the various project components of the comprehensive development plan. It will be borne by the public and private sectors. Private sectors investments are regulated by legislations enacted by the Sangguniang Bayan. The public sector is represented in the LDIP. The MDC is responsible for producing this document.
C) Sectoral Studies on the 5-Major Development Sectors (Comprehensive Development Plan). This is a ten-year socio-economic plan, which becomes the plan of the Local Government Unit of Jagna. It is composed of the five major development sectors: social development sector, economic, environmental management, infrastructure and development administration sector.
D) Monitoring and Evaluation. Monitoring and evaluation are essential in the implementation of the plan. The evaluation could be in-house from the MPDC or a team or an outsider who has proven expertise in specific fields that could identify impacts or outcomes or even identify gaps/causes and effects like changes in the socio-economic well being of the municipality, changes in land uses and the physical environment and changes in the institutional capability of the Local Government Unit in the areas of good governance and development work. The LGU shall institutionalize the Monitoring and Evaluation System. Feedback information of monitoring data shall be used for the revision needed of the long-term plan and for the formulation of the short-term or medium-term plans.