voltage jump switching shunts - miem energinet... · hvdc rampingwithoutcentral power plants 400...
TRANSCRIPT
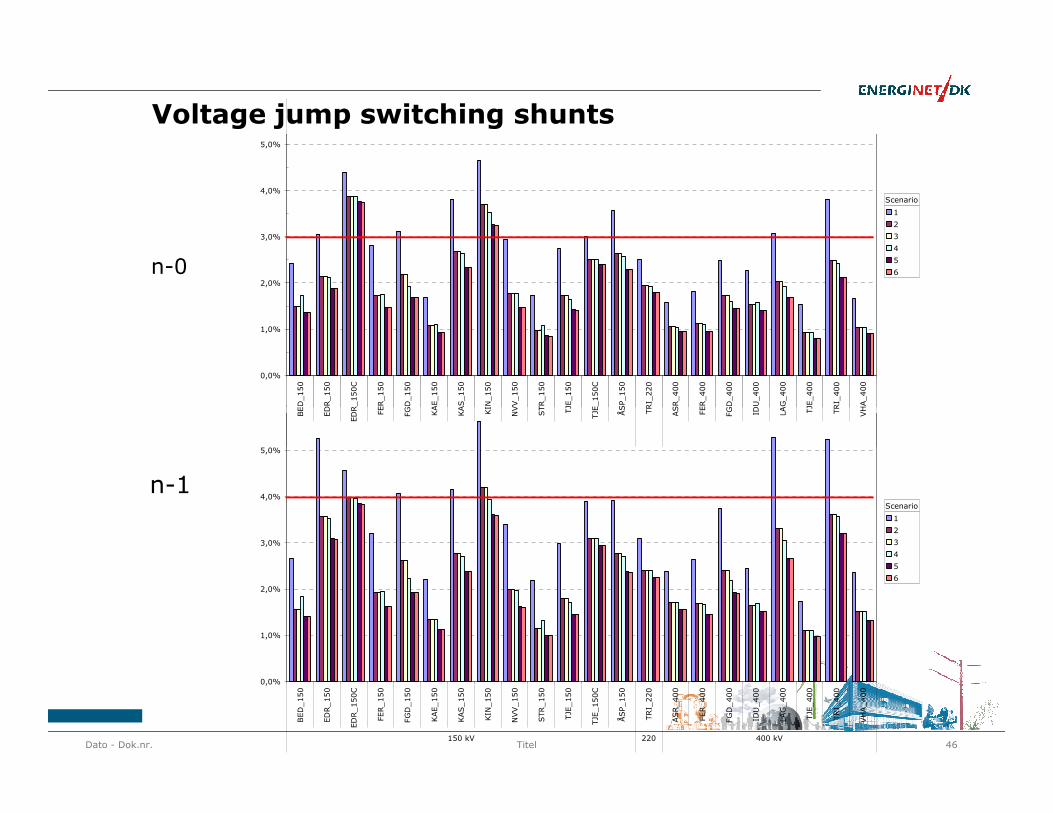
Voltage jump switching shunts
0,0%
1,0%
2,0%
3,0%
4,0%
5,0%
BE
D_
15
0
ED
R_
15
0
ED
R_
15
0C
FER
_1
50
FGD
_1
50
KA
E_
15
0
KA
S_
15
0
KIN
_1
50
NV
V_
15
0
STR
_1
50
TJE
_1
50
TJE
_1
50
C
ÅS
P_1
50
TR
I_2
20
AS
R_
40
0
FER
_4
00
FGD
_4
00
IDU
_4
00
LAG
_4
00
TJE
_4
00
TR
I_4
00
VH
A_
40
0
1
2
3
4
5
6
Scenario
n-0
Dato - Dok.nr. 46Titel
0,0%
1,0%
2,0%
3,0%
4,0%
5,0%
BE
D_
15
0
ED
R_
15
0
ED
R_
15
0C
FER
_1
50
FGD
_1
50
KA
E_
15
0
KA
S_
15
0
KIN
_1
50
NV
V_
15
0
STR
_1
50
TJE
_1
50
TJE
_1
50
C
ÅS
P_1
50
TR
I_2
20
AS
R_
40
0
FER
_4
00
FGD
_4
00
IDU
_4
00
LAG
_4
00
TJE
_4
00
TR
I_4
00
VH
A_
40
0
150 kV 220kV
400 kV
1
2
3
4
5
6
Scenario
BE
D_
15
0
ED
R_
15
0
ED
R_
15
0C
FER
_1
50
FGD
_1
50
KA
E_
15
0
KA
S_
15
0
KIN
_1
50
NV
V_
15
0
STR
_1
50
TJE
_1
50
TJE
_1
50
C
ÅS
P_1
50
TR
I_2
20
AS
R_
40
0
FER
_4
00
FGD
_4
00
IDU
_4
00
LAG
_4
00
TJE
_4
00
TR
I_4
00
VH
A_
40
0
n-1
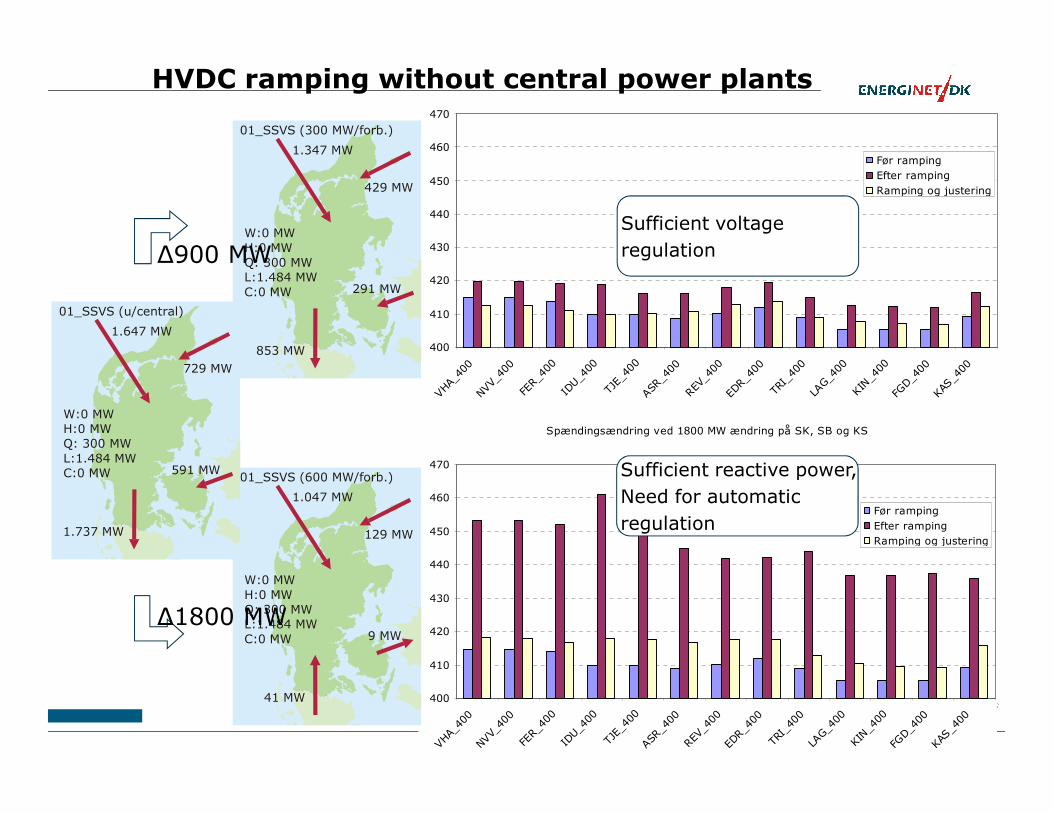
HVDC ramping without central power plants
400
410
420
430
440
450
460
470
VHA_400NVV_400FE
R_400ID
U_400TJE
_400ASR_400REV_400EDR_400
TRI_400
LAG_400
KIN_400
FGD_400
KAS_400
Før rampingEfter rampingRamping og justering
853 MW
291 MW
1.347 MW
01_SSVS (300 MW/forb.)
W:0 MWH:0 MWQ: 300 MWL:1.484 MWC:0 MW
429 MW
1.647 MW
01_SSVS (u/central)
W:0 MW
729 MW
Sufficient voltage regulation∆900 MW
47Dok.nr. 23175-11
Spændingsændring ved 1800 MW ændring på SK, SB og KS
400
410
420
430
440
450
460
470
VHA_400NVV_400FE
R_400ID
U_400TJE
_400ASR_400REV_400EDR_400TRI_
400LA
G_400KIN
_400FG
D_400KAS_400
Før rampingEfter rampingRamping og justering
41 MW
9 MW
1.047 MW
01_SSVS (600 MW/forb.)
W:0 MWH:0 MWQ: 300 MWL:1.484 MWC:0 MW
129 MW1.737 MW
591 MW
W:0 MWH:0 MWQ: 300 MWL:1.484 MWC:0 MW
∆1800 MW
Sufficient reactive power,Need for automaticregulation
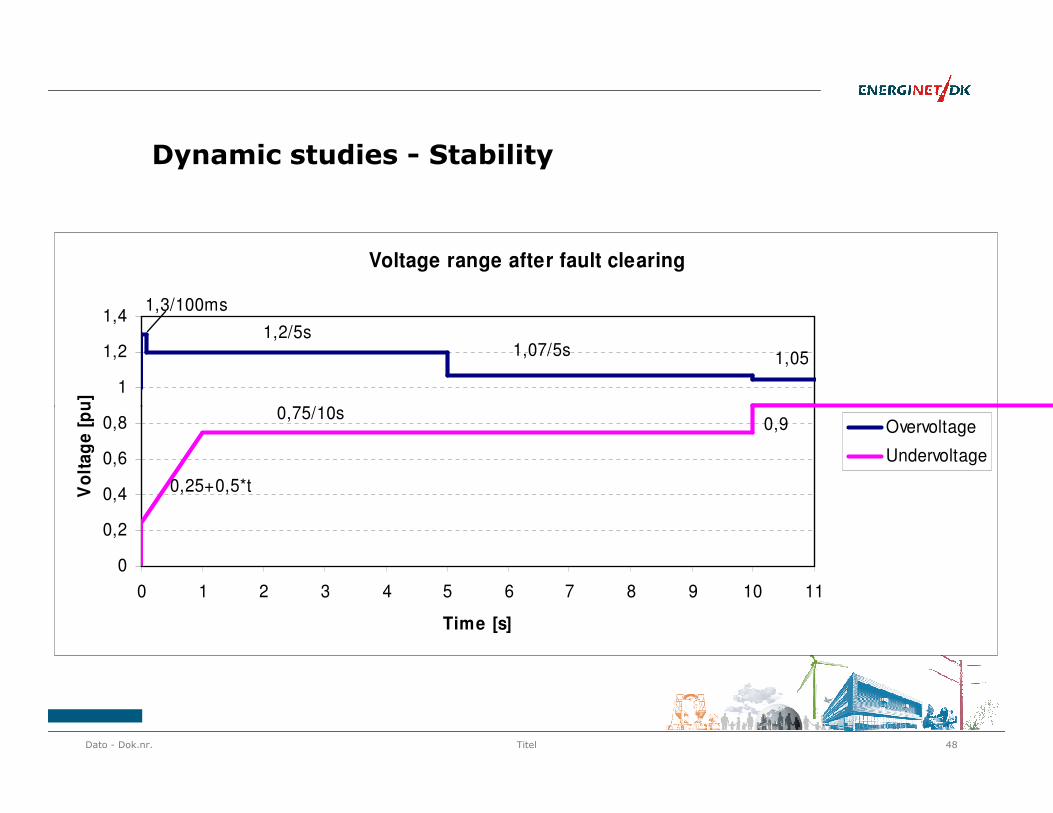
Dynamic studies - Stability
Voltage range after fault clearing
1
1,2
1,4
Vo
lta
ge
[p
u]
1,3/100ms
1,2/5s1,07/5s 1,05
0,75/10s
Dato - Dok.nr. 48Titel
0
0,2
0,4
0,6
0,8
0 1 2 3 4 5 6 7 8 9 10 11
Time [s]
Vo
lta
ge
[p
u]
Overvoltage
Undervoltage
0,25+0,5*t
0,75/10s0,9
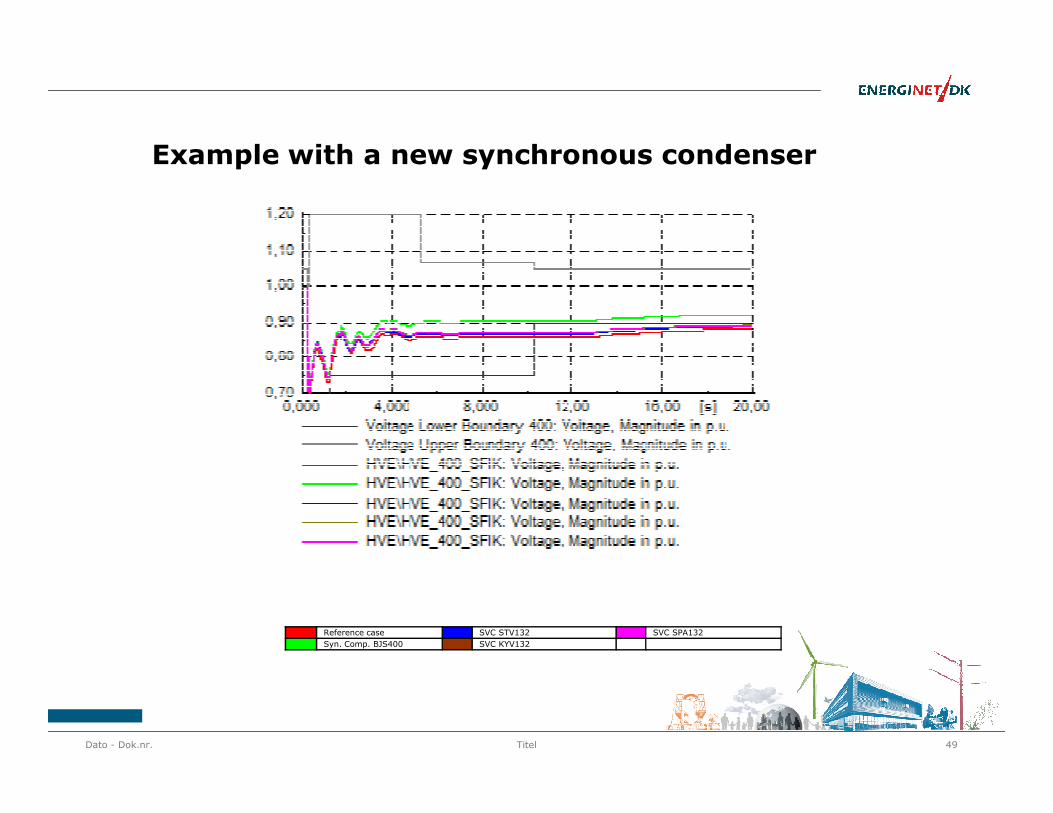
Example with a new synchronous condenser
Dato - Dok.nr. 49Titel
Reference case SVC STV132 SVC SPA132Syn. Comp. BJS400 SVC KYV132
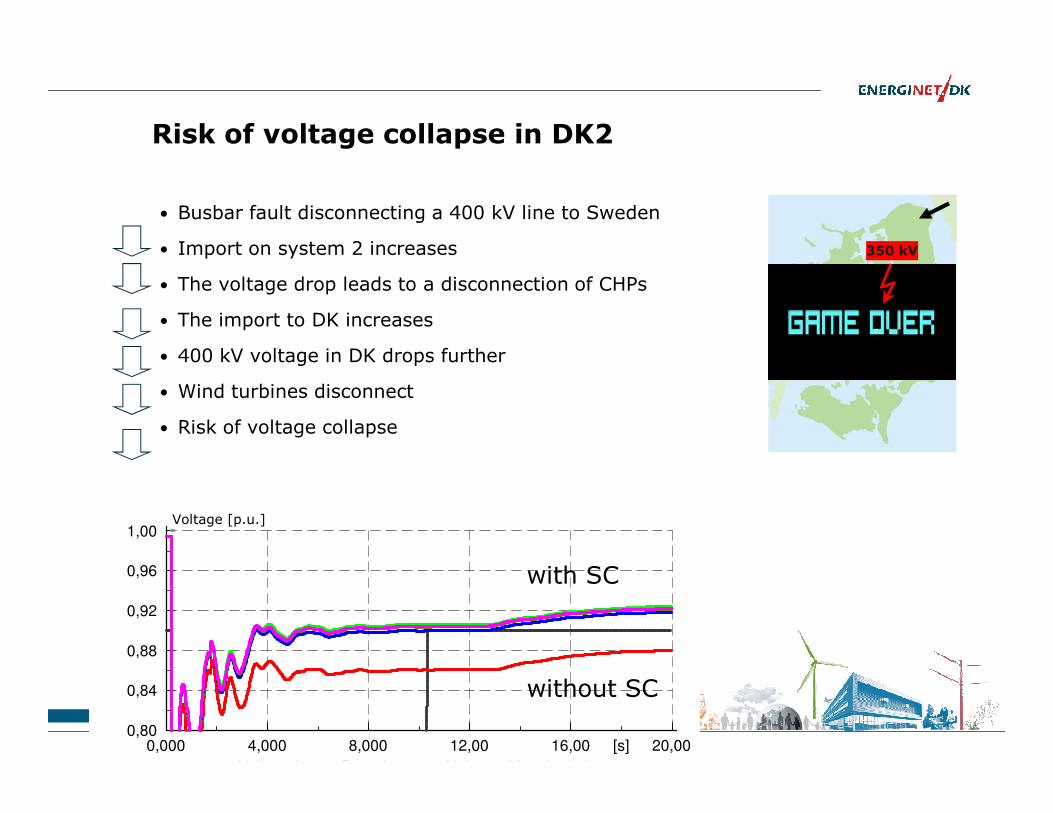
Risk of voltage collapse in DK2
• Busbar fault disconnecting a 400 kV line to Sweden
• Import on system 2 increases
• The voltage drop leads to a disconnection of CHPs
• The import to DK increases
• 400 kV voltage in DK drops further
• Wind turbines disconnect
415 kV390 kV350 kV
• Risk of voltage collapse
20,0016,0012,008,0004,0000,000 [s]
1,00
0,96
0,92
0,88
0,84
0,80
Voltage Lower Boundary 400: Voltage, Magnitude in p.u.
without SC
with SC
Voltage [p.u.]
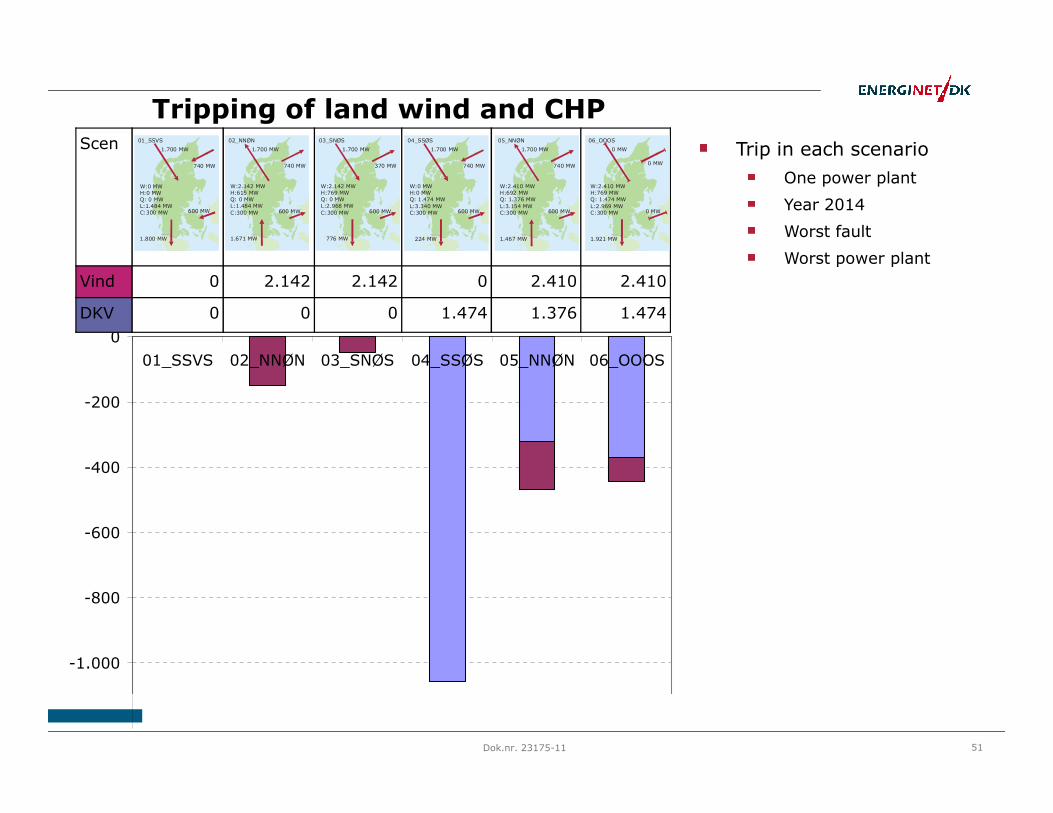
Tripping of land wind and CHP
-200
0
01_SSVS 02_NNØN 03_SNØS 04_SSØS 05_NNØN 06_OOOS
Scen 01 02 03 03 05 06
Vind 0 2.142 2.142 0 2.410 2.410
DKV 0 0 0 1.474 1.376 1.474
1.800 MW
600 MW
740 MW
1.700 MW
01_SSVS
W:0 MWH:0 MWQ: 0 MWL:1.484 MWC:300 MW
1.800 MW
600 MW
740 MW
1.700 MW
01_SSVS
W:0 MWH:0 MWQ: 0 MWL:1.484 MWC:300 MW
1.671 MW
600 MW
1.700 MW
02_NNØN
W:2.142 MWH:615 MWQ: 0 MWL:1.484 MWC:300 MW
740 MW
1.671 MW
600 MW
1.700 MW
02_NNØN
W:2.142 MWH:615 MWQ: 0 MWL:1.484 MWC:300 MW
740 MW
776 MW
600 MW
1.700 MW
03_SNØS
W:2.142 MWH:769 MWQ: 0 MWL:2.968 MWC:300 MW
370 MW
776 MW
600 MW
1.700 MW
03_SNØS
W:2.142 MWH:769 MWQ: 0 MWL:2.968 MWC:300 MW
370 MW
224 MW
600 MW
1.700 MW
04_SSØS
W:0 MWH:0 MWQ: 1.474 MWL:3.340 MWC:300 MW
740 MW
224 MW
600 MW
1.700 MW
04_SSØS
W:0 MWH:0 MWQ: 1.474 MWL:3.340 MWC:300 MW
740 MW
1.467 MW
600 MW
1.700 MW
05_NNØN
W:2.410 MWH:692 MWQ: 1.376 MWL:3.154 MWC:300 MW
740 MW
1.467 MW
600 MW
1.700 MW
05_NNØN
W:2.410 MWH:692 MWQ: 1.376 MWL:3.154 MWC:300 MW
740 MW 0 MW
1.921 MW
0 MW
0 MW
06_OOOS
W:2.410 MWH:769 MWQ: 1.474 MWL:2.969 MWC:300 MW
0 MW
1.921 MW
0 MW
0 MW
06_OOOS
W:2.410 MWH:769 MWQ: 1.474 MWL:2.969 MWC:300 MW
Trip in each scenarioOne power plant
Year 2014
Worst fault
Worst power plant
51Dok.nr. 23175-11
-1.000
-800
-600
-400
-200
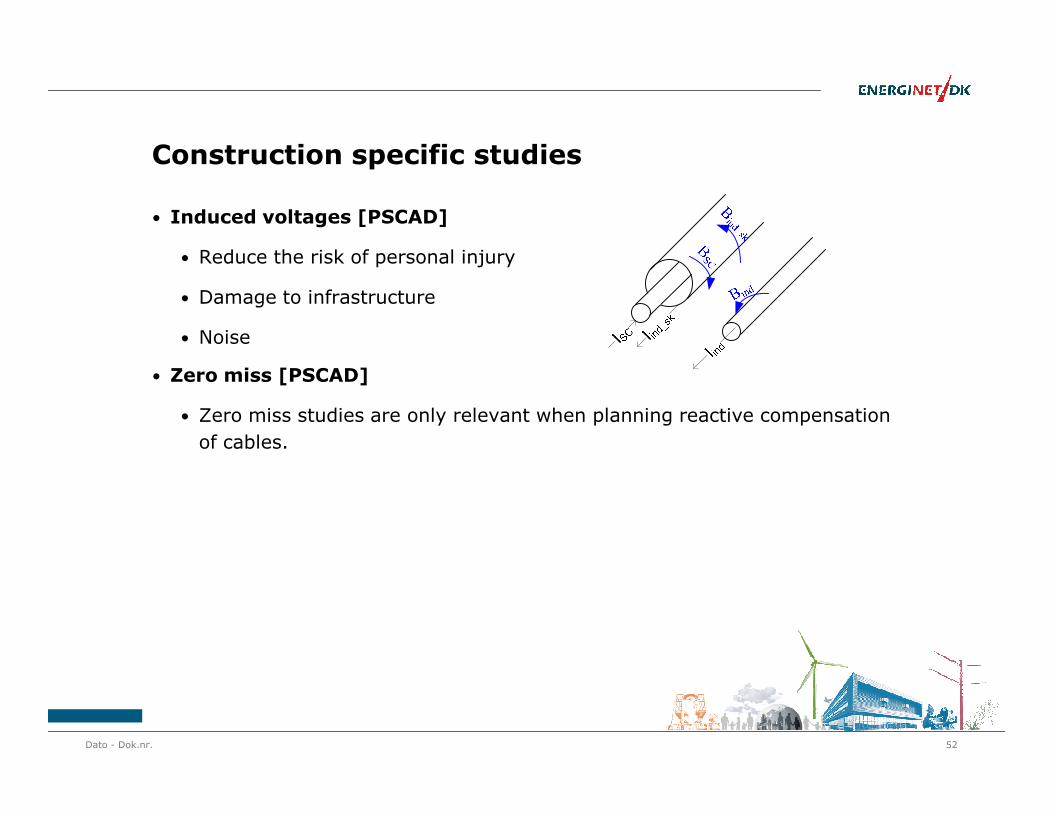
Construction specific studies
• Induced voltages [PSCAD]
• Reduce the risk of personal injury
• Damage to infrastructure
• Noise
• Zero miss [PSCAD]
• Zero miss studies are only relevant when planning reactive compensation • Zero miss studies are only relevant when planning reactive compensation of cables.
Dato - Dok.nr. 52
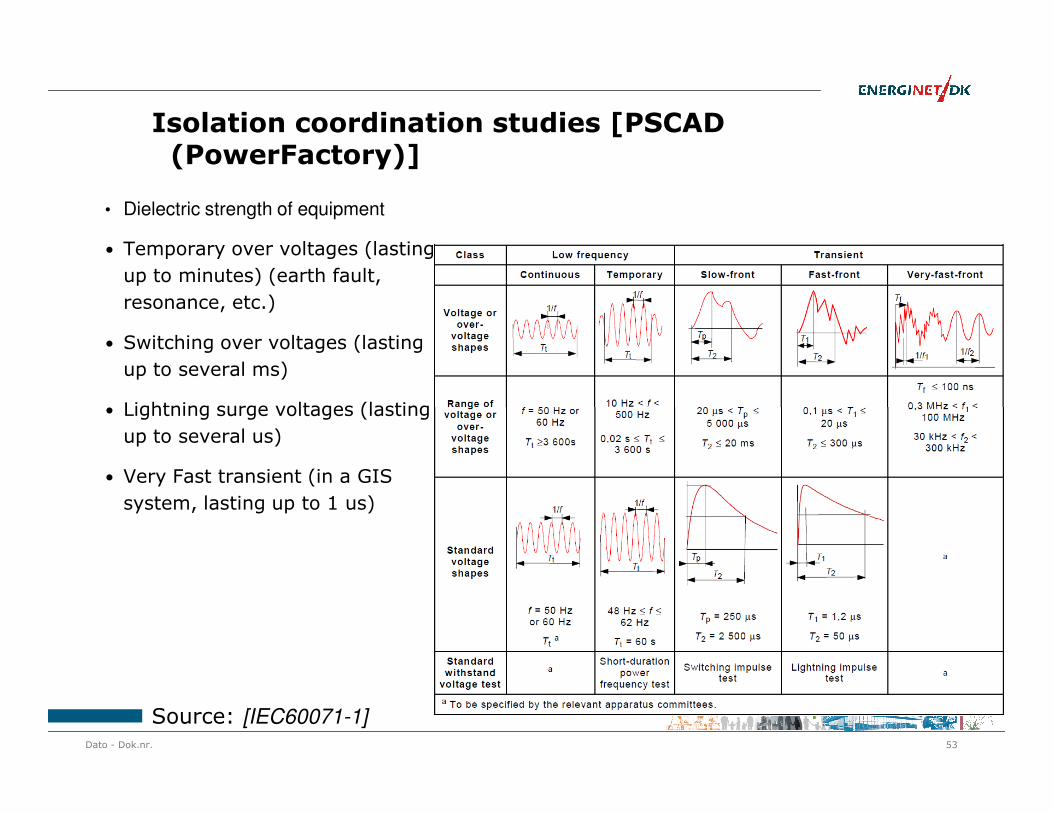
Isolation coordination studies [PSCAD (PowerFactory)]
• Dielectric strength of equipment
• Temporary over voltages (lasting up to minutes) (earth fault, resonance, etc.)
• Switching over voltages (lasting up to several ms)
• Lightning surge voltages (lasting • Lightning surge voltages (lasting up to several us)
• Very Fast transient (in a GIS system, lasting up to 1 us)
Dato - Dok.nr. 53
Source: [IEC60071-1]
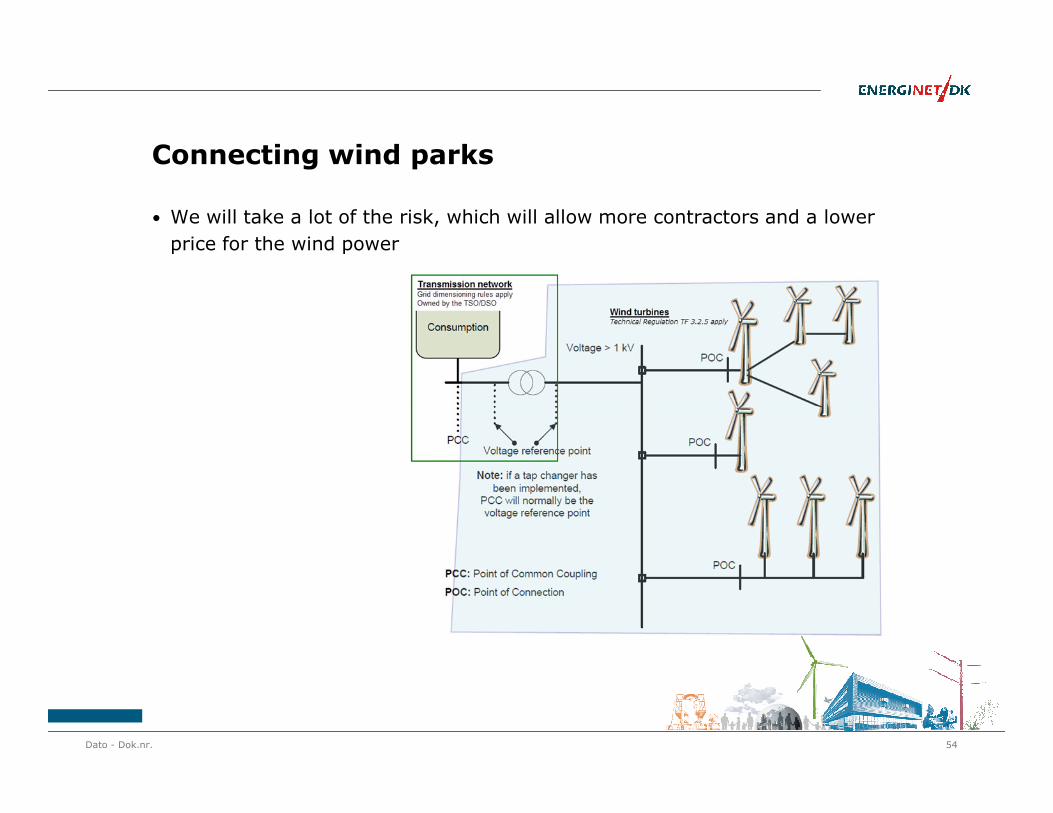
Connecting wind parks
• We will take a lot of the risk, which will allow more contractors and a lower price for the wind power
Dato - Dok.nr. 54
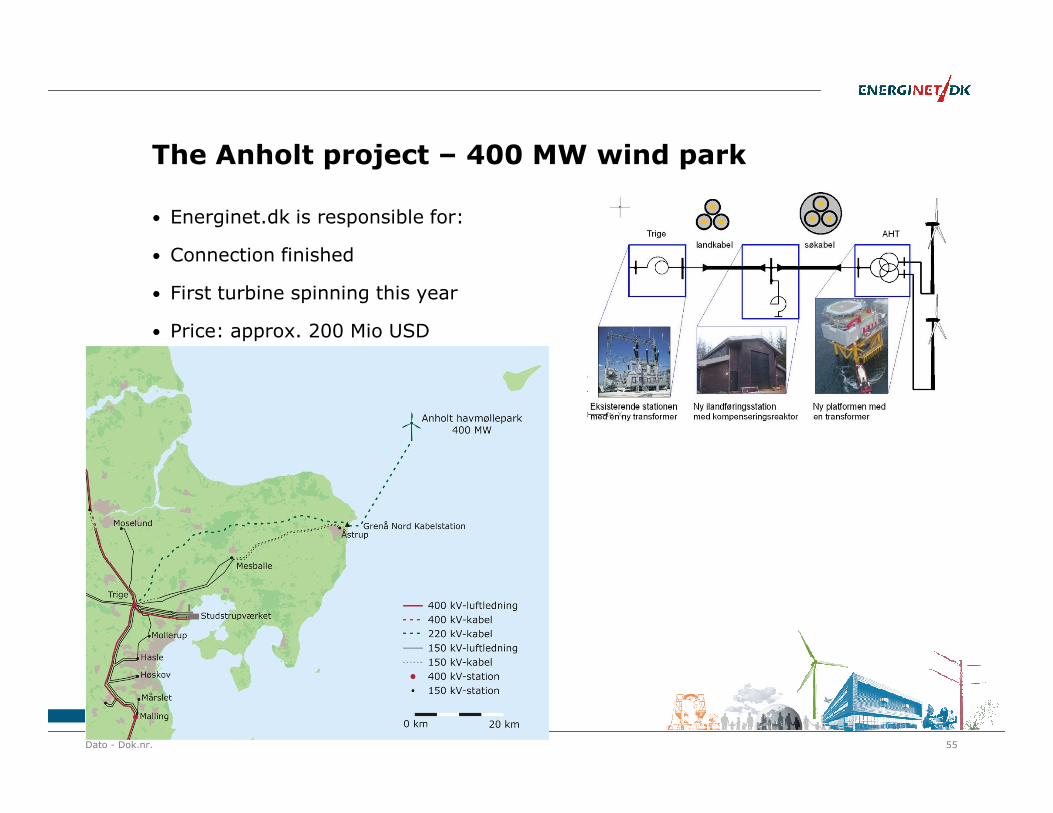
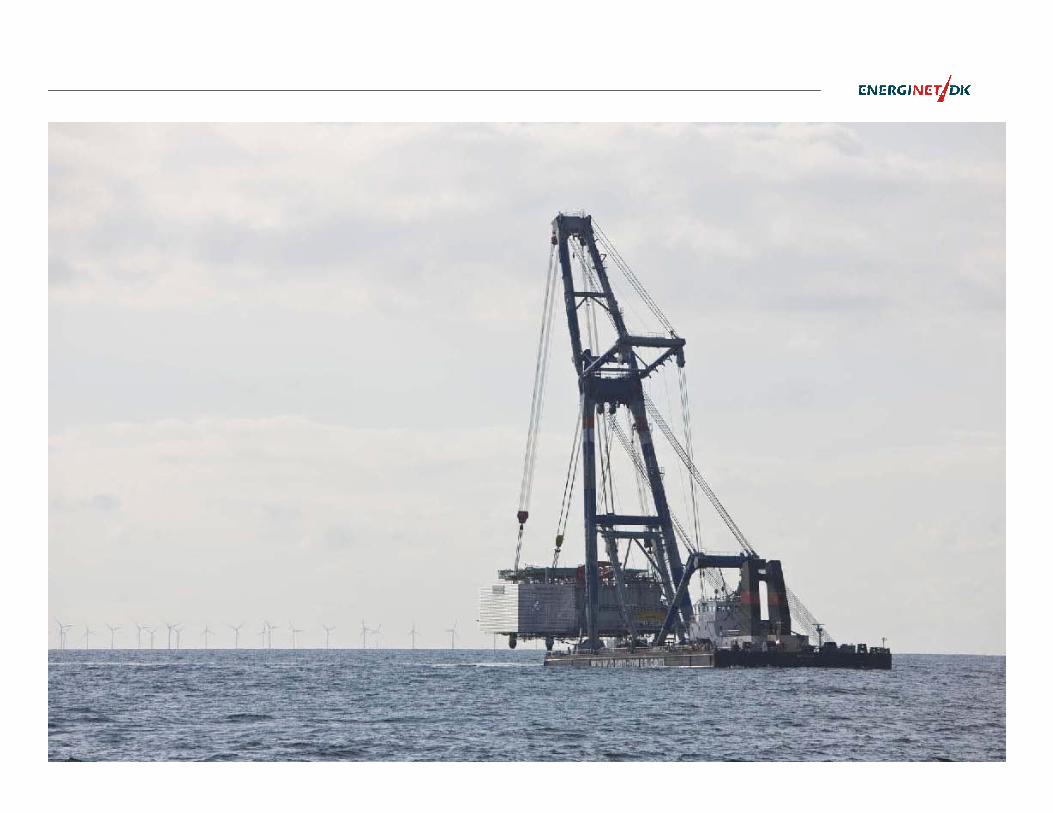
The Anholt project – 400 MW wind park
• Energinet.dk is responsible for:
• Connection finished
• First turbine spinning this year
• Price: approx. 200 Mio USD
Dato - Dok.nr. 55
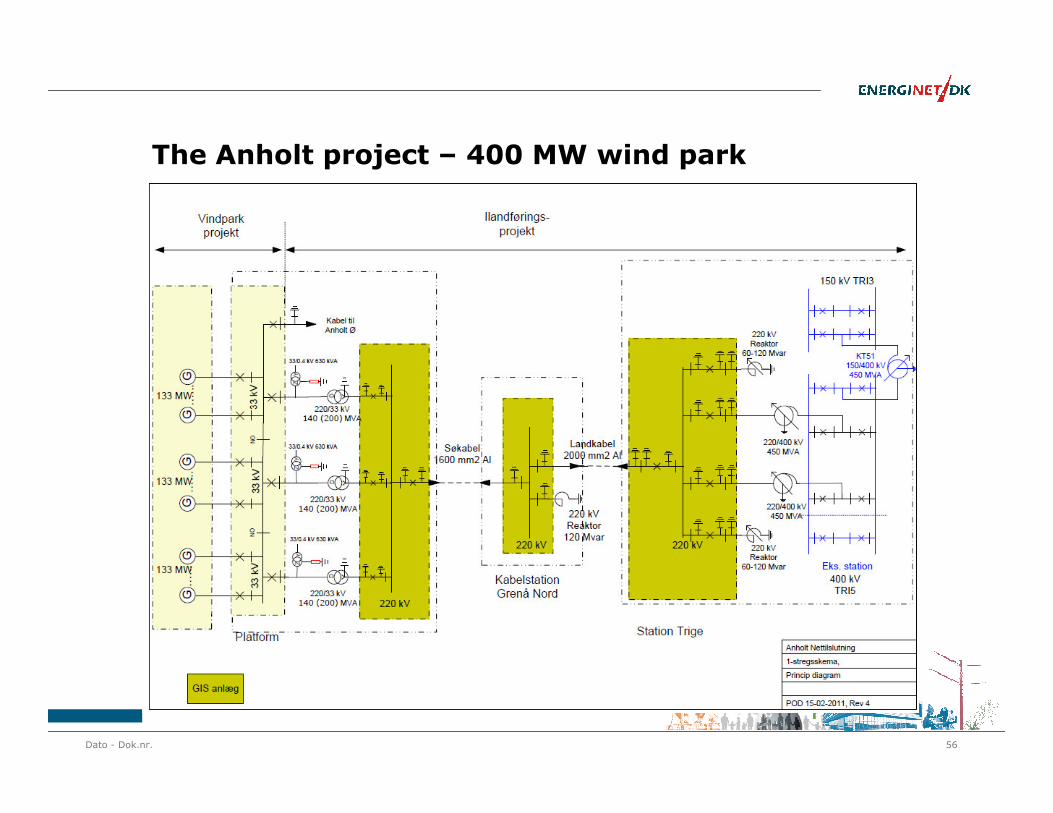
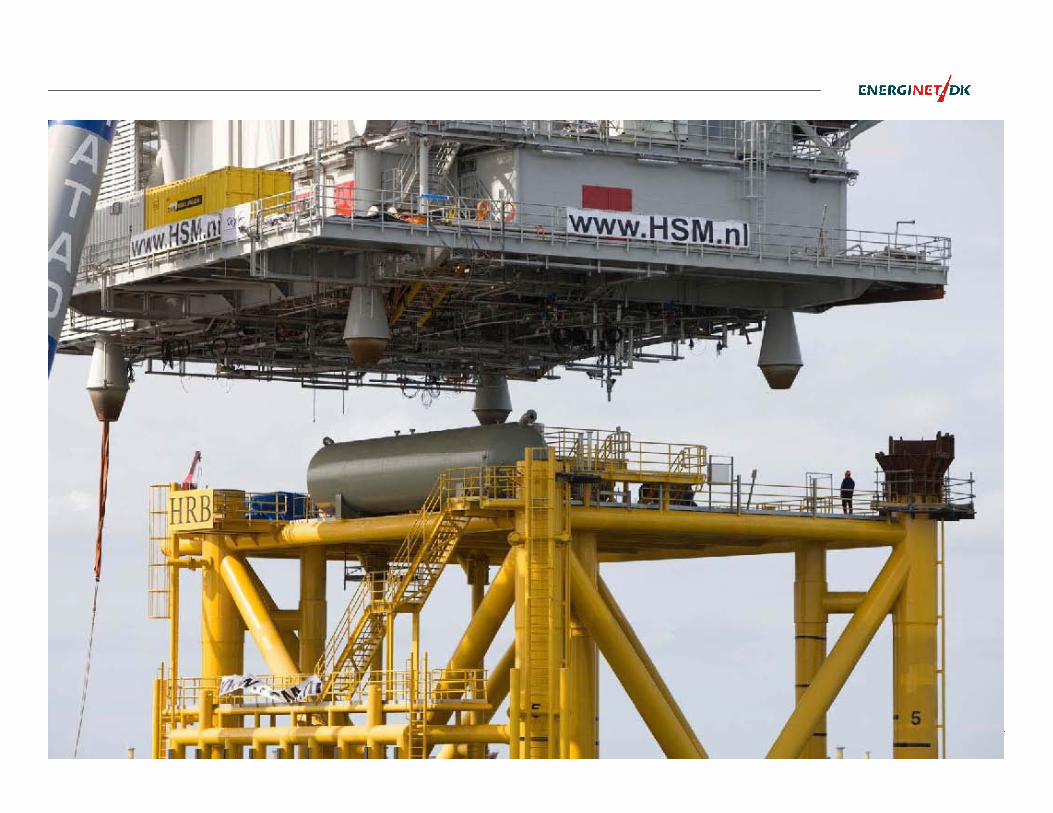
The Anholt project – 400 MW wind park
Dato - Dok.nr. 56
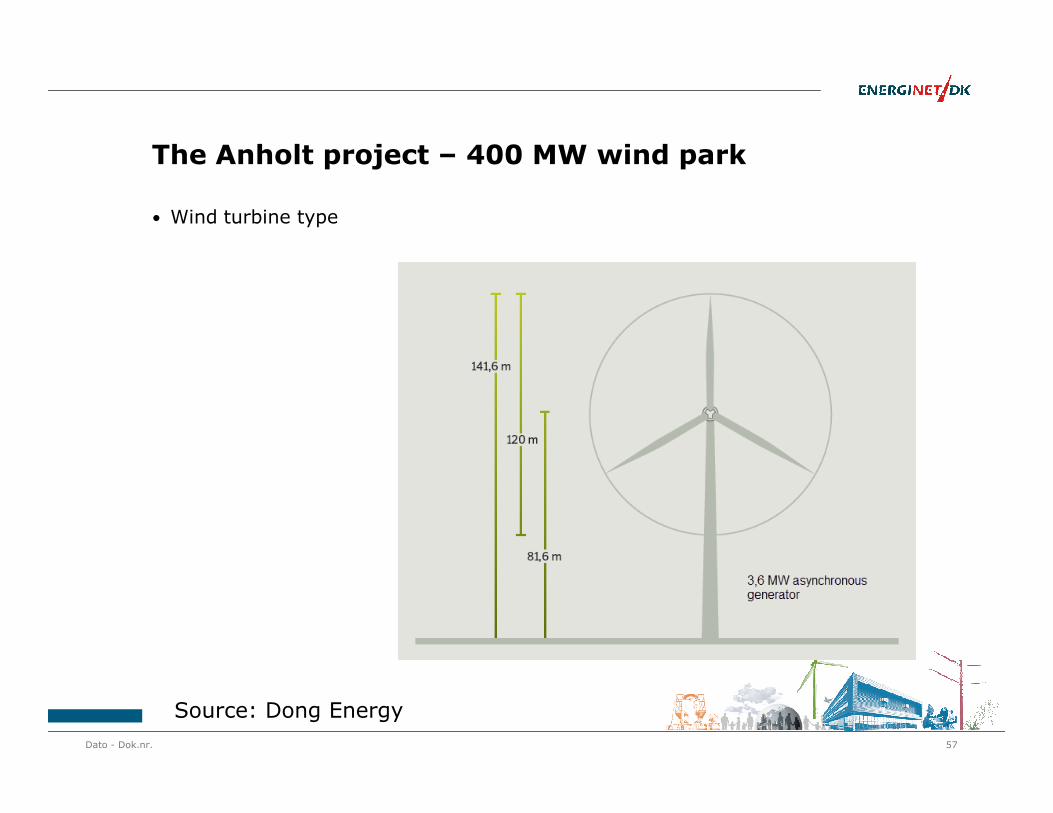
The Anholt project – 400 MW wind park
• Wind turbine type
Dato - Dok.nr. 57
Source: Dong Energy
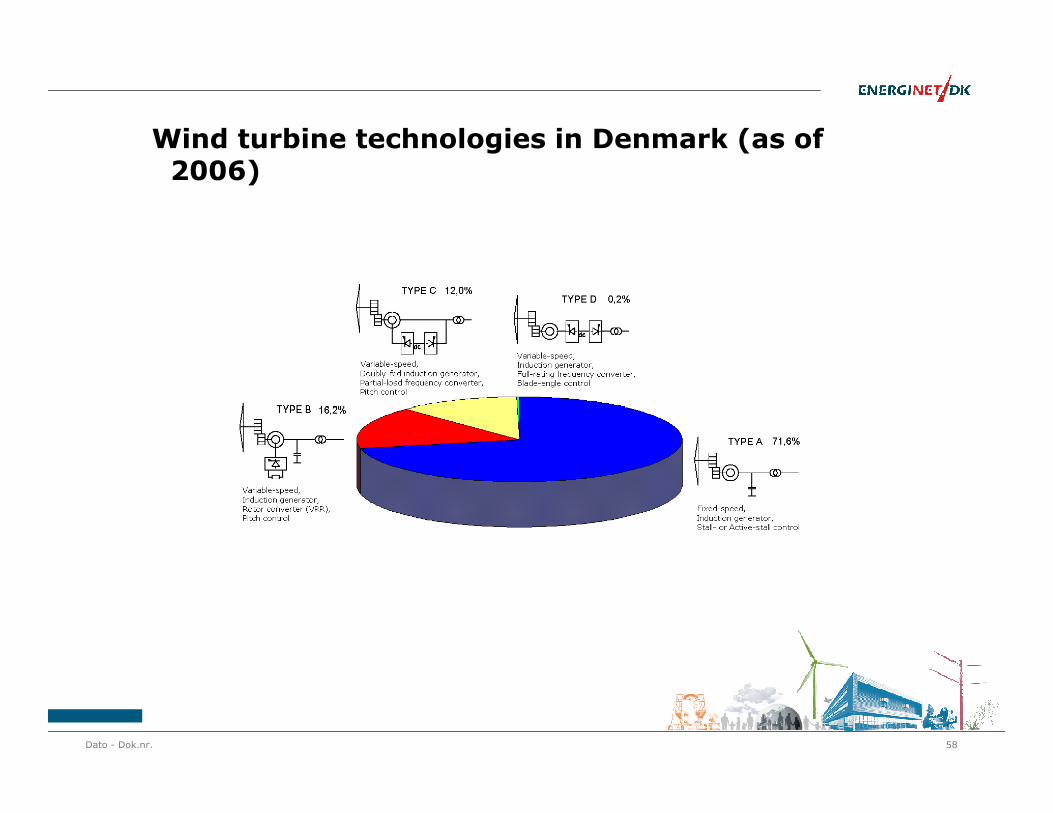
Wind turbine technologies in Denmark (as of 2006)
Dato - Dok.nr. 58
Wind turbine model types
• A normal “old” type wind mill, No/full load compensated, is modeled as a asynchronous machines with 10 % reactive power consumption of the active power production (PQ)
• Windmill parks are modeled as asynchronous machines with neutral reactive power (PQ)
• For dynamic studies we use asynchronous machines and converter based modelsmodels
Dato - Dok.nr. 59Titel
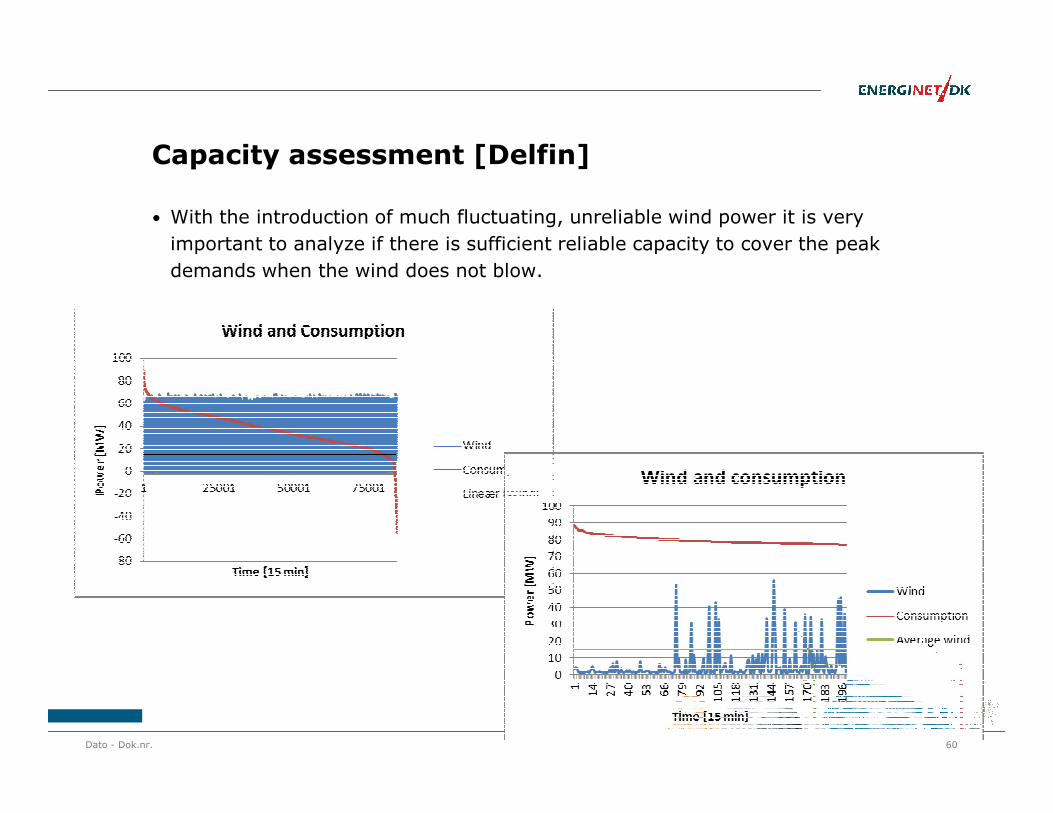
Capacity assessment [Delfin]
• With the introduction of much fluctuating, unreliable wind power it is very important to analyze if there is sufficient reliable capacity to cover the peak demands when the wind does not blow.
Dato - Dok.nr. 60
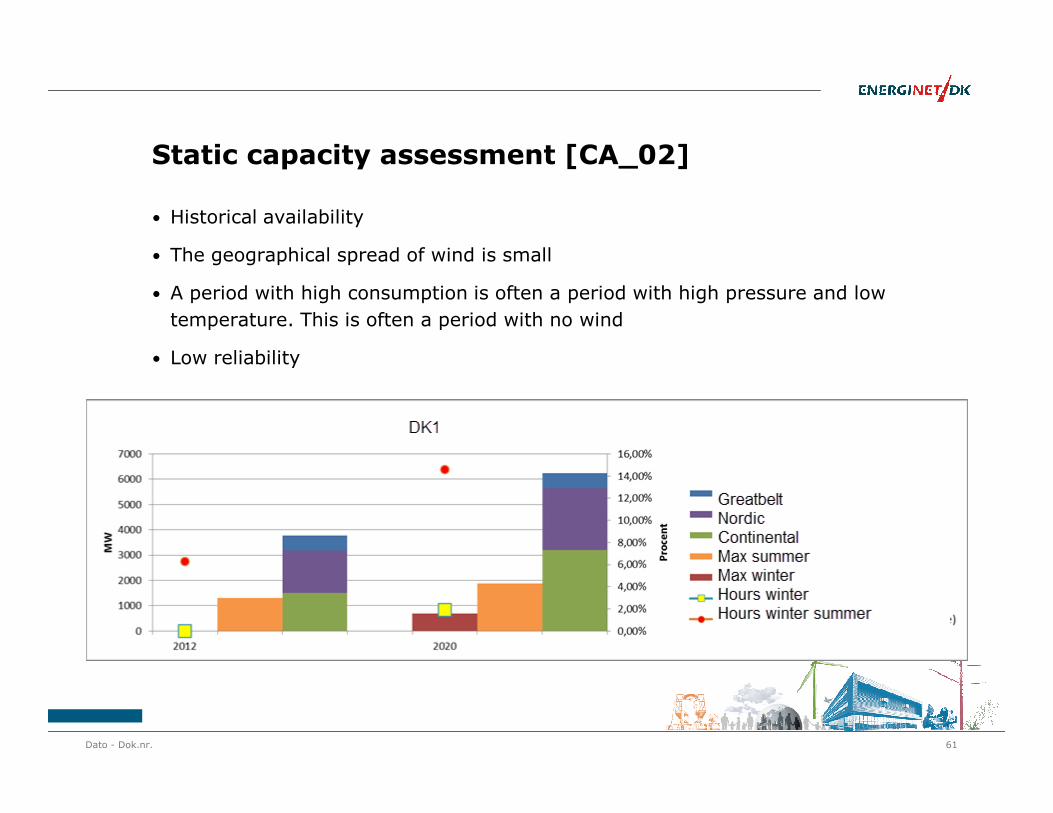
Static capacity assessment [CA_02]
• Historical availability
• The geographical spread of wind is small
• A period with high consumption is often a period with high pressure and low temperature. This is often a period with no wind
• Low reliability
Dato - Dok.nr. 61
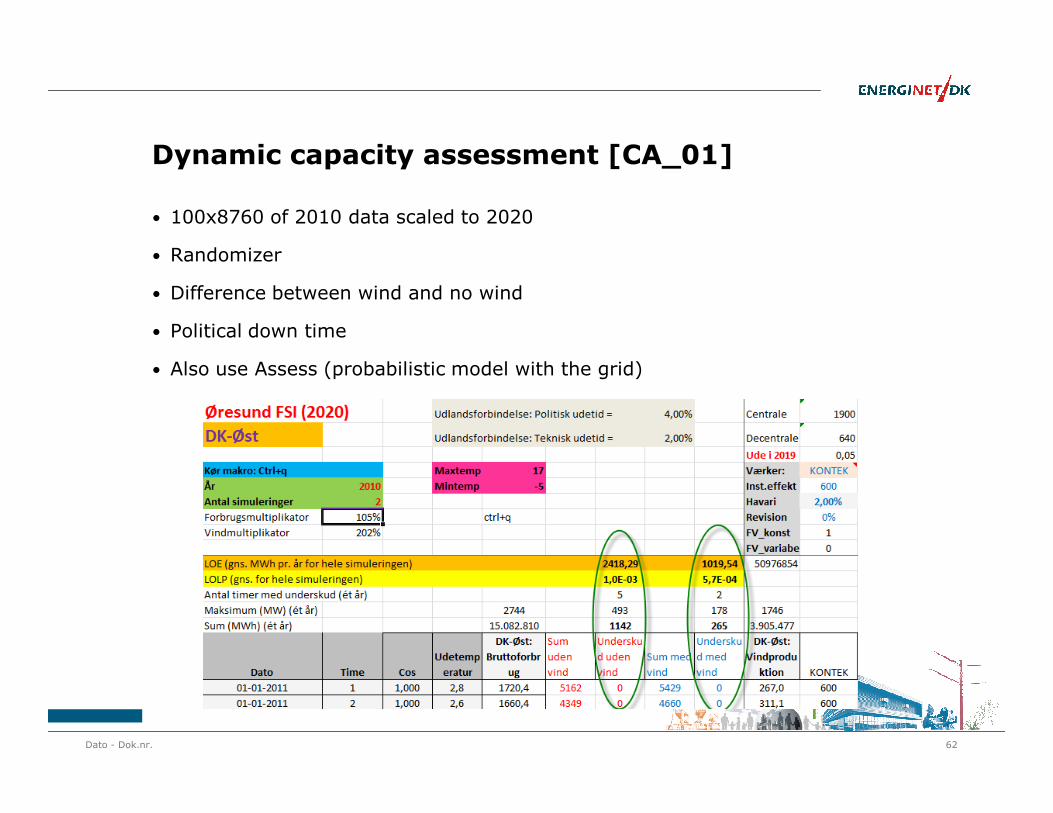
Dynamic capacity assessment [CA_01]
• 100x8760 of 2010 data scaled to 2020
• Randomizer
• Difference between wind and no wind
• Political down time
• Also use Assess (probabilistic model with the grid)
Dato - Dok.nr. 62
System structure and reliability
• There are two main reasons for system reinforcement:
• Better utilization of energy by reduction of bottlenecks
• Better reliability or reduced requirement for reserves at the same reliability
• In both cases, the chain is not stronger than its weakest link
• It is important to identify the weak links regarding both bottlenecks and reliability to avoid wrong investments.reliability to avoid wrong investments.
ENTSO-E: Power system reliability
The power system reliability is defined as the ability to:
• ensure normal system operation;
• limit the number of incidents and avoid major incidents;
• limit the consequences of major incidents whenever they do occur.
UCTE Operation Handbook, Appendix 3: Operational Security www.entso-e.eu
ENTSO-E: Power system reliability
• cascade tripping;
In order to ensure the safety of the system, protection must be provided against four main phenomena that may deeply disturb the system or initiate a large scale incident, naming:
• voltage collapse;
• frequency collapse;
• loss of synchronism
UCTE Operation Handbook, Appendix 3: Operational Security www.entso-e.eu
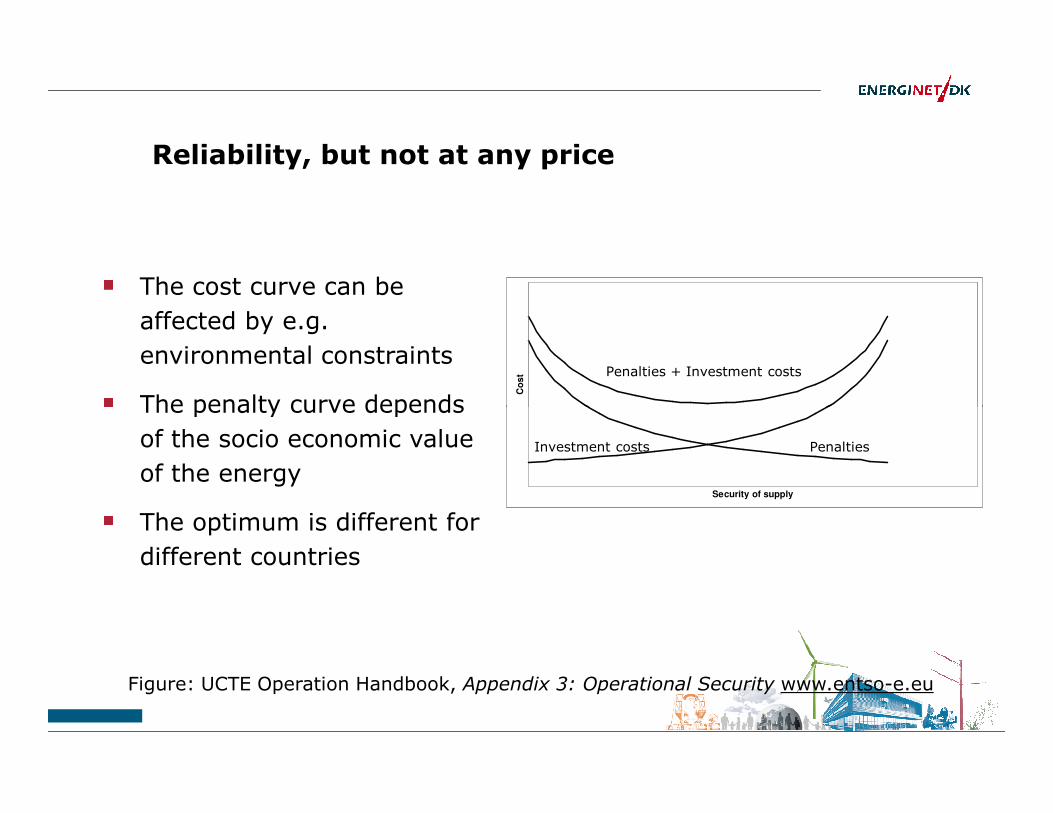
Reliability, but not at any price
The cost curve can be affected by e.g. environmental constraints
The penalty curve depends
Co
st Penalties + Investment costs
Figure: UCTE Operation Handbook, Appendix 3: Operational Security www.entso-e.eu
The penalty curve depends of the socio economic value of the energy
The optimum is different for different countries
Security of supply
Investment costs Penalties
67CNRED December 12, 2011
68CNRED December 12, 2011