volleyball serves - speed vs. accuracy sunset ridge middle...
TRANSCRIPT

Running Head SPEED VS.ACCURACY 1
Volleyball Serves - Speed vs. Accuracy
Sunset Ridge Middle School

SPEED VS. ACCURACY 2
Contents
Abstract ............................................................................................................................... 3
Introduction ......................................................................................................................... 4
Methods............................................................................................................................... 5
Apparatus ............................................................................................................................ 6
Procedure ............................................................................................................................ 7
Results ................................................................................................................................. 9
Discussions ....................................................................................................................... 13
Conclusions ....................................................................................................................... 15
Acknowledgements ........................................................................................................... 16
Underhand Serves ............................................................................................................. 17
Standing Serves ................................................................................................................. 18
Jump Serves ...................................................................................................................... 19
Group Results.................................................................................................................... 20
Individual Results ............................................................................................................. 23

SPEED VS. ACCURACY 3
Abstract
Recently, an experiment was conducted to prove the idea of F.I.T.T.S law. The law
simply states that one must give up accuracy for speed or speed for accuracy. The hypothesis
presented for this experiment was, “F.I.T.T.S law will be proven incorrect because it is possible
to serve with speed and still be able to hit a target with accuracy.” The procedure used to perform
this experiment was to first create at least two tables, one for speed and one for accuracy. Next
find access to several volleyballs, test subjects, a radar gun, and a target that is about the size of
two volleyballs wide and long. Step three would be to place the target somewhere on the court.
Have each person serve underhand four times trying to hit the target while using the radar gun to
track the speed of the serve. Do this for each type of serve and record the speed of the serve.
Next mark whether or not the target was hit. This step will be repeated for underhand serving,
standing serves, and jump serves. The fourth and final step for the experiment is to take all of the
recorded data from each serve for each person and compare the results to other people who were
tested, and compare the results to F.I.T.T.S law to support or refute the hypothesis.

SPEED VS. ACCURACY 4
Introduction
The purpose of the research was to determine whether or not an athlete participating in a
sport can perform a certain skill with both speed and accuracy at the same time. Presented was a
question or hypothesis which was used to help determine whether or not a person playing a sport,
in this case volleyball, can serve with both speed and accuracy. This project was prompted at a
volleyball practice while a team was practicing serves. The topic came up when two athletes
were practicing serves and comparing speeds or who could hit the target. The hypothesis
presented for this experiment was, “F.I.T.T.S law will be proven incorrect because it is possible
to serve fast and still be able to hit a target.” The other purpose of this experiment is to help
athletes be able to perform better. When there are tricks or loopholes that an athlete finds in a
game, usually they take them. Being able to know that it is possible to perform a task or skill
with speed and accuracy could benefit how an athlete plays.

SPEED VS. ACCURACY 5
Methods
Subjects/ Participants:
1- Chad Collotzi 6- Dan Eardley 11- Garret
2- Paul 7- Chris Jones 12- Trent Sanders
3- Cameron Willes 8- Kit Erickson 13- Mark Hiller
4- Evan Hiller 9- Emily Richardson 14- Scott Ricks
5- Jen Baumann 10-Brian Bay
The participants listed above volunteered or were willing to participate in the following
experiment. The participants participated in the experiment as a favor, and to help someone out.
Also some thought it would be fun to see how fast of a serve they themselves had as well as
others.

SPEED VS. ACCURACY 6
Apparatus
For this experiment, many items were used. In this experiment, fourteen people1 of both
genders were tested. Also for this particular experiment, three NCAA men’s volleyballs2,
pumped to the required or recommended pressure, were used for the participants to serve with. A
target3 was measured 1’ 10” x 2” and placed somewhere on a volleyball court. The net that was
served over was set at men’s height which is 7' 11-5/8”.To record speeds, a radar gun4 was used
to get the correct speeds rather than an estimation. The speeds were then recorded on tables that
were previously drawn on a paper5. The items previously described were all used to conduct this
experiment.
1 Test subjects
2 Volleyballs
3 Target
4 Radar Gun
5 Paper and Pencil

SPEED VS. ACCURACY 7
Procedure
In order for this experiment to occur, many steps had to be taken. The first thing that is
needed for this experiment is access to a couple things. These things are several volleyballs, a
radar gun, an open gym with a volleyball court painted, and willing test subjects.
The next thing that needs to be done before the experiment occurs is a place to record all
of the data that is collected from the experiment. Page fifteen has an example of what the layout
was for the tables. Two tables need to be made, one for speed and the other for accuracy. The
table also needs to have space to record four serves per serve type which results in twelve total
spots available to record data. For this experiment to be more accurate, have the test subjects or
participants play a game or two to warm up their muscles.
The next thing to do for the experiment would be to place the target somewhere on the
court. The target doesn’t necessarily need to be a certain place on the court, but for this
experiment the target was placed where a person would stand or play after they had served. This
spot is otherwise known to volleyball players as zone one.
Next have the first participant or test subject grab a ball and serve underhand as fast as
they can trying to hit the target. While the participant is serving, take the radar gun and point it at
the ball to find the speed. Repeat this three more times so there are a total of four recorded serve
speeds for that participants underhand serves. If the participant hits the target, simply place an X
on the serve number that the target was hit. Continue to do this until all of the participants have
underhand served a total of four times.

SPEED VS. ACCURACY 8
Now go back through the line starting with the first participant but this time having them
serve an overhand or otherwise called a standing serve. These serves will also have the speed
taken and all of the data needs to be recorded on the tables. Also the participants will serve like
this trying to hit the target while trying to serve as fast as they can four times.
The next serve type is a jump serve. All of the same steps used from the underhand and
standing serves will be used. If the participants are not physically able to jump serve or are not
willing to try, simply write NA in the spot where the speeds would be written down. As for the
accuracy table, the same thing applies.
When each participant has served a total of twelve times and all of the data has been
collected, the participants can resume their games. With all of the data that has been collected,
both the speeds and accuracies need to be compared to support of refute the hypothesis that was
presented. This can easily be done by writing the speed on one line and the accuracy right under
it. This way it is easy to identify whether or not the highest speed of serve hit the target or not.

SPEED VS. ACCURACY 9
Results
From this experiment, many things were observed, compared, and analyzed. This
experiment led to the conclusion that some participants were able to hit the target with their
highest speed of serve. In this experiment, participants served four times for each of the three
serve types preformed. The three serve types were underhand, overhand or standing, and jump
serves. For some participants, the serves that went the fastest, were the ones that hit the target. In
the overall experiment, the average speeds for underhand serves ranged from 16.8 to 17.9 miles
per hour. For more detailed results, look at pages 9-12 for group results and pages 17-36 for
individual results.
For overhand or standing serves, the middle or average speed hit the target more
than the serves with the highest speed or the lowest speed. The ability to serve with great speeds
and be able to control where it goes varied within the people who participated in this experiment.
The speeds ranged from about 29.9 to 31.78 miles per hour but that is just the average. Some
were able to serve up to 47 MPH but the average was lower because of all of the other
participants. The more detailed results can be found on the pages 9o-12 and 17-36 of this report.
As far as the jump serves go, some people were not able to perform a jump serve. This is
because they were either not physically able to jump serve, were not comfortable with it, or were
not willing to try. For these situations, the charts have N/A which means that participant could
not jump serve for one of the previously stated reasons. For those that could jump serve, most
were only able to hit the target twice. The speeds that hit the target were those like the standing
serves in the way that it was usually the middle or average speed serve that hit the target. The
jump serve speeds averaged from about 41 to 44 miles per hour. Also pages 9-12 and 17-36
contain the detailed results for individual and group jump serves.

SPEED VS. ACCURACY 10
With the different serve types it is possible to serve with both speed and accuracy. These
results showed that there are a lot of different ways to play volleyball just with serves. Through
this experiment and even these results, people who are really into this sport are better able to
improve their game by seeing what works best. The evidence gathered from this experiment is
shown in the charts included in this report. From the charts below, most participants stayed
within the standard deviation.
Standard Deviation is a measure of the spread of the data. For example, on from this
data for serve 1, the underhand the average speed is 17 and the standard deviation is
3.78. This shows that most of the participant's number of underhand serves will lie within 1
standard deviation of the average or between 13.22 and 20.78.
Jen Baumann’s second underhand serve was one standard deviation below the average
which was 17.9. Dan Eardley had two underhand serves, two and three, that were also below
the standard deviation. Chris Jones’ second serve however was one standard deviation above
the average of 17.9.This data also shows Kit Erickson had serves two, three, and four under
more than 1 standard deviation below the average. Emily Richardson’s serves one, three, and
four were also under the average of about 16.8. Brian Bay and Mark Hiller have their third
serve above the standard deviation. Trent Sanders has his second and fourth serve above the
standard deviation. Also Scott Ricks had a 22 mph underhand serve, which is more than 1
standard deviation above the average. The third and fourth serves were also more than 1
standard deviation above the average.

SPEED VS. ACCURACY 11
Results for standing serves were found with more participants under the standard
deviation. For serve 1, the average speed was 31.7 mph and the standard deviation is 5.93. This
displays that most of the participant's number of standing serves will lie within 1 standard
deviation of the average or between 36.62 and 51.38. All of Chris Jones’ serves were 1 standard
deviation below the average. Kit Erickson was again below the standard deviation average but
with serves three and four this time. All of Paul’s standing serves were above the standard
deviation average by one if not two. Also Scott Ricks had his first, third, and fourth serves over
the standard deviation again.

SPEED VS. ACCURACY 12
For jump serves, not a lot of participants were not able to or not willing to attempt a
jump serve. So there were six people who participated in the jump serve part of the
experiment. For serve 1, the jump the average speed was 44 mph and the standard deviation is
7.38. This goes to show that most of the participant's number of jump serves will lie within 1
standard deviation of the average or between 36.62 and 51.38. Mark Hiller’s first, second, and
fourth serves were below the standard deviation average by 1 standard deviation. Paul and
Trent Sanders both had speeds 1 standard deviation above the average. Both Paul and Trent
were above the average with serves one, two and three, with Paul having serve four as well.
0
10
20
30
40
50
0 2 4 6 8 10 12 14 16
STANDING
SERVE 1 SERVE 2 SERVE 3 SERVE 4
0
10
20
30
40
50
60
0 1 2 3 4 5 6 7
JUMP
SERVE 1 SERVE 2 SERVE 3 SERVE 4

SPEED VS. ACCURACY 13
Discussions
The results that were expected were different than what was expected for some of the
participants. This is because through watching these participants play for a long time, their
speeds and accuracy results were different than were thought. Through this experiment, what
was thought for serving speeds and accuracy percentages was proven wrong. Possible error could
have occurred during the experiment. A possible error could be writing down the wrong speed or
possible foot faults. Another possible error possible in this experiment could be the net not at the
right height giving a possible advantage to some of the participants. Something which could have
made the data collected and recorded from this project unreliable would be not hearing the speed
correctly, and then written down incorrectly. If this project were to be repeated, it is suggested
that the participants are told with more detail what to do, and stay more organized.
Other experiments that could be conducted to further investigate this topic could be
things like passing accuracy of serves, which serve is harder to pass accurately. Another could be
whether hits are better to a certain spot (accuracy) or whether speed determines the kill/hit
(speed). The results from this experiment conclude that speed and accuracy can both occur
together. For some people it may differ depending on the person and skill set that they have. The
importance of the findings in this experiment would be for athletes looking for ways to improve
both their mental and physical play. Knowing as they practice and their skill level increases,
speed and accuracy can both play a key role in how the athlete preforms during a game situation.
Through this experiment, it has been shown that a person or athlete can serve with both speed
and accuracy. From the results that can be found on pages 9-12 and 17-36 displayed through the
data that a person or athlete can serve with speed and accuracy at the same time. F.I.T.T.S. law
was disproven through this experiment. The data that was recorded through the experiment,

SPEED VS. ACCURACY 14
supports the hypothesis presented for this experiment and refutes or argues against F.I.T.T.S.
law. Through a lot of research and analyzing of data, the conclusion was made that most people
with more experience or advanced skills in a specific skill were better able to serve with speed
and accuracy. Because some of the participants have had a lot of experience either just playing
regularly for fun or have actually played in a competitive league, this gives them a more distinct
advantage over other who just play sometimes and have never really taken it seriously.

SPEED VS. ACCURACY 15
Conclusions
The results of this project showed that it is possible for a person or athlete to serve with
both speed and accuracy. Based on the data that was collected and the analyzed, the statement
previously presented is accurate. The hypothesis stated for this project proven correct because it
stated that it is possible to be able to serve with speed and accuracy. The results are shown on
page 7 of this report and the tables are also shown on pages 11-13. Ten people out of the 14 were
able to prove or support the hypothesis for this experiment. This is over half of the participants
tested and all of them showed results that contributed to the experiment to that it is able to be
statistically significant. Many of the participants showed surprising results that also contributed
to the experiment in great ways.
Based on how the participants have been viewed playing outside of the experiment, this
made the results seem surprising. The speeds were faster than thought for the participants who
were previously recognized for being over the standard deviation average. Some of the speeds
were opposite and were slower than thought. And these people also were previously recognized
in the results part of this paper. When attempting to pass one of Paul’s serves, it might be thought
that it is coming faster than it really does which makes it seem faster and harder to pass.
Compared to one of Kit’s serves, which can come over slower than thought, which makes it
easier to pass.

SPEED VS. ACCURACY 16
Acknowledgements
Chad Collotzi Kit Erickson
Paul Ottson Emily Richardson
Cameron Willes Brian Bay
Evan Hiller Garrett
Jen Baumann Trent Sanders
Dan Eardley Mark Hiller
Chris Jones Scott Ricks
Thank you to all of the participants listed above for their cooperation and willingness to
participate in this experiment. Thank you to Clayton Ostler for donating his radar gun for the use
of this experiment. Also thanks to Scott Ricks for being willing to help track speeds and get
everyone to help out. Thanks to all of the listed participants, F.I.T.T.S Law was able to be put to
the test and proven to be incorrect. This experiment would not have been possible and so
accurate if none of these people were willing to help out. The method that was used for this
experiment can be found on page five of this report. Page five of the report goes into more detail
about the methods used and materials used.

SPEED VS. ACCURACY 17
Underhand Serves
NAME SERVE 1 SERVE 2 SERVE 3 SERVE 4 Average
(MPH) (MPH) (MPH) (MPH) (MPH)
1- Chad Collotzi 15 18 17 17 16.75 2- Paul 16 17 17 16 16.5 3- Cameron Willes 22 20 18 18 19.5 4- Evan Hiller 17 16 17 17 16.75 5- Jen Baumann 16 14 16 17 15.75 6- Dan Eardley 10 13 13 15 12.75 7- Chris Jones 20 22 20 18 20 8- Kit Erickson 11 13 10 11 11.25 9- Emily Richardson 13 15 11 12 12.75 10- Brian Bay 18 20 21 19 19.5 11- Garret 18 20 19 17 18.5 12- Trent Sanders 20 23 19 20 20.5 13- Mark Hiller 20 20 22 18 20 14- Scott Ricks 22 20 21 20 20.75
Average (MPH) 17 17.9 17.2 16.8
(X=Hit the target)
NAME SERVE 1 SERVE 2 SERVE 3 SERVE 4 Percentage
1- Chad Collotzi
x x
50
2- Paul
x x 50
3- Cameron Willes
x x
50
4- Evan Hiller
x
x 50
5- Jen Baumann x
x x 75
6- Dan Eardley
x x
50
7- Chris Jones
x x 50
8- Kit Erickson x x x
75
9- Emily Richardson
x x 50
10- Brian Bay x x
x 75
11- Garret
x
x 50
12- Trent Sanders
x
25
13- Mark Hiller x
x x 75
14- Scott Ricks
x x x 75
Percentage 28.6 57.1 78.6 64.3

SPEED VS. ACCURACY 18
Standing Serves
NAME SERVE 1 SERVE 2 SERVE 3 SERVE 4 Average
(MPH) (MPH) (MPH) (MPH) (MPH) 1- Chad Collotzi 27 25 26 27 26.25 2- Paul 47 46 47 45 46.25 3- Cameron Willes 29 28 24 26 26.75 4- Evan Hiller 36 33 34 35 34.5 5- Jen Baumann 32 30 32 31 31.25 6- Dan Eardley 32 31 31 32 31.5 7- Chris Jones 23 21 22 22 22 8- Kit Erickson 26 24 22 25 24.25 9- Emily Richardson 27 25 27 26 26.25 10- Brian Bay 32 30 31 31 31 11- Garret 30 29 30 30 29.75 12- Trent Sanders 33 30 31 32 31.5 13- Mark Hiller 32 32 31 32 31.75 14- Scott Ricks 38 35 37 37 36.75
Average (MPH) 31.7 29.9 30.4 30.8
(X=Hit the target) NAME SERVE 1 SERVE 2 SERVE 3 SERVE 4 Percentage
1- Chad Collotzi x
x x 75
2- Paul x x
50
3- Cameron Willes
x x 50
4- Evan Hiller
x x
50
5- Jen Baumann x
x x 75
6- Dan Eardley x
x x 75
7- Chris Jones
x x
50
8- Kit Erickson
x
25 9- Emily Richardson
x
x 50
10- Brian Bay
x x 50
11- Garret x
x
50
12- Trent Sanders
x
x 50
13- Mark Hiller
x x
50
14- Scott Ricks x x
x 75
Percentage 42.9 50 71.4 57.1

SPEED VS. ACCURACY 19
Jump Serves
NAME SERVE 1 SERVE 2 SERVE 3 SERVE 4 Average
(MPH) (MPH) (MPH) (MPH) (MPH)
1- Chad Collotzi NA NA NA NA 2- Paul 53 53 52 53 52.75
3- Cameron Willes 45 42 40 43 42.5 4- Evan Hiller 38 35 32 36 35.25 5- Jen Baumann NA NA NA NA
6- Dan Eardley NA NA NA NA 7- Chris Jones NA NA NA NA 8- Kit Erickson NA NA NA NA 9- Emily Richardson NA NA NA NA 10- Brian Bay NA NA NA NA 11- Garret 41 37 39 40 39.25
12- Trent Sanders 52 52 50 47 50.25 13- Mark Hiller 35 33 33 34 33.75 14- Scott Ricks NA NA NA NA
Average (MPH) 44 42 41 42.2
NAME SERVE 1 SERVE 2 SERVE 3 SERVE 4 Percentage
NA NA NA NA NA
1- Chad Collotzi NA NA NA NA NA
2- Paul
x x
50
3- Cameron Willes
x 25
4- Evan Hiller
x 25
5- Jen Baumann NA NA NA NA NA
6- Dan Eardley NA NA NA NA NA
7- Chris Jones NA NA NA NA NA
8- Kit Erickson NA NA NA NA NA
9- Emily Richardson NA NA NA NA NA
10- Brian Bay NA NA NA NA NA
11- Garret
x
x 50
12- Trent Sanders
x
25
13- Mark Hiller
x
x 50
14- Scott Ricks NA NA NA NA NA
Percentage
21.4 14.3 28.6

SPEED VS. ACCURACY 20
Group Results
0
5
10
15
20
25
1 2 3 4
Spe
ed
of
Serv
e (
MP
H)
Underhand
1- Chad Collotzi
2- Paul
3- Cameron Willes
4- Evan Hiller
5- Jen Baumann
6- Dan Eardley
7- Chris Jones
8- Kit Erickson
9- Emily Richardson
10- Brian Bay
11- Garret
12- Trent Sanders
0
5
10
15
20
25
30
35
40
45
50
1 2 3 4
Spe
ed
of
Serv
e (
MP
H)
Standing
1- Chad Collotzi
2- Paul
3- Cameron Willes
4- Evan Hiller
5- Jen Baumann
6- Dan Eardley
7- Chris Jones
8- Kit Erickson
9- Emily Richardson
10- Brian Bay
11- Garret
12- Trent Sanders
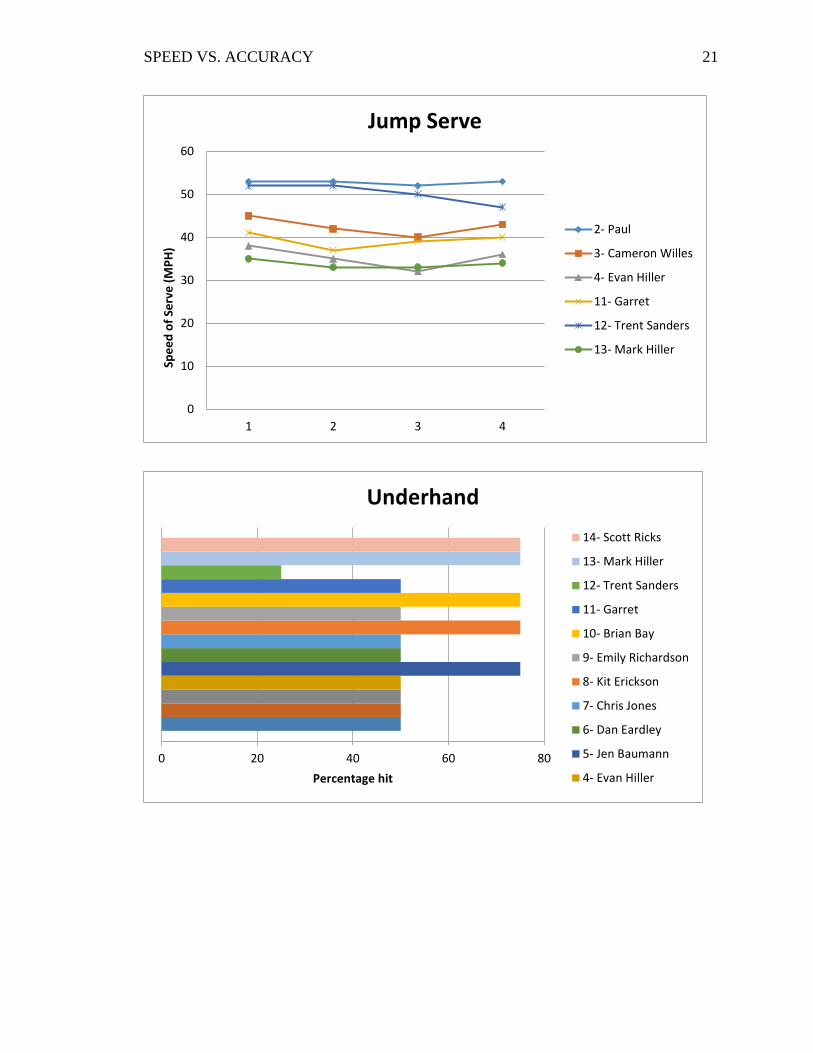
SPEED VS. ACCURACY 21
0
10
20
30
40
50
60
1 2 3 4
Spe
ed
of
Serv
e (
MP
H)
Jump Serve
2- Paul
3- Cameron Willes
4- Evan Hiller
11- Garret
12- Trent Sanders
13- Mark Hiller
0 20 40 60 80
Percentage hit
Underhand
14- Scott Ricks
13- Mark Hiller
12- Trent Sanders
11- Garret
10- Brian Bay
9- Emily Richardson
8- Kit Erickson
7- Chris Jones
6- Dan Eardley
5- Jen Baumann
4- Evan Hiller

SPEED VS. ACCURACY 22
0 20 40 60 80
Percentage Hit
Standing
14- Scott Ricks
13- Mark Hiller
12- Trent Sanders
11- Garret
10- Brian Bay
9- Emily Richardson
8- Kit Erickson
7- Chris Jones
6- Dan Eardley
5- Jen Baumann
4- Evan Hiller
0 10 20 30 40 50 60Percentage Hit
Jump
13- Mark Hiller
12- Trent Sanders
11- Garret
4- Evan Hiller
3- Cameron Willes
2- Paul

SPEED VS. ACCURACY 23
Individual Results
0
5
10
15
20
25
30
1 2 3 4
Spe
ed
of
Serv
e (
MP
H)
Chad collotzi
Underhand
Standing
0 20 40 60 80
Accuracy
Chad Collotzi
STANDING
UNDERHAND

SPEED VS. ACCURACY 24
0
10
20
30
40
50
60
1 2 3 4
Spe
ed
of
serv
e (
MP
H)
Paul
Underhand
Standing
Jump
0 10 20 30 40 50 60
Accuracy
Paul
JUMP
STANDING
UNDERHAND

SPEED VS. ACCURACY 25
0
5
10
15
20
25
30
35
40
45
50
1 2 3 4
Spe
ed
of
Serv
e (
MP
H)
Camern Willes
Underhand
Standing
Jump
0 10 20 30 40 50 60
Accuracy
Cameron Willes
JUMP
STANDING
UNDERHAND

SPEED VS. ACCURACY 26
0
5
10
15
20
25
30
35
40
1 2 3 4
Spe
ed
of
Serv
e (
MP
H)
Evan Hiller
Underhand
Standing
Jump
0 10 20 30 40 50 60
Accuracy
Evan Hiller
JUMP
STANDING
UNDERHAND
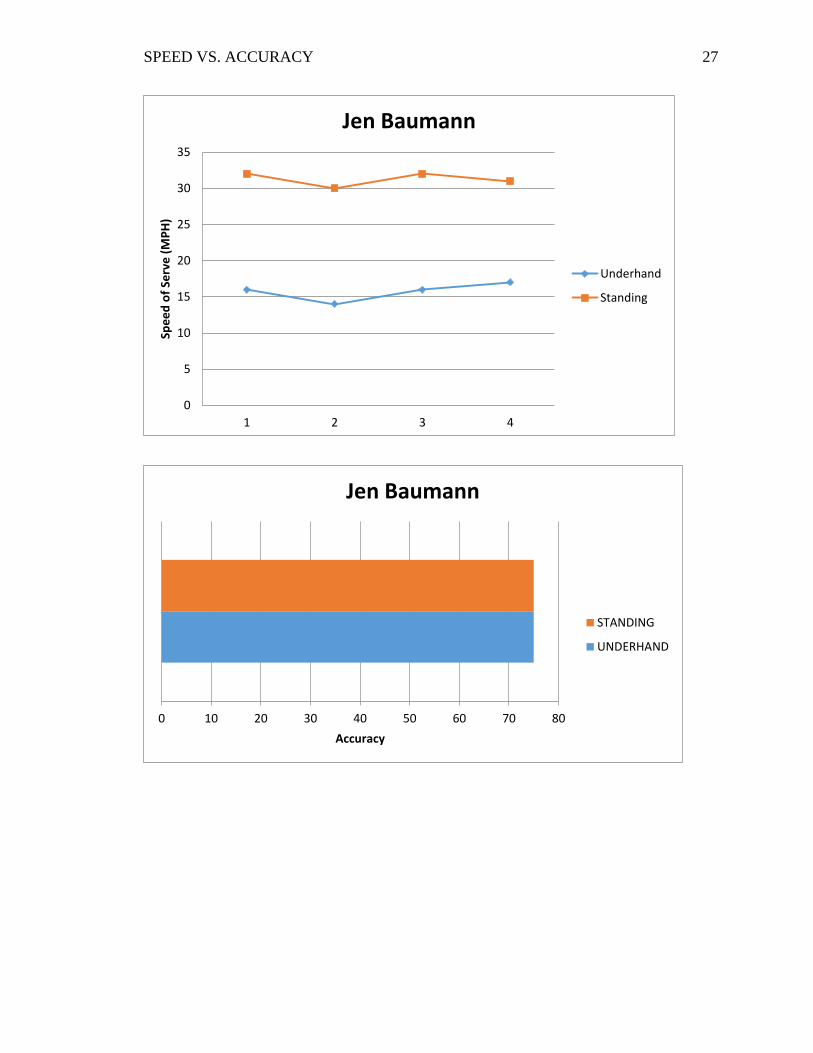
SPEED VS. ACCURACY 27
0
5
10
15
20
25
30
35
1 2 3 4
Spe
ed
of
Serv
e (
MP
H)
Jen Baumann
Underhand
Standing
0 10 20 30 40 50 60 70 80
Accuracy
Jen Baumann
STANDING
UNDERHAND

SPEED VS. ACCURACY 28
0
5
10
15
20
25
30
35
1 2 3 4
Spe
ed
of
Serv
es
(MP
H)
Dan Eardley
Underhand
Standing
0 20 40 60 80
Accuracy
Dan Eardley
STANDING
UNDERHAND

SPEED VS. ACCURACY 29
0
5
10
15
20
25
1 2 3 4
Spe
ed
of
Serv
es
(MP
H)
Chris Jones
Underhand
Standing
0 10 20 30 40 50 60
Accuracy
Chris Jones
STANDING
UNDERHAND

SPEED VS. ACCURACY 30
0
5
10
15
20
25
30
1 2 3 4
Spe
ed
of
Serv
es
(MP
H)
Kit Erickson
Underhand
Standing
0 10 20 30 40 50 60 70 80
Accuracy
Kit Erickson
STANDING
UNDERHAND

SPEED VS. ACCURACY 31
0
5
10
15
20
25
30
1 2 3 4
Spe
ed
of
the
Se
rve
(M
PH
)
Emily Richardson
Underhand
Standing
0 10 20 30 40 50 60
Accuracy
Emily Richardson
STANDING
UNDERHAND

SPEED VS. ACCURACY 32
0
5
10
15
20
25
30
35
1 2 3 4
Spe
ed
of
Serv
es
(MP
H)
Brian Bay
Underhand
Standing
0 10 20 30 40 50 60 70 80
Accuracy
Brian Bay
STANDING
UNDERHAND

SPEED VS. ACCURACY 33
0
5
10
15
20
25
30
35
40
45
1 2 3 4
Spe
ed
of
the
Se
rve
(M
PH
)
Garrett
Underhand
Standing
Jump
0 10 20 30 40 50 60
Accuracy
Garrett
JUMP
STANDING
UNDERHAND

SPEED VS. ACCURACY 34
0
10
20
30
40
50
60
1 2 3 4
Spe
ed
of
Serv
es
(MP
H)
Trent Sanders
Underhand
Standing
Jump
0 10 20 30 40 50 60
Accuracy
Trent Sanders
JUMP
STANDING
UNDERHAND

SPEED VS. ACCURACY 35
0
5
10
15
20
25
30
35
40
1 2 3 4
Spe
ed
of
Serv
es
(MP
H)
Mark Hiller
Underhand
Standing
Jump
0 10 20 30 40 50 60 70 80
Accuracy
Mark Hiller
JUMP
STANDING
UNDERHAND

SPEED VS. ACCURACY 36
0
5
10
15
20
25
30
35
40
1 2 3 4
Spe
ed
of
Serv
es
(MP
H)
Scott Ricks
Underhand
Standing
0 10 20 30 40 50 60 70 80
Accuracy
Scott Ricks
STANDING
UNDERHAND