volatility spillovers in u.s. crude oil, ethanol, and corn ... - august 2012/jare...andrés...
TRANSCRIPT

Journal of Agricultural and Resource Economics 37(2):247–262Copyright 2012 Western Agricultural Economics Association
Volatility Spillovers in U.S. Crude Oil,Ethanol, and Corn Futures Markets
Andrés Trujillo-Barrera, Mindy Mallory, and Philip Garcia
This article analyzes recent volatility spillovers in the United States from crude oil using futuresprices. Crude oil spillovers to both corn and ethanol markets are somewhat similar in timing andmagnitude, but moderately stronger to the ethanol market. The shares of corn and ethanol pricevariability directly attributed to volatility in the crude oil market are generally between 10%-20%, but reached nearly 45% during the financial crisis, when world demand for oil changeddramatically. Volatility transmission is also found from the corn to the ethanol market, but notthe opposite. The findings provide insights into the extent of volatility linkages among energy andagricultural markets in a period characterized by strong price variability and significant productionof corn-based ethanol.
Key words: biofuels, corn, crude oil, energy-agricultural co-movements, ethanol, multivariateGARCH, volatility spillovers
Introduction
Recently, agricultural commodity prices have exhibited considerable variability. Sumner (2009)argues that the percentage price increases for grains from 2006 through mid-2008 were among thelargest in history. Then in the summer of 2008 prices fell sharply but recovered swiftly, and haveexhibited unusually large and sustained volatility to the present (Wright, 2011). As seen in figure1, from 1980 to 2005 historical corn volatility—measured as the annualized standard deviation ofdaily percentage price changes—was usually below 25%, but since 2006 it has increased, reachinglevels above 40%. Prakash (2011) corroborates this volatility for corn as well as for other agriculturalcommodities using the implied volatility from options.
The current literature offers multiple possible reasons for strong recent fluctuations inagricultural commodity prices (Baffes, 2011; Wright, 2011; Gilbert and Morgan, 2010; Irwinand Good, 2009). Researchers have identified rapid economic growth in developing countries,underinvestment in agriculture, low inventory levels, supply shocks in key producing regions, fiscalexpansion and lax monetary policy in many countries, the depreciation of the U.S. dollar, highenergy prices, and the diversion of food crops into the production of biofuels as contributing toincreased volatility. A focal point for understanding the increased price variability is the change inthe relationship among energy and agricultural markets influenced by policies to stimulate ethanolproduction (Hertel and Beckman, 2011; Tyner, 2010; Muhammad and Kebede, 2009).
Energy costs have traditionally influenced agricultural markets, but with the growth in corn-based ethanol production as an energy source (figure 2), the relationships among these marketsappear to have strengthened. Since ethanol is a substitute for petroleum-based motor fuel and corn
Andrés Trujillo-Barrera is a PhD Student, Mindy Mallory is Assistant Professor, and Philip Garcia is T. A. HieronymusDistinguished Chair in Futures Markets, Department of Agricultural and Consumer Economics, University of Illinois atUrbana-Champaign.The authors would like to thank two anonymous referees and editor Gary Brester for their helpful comments. Partial fundingsupport from the Office for Futures and Options Research at UIUC is acknowledged.
Review coordinated by Gary Brester.

248 August 2012 Journal of Agricultural and Resource Economics
Figure 1: Annual Corn Volatility, 1980-2011Notes: Historical volatility is the standard deviation of the daily percentage price change using nearby futures settlement prices (CME).
Figure 2: U.S. Corn Use, 1980-2010
is an input in ethanol production, general equilibrium economic models predict that equilibriumpetroleum-based energy prices, ethanol, and corn can be viewed as jointly determined (Cui et al.,2011). However, petroleum-based energy markets are much larger than the ethanol and corn markets,suggesting in practice that the direction of causality should run from crude oil to the corn andethanol markets. Indeed, considerable applied research has explored this hypothesis in domestic andforeign markets (Campiche et al., 2007; Balcombe and Rapsomanikis, 2008). Most studies focusedon price level transmission (Serra et al., 2010) and on equilibrium analysis of alternative biofuelpolicy scenarios (Yano, Blandford, and Surry, 2010; Thompson, Meyer, and Westhoff, 2009).
Less attention has been paid to understanding price volatility (i.e., the conditional variance ofprice changes, which is viewed as risk), its transmission among these markets, and the degree towhich volatility in the energy complex contributed to the recent variability in agricultural commodity

Trujillo-Barrera, Mallory, and Garcia Spillover in Oil, Ethanol, and Corn Markets 249
prices. Volatility spillover occurs when price volatility in one market affects price volatility in others.We investigate volatility spillover from crude oil to corn and ethanol in U.S. markets in order toidentify the degree to which systematic variability in oil prices has contributed to variability in cornand ethanol prices.
Zhang et al. (2009) find little evidence of linkages in either price-level or volatility among U.S.oil, ethanol, and corn prices for the period 1989-2007. In contrast, Wu, Guan, and Myers (2011), Du,Yu, and Hayes (2011), and Harri and Darren (2009) find significant volatility linkages between crudeoil and corn prices in more recent years. However, these researchers do not incorporate ethanol pricesdespite arguing that the relationship is largely explained by ethanol production. We complementthis work by evaluating volatility spillovers to the ethanol market and identifying the direction andstrength of the spillovers between corn and ethanol. Additionally, we extend the previous literatureby examining these relationships during and after the 2009 financial crisis.
Using a trivariate model (Ng, 2000; Wu, Guan, and Myers, 2011), we find volatility linkagesfrom crude oil market to corn and ethanol markets during 2006-2011, during which corn-basedethanol production accounted for 25-35% of total corn use. The volatility spillovers are particularlystrong when the oil market price plummeted during the financial crisis, with higher impact in theethanol market than in the corn market. Significant spillovers also existed from the corn to ethanolmarket. The strong linkages among these markets, mixed with high price volatility, create newsources of uncertainty for market participants and policy makers. High volatility results in greatercosts for managing risks in productive activities, complicates price discovery and investment choice,and ultimately may affect the cost of food in domestic and world markets.
Background and Previous Work
Studies by Tothova (2011) and Hertel and Beckman (2011) illustrate that crude oil and agriculturalcommodity prices exhibited relatively low or even negative correlation prior to 2006. However, thecombination of high oil prices and ethanol policies has fueled the growth of the ethanol industry,which currently consumes nearly one third of corn produced in the United States. Ethanol productionin the United States increased from 3.4 billion gallons in 2004 to 13.8 billion gallons in 2011, whilethe price of corn doubled. Virtually all ethanol produced is blended into gasoline, contributing 13.19billion gallons to the 138.50 billion gallons of gasoline consumed in the United States in 2010 (U.S.Energy Information Administration, 2012).
Policy has played a crucial role in stimulating ethanol production growth. Import tariffs andblenders fuel tax credits (per gallon tax credit was $.51 per gallon before 2009 and $.45 per gallonafter 2009) made added output attractive to refiners. Legislation to improve energy security andto reduce air pollution was key to ethanol market expansion (Muhammad and Kebede, 2009).The Energy Policy Act in 2005 established the Renewable Fuel Standard (RFS) program, whichmandated that a minimum of 7.5 billion gallons of renewable fuels be incorporated into gasolinesupply by 2012. In December 2007, a new RFS was passed under the Energy Independence andSecurity Act, mandating renewable fuels production of 12 billion gallons by 2012 and 36 billiongallons by 2022.
Ethanol production also has been spurred by the need for an oxygenate to replace Methyl TertiaryButyl Ether (MTBE) in gasoline blends. MTBE, a petroleum-based oxygenate, was blended withgasoline as a substitute for lead to prevent pre-ignition pinging and to reduce pollution. However,MTBE was banned by many states because of suspected links between cancer and groundwatercontamination caused by fuel spills. The elimination of MTBE and its replacement by ethanol wereaccelerated by the 2005 Energy Policy Act, which made refiners continuing to use MTBE liable forclaims (Serra et al., 2011). In the presence of these links among energy and agricultural markets, weexpect volatility in crude oil prices to spill over into the corn and ethanol markets, creating volatilitythere as well.

250 August 2012 Journal of Agricultural and Resource Economics
Zhang et al. (2009) explore ethanol price volatility and its relationship with corn, soybean,gasoline, and oil in the United States by employing a multivariate GARCH framework and usingweekly wholesale prices between 1989 and 2007. They split their data in two periods: 1989-1999as the ethanol pre-boom stage and 2000-2007 as the ethanol boom period. Their results suggest nosignificant links among oil, ethanol, and corn volatilities in either period. Furthermore, they find nolong-run relationships among agricultural and energy price levels.
Du, Yu, and Hayes (2011) investigate the spillover of crude oil prices to agricultural commodityprices using stochastic volatility models and weekly crude oil, corn, and wheat futures pricesbetween November 1998 and January 2009. Consistent with Zhang et al. (2009), they find noevidence of spillover for the earlier portion of their sample (through October 2006). However,between October 2006 and January 2009 the results indicate significant volatility spillover fromthe crude oil market to the corn market, which they explain by tightened interdependence betweenthese markets induced by ethanol production. Despite identifying the statistical link between thesemarkets, the extent of the relationship was not clearly determined.
Wu, Guan, and Myers (2011) draw conclusions similar to those of Du, Yu, and Hayes (2011)using weekly data from January 1992 to June 2009. Using a model in which exogenous oil marketshocks influence the corn market, they provide a metric to quantify the strength of the volatilityspillovers and find evidence of significant spillovers from crude oil prices to U.S. corn spot andfutures prices, particularly after the introduction of the Energy Policy Act of 2005. Harri and Darren(2009) also provide insights to the mean and variance dynamics among futures prices of crude oil,corn, and a proxy for exchange rates with daily observations from April 2003 until March 2009. Theyfind significant volatility transmission and evidence of crude oil price variance causing variance ofcorn prices.
Equilibrium models and simulations have also been used to evaluate the ties among energyand agricultural markets. Many researchers have offered insights on the effects of price variabilityand the role of biofuel policies such as tax credits and mandates (e.g., Thompson, Meyer, andWesthoff, 2009; Yano, Blandford, and Surry, 2010; Hertel and Beckman, 2011). Researchers haveidentified strong linkages among energy and agricultural markets, but their results do not analyze therelationship of ethanol price volatility to crude oil and corn volatilities under recent policy scenariosand market conditions.
Volatility Spillover Model
To identify and measure volatility spillovers between crude oil (co), corn (c), and ethanol (th)markets, we use an approach similar to Ng (2000) and Wu, Guan, and Myers (2011). Here, anexternal crude oil shock generates spillovers to the corn and ethanol markets, while the corn andethanol markets interact. The model is specified as:
∆cot = E[∆cot | It−1] + eco,t ,(1) [ct
tht
]=
[E[ct | It−1]
E[tht | It−1]
]+
[εc,t
εth,t
],(2)
[εc,t
εth,t
]=
[φt
ωt
]+
[ec,t
eth,t
].(3)
In equation (1) the change of crude oil prices (∆ is the first difference operator), cot , equals aconditional expected change in crude oil prices formed with information at t − 1, It−1, plus randomshock, eco,t . Equation (2) defines corn and ethanol prices at time t as the sum of the conditionalexpectations of prices formed with information at t − 1, It−1, plus random shocks εc,t , εth,t . Equation

Trujillo-Barrera, Mallory, and Garcia Spillover in Oil, Ethanol, and Corn Markets 251
(3) defines the random shocks of corn and ethanol prices, which correspond to the sum of twoterms; the first is the product of the exogenous random shock of crude oil, eco,t , and the respectivespillover coefficient, φ and ω , for each market. The second terms are the idiosyncratic errors of cornand ethanol eeet = [ec,t ,eth,t ], which can be mutually correlated but are uncorrelated to the crude oil
innovation. Hence, the overall behavior of price shocks in the corn and ethanol markets,
[εc,t
εth,t
],
is affected by shocks in the crude oil market and in their own markets, which are not independent ofeach other but do not affect the crude oil market.1
To identify the overall effect, we need to specify the structure of the conditional variance ofcrude oil (i.e., eco,t ) and the relationship between the conditional variances in the corn and ethanolmarkets (i.e., eeet = [ec,t ,eth,t ]) over time. We specify these as:
σ2t = α0 + α1e2
co,t−1 + λ1dt−1e2co,t−1 + α2σ
2t−1,(4)
HHHt =CCC′′′CCC +++ AAA′′′eeet−1eee′′′t−1AAA +++ BBB′′′HHHt−1BBB,(5)
where HHHt is the BEKK conditional volatility, CCC is an upper triangular matrix that corresponds tothe constant, eeet−1eee′′′t−1 are the squared lagged errors, AAA is the matrix of ARCH parameters, HHHt−1
is the lagged conditional volatility, and BBB is the matrix of GARCH parameters.2 Equation (4)models crude oil price volatility as a univariate Asymmetric Generalized Autoregressive ConditionalHeteroskedasticity model (GJR-GARCH) introduced to the literature by Glosten, Jagannathan, andRunkle (1993). This model allows asymmetry on the random shock, where dt−1 is a dummy variablethat takes a value of 1 if eco,t−1 ≤ 0, and 0 otherwise. The volatility of the errors ec,t and eth,t isspecified using the Baba, Engle, Kraft and Kroner (BEKK) specification of a multivariate GARCHwhich has two desirable characteristics. It is positive definite by construction and it allows theestimation of the volatility spillovers between corn and ethanol. Equation (5) defines The BEKKGARCH model.
To identify more clearly how corn and ethanol volatilities interact and are influenced by oilmarket volatility, first consider the bivariate BEKK GARCH from equation (5):[
hcc,t hcth,t
hthc,t hthth,t
]=
[c11 0c21 c22
]′[c11 0c21 c22
]+
[a11 a12
a21 a22
]′[e2
c,t−1 ec,teth,t−1
eth,t−1ec,t e2th,t−1
][a11 a12
a21 a22
]+
[b11 b12
b21 b22
]′[hcc,t−1 hcth,t−1
hthc,t−1 hthth,t−1
][b11 b12
b21 b22
].
Matrix multiplication leads to:
hcc,t = c211 + a2
11e2c,t−1 + 2a11a21ec,t−1eth,t−1 + a2
21e2th,t−1 + b2
11hcc,t−1 +(6)
2b12b22hcth,t−1 + b222hthth,t−1,
hthth,t = c212 + c2
22 + a212e2
c,t−1 + 2a12a22ec,t−1eth,t−1 + a222e2
th,t−1 + b212hcc,t−1 +
(7)2b12b22hcth,t−1 + b2
22hthth,t−1,
1 This reflects the notion that an OPEC announcement can impact corn and ethanol markets, and that weather informationfor the growing period in South America may affect U.S. corn and ethanol markets, but South American weather is highlyunlikely to affect the oil market.
2 Asymmetry of the GARCH BEKK was not supported using a LM test.

252 August 2012 Journal of Agricultural and Resource Economics
where hcc,t and hthth,t are conditional idiosyncratic volatilities of corn (c) and ethanol (th), hcth,t is theconditional covariance, and ei j,t(i, j) = c, th are the lagged own squared and cross-market randomshocks. Taking the square of equation (3) and under the assumption of no correlation between eco,tand et the conditional variances of ethanol and corn are given by:
E(ε2c,t | It−1) = hcc,t = φ
2σ
2t ,(8)
E(ε2th,t | It−1) = hthth,t = ω
2σ
2t ,(9)
where the significance of φ 2 and ω2 determine whether volatility spillovers from crude oil marketsexist. Volatility spillovers between corn and ethanol are determined by the signs and significance ofthe terms in equations (6) and (7).
Data and Preliminary Analysis
Data are the nearby mid-week closing futures (Wednesday) log prices of crude oil West TexasIntermediate (CO) from NYMEX, ethanol (TH) from CBOT, and corn (C) from CBOT for theperiod July 30, 2006, to November 9, 2011.3 This corresponds to a period of strong demand forcorn-based ethanol production and sharp and substantial changes in oil prices.
Crude oil, corn, and ethanol prices are available for differing contract months. To develop aconformable and continuous price series, we use the closing prices of the contract months for thecommodity with the fewest contracts, which is corn. The corn market has five contracts maturingin December, March, May, July, and September. As the contract comes to maturity, the series isrolled forward to the price of the next closest contract. We do this on the third business day priorto the 25th calendar day of the month preceding the delivery month to avoid price anomalies thatcan sometimes occur in the delivery month. Since a portion of the analysis requires differenceddata which are useful to examine, we define weekly percentage price changes, called returns, asRt = logPt − logPt−1. These are computed by using the closing prices of futures contracts.4
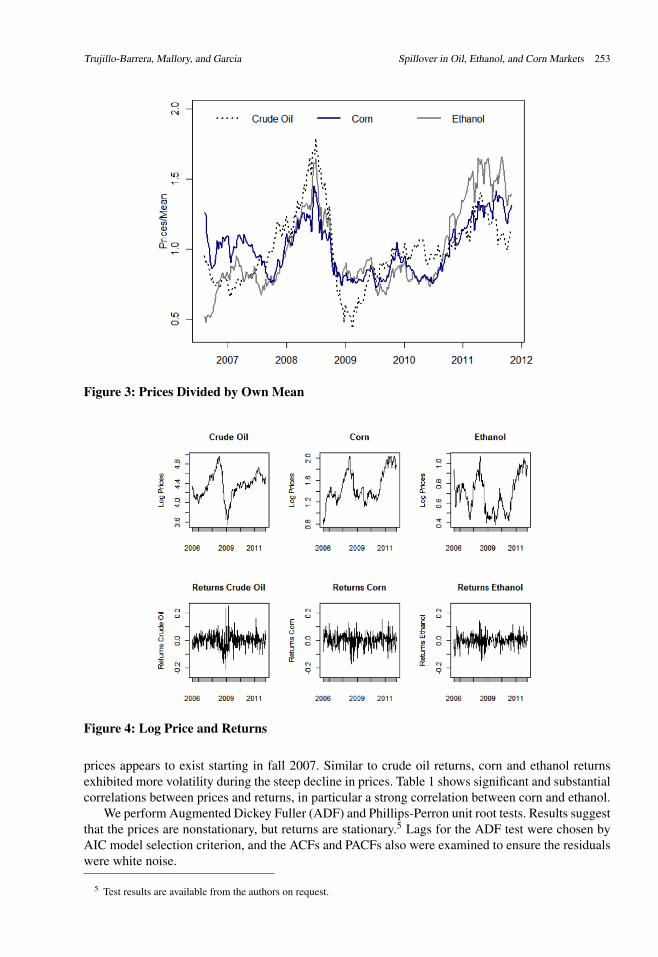
Figure 3 shows the prices divided by their own means, which allows us to graph the price serieson the same scale. Table 1 presents summary statistics of log prices and returns. The coefficients ofvariation of ethanol prices and returns are higher than those for crude oil and corn, suggesting thatethanol exhibits higher volatility. The means of the returns are virtually zero, and skewness resultssuggest that prices and returns are relatively symmetrically distributed. Excess kurtosis indicatesthat prices are not normally distributed.
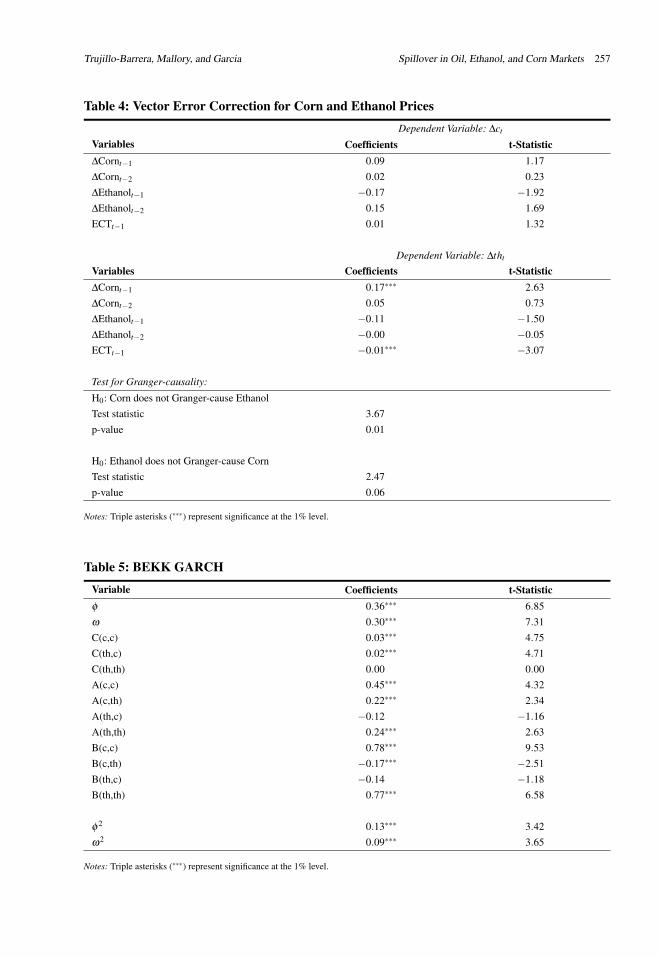
Figure 4 illustrates the prices and returns dynamics of crude oil, ethanol, and corn. Crude oildisplayed a positive trend in prices beginning at the end of 2006 until summer 2008, followed bya steep decrease lasting until spring 2009. The financial crisis that dampened worldwide demandfor oil was one of the main causes of the sharp decline. However, crude oil prices rebounded andby fall 2009 were back to 2006 observed levels. Since that point, crude oil prices have exhibitedconsiderable variability. Returns variability for crude oil is high and clustered during the pricedecline and recovery.
Corn and ethanol prices and their returns exhibit similar dynamics to crude oil, particularlyfrom fall 2007 to the end of 2008. Corn prices fell sharply in fall 2008, similar to crude oil prices,until spring 2009. During 2009 and part of 2010 prices appeared to move within a band, but insummer 2010 they escalated again. By 2011 prices were near the same levels observed prior to thefinancial crisis. Ethanol prices follow a similar patterns, but exhibit more price variability during2009 and 2010. Despite the difference in variability, more co-movement between ethanol and corn
3 Dahlgran (2010) argues that despite an open interest that is a small fraction of annual U.S. usage, the ethanol futurescontract is reflective of market conditions. In our analysis, we explored the robustness of our findings looking at daily, weekly,and weekly average data to assess the potential effects of limited liquidity in the ethanol market. Results are very similar.
4 The term “returns” is used in the literature to refer to the percentage change in value of holding an asset for a period oftime, and here is synonymous with the weekly percentage price change.
Trujillo-Barrera, Mallory, and Garcia Spillover in Oil, Ethanol, and Corn Markets 253
Figure 3: Prices Divided by Own Mean
Figure 4: Log Price and Returns
prices appears to exist starting in fall 2007. Similar to crude oil returns, corn and ethanol returnsexhibited more volatility during the steep decline in prices. Table 1 shows significant and substantialcorrelations between prices and returns, in particular a strong correlation between corn and ethanol.
We perform Augmented Dickey Fuller (ADF) and Phillips-Perron unit root tests. Results suggestthat the prices are nonstationary, but returns are stationary.5 Lags for the ADF test were chosen byAIC model selection criterion, and the ACFs and PACFs also were examined to ensure the residualswere white noise.
5 Test results are available from the authors on request.

254 August 2012 Journal of Agricultural and Resource Economics
Table 1: Summary Statistics and Correlations (N = 274)Returns
Statistics Crude Oil Ethanol Corn Crude Oil Ethanol CornMinimum 3.54 0.38 0.80 −21.23 −14.74 −16.89Maximum 4.97 1.08 2.04 25.46 14.16 15.301st Quartile 4.18 0.51 1.29 −3.23 −2.43 −2.673rd Quartile 4.52 0.83 1.75 3.50 2.70 3.49Mean 4.35 0.69 1.49 0.07 0.02 0.35Median 4.36 0.67 1.39 0.46 0.04 0.75Variance 0.07 0.03 0.08 0.30 0.19 0.26SD 0.26 0.18 0.28 5.44 4.37 5.12Skewness −0.27 0.20 0.33 0.21 −0.18 −0.27Excess kurtosis 0.18 −1.19 −0.75 3.28 0.98 0.66Coeff. Variation 0.06 0.27 0.19 74.79 232.60 14.65
Correlations ReturnsCrude Oil Ethanol Crude Oil Ethanol
Ethanol 0.64∗∗∗ 0.44∗∗∗
Corn 0.66∗∗∗ 0.78∗∗∗ 0.36∗∗∗ 0.60∗∗∗
Notes: Crude oil, ethanol, and corn prices are in logs, and the returns are multiplied by 100. Triple asterisks (∗∗∗) represent significance at the1% level.
Table 2: Johansen Cointegration Tests(a) Corn and Ethanol
Trace Critical Value Max Critical ValueCointegration Rank Eigen Statistic 95% 99% Statistic 95% 99%None 0.098 32.09∗∗∗ 19.96 24.60 28.09∗∗∗ 15.67 20.20At most 1 0.015 3.99 9.24 12.97 3.99 9.24 12.97
(b) Crude Oil and CornTrace Critical Value Max Critical Value
Cointegration Rank Eigen Statistic 95% 99% Statistic 95% 99%None 0.039 16.08 19.96 24.60 10.55 15.67 20.20At most 1 0.002 5.53 9.24 12.97 5.53 9.24 12.97
(c) Crude Oil and EthanolTrace Critical Value Max Critical Value
Cointegration Rank Eigen Statistic 95% 99% Statistic 95% 99%None 0.008 8.95 19.96 24.60 6.39 15.67 20.20At most 1 0.002 2.56 9.24 12.97 2.56 9.24 12.97
Notes: Triple asterisks (∗∗∗) represent significance at the 1% level. Lag length was selected based on AIC.
Table 2 shows the results of the Johansen test of cointegration for the three bivariaterelationships. The test strongly rejects the null hypothesis of no cointegration between corn andethanol prices, supporting the presence of a long-run equilibrium relationship between these twomarkets. We cannot reject the null hypothesis of no cointegration at the 10% level for the other twobivariate relationships: crude oil-ethanol and crude oil-corn.

Trujillo-Barrera, Mallory, and Garcia Spillover in Oil, Ethanol, and Corn Markets 255
Estimation
For equation (1), the first difference of crude oil log prices, we include three own lags to obtainwhite noise residuals, which are used to estimate equation (4). For equation (2), a vector errorcorrection model (VECM) is estimated since there is strong evidence of cointegration between cornand ethanol. Findings from (Mallory, Irwin, and Hayes, forthcoming 2012) also support a long-run equilibrium relationship between ethanol and corn. Model selection criterion (AIC) is used todetermine lags; the VECM is represented as:
∆ct = π1ECTt−1 +2
∑i=1
βi∆ct−1 +2
∑i=1
γi∆tht−i + εct,t ,(10)
∆tht = π2ECTt−1 +2
∑i=1
δi∆ct−i +2
∑i=1
φi∆tht−i + εth,t ,(11)
where ECTt−1 denotes the error correction term. Estimating equations (10) and (11) generatesresiduals that are the estimates of the corn and ethanol shocks presented in equation (3). These areused to jointly estimate equations (3) and (5) using a quasi maximum likelihood procedure. Whilenot efficient, this two-stage procedure is asymptotically consistent and is commonly used because itavoids convergence and local maxima problems Silvennoinen and Terasvirta (2009).
For equations (10), (11), and (for consistency) (1), we used the continuous price series describedearlier. The procedure used to generate the series can create artificial jumps in the data thatcorrespond to the rollover dates, which could potentially affect the results. As identified by Carchanoand Pardo (2009), there is no established method to account for the rollover effect when creatinga continuous price level series. Here we follow Bessler and Covey (1991) and Franken, Parcell,and Tonsor (2011) to assess the potential effects. To test whether the jumps at contract rolloveraffect our results, we include dummy variables for the rollover dates in the cointegration tests, thecorresponding vector error correction model, and in the GJR-GARCH and BEKK estimations. Wefind the dummy variables to be insignificant in general and to have no effect on the results of theanalysis.
Based on the characteristics of the series, we assume the error process for equations (4) and (5)follow a t-distribution and allow the quasi maximum likelihood procedure to obtain the shape ofthe distribution that provides the best fit to the series. Diagnostic tests, including portmanteau test,ARCH-LM, normality, and inspection for stationarity (i.e., modulus of the eigenvalues), suggestedno misspecification.6 For equations (6) and (7), we take the product of the matrix multiplication ofequation (5) and compute its standard errors using the delta method. The calculations of equations(8) and (9) follow directly from the estimated results.
Estimation Results
The GJR-GARCH is used to estimate the conditional volatility of crude oil. Results in table 3suggest asymmetry in the ARCH component of the model. Negative innovations generate a biggerimpact on volatility than positive shocks; in this case, λ1 is not only larger than α1, but λ1 is highlystatistically significant, while α1 is not. The GARCH component indicates that the random shockshave a significant and relatively long-lasting effect. The conditional standard errors of the crude oilmarket are plotted in figure 5. The largest conditional volatility is observed during the financial crisisat the end of 2008 and the recovery period in spring 2009. Table 4 presents the results of the vectorerror correction model and Granger causality tests. Results indicate unidirectional Granger causalityfrom corn to ethanol prices. Diagnostic tests of the VECM show no evidence of autocorrelation, butthere is evidence of ARCH effects.
6 Diagnostic tests are available from the authors on request.

256 August 2012 Journal of Agricultural and Resource Economics
Figure 5: Conditional Standard Error of Crude Oil and Corn and Ethanol Spillover Ratios
Table 3: GJR-GARCH for Crude OilVariable Coeffcient t-Statisticα0 0.00 1.77α1 0.00 0.43λ1 0.14∗∗ 2.11α2 0.88∗∗ 15.78
Notes: Double asterisks (∗∗) represent significance at the 5% level.
The results in table 5 provide the estimates of the price shocks spillovers from crude oil to corn,φ , and crude oil to ethanol, ω , with the BEKK coefficients of the idiosyncratic errors of corn andethanol. Strongly significant spillover coefficients confirm the existence of volatility linkages fromthe crude oil market, with spillovers to corn being higher than the spillover to ethanol.
Volatility Spillover Ratios
We measure the strength of the volatility transmission from crude oil to corn and ethanol bycalculating volatility spillover ratios, which are defined as:
φ 2σ2t
hcc,t + φ 2σ2t∈ [0,1],(12)
ω2σ2t
hthth,t + ω2σ2t∈ [0,1].(13)
Figure 5 plots these ratios, which measure the portion of the conditional variability in corn andethanol prices attributable to crude oil price shocks at different points in time. The spillover effectfrom the crude oil to corn and ethanol follows the dynamics of the conditional volatility of crude oil.During the period of analysis, volatility spillover ratios from crude oil averaged 14% for corn and16% for ethanol, displaying a large range between 4% and 44%. However, the histograms (figure6) and summary statistics of the spillover ratios (table 6)—in particular their interquartile ranges—suggest that during the period 2006-2011 crude oil shocks have consistently been responsible for10% to 20% of the conditional volatility of corn and ethanol.
Further, figure 5 shows that particularly after the 2009 financial crisis period, volatility spikes incrude oil seem to be closely linked to the peaks in spillover ratios, occasionally reaching more than
Trujillo-Barrera, Mallory, and Garcia Spillover in Oil, Ethanol, and Corn Markets 257
Table 4: Vector Error Correction for Corn and Ethanol PricesDependent Variable: ∆ct
Variables Coefficients t-Statistic∆Cornt−1 0.09 1.17∆Cornt−2 0.02 0.23∆Ethanolt−1 −0.17 −1.92∆Ethanolt−2 0.15 1.69ECTt−1 0.01 1.32
Dependent Variable: ∆tht
Variables Coefficients t-Statistic∆Cornt−1 0.17∗∗∗ 2.63∆Cornt−2 0.05 0.73∆Ethanolt−1 −0.11 −1.50∆Ethanolt−2 −0.00 −0.05ECTt−1 −0.01∗∗∗ −3.07
Test for Granger-causality:
H0: Corn does not Granger-cause EthanolTest statistic 3.67p-value 0.01
H0: Ethanol does not Granger-cause CornTest statistic 2.47p-value 0.06
Notes: Triple asterisks (∗∗∗) represent significance at the 1% level.
Table 5: BEKK GARCHVariable Coefficients t-Statisticφ 0.36∗∗∗ 6.85ω 0.30∗∗∗ 7.31C(c,c) 0.03∗∗∗ 4.75C(th,c) 0.02∗∗∗ 4.71C(th,th) 0.00 0.00A(c,c) 0.45∗∗∗ 4.32A(c,th) 0.22∗∗∗ 2.34A(th,c) −0.12 −1.16A(th,th) 0.24∗∗∗ 2.63B(c,c) 0.78∗∗∗ 9.53B(c,th) −0.17∗∗∗ −2.51B(th,c) −0.14 −1.18B(th,th) 0.77∗∗∗ 6.58
φ 2 0.13∗∗∗ 3.42ω2 0.09∗∗∗ 3.65
Notes: Triple asterisks (∗∗∗) represent significance at the 1% level.

258 August 2012 Journal of Agricultural and Resource Economics
Figure 6: Histograms of Ethanol and Corn Spillover Ratios, 2006-2011
Table 6: Summary Statistics of Volatility Spillover Ratios (N = 271)Estimated CornSpillover Ratio
Estimated EthanolSpillover Ratio
Minimum 0.04 0.05Maximum 0.43 0.441st Quartile 0.10 0.113rd Quartile 0.15 0.18Mean 0.14 0.16Median 0.12 0.14SD 0.07 0.07Skewness 2.01 1.55Excess kurtosis 4.18 2.42
20%. Virtually all the spillover ratios higher than 20% took place after the sharp decline of oil pricesin 2008. This is more noticeable for ethanol, where its interquartile range shows that spillover ratioshigher than 18% took place in 25% of the occurrences. It is clear that ethanol and corn volatilities arestrongly influenced by crude oil volatility and tend to move together. Although the spillover ratiosto ethanol and corn seem similar in size, ethanol exhibited higher ratios during most of the sampleperiod.
To investigate the volatility spillovers between the corn and ethanol markets, we calculate theparameters of equations (6) and (7). The top of table 7 provides the corn conditional variance, hcc,t .Most of the volatility in corn is market specific, since the effect of the own lagged squared errors,a2
11, and the conditional lagged variance, b211, are highly significant. Ethanol does not affect corn
volatility since coefficients a221, 2a11a21, 2b11b21, and b2
21 are not significant. The bottom of table 7provides the ethanol conditional variance, hthth,t . Here, own significant GARCH effects exist. Thecoefficients 2a12a22 and 2b12b22 show strong spillovers from corn to ethanol volatility.
To further investigate the interactions between corn and ethanol, we provide their conditionalcorrelations obtained from the GARCH BEKK (figure 7). Although time varying, the correlationssuggest a stronger relationship between corn and ethanol markets, particularly starting in 2008. Thisis consistent with the observed similarity in spillovers from crude oil to the two markets and thecointegrating relationship estimated; it is evident that these markets have been closely related inrecent years. Finally, to identify the economic magnitude of the increased risk associated with thevolatility spillovers for participants in corn and ethanol markets, consider their impact on the price ofa corn option (table 8). Begin with the price of an at the money call option on a corn futures contract

Trujillo-Barrera, Mallory, and Garcia Spillover in Oil, Ethanol, and Corn Markets 259
Figure 7: BEKK Correlation between Ethanol and Corn
Table 7: BEKK Conditional VariancesConditional Variance of Corn
hcc,t c211 a2
11 2a11a21 a221 b2
11 2b11b21 b221
Coefficients 0.00∗∗∗ 0.20∗∗∗ 0.20 0.01 0.62∗∗∗ −0.22 0.02t-Statistics 2.38 2.16 1.58 0.58 4.76 −1.24 0.59
Conditional Variance of Ethanolhthth,t c2
12 c222 a2
12 2a12a22 a222 b2
12 2b12b22 b222
Coefficients 0.00∗∗∗ 0.00∗∗∗ 0.06 0.11∗∗∗ 0.06 0.03 −0.27∗∗∗ 0.60∗∗∗
t-Statistics 2.37 0.00 1.17 2.50 1.31 1.25 −2.82 3.29
Notes: Triple asterisks (∗∗∗) represent significance at the 1% level.
Table 8: Economic Magnitude of the Volatility Spillovers in the Corn MarketNo Spillover from Oil With 15% Spillover from Oil With 45% Spillover from Oil
Corn Volatility B-S Call Price Corn Volatility B-S Call Price Corn Volatility B-S Call Price25% $0.34/bushel 28% $0.39/bushel 34% $0.47/bushel
$1,700/contract $1,950/contract $2,350/contract
Notes: Risk free interest rate = 5%, corn futures price = $5.00, and strike price = $5.00 for 6 months to maturity. Annualized corn conditional
volatility =√
hcc,t + φ 2σ 2t√
52.
six months from maturity that is trading at $5.00 per bushel. In the absence of volatility spilloverfrom the oil market and annualized volatility in the corn market of 25%, the Black-Scholes price ofthe option is $0.34 per bushel. Here, we estimated that a typical spillover during the period 2006-2011 from oil to corn was approximately 15%. This translates into an annualized corn volatility of28% with the option price increasing from $0.34 to $0.39 per bushel. Therefore, a typical spilloverrepresents an increase on cost of the option of 14% from the baseline, which is equivalent to $250per contract. During the height of the volatility, we estimated that spillovers from the oil to the cornmarket were nearly 45%. In this case the at the money call option price increases from $0.34 to$0.47 per bushel, which represents an increase of 38% in the cost of the option. This translates intoa $650 per contract increase in the cost of the option due to volatility spillover from the oil marketduring the financial crisis.
Conclusions and Remarks
Using a trivariate model, we identify volatility spillovers from the crude oil futures market to ethanoland corn futures markets during 2006-2011, a period when corn-based ethanol production reached

260 August 2012 Journal of Agricultural and Resource Economics
25-35% of total corn use and the oil market experienced dramatic changes. We find strong andvarying volatility transmission from crude oil to the corn and ethanol markets, with moderatelymore intense effects emerging in the ethanol market. The effect of crude oil price volatility on cornand ethanol averaged almost 15%, but reached 45% during periods of high variability in the crudeoil market. At the maximum, the added volatility as a result of the spillover would have resulted in a38% cost increase to users of corn options. Spillovers also existed from the corn to ethanol market,but there was no evidence of spillovers from ethanol to corn. This transmission is consistent withcausality tests performed on the level data and with the idea that the corn market is able to absorbshort-run shocks in demand from the energy sector more readily than the ethanol market, becausegrain can be reallocated from other uses such as exports, feed, food, and stocks. Evidence from thecointegrating relationship, the changes in conditional correlations (particularly after mid-2008), andthe systematic nature of the spillovers from the crude oil market indicate that the corn and ethanolmarkets have been closely connected during the period.
In light of the increased variability, risk management strategies become more important todecision makers. For private decision makers there is evidence that instruments such as the futuresmarket still can offer hedging opportunities (Wu, Guan, and Myers, 2011), but it is clear that thechanging nature of the volatilities places a high value on the use of time-vary hedging strategies.Options strategies can also be powerful tools in an environment of high price volatility. For instance,a long straddle position that involves the simultaneous purchase of an at the money call option anda put option can be profitable when prices are rapidly changing. Recently, new risk managementinstruments such as Volatility Index Futures (VIX) for crude oil and corn also have been introducedat the Chicago Mercantile Exchange. VIX contracts are designed to manage short-term volatility,and their payoffs are determined by changes in volatility. Wang, Fausti, and Qasmi (2012) argue thatthe Corn VIX will improve volatility forecasting and enhance market participants’ ability to moreaccurately gauge price risk in the corn market. Over-the-counter variance swaps allow users to tradefuture realized volatility against current implied volatility. It remains to be seen if the liquidity andperformance of these instruments will be sufficient for managing this added market risk.
Developing an understanding of magnitude and timing of market shocks is an importantdimension of risk management. Clearly, the effect of crude oil price and biofuel policies on cornand ethanol price volatility is highly dependent on the market context. The main biofuels policyinstruments during the period were the blender’s tax credit, the Renewable Fuel Standard, and theimport tariffs. The subsidy increased demand for ethanol, which in turn increased ethanol and cornprices. The import tariff limited competition with Brazilian ethanol and reduced the market’s abilityto handle potential unexpected supply disruptions. However, the tariff likely had only a small impacton price volatility during 2006-2011 (Babcock, 2011). In a forward context, the blender tax creditand the import tariffs were eliminated by the end of 2011. Under the mandate, a minimum quantityof ethanol must be consumed, regardless of fuel, corn, and ethanol prices. As processors respondto the changes in the oil market, increases in required ethanol production over time may supportthe added volatility identified here. However, when the mandate is binding, corn feedstock demandsensitivity to ethanol and energy price shocks will be reduced (Yano, Blandford, and Surry, 2010).
Developing a sense of timing for risk management purposes may be more problematic, since it isdifficult to anticipate shocks and their more lasting effects. Government policies to promote markettransparency by improving information and surveillance systems (e.g., IFPRI’s Early WarningSystem) may enable better monitoring of market situations and permit quick response. In addition,since conditional volatility tends to cluster, the information of crude oil volatility combined withvolatility spillover ratios to corn and ethanol can be seen as a step towards monitoring andanticipating volatility shocks and their transmission.
[Received September 2011; final revision received March 2012.]

Trujillo-Barrera, Mallory, and Garcia Spillover in Oil, Ethanol, and Corn Markets 261
References
Babcock, B. A. “The Impact of U.S. Biofuel Policies on Agricultural Price Levels and Volatility.”Issue Paper 35, International Centre for Trade and Sustainable Development, Geneva, 2011.
Baffes, J. “The Energy/Non-Energy Price Link: Channels, Issues, and Implications.” In I. Piot-Lepetit, ed., Methods to Analyse Agricultural Commodity Price Volatility, New York: Springer,2011, 31–44.
Balcombe, K. and G. Rapsomanikis. “Bayesian Estimation and Selection of Nonlinear Vector ErrorCorrection Models: The Case of the Sugar-Ethanol-Oil Nexus in Brazil.” American Journal ofAgricultural Economics 90(2008):658–668.
Bessler, D. A. and T. Covey. “Cointegration: Some Results on U.S. Cattle Prices.” Journal of FuturesMarkets 11(1991):461–474.
Campiche, J. L., H. L. Bryant, J. W. Richardson, and J. L. Outlaw. “Examining the EvolvingCorrespondence Between Petroleum Prices and Agricultural Commodity Prices.” Portland OR:American Agricultural Economics Association, 2007. Available online at: http://ideas.repec.org/p/ags/aaea07/9881.html.
Carchano, Ó. and Á. Pardo. “Rolling Over Stock Index Futures Contracts.” Journal of FuturesMarkets 29(2009):684–694.
Cui, J., H. Lapan, G. Moschini, and J. Cooper. “Welfare Impacts of Alternative Biofuel and EnergyPolicies.” American Journal of Agricultural Economics 93(2011):1235–1256.
Dahlgran, R. A. “Ethanol Futures: Thin but Effective?–Why?” In Proceedings of the NCCC-134Conference on Applied Commodity Price Analysis Forecasting and Market Risk Management, St.Louis, MO, 2010.
Du, X., C. L. Yu, and D. J. Hayes. “Speculation and Volatility Spillover in the Crude Oil andAgricultural Commodity Markets: A Bayesian Analysis.” Energy Economics 33(2011):497–503.
Franken, J. R. V., J. L. Parcell, and G. T. Tonsor. “Impact of Mandatory Price Reporting on HogMarket Integration.” Journal of Agricultural and Applied Economics 43(2011):229–241.
Gilbert, C. L. and C. W. Morgan. “Food Price Volatility.” Philosophical Transactions of the RoyalSociety of London. Series B, Biological Sciences 365(2010):3023–3034.
Glosten, L. R., R. Jagannathan, and D. E. Runkle. “On the Relation Between the Expected Value andthe Volatility of the Nominal Excess Return on Stocks.” Journal of Finance 48(1993):1779–1801.
Harri, A. and H. Darren. “Mean and Variance Dynamics between Agricultural Commodity Pricesand Crude Oil Prices and Implications for Hedging.” In The Economics of Alternative EnergySources and Globalization: The Road Ahead Meeting, Orlando, FL, 2009.
Hertel, T. and J. Beckman. “Commodity Price Volatility in the Biofuel Era: An Examination ofthe Linkage between Energy and Agricultural Markets.” GTAP Working Papers 3214, Centerfor Global Trade Analysis, Department of Agricultural Economics, Purdue University, WestLafayette, IN, 2011. Available online at http://ideas.repec.org/p/gta/workpp/3214.html.
Irwin, S. H. and D. L. Good. “Market Instability in a New Era of Corn, Soybean, and Wheat Prices.”Choices 24(2009):7–11.
Mallory, M. L., S. H. Irwin, and D. J. Hayes. “How Market Efficiency and the Theory of StorageLink Corn and Ethanol Markets.” Energy Economics (forthcoming 2012).
Muhammad, A. and E. Kebede. “The Emergence of an Agro-Energy Sector: Is AgricultureImporting Instability from the Oil Sector?” Choices 24(2009):12–15.
Ng, A. “Volatility Spillover Effects from Japan and the U.S. to the Pacific-Basin.” Journal ofInternational Money and Finance 19(2000):207–233.
Prakash, A. “Why Volatility Matters.” In A. Prakash, ed., Safeguarding Food Security in VolatileGlobal Markets, Rome: Food and Agriculture Organization of the United Nations, 2011, 3–26.
Serra, T., D. Zilberman, J. M. Gil, and B. K. Goodwin. “Price Transmission in the U.S. EthanolMarket.” In M. Khanna, J. Scheffran, and D. Zilberman, eds., Handbook of Bioenergy Economicsand Policy, 33. New York: Springer, 2010.
262 August 2012 Journal of Agricultural and Resource Economics
———. “Nonlinearities in the U.S. Corn-Ethanol-Oil-Gasoline Price System.” AgriculturalEconomics 42(2011):35–45.
Silvennoinen, A. and T. Terasvirta. “Multivariate GARCH Models.” In T. G. Andersen, ed.,Handbook of Financial Time Series, Berlin: Springer, 2009, 201–229.
Sumner, D. A. “Recent Commodity Price Movements in Historical Perspective.” American Journalof Agricultural Economics 91(2009):1250–1256.
Thompson, W., S. Meyer, and P. Westhoff. “How Does Petroleum Price and Corn Yield VolatilityAffect Ethanol Markets with and without an Ethanol Use Mandate.” Energy Policy 37(2009):745–749.
Tothova, M. “Main Challenges of Price Volatility in Agricultural Commodity Markets.” In I. Piot-Lepetit and R. M’Barek, eds., Methods to Analyse Agricultural Commodity Price Volatility, NewYork: Springer, 2011, 13–29.
Tyner, W. E. “The Integration of Energy and Agricultural Markets.” Agricultural Economics41(2010):193–201.
U.S. Energy Information Administration. “How Much Ethanol is in Gasoline and How DoesIt Affect Fuel Economy.” 2012. Available online at http://www.eia.gov/tools/faqs/faq.cfm?id=27&t=10.
Wang, Z., S. W. Fausti, and B. A. Qasmi. “Variance Risk Premiums and Predictive Power ofAlternative Forward Variances in the Corn Market.” Journal of Futures Markets 32(2012):587–608.
Wright, B. D. “The Economics of Grain Price Volatility.” Applied Economic Perspectives and Policy33(2011):32–58.
Wu, F., Z. Guan, and R. J. Myers. “Volatility Spillover Effects and Cross Hedging in Corn and CrudeOil Futures.” Journal of Futures Markets 31(2011):1052–1075.
Yano, Y., D. Blandford, and Y. R. Surry. “The Impact of Feedstock Supply and Petroleum PriceVariability on Domestic Biofuel and Feedstock Markets - The Case of the United States.” WorkingPaper 58486, Swedish University of Agricultural Sciences, Department of Economics, 2010.
Zhang, Z., L. Lohr, C. Escalante, and M. Wetzstein. “Ethanol, Corn, and Soybean Price Relationsin a Volatile Vehicle-Fuels Market.” Energies 2(2009):320–339.