volatility of the south african rand author: …2015.essa.org.za/fullpaper/essa_3191.pdf · author:...
TRANSCRIPT
1
VOLATILITY OF THE SOUTH AFRICAN RAND
Author:
Azwifaneli Innocentia (Mulaudzi) Nemushungwa
Pomotors:
Prof. Agyapong Gyekye(University of Venda)
Email:[email protected]
Prof. Matthew, K. Ocran (Universiy of Western Cape)
Email:[email protected]
Abstract
Exchange rates across the world have fluctuated widely predominantly after the fall of the Bretton Woods system
of fixed exchange rate as many countries adopted floating exchange rate system. South Africa, like other
emerging market economies, is experiencing high exchange rate volatility. The rand is one of the most volatile
currencies in the world. Since 1996, five episodes of substantial real exchange rate depreciation, which were
followed by a steep appreciation thereafter. Given the fact that exchange rate variability affects the performance
of other macroeconomic variables in any economy, this necessitates the need to examine the behaviour of the
rand in South Africa. To this end, this paper explores the volatility of the South African rand for the period 1961
to 2013, using non-econometric methods (tables and figures) obtainable from SARB, BIS, Bloomberg, Investec
Wealth and Investment and; the Commission of Inquiry. Furthermore, it explores the South African foreign
exchange (rand) market and also analyses the performance of the rand relative to other currencies The review on
the South African foreign exchange market and the evolution of the South African exchange regime identified
that due to its international appeal, increase in daily turnover, being the proxy for other emerging currencies due
to its convertibility amongst other factors, the South African rand is more volatile. Secondly, since 2000, large
movements in effective exchange rate occurred as the country adopts a more flexible exchange rate regime. As
from the year 2000, the sole objective of the SARB has been inflation targeting. This has led the inflation rate to
be volatile. As inflation volatility can impede growth even if inflation on average remains restrained and
advocated, the suggestion is that the South African Reserve Bank should respond to exchange rate fluctuations.
Key words: Exchange Rate volatility, Non-Econometric Methods, South African Foreign Exchange Market,
South African Exchange Regimes

2
1. Introduction
1.1. Overview of the South African rand
The South African rand has experienced a number of significant exchange rate regime shifts
which were also related to changes in policy objectives (Kahn, 1992). Since its inception in 1961
until the second quarter of 1979 the country was operating under fixed exchange rate system, the
exchange rate was essentially fixed, being pegged to one currency or another. Between 1979 and
1999 the country was operating under a managed floating system, either a dual or unitary
exchange rate regime. A broader process of gradually liberalizing the financial market occurred
to reinstate the country into the global economy. From February 2000 till present a free floating
regime has been adopted together with an explicit inflation targeting system where the Reserve
Bank clearly stated that its mission was to protect the internal value of the rand and thus the rand
was left to float freely (Aron, Elbadawi and Kahn, 2000; De Kock Commission, 1985 and
Mtonga, 2011).Though this has essentially stabilized interest rates by making them more
predictable, but as this required the authorities to abandoned their pre-commitment to any
exchange rate parity, particularly using exchange rate interventions, it has effectively made the
exchange rate regime a free float (Mtonga, 2011).
1.2. Problem Statement
Exchange rates across the world have fluctuated widely predominantly after the fall of the
Bretton Woods system of fixed exchange rate in 1973, as many countries adopted floating
exchange rate system (Todani and Munyama, 2005). Since the move to floating exchange rate
system in 1973, the effect of dramatic movement of exchange rate has continued to generate
series of responses (Alaba, 2003). The literature on international economics suggests that the
global floating exchange rate system in operation since the post Bretton Woods period has
caused considerable exchange rate volatility in both industrial and emergent economies (Alaba,
2003). The South African rand is not an exception. Since its adoption of inflation targeting in the
mid 1990’s, South Africa has experienced significant currency volatility despite strong
macroeconomic fundamentals (Pretorius and de Beer, 2002). Since 1996; the country has
experienced five episodes of substantial real exchange rate depreciation, which were followed by
a steep appreciation thereafter. The main episodes of depreciation were in the first quarter of
1996 followed by a steep appreciation in the third quarter of the same year, in the second quarter
3
of 1998 followed by a steep appreciation in the third quarter of the same year, in the third quarter
of 2001, followed by its equally steep appreciations from 2002 to 2004 (Hodge, 2005), in the
fourth quarter of 2007 followed by a steep appreciation in the first quarter of 2008 and; in the
third quarter of 2008 followed by a steep appreciation in the fourth quarter of the same year.
Since 2000, three episodes of substantial nominal depreciation occurred, ranging from 20 to 42
percent, and on average, the real effective exchange rate moved by about three quarters of the
amount of the nominal effective rate (OECD, 2013).
1.3. Purpose of the study
This paper explores the volatility of the South African rand for the period 1996 to 2013, using
non-econometric methods (tables and figures) obtainable from SARB, BIS, Bloomberg. Investec
Wealth and Investment and the Commission of Inquiry. Furthermore, it analyses the
performance of the rand relative to other currencies and also determines the existence of any
relationship between the daily turnover of the rand and its trade weighted value.
1.4. Research Questions
How was the rand performing relative to other currencies for the period under review?
Is there any relationship between the daily turnover of the rand and its trade weighted value?
1.5. Hypotheses
The rand was the worst performer for the period under review. There is a clear relationship
between the daily turnover of the rand and its trade weighted value.
1.6. Significance of the study
Exchange rate is an important economic variable as its variability affects the performance of
other macroeconomic variables in any economy (Hashim and Zarma, 1996). Exchange rate
instability can cause a negative distortion in any economy (Ibikunle, 2011). Given the fact that
exchange rate variability affects the performance of other macroeconomic variables in any
economy, this necessitates the need to examine the behaviour of the rand in South Africa.
Although previous studies analyze the behaviour of exchange rate volatility in developing,
transition and developed economies using varying econometric techniques, the literature does not

4
specifically test whether the underlying structure of the performance of exchange rate volatility
in transition economies is consistent across these economies when faced with similar changes to
their macroeconomic fundamentals (Kularatne and Havemann,2008).This study will therefore
help to ascertain the performance of the South African rand relative to other transition
economies.
1.7. Structure of the paper
The rest of this paper is structured as follows: Section 2 presents the South African foreign
exchange market. Before the discussion on the South African foreign exchange market is
presented, the theories underlying the behaviour of exchange rate are explained in sub-section 2.
The South African foreign exchange market is part of the global foreign exchange market;
therefore a discussion on global foreign exchange market is presented before the South African
foreign exchange market is explored. Section 3 therefore presents a discussion on global foreign
exchange market. The South African foreign exchange (rand) market is then explored in section
4.Sections 5 and 6 present conclusion and policy recommendations respectively. Section 7
presents limitations and future plans.
2. Models of exchange rate
Before the discussion on the South African foreign exchange market is presented, the theories
underlying the behaviour of exchange rate should be explained. Determination and forecasting of
exchange rate involve many theories which include mainly purchasing power parity, balance of
payments approach (BOP), monetary approach and portfolio balance approach. Monetary and
portfolio approaches are regarded as asset theories (Khan and Abbas, 2015).
Purchasing Power Parity (PPP)
The theory is based on the ‘law of one price’, which argues that should, for example, a euro
price of a good be multiplied by the exchange rate (€ /US$) then it will result in an equal price of
the good in US dollars. In other words, if we assume that the exchange rate between the € and
US $ states at 1/1.2, then goods that cost € 10 in the EU should cost US$ 12 in the United States.
Otherwise, arbitrage profits will occur. However, it is the market that through supply and
demand will finally force accordingly the prices of the two currencies to the equilibrium point.

5
Thus, the law of one price and the purchase power parity between the two currencies will be
reinstated. Inflation differentials between countries will also be eliminated in terms of their effect
on the prices of the goods. Since the PPP will adjust to equal the ratio of their price levels. As
stated Lumby & Jones (1999), the currency of the country with the higher rate of inflation will
depreciate against the other country’s currency by approximately the inflation deferential. The
shortcomings of the theory are that, not all goods are traded internationally (for example,
buildings) and secondly, the transportation cost should represent a small amount of the good’s
worth.
The Balance of Payments (BOP) Approach
It stresses that a likely depreciation will increase the value of exports in home currency terms
(the larger the exports demand elasticity the greater the increase). Conversely, the imports will
become ‘more expensive’ and their value will be reduced in home currency (the larger the
imports demand elasticity the greater the decrease). Consequently, we can argue that unless the
value of exports increases less than the value of imports, the depreciation will improve the
current account.
The monetary approach
It assumes monetary factors impact the demand and supply of money and determine the
equilibrium exchange rate. Wide empirical investigations of this approach include mix results
about the theory such as Zettelmeyer (2003) and Rapach and Wohar (2004). According to the
monetary theory, exchange rates adjust to ensure that the quantity of money in each currency
supplied is equal to the quantity demanded (Parkin M. & King D. 1992).
Both Quantity Theory of Money (QTM) and Purchasing Power Parity (PPP) have been used in
support of the aforementioned theory. The QTM states that there is a direct relationship between
the quantity of money and the level of prices of goods and services sold (Investopedia.com). In
other words, more money equals more inflation. Locally, an increase in the money supply leads
to inflation, which in turn results in the decrease in the value of money or purchasing power. In
an international context, firstly, a rapid increase in the money supply (in the home currency),
which as stated earlier means inflation, will put into effect the PPP resulting in the depreciation
of the currency’s exchange rate. Secondly, a higher interest rate will also result in the currency’s

6
depreciation because of the positive relationship between interest rates and money circulation.
Finally, if the GDP grows faster than overseas GDP, the demand for money will increase.
Assuming there is a given supply of money, the exchanged rate will decrease, which is in direct
contrast to the PPP approach.
The portfolio approach, which is an extension of monetary model, assumes that monetary
factors impact the demand and supply of money and determine the equilibrium exchange rate.
Wide empirical investigations of this approach include mix results about the theory such as
Zettelmeyer (2003) and Rapach and Wohar (2004).
Portfolio balance approach towards determining exchange rate widens the monetary approach by
including financial assets such as bonds in it.It recommends that besides monetary factors,
holding of financial assets (local and foreign bonds) also influences the exchange rate
(Mckinnon, 1969; Khan and Abbas, 2015) According to this approach, exchange rate establishes
an equilibrium in the investor portfolio (including the money, local and foreign bonds) in such a
way that if there is a change in any one of these three assets, investor reestablishes the desired
balance in his portfolio. This rebalancing process needs adjustment which influences the demand
for the asset and in turn exchange rate. For example, if interest rate on foreign bonds increases, it
would increase the demand for the asset, increasing demand for foreign currency and
depreciating local currency (Sharan, 2012 (p.98; Khan and Abbas, 2015). Foreign money and
bonds are substitutes for local money and bonds. Therefore, if demand for local currency rises, it
appreciates the price of local currency. In the same way, increase in demand for local bonds
positively affects local currency. When demand for local bonds increases, local currency
appreciates (Khan and Abbas, 2015).
3. The (global) foreign exchange market
The foreign exchange (FX) market is a global decentralized market for trading of currencies
(BIS, 2013). It is essentially a global market where participants from different countries, centres
and jurisdictions continually operate under a set of rules mostly agreed upon under market
practice or convention. It plays the essential role of facilitating all payments across international
borders by providing instruments or mechanics for transferring funds between parties in different
countries. This is the market in which exchange rates are determined. The market plays a unique
role within the world of financial markets, as it underpins all other financial markets. It is,

7
therefore, necessary to have an understanding of this market in order to understand the behaviour
of the exchange rate (Hodge, 2005).
Foreign exchange market activity has been surveyed every three years since 1989, and over-the-
counter (OTC) interest rate derivatives market activity since 1995.The BIS Triennial Central
Bank Survey is the most comprehensive source of information on the size and structure of global
foreign exchange and OTC derivatives markets (BIS Triennial Central Bank Survey, 2013).
3.1. Global Foreign exchange turnover
The global foreign exchange daily turnover is the summation of the contribution of all the five
categories of financial instruments in all currencies (spot transactions, outright forwards, foreign
exchange swaps, currency swaps, and foreign exchange options & other related products).
Foreign exchange market trading grew by 72% (from $1 934 billion to $3 324 billion) between
2004 and 2007, 19% (from $3 324 billion to $3 971 billion) between 2007 and 2010 and; by 35
% (from $3 971 billion to $5 345 billion) between 2010 and 2013 Foreign exchange market
activity has been surveyed every three years since 1989, and over-the-counter (OTC) interest rate
derivatives market activity since 1995.The BIS Triennial Central Bank Survey is the most
comprehensive source of information on the size and structure of global foreign exchange and
OTC derivatives markets (BIS Triennial Central Bank Survey, 2013).

8
FIGURE 1- Global Foreign Exchange Market Turnover (Daily Averages in April)
4. The South African foreign exchange (rand) market
4.1. Daily turnover of the rand
The South African rand is the most heavily traded currency of all the sub-Saharan African
currencies. Trading in rand includes “real money” investments (which include pension funds,
insurance funds, sovereign wealth and endowment funds), hedge funds and banks & corporations
that require access to the US$/ZAR market for the purpose of international trade ((Kissi, 2013).
According to the 2013 BIS Report, daily turnover of the rand accounted for 1.1% of the average
$5.3 trillion global foreign exchange transactions in April 2013. The South African rand
increased its share from 0.7 percent in 2010, making it the 18th most traded currency in the
world – and the most traded currency of all African currencies (Writer, 2013). In 1998, the rand
was ranked 10th
, dropped to 13th
in 2001, 16th
in 2004, 15th
in 2007 and 20th
in 2010. In April
2013, the rand was ranked the 18th
most traded currency in the world.
9
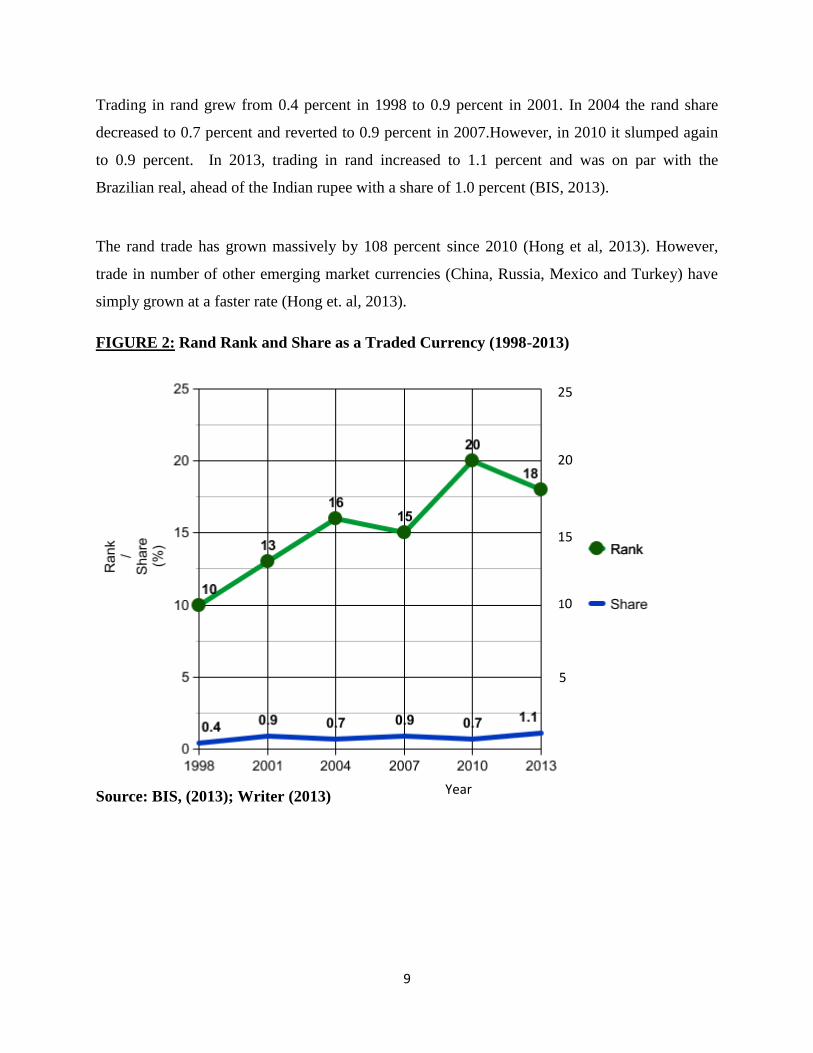
Trading in rand grew from 0.4 percent in 1998 to 0.9 percent in 2001. In 2004 the rand share
decreased to 0.7 percent and reverted to 0.9 percent in 2007.However, in 2010 it slumped again
to 0.9 percent. In 2013, trading in rand increased to 1.1 percent and was on par with the
Brazilian real, ahead of the Indian rupee with a share of 1.0 percent (BIS, 2013).
The rand trade has grown massively by 108 percent since 2010 (Hong et al, 2013). However,
trade in number of other emerging market currencies (China, Russia, Mexico and Turkey) have
simply grown at a faster rate (Hong et. al, 2013).
FIGURE 2: Rand Rank and Share as a Traded Currency (1998-2013)
Source: BIS, (2013); Writer (2013)
Year
5
10
15
20
25

10
The rand is an internationalized currency with the bulk of offshore trading taking place in
London. According to Greg Kennelly, a Johannesburg-based currency dealer with South Africa’s
Rand Merchant Bank, the rand is traded in both institutions and corporates. On the institutional
side, rand trading is done mainly by international investors as internal investors (local
institutions) are less active due to historical foreign exchange market controls. Trade by
international investors includes bonds, equities and derivatives. Real offshore trades come
mostly from corporates (Kissi, 2013).
Approximately 55 percent of all daily rand trading occurred in UK- between non-residents of
the country. This is partly due to the fact that there is almost no foreign exchange controls
applied to foreigners when dealing in the rand; yet numerous foreign exchange controls remain
effective for South African residents. It also highlights the difficulties the South African Reserve
Bank faces in trying to significantly and consistently influence the value of the rand (Economic
Focus, 2013).
The BIS Survey Report also highlighted that the world’s most traded currency pair is the
USD/EUR, accounting for 24.1 percent followed by USD/JPY at 18.3 percent, USD/GBP at 8.8
percent and USD/AUD, at 6.8 percent.
The USD/ZAR is the most dominant traded currency pair involving the rand, even though it
accounts for only 1.1 percent of the world currency trade. According to the 2013 BIS Survey
report, the USD/ZAR accounts for a massive 85 percent of the entire rand market. While the
USD/ZAR cash is no longer seeing the growth that the Indian rupee and the Chinese renminbi
are experiencing, it is by more a mature market in line with the Russian ruble, having the benefit
of CLS settlement (a global market infrastructure system for foreign exchange trade settlement
that mitigates credit at the settlement of a transaction) at finality of any transaction (Kissi, 2013).
4.2. Rand performance relative to other currencies (trade weighted value of the rand)
Though the South African foreign exchange market is mainly dominated by corporations, the
rand remains one of the most liquid emerging market currencies. As such, it does trade as a
proxy for the emerging market currencies in terms of expressing both negative and positive
11
views (Kissi, 2013). Therefore, as stated by Stephen Gallo, European Head of foreign exchange
strategy with BMO Capital Market, the rand can also lead other currencies on the decline and on
the advance (see Kissi, 2013). Between 1995 and 2001; the rand depreciated at a faster rate
against the US dollar and euro relative to other emerging currencies, with the exception of the
Mexican peso that depreciated during this period (Mpofu, 2013).
Between September 2000 and November 2000, the rand suddenly began declining against all
currencies, especially the euro. This was at a time when the euro began strengthening against the
US dollar. Between December 2000 and December 2001; the rand depreciated at a faster rate
against the U.S dollar relative to other currencies. The South African rand was the second fastest
depreciating currency after the Turkish Lira. However, the currencies of Mexico, Czech
Republic, Poland and Hungary were appreciating (Commission of Inquiry, 2002, see part b).
When compared to fellow emerging market currencies, South Africa’s currency holds its own.
As stated by Will Patrick, London-based Executive Director of Foreign Exchange Products with
CME Group, the rand is the only BRICS currency that utilizes CLS settlement, thus making it
more appealing to international investors and promoting its basis as an international currency
(Kissi, 2013).
In 2001, the rand held its own against the Korean Won, the Polish Zloty and the Mexican Peso
until September/ October 2001. During this period, it performed as well as other commodity
currencies, such as the Australian dollar, the Canadian dollar, the New Zealand dollar, the
Norwegian krone and the Swedish krone. However, in December 2001, the rand plunged in
value, and was even weaker than the Brazilian real (Commissions of Inquiry, 2002, see part b).
Between June and December 2001, it depreciated by 50 percent against the US dollar and
importantly against many other currencies (Raddatz, 2008) and; in December 2001, it
depreciated by 51.2 percent and reached its record low level of R13.84 against the US dollar on
21st December 2001. From the 1
st to the 31
st December 2001, the rand weakened by 42%
(Commission of Inquiry, 2002). Since its lowest point in December 2001 to September 2004, the
rand has appreciated by about 75 percent against the US dollar (Hodge, 2005).

12
The rand was the worst performer in 2005. In June 2005, the rand depreciated by 18.7% against
the US dollar, making it the worst performing currency in 2005 relative to a basket of seventy
one currencies (Bloomberg Financial Services, 2005). This was due to the large current account
deficit. The Turkish lira depreciated by 10.1%, the Iceland Krona by 7.7% and the New Zealand
dollar by 3.8% (Garrow, 2006).
Between 2002 and 2010, the rand also appreciated at a faster rate relative to the currencies of
Argentina, Brazil and Turkey, except the Mexican peso that was depreciating (Mpofu, 2013).
The rand was the second best performing currency against the US dollar between 2007 and 2011
(Bloomberg currency scoreboard or Rhodes university trust).In 2011; it was the third worst
performer (van der Merwe, 2012).
The rand dropped to a three year low as strikes spread across South Africa’s mining and
transportation, raising concern that the government may miss fiscal targets and boosting the cost
of ensuing nation’s debt. South Africa’s current account deficit widened to 6.4% in the second
quarter from 5.9% in the first quarter of 2012, following a significant increase in the trade deficit
in August of the same year (Bloomberg currency Scoreboard, 2007).
The rand was the worst performing emerging market currency in September 2012.Factors
attributing to this include sovereign rating downgrade, the negative news flow from South Africa
and the widening current account deficit (van der Merwe, 2012). By October 2012, the rand had
depreciated by 7.9 percent, competing with the Brazilian real as the worst performer among the
US dollar’s most traded counterparty (Gunnion, 2012).
Since early 2009 to 2012, the rand, like most emerging market currencies (Brazilian real, Korean
won, Thai baht and Indonesian won) appreciated against the US dollar, partly reflecting the
recovery from depreciation that occurred at the peak of the 2008 global financial crisis. The
renminbi, in contrast, has slowly but gradually appreciated against the US dollar since 2005 as
part of a deliberate exchange rate policy (Global Economic Outlook, 2012).
The rand crashed to a new 4-year low and was trading at R10.28 against the US dollar on 31
May 2013 as emerging market currencies sold off. The currency was at its weakest level in more
than four years and had depreciated by more than 12% in May 2013.The rand’s weakness is
13
attributed to dollar’s strength and domestic concerns over labour unrest and the country’s large
current account deficit. The Turkish lira and the Mexican peso also weakened sharply, but the
rand’s performance was worse, given that it is one of the most liquid emerging market
currencies. News that Glencore Xstrata workers went on strike on the 30th
of May also added
pressure on the rand (Isa, 2013).
In July 2013, the rand appreciated by 0.2 percent against the trade-weighted basket, following a
slightly weaker dollar. However, the trade-weighted rand (REER) remained weaker from
January to July 2013 (Isa, 2013).
The rand has led a drop against the US dollar among 16 major currencies and was the worst
performing emerging market currencies after the Argentina peso, slumping by 15 percent in 2013
(Visser, 2013).
In Morgan Stanley’s 2013 August research note, the Brazilian real, the Indonesian rupiah, the
South African rand, the Indian rupee and the Turkish lira were declared as the "Fragile Five," or
the troubled emerging market currencies under the most pressure against the U.S. dollar. “High
inflation, weakening growth, large external deficits, and in some cases exposure to China
slowdown, and high dependence on fixed income inflows left these currencies vulnerable," write
Morgan Stanley.
By August 2013, the rand had depreciated by 14.4 percent against the US dollar. Factors
weighing on the rand were South Africa's current account deficit and a rising REER which is
expected to worsen current account deficit concerns. The country’s current account deficit rose
6.5 percent of GDP.Other factors that contributed to the rand’ weakness were a slowdown in
China and the impact that it could have on commodity prices, specifically industrial metals and;
wildcat protests in most of South Africa’s mines to miners which saw wages growing faster than
inflation (Badkar, 2013).
The rand was the worst performing currency among major and emerging market currencies in
August 2013, followed by the Australian dollar ( Monthly Insights,2013).It depreciated by 1.4
percent against the trade-weighted basket, 1.1 percent against the US dollar, 1.3 percent against
the pound sterling, 1.2 percent against the euro and 0.1 percent against the yen ( Rand Prospects,
2013). The currency weakness is attributed to external factors (the reduced appetite for emerging
14
market currencies due to speculation of Fed stimulus (QE) tapering and falling commodity prices
as well as internal factors (labour unrest, bleak economic growth prospects and elevated twin
deficits).
From September to November 2013 the rand depreciated by 1.4 percent against the US dollar.
By 21st November 2013, the rand had depreciated by 16 percent against the British pound and 17
percent against the US dollar, making it the worst performer of the 16 major currencies, tracked
by Bloomberg (Bonorchis, 2013).Overall, the rand was the worst performing currency relative to
other emerging markets currencies in 2013 (Economic Focus, 2013).
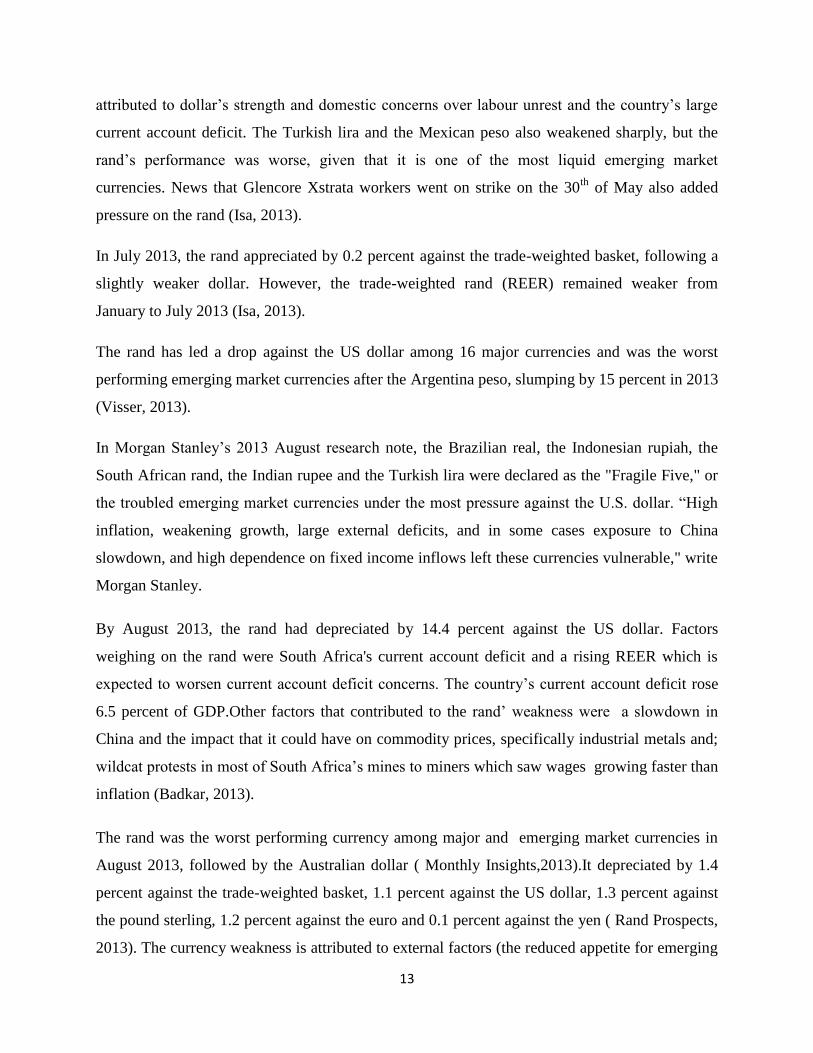
4.3. Daily turnover in rand and traded weighted value of the rand (REER)
Kantor (2013) states that as three quarters of the trade is conducted between third parties
(without a direct connection to South African trade or finance) who presumably trade and hedge
the rand so actively as a proxy for currencies that are less liquid, there is therefore no obvious
relationship between the trade weighted value of the rand and turnover in the currency market.
The rand had lost as much as 26 percent of its traded weighted value by May 2002. By early
2007, the rand was down by about 15 percent on its value a year before and 20 months later, it
had lost 19 percent of its value. On 31 May 2013, the rand was about 14 percent weaker than 12
months ago on a trade weighted basis. Though the long term trend in the value of the rand since
2000 has been one of rand weakness, the direction is by no means one way. Weakness can be
followed by strength of similar magnitude. These large exchange rate movements are a response
to interruptions or disruptions in the flow of capital to and from South Africa. Increased in
demand for the rand pushes the price of the rand higher and less demand moves the price of the
rand lower when valued in other currencies (traded weighted value of the rand).It is very much a
market-determined and flexible – very flexible in both directions – rate of exchange (Kantor,
2013).
15
FIGURE 2- FIGURE 3-Daily net turnover in rand (US$ millions), 2000-2013 and the trade
weighted value of the rand
5. Conclusion
This paper explores the volatility of the South African rand for the period 1996 to 2013, using
non-econometric methods within the context of the daily turnover of the rand and trade weighted
average of the rand.
The rand is the most heavily traded currency of all the sub-Saharan African currencies. In the
2013 BIS Survey Report, it was ranked in the 18th
position and was the only sub-Saharan African
currencies in the list of the top 20 most traded currencies in the world.
The USD/ZAR was the most dominant traded currency pair involving the rand in 2013, even
though it accounts for only 1.1% of the world currency trade. According to the 2013 report, the
USD/ZAR accounts for a massive 85% of the entire rand market.

16
Relative to other emerging market currencies, the South African rand is more volatile, seeing that
the currency is one of the most liquid currencies in the world.
There is no obvious relationship between rand turnover and its trade weighted value. The traded
weighted value of the rand is very much a market-determined and very flexible in both
directions.
The review on the South African foreign exchange market identified that due to its international
appeal, increase in daily turnover, being the proxy for other emerging currencies due to its
convertibility amongst other factors, the South African rand is more volatile. Secondly, since
2000, large movements in effective exchange rate occurred as the country adopts a more flexible
exchange rate regime.
6. Policy Recommendations
As from the year 2000, the sole objective of the SARB has been inflation targeting. This has led
the inflation rate to be volatile. Gupta (2012) states that exchange rate volatility can impede
growth even inflation on average remains restrained and advocated. The implication is that the
SARB should respond to exchange rate fluctuations.
7. Limitations and plans for future research
The present study only focuses on two aspects on the behaviour of the South African rand.
Aspects sources of exchange rate volatility and measuring exchange rate volatility can be
interesting avenues for future research.

17
References
1 .Badkar, M. (2013). Morgan Stanley presents: 'the fragile five' — the most troubled
currencies in emerging markets’. Business Insider. September 24, 2013.
2 Bank of International Settlements (2013).Triennial Central Bank Survey Foreign
exchange turnover in April 2013: preliminary global results.’ Monetary and Economic
Department, September 2013.
3 Bonorchis,R. (2013). ‘Investec First-Half Profit Falls as South African Rand Drops’.
November 21, 2013.
4 de Kock, G., 1985, Commission of Inquiry into the Monetary System and Monetary
Policy in South Africa, Final Report (Pretoria: Government Printer).
5 Economic Outlook, Budget Review, 2013.
http://www.treasury.gov.za/documents/national%20budget/2013/review/chapter%202.pdf
6 Foreign Forecasts. Putting Global Forex Markets in Perspective.
http:www.forexforecasts.coza/putting-the forex-market-in-perspective/
7 Garrow, C. (2006).Rand stays Worst Performer. Fin 24 Archives
8 Gunnion, S (2012). Rand worst performer as strikes raise fiscal target concern. October 5,
2012.Bloomberg.com.
9 Global Economic Outlook, (2012).
10 Hodge, D, 2005.Volatility of the real exchange rate of the rand Hodge, D, 2005.Volatility
of the real exchange rate of the rand: 1990-2004.Employment Growth & Development
Initiative: HSRC.
11 Hong et al, (2013).Milestone for Yuan Marks Rise of China: Yuan rises to ninth. Most
actively-traded-currency-globally. The Wall Street Journal, September5, 2013.Cambridge
Mercantile Group.
12 Isa, M. (2013). Rand plumbs new four-year low, ‘could fall further.’ Business Day Live,
May 31 2013.
13 Jonsson, G. (2001). Inflation, Money Demand, and Purchasing Power Parity in South
Africa. IMF Staff Papers , 48 (2), pp. 243-265.
14 Kahn, B. (1992). South Africa's exchange rate policy: lessons from the past. ET Working
Paper no 15. Cape Town: University of Cape Town, School of Economics.

18
15 Kissi, D. (2013). South Africa’s Currency Retains International Appeal. A Magazine
Published by CME Group, August 14, 2013.
16 Mboweni, T. (2002). ‘Statement to the Commission of Enquiry on the rapid depreciation
of the exchange rate of the rand and related matters’. Retrieved June2005, from
http://www.reservebank.co.za
17 Monthly Insight (2013). Nedbank Capital, 05 August 2013.
18 Mpofu, T. R. (2013).Real Exchange Rate Volatility and Employment Growth in South
Africa: The Case of Manufacturing,. University of Cape Town, South Africa.
19 Mtonga, E. (2011).’Did it matter? Monetary Policy Regime Change and Exchange Rate
Dynamics in South Africa’.
20 Myburgh, J. (2002). Commission of Inquiry into the rapid depreciation of the rand and
related matters: final report dated 30 June. Retrieved August 2003, from
http//www.doj.gov.za/commssionsrandfinal.html.
21 Pape, J. Economics- An introduction for South African learners.
22 Raddatz, C.(2008) “.Exchange Rate Volatility and Trade in South Africa.” Second Draft,
September 2008, World Bank.
23 Stals, C. (1999). .Statement on Reserve Bank Accommodation Procedures, 23 June,
1999..Quarterly Bulletin, South African Reserve Bank, June: 62.
24 Summit TV. (2013). ‘Outlook for the rand in 2013’, by Transcript service, January 16
2013.
25 van der Merwe, E. J. (1996). Exchange rate management policies in South Africa: recent
experiences and prospects. Occassional Paper no. 9. Pretoria: SARB.
26 van der Merwe , F.( 2012). Currency depreciation highlights diversification benefits of
offshore investments. October 6, 2012.
27 Visser, J.(2013). Rand’s fall strikes best EM stock rally riskless return, October 06, 2013.
28 Wakeford, J. (2002). Monetary and Exchange rate policies in South Africa. In N. Natrass,
J. Wakeford, & S. Muradzikwa (Eds.), Macroeconomics: theory and policy inSouth
Africa (2nd Edition ed.). Cape Town: David Phil
29 Writer, S. (2013). ‘Rand vs the dollar in 2013’. Free Newsletter. January 2, 2013.
19
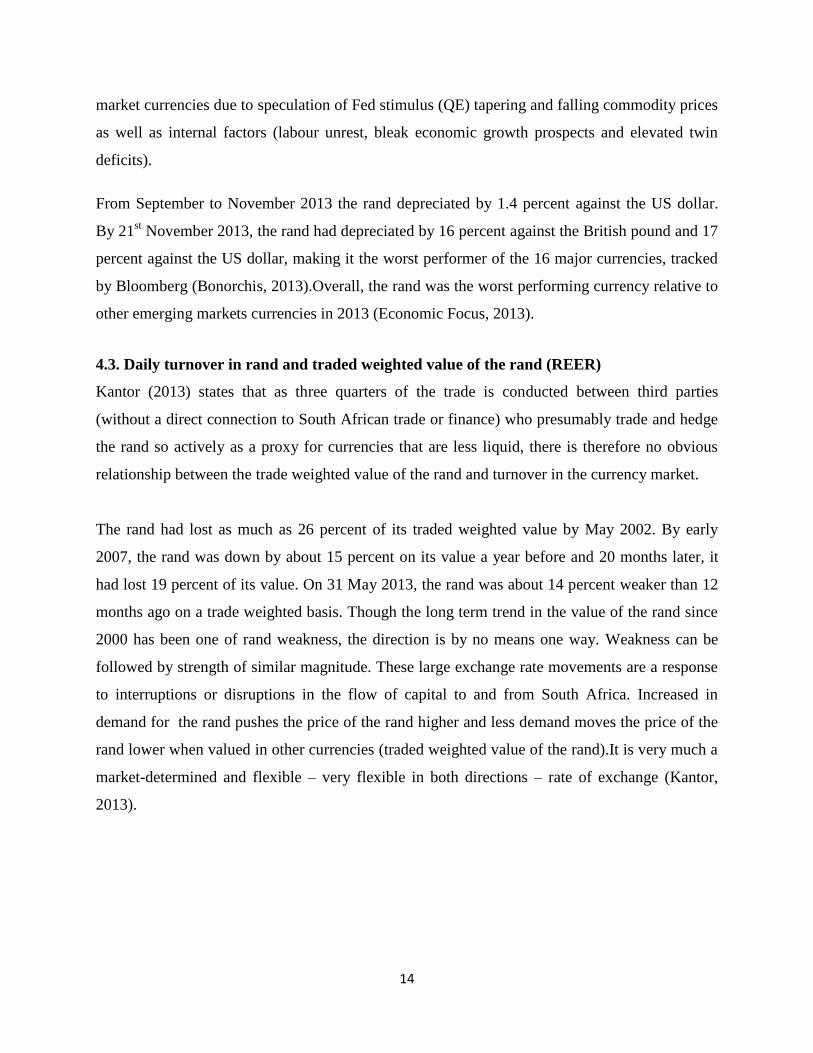
APPENDIX
TABLE 1:EXCHANGE REGIME CLASSIFICATION IN SOUTH AFRICA
Episode Period Exchange regime Exchange regime classification Details
I 1961-June1974 Hard peg Currency board arrangement Rand pegged to pound
or US dollar
II June 1974-June 1975 Soft peg Crawling peg Rand adjusted
frequently in small
amounts against a
basket of currencies
III June 1975-May 1979 Hard peg- Currency board arrangement Rand pegged to the US
dollar
IV June1979-January 1983 Soft peg & Floating Crawling peg &Free floating Commercial rand
adjusted periodically
against the US dollar
but the financial rand
was allowed to float
freely
V February1983-August
1985
Floating Managed floating with no
predetermined target
VI September1985-February
1995
Floating Managed & free floating
VII March 1995-January
2000
Floating Managed floating with no
predetermined target
VIII February2000-present Floating Independently floating
Source: Jonsson, G. (2001). Inflation, Money Demand, and Purchasing Power Parity in South Africa. IMF Staff
Papers , 48 (2), pp. 243-265.
Aron, Elbadawi and Kahn (2000), De Kock Commission (1985), Mtonga (2011) and Author’s compilation.
20
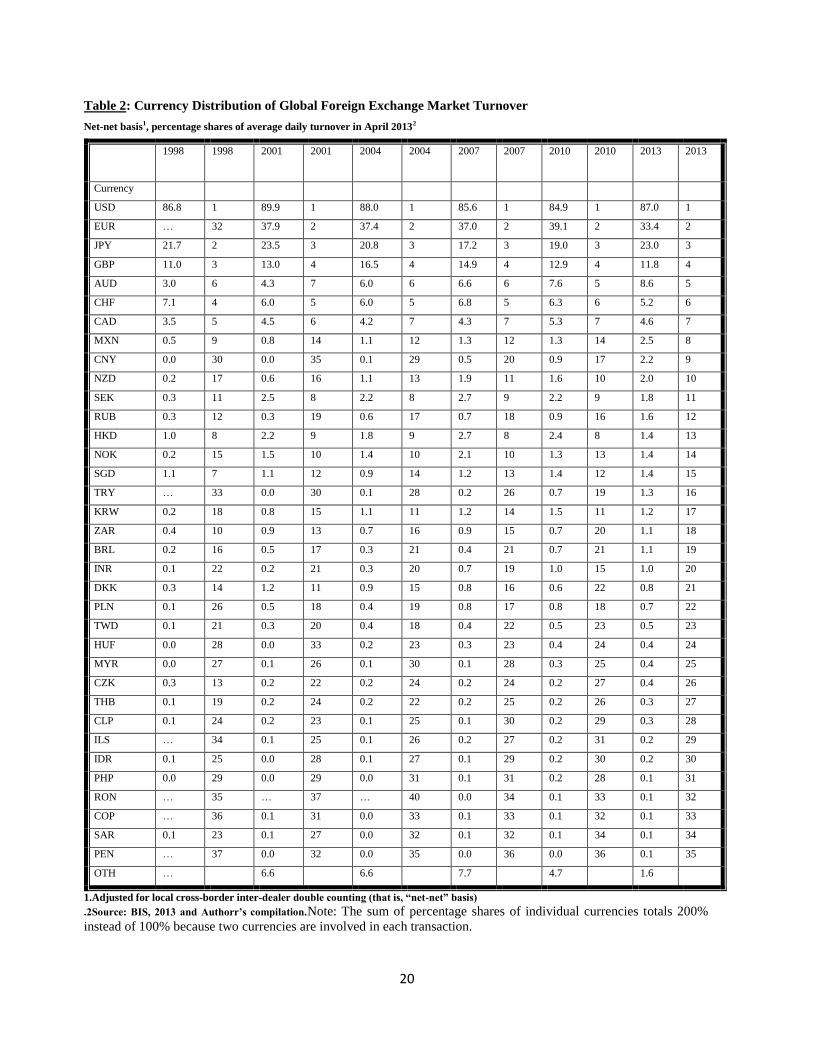
Table 2: Currency Distribution of Global Foreign Exchange Market Turnover
Net-net basis1, percentage shares of average daily turnover in April 20132
1998 1998 2001 2001 2004 2004 2007 2007 2010 2010 2013 2013
Currency
USD 86.8 1 89.9 1 88.0 1 85.6 1 84.9 1 87.0 1
EUR … 32 37.9 2 37.4 2 37.0 2 39.1 2 33.4 2
JPY 21.7 2 23.5 3 20.8 3 17.2 3 19.0 3 23.0 3
GBP 11.0 3 13.0 4 16.5 4 14.9 4 12.9 4 11.8 4
AUD 3.0 6 4.3 7 6.0 6 6.6 6 7.6 5 8.6 5
CHF 7.1 4 6.0 5 6.0 5 6.8 5 6.3 6 5.2 6
CAD 3.5 5 4.5 6 4.2 7 4.3 7 5.3 7 4.6 7
MXN 0.5 9 0.8 14 1.1 12 1.3 12 1.3 14 2.5 8
CNY 0.0 30 0.0 35 0.1 29 0.5 20 0.9 17 2.2 9
NZD 0.2 17 0.6 16 1.1 13 1.9 11 1.6 10 2.0 10
SEK 0.3 11 2.5 8 2.2 8 2.7 9 2.2 9 1.8 11
RUB 0.3 12 0.3 19 0.6 17 0.7 18 0.9 16 1.6 12
HKD 1.0 8 2.2 9 1.8 9 2.7 8 2.4 8 1.4 13
NOK 0.2 15 1.5 10 1.4 10 2.1 10 1.3 13 1.4 14
SGD 1.1 7 1.1 12 0.9 14 1.2 13 1.4 12 1.4 15
TRY … 33 0.0 30 0.1 28 0.2 26 0.7 19 1.3 16
KRW 0.2 18 0.8 15 1.1 11 1.2 14 1.5 11 1.2 17
ZAR 0.4 10 0.9 13 0.7 16 0.9 15 0.7 20 1.1 18
BRL 0.2 16 0.5 17 0.3 21 0.4 21 0.7 21 1.1 19
INR 0.1 22 0.2 21 0.3 20 0.7 19 1.0 15 1.0 20
DKK 0.3 14 1.2 11 0.9 15 0.8 16 0.6 22 0.8 21
PLN 0.1 26 0.5 18 0.4 19 0.8 17 0.8 18 0.7 22
TWD 0.1 21 0.3 20 0.4 18 0.4 22 0.5 23 0.5 23
HUF 0.0 28 0.0 33 0.2 23 0.3 23 0.4 24 0.4 24
MYR 0.0 27 0.1 26 0.1 30 0.1 28 0.3 25 0.4 25
CZK 0.3 13 0.2 22 0.2 24 0.2 24 0.2 27 0.4 26
THB 0.1 19 0.2 24 0.2 22 0.2 25 0.2 26 0.3 27
CLP 0.1 24 0.2 23 0.1 25 0.1 30 0.2 29 0.3 28
ILS … 34 0.1 25 0.1 26 0.2 27 0.2 31 0.2 29
IDR 0.1 25 0.0 28 0.1 27 0.1 29 0.2 30 0.2 30
PHP 0.0 29 0.0 29 0.0 31 0.1 31 0.2 28 0.1 31
RON … 35 … 37 … 40 0.0 34 0.1 33 0.1 32
COP … 36 0.1 31 0.0 33 0.1 33 0.1 32 0.1 33
SAR 0.1 23 0.1 27 0.0 32 0.1 32 0.1 34 0.1 34
PEN … 37 0.0 32 0.0 35 0.0 36 0.0 36 0.1 35
OTH … 6.6 6.6 7.7 4.7 1.6
1.Adjusted for local cross-border inter-dealer double counting (that is, “net-net” basis)
.2Source: BIS, 2013 and Authorr’s compilation.Note: The sum of percentage shares of individual currencies totals 200%
instead of 100% because two currencies are involved in each transaction.

21