vol.3 issue no.3 september 2013 - non olympic...
TRANSCRIPT

0 | Journal of Management and Science | Vol.3.No.3 | September 2013 ISSN: 2249-1260|eISSN: 2250-1819
Vol.3 Issue No.3 September 2013

1 | Journal of Management and Science | Vol.3.No.3 | September 2013 ISSN: 2249-1260|eISSN: 2250-1819
A Theoretical Review on the Status and Trend of Exports
(Goods and Services) and Investments (Foreign and Domestic)
in Assam and North-East India and their Untapped Impact on
the Economic Growth of the Region: The Story so far
Rashmita Baruaa and G.G. Banik
b
aAsst. Prof. and Research Schohar,Assam Don Bosco University, Airport Road, Azara, Guwahati-
781017, Assam, India bAssociate Prof, Gauhati Commerce College, R.G. Baruah Road, Guwahati- 781021, Assam, India
ABSTRACT: A number of studies reveal that export expansion is widely regarded as a means to
attain higher rate of economic growth. In a dynamic setting, trade usually enhances technological
up-gradation, higher rates of productivity, attracts inward investment and facilitates economic
growth. One of the most viable development strategies for a country‟s economic success is to find its
own niche in the global marketplace, which means to be able to tap the demands of the world
economy. Many developing countries have been trying to overcome a dismal economic situation by
promoting international trade. In these efforts, exports have been viewed as an „engine‟ of economic
growth. With the emergence of the World Trade Organization, the institutional framework for freer
multilateral movement of goods and services has been strengthened. Although the Indian Economy
has been benefited from the time new economic reforms were initiated since 1991, North-Eastern
Region still remains to be far from the purview of India‟s rapid development. With its geographical
remoteness, inherent deficiency in infrastructure and the bad publicity for recurrent ethnic strife and
militant activities, the region obviously could not become an attractive destination for private and
foreign capital investment. But in this period of globalization, where closer cross-border economic
ties are being speeding up in many parts of the world, border trade has come to be looked upon with
a lot of expectation in this region to break free from the shackles of geographic remoteness. Given
the natural and human resource potential of Assam, the need for higher growth has recently been felt
by various sections of the people as well as the State and Central Governments.
Keywords: ASEAN; Investments; Trade; Exports; Merchandize; Connectivity; FDI; Private
Investments; Economic Growth.
1. INTRODUCTION
As it would appear, a significant part of the literature deals with issues relating to economic
backwardness of Assam. A number of studies reveal that export expansion is widely regarded as a
means to attain higher rate of economic growth. The starting point of the discussion, over the
relationship between a region‘s economic performance and its exports, can be traced back to the
founding fathers of modern economic thought. Classical economists Adam Smith and David Ricardo
emphasized the importance of International trade in a region‘s economic growth. They argued that a
country could benefit considerably if it specialized in a certain commodity and then exported it to the
foreign countries that lacked that commodity (Smith, 1776; and Ricardo, 1817).
In a dynamic setting, trade usually enhances technological advancement, higher
productivity, attracts investment and facilitates economic growth. With the emergence of the World
Trade Organization, the institutional framework for freer multilateral movement of goods and

2 | Journal of Management and Science | Vol.3.No.3 | September 2013 ISSN: 2249-1260|eISSN: 2250-1819
services has been strengthened. But as has been addressed, (M. P. Bezbaruah, 2006) Assam, and
more importantly, North-Eastern Region, is one of the pockets that do not seem to have profited in
the changed economic environment. In the strong state controlled economic regime of pre-liberalised
India, the region has not fared very well. Although the Indian Economy has been benefited from the
time new economic reforms were initiated since 1991, North-Eastern Region still remains to be far
from the purview of India‘s rapid development. With its geographical remoteness, inherent
deficiency in infrastructure and the bad publicity for recurrent ethnic strife and militant activities, the
region obviously could not become an attractive destination for private and foreign capital
investment. But in this period of globalization, where closer cross-border economic ties are being
speeding up in many parts of the world, border trade has come to be looked upon with a lot of
expectation in this region to break free from the shackles of geographic remoteness.
The trend in international relations has shifted the focus from high military activities to low
politics of economic and humanitarian activities in the post cold war era. Today, in the pace of
globalization every bilateral and multilateral interaction arrests more space in co-operating in trade
and commerce, economy and humanitarian areas. This change is overruling the preoccupation of
high politics leading the world into a stage of increased interests in mutual interdependence. No state
can stay in isolation in this stage of emerging inter-state regional cooperation (Akshay Jyoti Sarma,
2011). The NAFTA in North-America, European Union in Europe, ASEAN in Asia, African union
in Africa and SAARC in South Asia, etc. are some transnational regionalism with varying degree of
cooperation and integration formed beyond the border of a nation state to realize the pace of
globalization and multi-lateral co-operation. In all these cases, economic prospects and trade
considerations along with historical and socio-political affinity are vital in defining the regional
identity but the level of success in the process of cooperation and integration is depended upon
domestic circumstances of the participating states (Baruah, 2005).
The India-ASEAN relations could be seen as a geo-political reality of economic activities.
India‘s relations with South East Asia have grown over the years and especially in the recent two
decade. The end of cold war augured well for India to start a new chapter in the chequered history of
its relations with South-East Asia (Chetty, 2003). Relations with the countries of South-East Asia,
East Asia and the Pacific constitute an important dimension of India‘s ―Look East Policy‖, initiated
in 1991 to qualitatively enhance the synergic and progressive linkages with the dynamic East and
South-East Asian region (MEA annual report 2010-2011). During the last two decades and
particularly after inception of India‘s Look East Policy (LEP), one could observe the dynamics of the
India-ASEAN relationship. The first and foremost of that was granting Sectoral Dialogue Partner
status to India in 1992 in Trade, Investment and tourism. Since then there were a number of
milestones of the India- ASEAN relations (ASEAN and India – Shared Vision, 2009). The
Framework Agreement for Comprehensive Economic Cooperation was signed in 2005 and this
instrument has a tremendous role in advancing the further economic cooperation with ASEAN.
Under this, free trade in goods, services, investments are facilitated.
The North East India (NEI), one of the areas with great potentialities remains backward for
lack of visionary initiatives of political leadership in the post- independent India. NEI is often
recognized for its rich cultural and ethnic diversities and that makes the region a showcase of rich
cultural diversities. The rich but untapped natural resources including its beautiful landscapes are
acclaimed attraction of the region. The peripheral and landlocked Northeast region is stereotypically
put outside the purview of mainland India‘s rapid development. The inception of LEP and
subsequent engagements with South-East Asia has brought the NEI into the forefront of the
country‘s policy circle (Agenda for Assam and the North-East – Issues and Trends, 2008).

3 | Journal of Management and Science | Vol.3.No.3 | September 2013 ISSN: 2249-1260|eISSN: 2250-1819
NEI, being the only point of surface connectivity with SEA enjoys a geo-strategic
significance in India‘s foreign policy. But from the perspective of development, NEI has been
nothing more than a transit route between mainland India and SEA nations. This region has not been
able to reap the benefits through increase in export base even after sharing 98% of International
border with 5 nations.
Assam is the largest state among the seven sisters in the NER of India. The per-capita
income of Assam was a little higher than the all-India level in the early 1950s. It has not grown as
fast as the per capita income in India since then and consequently slipped down to remain
substantially lower than the national average in recent decades. Further, the gap between the state‘s
average level of living and that of the national average has been increasing in recent years. The
social, economic, and political environments are considered to be the major decelerators in the slow
growth process of Assam. Given the natural and human resource potential of Assam, the need for
higher growth has recently been felt by various sections of the people as well as the State and Central
Governments (Report- Planning Commission, Strategy for Assam’s Development, 2002).
2. REVIEW OF LITERATURE
From this part onwards, we will revisit the prospects and challenges present within the
purview of NEI, growing ties between India and South-East Asia, extent of trade from the region of
NEI and specifically Assam and the scope of achievements in this regard in the field of International
Trade and Investments (domestic and foreign).
Some of the areas that have been covered under this section for review are:
2.1 Economic Co-operation between India and ASEAN (Association of South-East Asian
Nations) and the role of North-Eastern States of India: Current Status, Future Prospects
and Transport Connectivity
Assam is clearly the gateway to the North East, neighboring Myanmar, China, Bangladesh,
Nepal & Bhutan making it positively viable for trade with ASEAN countries.
One of the most viable development strategies for a country‘s economic success is to find
its own niche in the global marketplace, which means to be able to tap the demands of the world
economy. Many developing countries have been trying to overcome a dismal economic situation by
promoting international trade. In these efforts, exports have been viewed as an ‗engine‘ of economic
growth. With conspicuous imbalance in the distribution of wealth between varied nations, Fumitaka
Furuoka (2009) , in his paper, tried to answer an important question as to how can poor nations
break free from the ‗vicious circle‘ of poverty and boost the much needed economic growth and
development. This study empirically analyses the relationship between exports and economic growth
in five selected ASEAN countries, namely Malaysia, Indonesia, Thailand, the Philippines and
Singapore. The one-way fixed effects model lead to the conclusion that there exists a significant
positive relationship between the size of the national income and the volume of exports. This implies
that with an increase in export earnings, the size of GDP in these five ASEAN countries have also
been expanding. Findings of the research encouraged a closer look at other factors that may influence
the pace of economic growth in ASEAN countries.
Following the initialization of the economic reforms in India in 1991, with regards to
liberalization booming up at that point of time, there has been a rapid involvement of Indian
companies abroad. The scope and density of economic relations between India and ASEAN
countries had been rapidly rising since then in merchandize trade, trade in services, investments,
tourism etc. A number of studies have been taken up over the years to analyze the current status of
4 | Journal of Management and Science | Vol.3.No.3 | September 2013 ISSN: 2249-1260|eISSN: 2250-1819
trade relations between these nations. A broad study taken up on assessing the current status and
future prospects between these nations was taken up by Rahul Sen, Mukul G. Asher and
Ramkishen S. Rajan, (2006). This paper had analysed recent trends in merchandize trade, services,
investments and manpower flows between India and ASEAN and tried to have an access for future
prospects for economic cooperation. The analysis in the paper was consistent with the view that
India‘s economic structure is largely complementary to ASEAN economies, and therefore there are
significant opportunities for mutual gain. The first section of the paper reviewed the existing
economic relations between India and ASEAN in merchandize trade, trade in services, investments,
tourism and manpower flows. In terms of merchandize trade relations, it was observed that exports to
ASEAN had more than tripled from US$ 1.0 billion in 1991-92 to US$ 3.4 billion in 2001-02.
Singapore was witnessed to be one of the largest markets in ASEAN for India‘s merchandize
exports, followed by Malaysia, Thailand, Indonesia, and the Philippines. But alarmingly, it was
found that India‘s imports from ASEAN had outpaced those of its exports, resulting in trade deficit
and balance of trade going in favour of ASEAN. A study undertaken in this area indicated that
pharmaceuticals, metal scraps, leather goods, textiles, machinery and electronic components and gem
and jewellery are among the product areas with clear potential for future merchandize trade
expansion between ASEAN and India. Although trade in services is still considered to be rather
negligible, this paper tried to analyse some of the areas where trade in services was rather promising
between India and ASEAN countries like in the field of ICT (Information and Communication
technology), Tourism, outsourcing, etc.
In continuation with the above study, complementarities and areas for mutual economic
partnership in trade and investment relations was also considered. The study in this area indicated
that Indonesia was considered to be India‘s second largest export market in ASEAN. In terms of
trade exchanges, both countries appeared to have complemented each other although bilateral trade
tended to be in Indonesia‘s favour. Similarly it was found that bilateral trade between India and
Malaysia was heavily in favour of Malaysia. The pattern of trade flow between the two countries
suggested lot of rooms for further trade expansion (Fatimah Mohd. Arshad, 2006). The above study
suggested that ASEAN and Indian economies complement each other more than they compete.
India‘s asset for ASEAN countries includes its large diversifies and liberalized economy, reservoir of
manpower and scientific talent, natural resources, industrial base and one of the largest rapidly
growing markets. An FTA between ASEAN and India has been found to be a bridge for trade and
investment.
Another study in the related field utilises the international parity conditions to analyse the
current level of economic integration between India and the ASEAN-5. The analysis indicates that
India and the ASEAN-5 have linkages with respect to goods and services markets, but not in
financial market. Therefore, the beneficial impact on financial market will be greater than on the
goods and services markets when future liberalization measures like FTA between India and ASEAN
are implemented. The results of the analysis also suggest that India and ASEAN-5 are relatively
linked by the flow of goods and services. This suggests that the two regions could further deepen
their partnerships in FTA, both in goods and services markets and financial market with their main
aims of FTA to exploit the complementarities and synergies in factor endowments, economic
structure and skills and capabilities in diverse areas, including trade and investment, infrastructure
development, science and technology and tourism for an optimal mutual benefit. Only then India
could move forward on its way to becoming a trillion dollar economy (Lee, Lee and Liew, 2007).
With greater focus on the post- Cold War era, this article (Naidu, 2010) broadly examines
various dimensions of India- South-east Asia relations. Besides providing a brief backdrop, it
elucidates the genesis of the ‗Look East Policy‘ and locates in the new, post-cold war foreign
framework while touching upon the contours of this policy as it evolved over the years. Naidu, in his
5 | Journal of Management and Science | Vol.3.No.3 | September 2013 ISSN: 2249-1260|eISSN: 2250-1819
article tried to bring to our notice that poor economic bonds continue to be India‘s weakest link with
a region whose defining feature is economic dynamism. He supported his article by showing the
growth of India-ASEAN bilateral trade in the past decade or so. Although India proposed the India-
ASEAN Framework Agreement on Comprehensive Economic Cooperation (IAFACEC) in 2003, it
took nearly six years of arduous talks to conclude the trade in goods agreement. However, it is
expected that India will reap major benefits from agreements on services and investments. The Trade
in Goods part have become operational since January 2010, and the services and investments
segments are being negotiated. The immediate upside of IAFACEC is likely increase in trade from
US$44 billion in 2010 to US$55 billion in 2011. Yet, there is no denying the fact at present that
whereas ASEAN‘s share in India‘s total trade is 9.54% in 2010, that of India‘s in ASEAN is about
2.5%. Similarly, the two-way foreign direct investment barely reached $3 billion as compared to $10
billion between China and ASEAN. Kondapalli (2010) too traces India‘s growing profile with this
region in economic, technological, diplomatic, political and military spheres. Another aspect that is
overwhelming is India and a majority of the East Asian countries are into trade and investment. The
current phase of globalization has witnessed an expansion in trade between these countries. But on
the whole, India‘s trade comprises of raw materials exports to the East Asian region and more often
ends up in an unfavourable balance of payments problem.
The process of economic integration has many dimensions to it. As different sub-regions of
the continent pursue a distinct course of economic integration within, they simultaneously enter into
economic arrangements across sub-regions. Batra (2010) undertook an evaluation of the Bay of
Bengal Initiative for Multi-Sectoral Technical and Economic Co-operation (BIMSTEC), an inter-
sub-regional organization, for its ability to act as a bridge between South and South-East Asia. The
analysis in this article shows that the BIMSTEC has performed well below expectations. As a
regional trade arrangement, the BIMSTEC was designed with the aim of achieving a relatively
deeper level of economic integration among the member economies. The study also showed that the
performance of the BIMSTEC has not been effective to take the regional economic integration
among the member countries to a higher level. Access to a larger market through the trade bloc has
not done much good to increasing trade or investment flows for the smaller member economies.
Rupa Chandra (2007) presents the Indian case of liberalization of trade in services, an area
which still remains to be unexplored. She shows that the services sector has played an important role
in India‘s recent growth process and its integration with world markets. The growth in the services
sector has been accompanied by a rapid growth in India‘s trade and investment flows in services.
Consequently, India has managed to increase its exports in the services sector to 2.3% by 2005. It is
also observed that the composition of exportable services has shifted from traditional services to
miscellaneous services. It has been perceived from the study that India could achieve a win-win
situation from regional and bilateral frameworks covering services, as it can attain progress on
difficult issues such as movement of natural persons, recognition, and labour market tests, while also
facilitating investment flows into India in important services to further its own growth and efficiency
objectives. In this regard, the trade and investment potential in services still remains largely untapped
within the South Asian region.
But all these studies indicated that connectivity between these nations had been a major
setback for robust growth in trade and investment between these countries. The major trading route
between India and the ASEAN countries is the North-Eastern part of India. A report on Transport
Connectivity and economic Opportunities- South and South East Asia (2006) suggested that the
transport integration among countries around NE India is totally out of step with the global trend
towards regionalism. The countries concerned have to make a decisive departure from the present
situation in order to be fully integrated into the on-going globalization process. It further suggested

6 | Journal of Management and Science | Vol.3.No.3 | September 2013 ISSN: 2249-1260|eISSN: 2250-1819
the countries under consideration to address the issue as it stands the risk of foregoing many of the
economic opportunities that the process of globalization can provide. Arnold (2006) said that a basic
strategy for expanding trade is through diversification in the range of products offered in the markets
served. The former is generally accomplished through value addition and evolution of the existing
exports rather than creating new products with new markets. He supplemented his words by saying
value addition includes:
Moving up the supply chain by improving quality of existing products through better
management and productiontechnology or by providing additional processing.
Producing related products requiring similar inputs or production technology.
Diversification on the other hand includes entering new countries and expanding the
coverage in countries already served. He concluded his study by summarizing that trade
competitiveness is associated with trade facilitation and reducing the time and cost for processing of
imports and export shipments and The NER has so far not enhanced its comparative and competitive
advantages through improvements in logistics and supply chains.
2.2 Importance of gaining Comparative Advantage for countries in International Trade: Some
evidences through the use of Revealed Comparative Advantage
The importance of Comparative advantage dates back from the time of Adam Smith and
David Ricardo, who said that a country can benefit from International Trade if if it specialized in a
certain commodity and then exported it to the foreign countries that lacked that commodity, which
they termed it as comparative advantage.
With more and more countries moving from protectionism to liberalization of trade
barriers, has greatly paved the way for fostering productivity gains, thereby helping nations across
the globe to restructure its economy towards gaining its comparative advantage. In this quest, India
has taken up a number of policy initiatives to improve its trade potential to revive its economy and
superimpose more exposure for its goods in the foreign market. Notable among these was the effort
of Liberalization Policy that it undertook way back since 1991. It is therefore obvious that trade
liberalization in India would have led to changes in the composition of exports so as to reflect India‘s
comparative advantage in the global economy. A country‘s comparative advantage is influenced by a
wide range of factors like its factor endowments, production, GDP, consumption and increased trade
integration with countries.
Much empirical research on trade has been devoted to testing theories of comparative
advantage. A majority of these studies use data on export shares. Balassa (1965) has undertaken an
analysis of the pattern of comparative advantage of industrial countries for the period 1953 to 1971.
He uses the RCA index in conjunction with the changes in the pattern of export structures to identify
inefficiencies in trade pattern for countries. A study was made by Nowak, Vollmer and Martinez
(1998) to prove whether comparative advantage makes countries competitive or not. The results
reflected that low-cost countries do gain a comparative advantage at least in some export sectors like
textiles, furniture, beverages. Moenius (2006) derived and compared several measures of
comparative advantage using a Ricardian model of trade. The results were used to construct a
measure of relative export performance based on Balassa‘s index of RCA which was further
decomposed into their respective comparative advantage and relative trade cost components. The
indices obtained from the decomposition of the Balassa Index demonstrated that both comparative
advantage and costs of trade are affected by remoteness.

7 | Journal of Management and Science | Vol.3.No.3 | September 2013 ISSN: 2249-1260|eISSN: 2250-1819
Another study made by Utkulu and Seymen (2004) analyzed the competitiveness and the
pattern of trade flows/trade specialization from Turkey to the EU on sectoral levels. The research
was mainly based on different measures of Revealed Comparative Advantage (RCA) measures (in
addition to simple Balassa Index). Accordingly, alternative RCA indices were calculated. The
stability of different measures of RCA was also tested.
Aulakh, Masaki, Hildy (2011) developed a framework for export strategies of firms from
emerging economies and their performance in foreign markets. Hypotheses derived from this
framework were tested on a sample of firms from Brazil, Chile, and Mexico. Findings suggested that
cost-based strategies enhanced export performance in developed country markets and differentiation
strategies enhance performance in other developing countries. Adapting marketing mix variables to
the specific needs of developed countries also enhances export performance.
Smit (2010), in his article tried to clarify the meaning of international competitiveness at
the country level within in the context of Porter’s (1990) thesis that countries, like companies,
compete in international markets for their fair share of the world markets. At a country level, there
are two schools of thought on country competitiveness: the economic school, which rejects Porter‘s
notion of country competitiveness, and the management school, which supports the notion of
competitiveness at a country level. This article reviewed and contrasted the theories pertaining to
these two schools of thought with specific reference to trade theories and the ‗theory‘ of the
competitive advantage of nations originally advanced by Porter. Braunerhjelm and Thulin (1999)
analyzed how increased R&D expenditures and market size influence the distribution of comparative
advantage. The study shows how an increase in R&D-expenditures by one percentage point implies a
three-percentage point increase in high-technology exports, whereas market size fails to attain
significance.
Yeats (1997) studies the possible distortions in trade patterns on account of discriminatory
trade barriers that are characteristic of the RTAs. He uses the index of revealed comparative
advantage in conjunction with the changes in the regional orientation of exports to identify any
apparent in-efficiencies in trade patterns for the Mercusor group of countries. Richardson and
Zhang (1999) have used the Balassa index of RCA for the U.S to analyze the patterns of variation
across time, sectors and regions. They find the patterns to differ across different parts of the world,
over time as also for different levels of aggregation of the export data. Differentials are accounted for
by factors like geographical proximity of trading partners and per capita income with the extent of
influence of these factors varying over time and across sectors/sub sectors. Yue (2001) uses the RCA
index to demonstrate the fact that China has changed its export pattern to coincide with its
comparative advantage and that there are distinct differences in export patterns between the coastal
regions and the interiors in China. Bender and Li (2002) examine the structural performance and
shift of exports and revealed comparative advantage of the East Asian and Latin American regions
over the period 1981-1997. It examines, if there is a relation between changes in export pattern
among different regions and shifts in comparative advantage between regions.
2.3 Status and Trend of Exports (Merchandize and Services), Infrastructure and Investments
(Domestic and Foreign) in NEI specifically Assam: The story so far
In recent years, India has also realised that the South East Asian countries can also play a
pivotal role in developing her North Eastern Region, which has fallen far behind the rest of the
country in terms of economic growth and overall development, since independence. In this context
India has been quite active in her attempts to engage the NER (North Eastern Region) and the South
East Asian countries (Das, 2010).
8 | Journal of Management and Science | Vol.3.No.3 | September 2013 ISSN: 2249-1260|eISSN: 2250-1819
Sarma (2011), in his study, tried to bring to our notice the various areas of strengths of NE
region. Despite all the strengths of the region, it has been seen that it is lagging behind the rest of the
country and even decelerating. In 1999-2000, only Mizoram among the NE states had real per capita
income a little above the all-India average per capita income (1.3%). He suggested a new paradigm
of development perspective. One relates to overemphasis on security/ strategic considerations rather
than a development perspective in development efforts. The other relates to minimum intervention in
the traditional systems. For putting this development perspective into operation, he suggests that
immediate priority should be to build the required infrastructure right up to the border area,
establishing connectivity and communication links to the cross- border points through which trade
and economic exchanges with the countries neighbouring the North-east region are proposed to be
promoted under the Look East Policy. The internal economic integration of the NER will serve as
enabling conditions for augmenting the gains from trade and economic exchanges with the countries
neighbouring the NER that are proposed to be promoted under the Look East policy. It is because a
unified market provides a large market access and thus facilitates the gains of scale economies. That
will in turn enable each of the states to specialise in economic activities according to their respective
comparative advantage. Concrete steps for internal market integration of the region as a follow-up
would serve as a first step toward a resurgent North-East India.
A report released by IIFT (Ministry of Commerce/Govt. of India, 2008) on Agricultural
and Industrial Development of the NER showcases the various agricultural and industrial potential of
NE states. Notable among these is the findings it made on Assam. Among all other states, Assam is
most strategically situated close to India‘s international borders with as many as four countries, i.e.,
China, Myanmar, Bhutan and Bangladesh. Assam has been a pre-dominantly an agricultural state
with about 74% of the state‘s workforce engaged in agricultural and allied activities. Tea industry
occupies an important place in the State‘s economy. Other agricultural and horticultural products
produced in this area are rice, jute, cotton, oil seeds, sugarcane, potato, orange, banana, pineapple,
coconut, mango, and jack-fruit. The state has rich potential of agricultural resources and offers
enormous scope for development apart from the traditional items. The potential is particularly
sizeable in horticulture, live stock farming, pisiculture, and floriculture. The study confirmed that the
industrial scenario of the state is expected to get further fillip in the future with the completion of
some major ongoing projects in various parts of the state. It also found that there are 25,000 small
scale and tiny sector registered units in the state. But 45% of these units have been found to be either
closed or untraceable in the recent past. The state also has vast reserves of crude oil. After tea and
petroleum industry, plywood industry is also slowing gaining momentum. Production of other
minerals items like coal, industrial gas and limestone is also increasing. The state has tremendous
potential for exporting various products manufactured locally to the East and South East Asian
countries due to its strategic location. Some of the factors that have been found which is inhibiting
the industrial development in the state are:
Poor purchasing power of the people compressing the size of domestic demand.
Lack of infrastructural support like land, power, transport, communication etc.
Lack of local entrepreneurship and skilled labour.
Low saving rate and the banking system reluctant to provide the much needed capital to the
first generation entrepreneurs.
Inadequate support from the Govt.
Lack of proper investment climate.
The report further envisaged some indicative areas for development of Industries, Exports
and Opportunities for Investment. Those identified areas are: natural gas based projects, granite
based projects, fruits and vegetable processing, banana puree processing, mushroom cultivation,
papaya processing, spice oils, aquaculture projects, silk based projects, electronics and software,

9 | Journal of Management and Science | Vol.3.No.3 | September 2013 ISSN: 2249-1260|eISSN: 2250-1819
tourism, petroleum based products, ceramic based projects, meat and poultry processing, medicinal
plants and herbs based units, diversified jute products, agro-machinery and tea packaging.
Bruner and Cali(2006) in their study, emphasized on giving importance to trade promotion
and trade facilitation to break the shackles of economic backwardness of a region. In this regard, they
said that ―these efforts are particularly crucial to enable the least developed economies or regions,
such as Nepal and NER, to garner gains of trade from closer integration into the world trading
system‖. The key findings of the study suggested that:
India is rapidly putting in place a supportive trade policy regime with the intent of doubling
the country‘s share of world exports to around 2% of the total and beyond.
India‘s leadership, including the Prime Minister, envisage the NER as a key platform to
leverage economic relations with Nepal, Bhutan, Bangladesh, china and Southeast Asia; a
component of the framework is the Look East policy.
Despite recent rapid growth of over 20% or more per year, India‘s export mix has not
changed very much and is still reliant on few natural resources and labour intensive products;
an implication that NER is well=positioned to join other comparatively isolated regions of the
country in the second wave of globalization.
State and product-level data show that there is no dynamism in the industrial structures of the
NER than is commonly believed.
The NER‘s landlocked economy and fragmented terrain create substantial barriers to
domestic and international commerce. In addition, modern, financial, commercial and
corporate institutions are poorly developed, adding further to transactions costs.
The region‘s location between three giant economies China, South-East Asia and mainland
India means that NES can be characterised as ‗entrepot‘ economy.
The study further attempted to locate the hubs of formal activities in the Eight Sister states.
This offers the starting point for the mapping of trade linkages from the hubs of productive
activity to the markets in which their latent comparative advantage can be realised.
An attempt had also been made to analyse the export potential of small-scale industries.
He further found that in value terms, nearly three-fourths of the total exports are from
unregistered enterprises, which underlines their significant export potential. The states of
Assam and Nagaland together account for about 96% of the total exports from the NER and
98% of the exports made by the SSIs.
Finally he infers that the growth of SSI would have high importance in designing a strategy to
connect the region with the global market. Export gains and rising market shares can only be
built on a solid foundation of efficiency, productivity and competitiveness.
Another research (Adikary, Bora and Sikidar, pg-156-200, 2009) was undertaken to find
out the potentialities of trade in NEI. As has been quoted in their study, ―NEI is a very significant
part of the country as far as trading is concerned. Owing to its richness in tea, coal, limestone and
other mineral, agricultural and allied products and forest resources, the region has natural trading
advantages. There is a wide scope of generating economic activities through the interaction of
exports with its trading partners. In the recent past, there is a renewed focus on trade in view of the
need to forge closer commercial and economic links with larger markets in the fast developing South
East Asian economies‖. The study found that the share of NEI in India‘s total export in the category
of mineral products is the highest followed by agricultural and allied activities. However, the share
of mineral products decreased gradually. The importance of export trade for the economic
development of NEI has made imperative to ascertain the comparative advantage of NEI‘s export
trade. The study used measures like RCA (Revealed Comparative Advantage) and RSCA (Revealed
Symmetric Comparative Advantage) to help assess the region‘s export potential. The results
10 | Journal of Management and Science | Vol.3.No.3 | September 2013 ISSN: 2249-1260|eISSN: 2250-1819
indicated that NEI has been quite competitive in exporting materials as RCA values hovered around
8.9% to 16.7% from 1991-92 to 2004-05 and RSCAs were close to 1. Similarly, in case of
agricultural and allied products, NEI showed comparative advantage in exporting as revealed by
more than unity values for RCAs and positive values for RSCAs. However, in case of other products,
it indicated a comparative disadvantage to NEI in exporting these items as revealed by less than unity
values for RCAs and negative values for RSCAs, indicating inefficiency in exporting other items.
Hence, the study made an attempt to study the present status of export trade from NEI and
attempted to find the impediments to export trade from NEI.
The exports from NEI in terms of value during the period 1991-92 to 2005-06 were
presented. The figures made it clear that exports have increased since liberalisation in India.
But NEI has exhibited a fluctuating trend in the past 15 years. In value terms, exports have
increased from Rs. 85 crores in 1991-92 to Rs. 437 crores in 2005-06.
In order to identify the major trading partners in NEI‘s export trade, the country-wise shares
in NEI‘s exports reveal that NEI has major trade relationship with neighbouring countries
like Bangladesh and Myanmar.
Positive growth of export was witnessed in case of exports to Bangladesh but at the same
time it was affected by the variations witnessed in export trade to Myanmar and also exports
of tea to various other trading nations. The year 2003-04 was witnessed to have a favourable
growth of exports which can be attributed because of factors like increase in demand of
NEI‘s products in Bangladesh. But again in the subsequent years, downfall of growth could
have been observed.
The researchers in the study further carried out a survey to find the impediments to export
trade. They observations from the survey revealed that the lack of infrastructural facilities
remains to be the major problem for export promotion from NEI.
They further assessed that a few number of items are offered for export in relation to the total
export basket of NEI. The majority of items offered for export are not even exported from
any source of origin in NEI, although the items have been included in the export list.
They could also find that unofficial and illegal trade exists between NEI and its neighbouring
allies. It was also learnt that the volume of illegal trade has been higher than the volume of
official exports.
Finally they concluded by emphasising on the fact that NEI is surrounded by as many as
five countries with almost a 5000 km stretch of international border, amply speaks of how important
could be the role of trade with neighbouring nations in fuelling the engine of growth and adding
vitality of socio-economic transformation of its 39 million people residing. Thus the strategy in this
regard is to identify new market for trade and improve upon infrastructural constraints.
If one examines the extent of trade from NER, it would be quite visible that NER‘s export
is mainly concentrated into the regions of Myanmar and Bangladesh. As it is evident from the
following studies made by Bezbaruah (2006) where he tried to assess the extent to which the
expectations regarding the prospects of Indo-Myanmar border trade through the NER are realizable
and discussed the issues that need to be addressed for realizing these potentials. The main findings of
the above analysis could be summarized in the following points:
Although the volume of formal trade across Indo-Myanmar border is negligible as percentage
of total trade between the two countries or as a proportion of the domestic income of the
NER, the volume of informal border trade is significant.
The existing composition of informal border trade, mainly serves only the consumption
demands in the NER and Myanmar. The productions and income generating effects in the
two regions are minimal.

11 | Journal of Management and Science | Vol.3.No.3 | September 2013 ISSN: 2249-1260|eISSN: 2250-1819
Changes in domestic policy regime and multilateral trading agreements are now abating the
trade policy related hindrances in bringing the hitherto informal trade to the formal channels.
If the initiatives to forge regional trading arrangements with East and Southeast Asian
countries through Myanmar bear fruit, that will integrate India and South Asia economically
with the newly industrialized eastern bloc. But the share of benefit for the NER from such
integration will depend on how much of the trade traffic move through the land routes via
north-east.
Further, it is seen that India- Bangladesh trade pattern does not follow strictly the principle
of comparative advantage. The reason is that some of the goods produced are in common in both the
countries due to similar factor endowments and factor intensities (Raychaudhuri, 2005). The study
didn‘t go into the informal trade aspects. The study also did not mention the service trade at all as
one paper by Rahman (2000) clearly puts the informal trade in education and health services at a
very high proportion. In conclusion, he further added that India Bangladesh trade promotes some
activities which may be consistent with relative comparative advantage but not global. However,
some of these may give impetus to the growth of some industries where a country may enjoy
potential comparative advantage which might develop in future with suitable technological up-
gradation and government support.
Both the theory and evidence suggests that trade not only strengthens the relations between
the trading partners but also acts as an engine of growth. The same is true for investments. Both the
host and parent countries gain from the investment in each other‘s country. This paper (Ghuman and
Madaan, 2011) too has attempted to discuss and analyse the trade and investment relations between
two neighbouring countries. The foregoing discussion on the paper explains the very low share of
trade between India and Bangladesh. This paper has tried to discuss the present status of trade and
investment relations between India and Bangladesh since 1975. Though their mutual trade has been
increasing since 1975, yet, it could not exploit the latent trade potentialities. The limited export
capacity of Bangladesh to India seems to be one of the reasons. Given the size of the Indian
economy, it is suggested that India needs to explore the inclusion of new items in its import list from
Bangladesh. The Indian investment in Bangladesh and joint ventures in Bangladesh and India could
be of great help to enhance their mutual trade. Resolution of some long-pending issues between the
two countries and continuous dialogue can certainly help enhancing trade and investment.
The report (Report - Indian Institute of Foreign Trade; Ministry of Commerce, 2008) on
exports estimation mentioned an important limitation in the form that ‗estimating exports that take
place from the NER is fraught with several limitations due to lack of proper information and data in
almost all the seven concerned states‘. Exports from the NER can be broadly divided into three
categories:
Products of NER but exported primarily from the outside region like tea, jute, silk
handlooms, cane and bamboo crafts. Tea constitutes the bulk of exports.
Items exported through the customs check posts located at the borders within the region.
Many of the items are produced locally like ginger, dry chilly, fruits and vegetables etc.
Products that fall in the third category are those which are produced from outside the region
and exported to the neighbouring countries like Myanmar, Bangladesh, and Bhutan etc. In
this category are included essential commodities and many engineering goods and
pharmaceuticals. However, since there is hardly any value addition in this category and the
NER only acts as a transit route, such exports cannot legitimately claim to be North-Eastern
origin.

12 | Journal of Management and Science | Vol.3.No.3 | September 2013 ISSN: 2249-1260|eISSN: 2250-1819
The study found figured out some key constraints that led to low exports from the region.
These constraints were- limited export houses and exporters from NER (North-East Region), too
much of informal/illegal trade, insurgency, land acquisition act, lack of infrastructural facilities, high
incidence of duty and taxes, narrow range of products in authorized trade, closure of ‗border haats‘
for trade, inner-line permit adopted by Mizoram, Nagaland, Arunachal Pradesh. The report showed
the total exports that took place from the NER during 1995/96 and 1996/97 in various categories of
goods ranging from agro-based products to textiles, tea, minerals, handicrafts, forest-based products
etc. Finally against the backdrop of current production and future scenario, the strengths and
weaknesses of the economy and trade had been examined through the construction of a BCG Matrix.
The matrix reflected the composition of the items produced vis-a-vis its exports from the region as a
whole. Further, the study estimated exports from the NER at Rs. 2176 crores by 2005.
A report compiled by Planning Commission (Strategy for Assam’s Development, 2002),
came with the following findings on Assam‘s slow economic development. These findings are:
The most striking fact of Assam‘s economic development is that it is falling behind the rest of
the country. In 1950-51, per capita income in Assam was 4% above national average. In
1998-99, it was 41% below the national average at 1980-81 prices. What is even more
alarming is that the gap is growing. Between 1980 and 1990, per-capita income at 1980-81
prices grew by 20% in Assam compared with 40% for all India.
While the Indian Economy grew at 6% over 1981-2000, Assam state GDP grew only at 3.3%.
While the growth rate of the Indian Economy accelerated in the 1990s over 1980s, Assam‘s
economy decelerated in the 1990s. The poor growth performance could be seen in all the
sectors.
Industrial growth in Assam has been very poor growing at only 2.6%. Industries grow when
the demand for their products grow. If the local market does not provide enough demand,
then external markets are needed. Industries in Assam and other NE states have not had
adequate markets. Outside the region, they have not been able to compete because of the high
transport cost. Within the region, they have lacked good infrastructure.
The partition of the country imposed on Assam and the NE a huge transport and access
disadvantage. As the Shukla Committee puts it, ―Partition further isolated an already isolated
geo-politically sequestered region. It was left with over 4500 km of external frontier with
Bhutan, China, Myanmar and Bangladesh but no more than a slender 22 km connection with
Indian hinterland through the tenous Siliguri corridor, the gateway to the North-East. The
very considerable market disruption, socio-economic distancing and retardation that resulted
has not been adequately appreciated and compensated‖. This transport disadvantage
discourages industry from locating in Assam. Only those industries that are based on special
raw materials available in NE are likely to locate here.
One major reason for low-income growth aret in Assam is low rate of investment. The Gross
Fixed Capital Formation (GFCF) rate was only 12.3% for Assam in 1980-81 when the all-
India rate was high at 21.4%. Unless this difference is narrowed down, Assam‘s income
growth cannot catch up with rest of India. Assam would not be able to attract large-scale
private investment till insurgency problem is solved.
The disruption of partition not only increased transport costs but it also dislocated the
traditional markets of the North-East. It also increased transactions cost and reduced access to
finance. The road distance to rest of India increased, connectivity through waterways became
poor, and loss of access to the ports of Chittagong meant international markets also became
less accessible. Coupled with these, poor power sector development and difficulties of getting
financial credit have also been contributed to poor development of industries in Assam.
The transport disadvantage and loss of markets has shifted the growth of industries in Assam.
State Govt. policies have not been able to overcome these handicaps.

13 | Journal of Management and Science | Vol.3.No.3 | September 2013 ISSN: 2249-1260|eISSN: 2250-1819
Faulty strategy was also reflected in wrong type of capital investment, inadequate and low
quality infrastructure such as power, roads, and other infrastructures. On the other hand, the
state govt failed to create a favourable environment for private investment to supplement its
efforts.
The state is not only deficient in administrative, social and economic infrastructure, but also
human capital, all supply side factors. This coupled with poor and uncertain law and order
situation does not make Assam a favoured destination for private investment even with tax
holidays or freight subsidy as has been extended.
The Economic Survey Report on Assam (2011-12), summarized the following points on
the current economic scenario on Assam and the number of initiatives taken up the Government of
Assam:
The economy of Assam continues to be predominantly agrarian. The Agriculture sector in the
State providing employment to more than 50 percent of the rural people. The net cultivated
area of the State is 28.11 lakh hectare (2009-10) which is about 88 percent of the total land
available for agricultural cultivation in the State. The contribution of Agriculture sector to the
State Domestic Product was nearly 25 percent during 2010-11.
The Industrial scenario of the State is mainly confined within the growth of employment
oriented Small Scale Sector, which comprises of manufacturing and processing industries.
The contribution of manufacturing sector to Gross State Domestic Product is estimated at 7.0
percent during 2010-11 which is not encouraging.
The growth observed in the manufacturing sector was the result of benefit achieved in the
production of some selected industrial items like Tea, Wheat Flour, Jute textiles, Cement, etc.
over the level of production of the previous year.
The Tea Industry of Assam, playing a vital role in the State as well as in the national
economy. The Assam‘s Tea industry also possesses a significant reputation in the global
economy.
Among the Plantation crops, Rubber cultivation is also gaining its popularity in the State due
to congenial agro climate as well as its eco-friendly activity.
Assam has ample scope for Bamboo based industry like Paper manufacturing industry, since
this region has highest concentration of bamboo i.e., around 60% of the total Bamboo of the
country.
Traditionally, Sericulture, a major cottage industry of the State, is practiced in more than
10532 villages and provided employment to more than 2.5 lakh of family. Assam has the
monopoly in production of Muga, the Golden Silk in the world and 99% of Muga Silk
produced in Assam. Assam has also achieved the right of ―Geographical Indication‖ in Muga
Silk.
Assam is richly endowed with mineral resources. The performance of Mining Sector during
the year 2010-11 was observed as not satisfactory as compared to previous year. Apart from
Natural Gas (utilized) the all other major minerals Coal, Petroleum(Crude) and Limestone of
the State have shown downward volume in production during the year
It has been observed that the contribution of Agricultural Sector to the State economy [GSDP
at constant (2004-05) prices] has been recording gradual fall during the period 2005-06 to
2009-10 but shown slight recovery in 2010-11(Quick estimate). On the other hand, the trend
of growth of the agriculture sector [GSDP (at constant 2004-05 prices)] was erratic during the
same period and finally pegged at 7.5 percent 2010-11 (Quick estimate).
Assam is traditionally rich in horticultural production due to its diverse and unique agro-
climatic condition which is conducive for growing wide range of horticultural crops like

14 | Journal of Management and Science | Vol.3.No.3 | September 2013 ISSN: 2249-1260|eISSN: 2250-1819
various fruits, vegetables, flowers, spices, nuts, tuber crops and medicinal and aromatic
plants. World citrus belt encompasses Assam within it.
The state produces surplus quantity of fruits & vegetables to the tune of 26 lakh MT. Due to
lack of adequate marketing & processing facility about 20% of the produce is lost. In such a
scenario, processed food is a great boon for value addition & better commercial gain. 6 nos.
of processing units of Pineapple, Orange are set up with support from MFPI. 1 more units are
in the pipeline. Still there is huge scope for processing industries in the State.
Export Initiatives
Pineapple: Pineapple cubes are being exported to meet the export demand of 300 MT.
Orange: Assam has started export of Orange recently.
Flower: Dendrobium Orchids are an attraction in Kolkata Market. Anthurium from
Kamrup district has become a part of export from North-East.
Bhot Jalakia: Commercial cultivation of Bhot Jalakia, the hottest chilli (a special germ
plasm of Assam) has been started recently.
Assam is a surplus State in respect of production of Vegetables. The farmers faced a lot of
problem for marketing of these perishable commodities. Besides there are some other related
problems highlighted below:
During peak season of harvest from January to March, the markets are overloaded with
the Rabi Vegetables and farmers failed to catch remunerative price and compelled to
dispose their produce at a very low price during the market day due to non availability of
cold storage facility near the market.
Inadequate availability of processing units/ cold storage / post harvesting infrastructure
like godowns/warehouses.
Inability of small and marginal farmers to carry their produce at distant markets where
they can fetch justified market prices.
Inadequate transfer of off-season Vegetable Technology.
In Assam, Handloom Weaving is a way of life. It is inexorably linked with Assamese Culture
and Heritage. Handloom Industry of Assam is known for its rich glorious tradition of making
handloom and handicraft products. It also plays a very important role in the socio-economic
development of the State. Assam is a proud owner of more than 13.00 lakh looms out of the
total 28.00 lakh looms in the country. In spite of being intensely connected with the culture of
the State, the Handloom Industry has not flourished in commercial sphere to the required
extent. At present about 2.80 lakh looms are being utilized for commercial weaving in the
true sense. About 5.70 lakh looms run semi-commercially and earning subsidiary income.
Rests are domestic looms and are run to meet the domestic requirements.
For facilitating the export-import business with various neighbouring Countries bordering
North-East India, Government of India has taken a new initiative to create all infrastructure
facilities for the exporter of the region. The Government of India has approved for setting up
of two numbers of border trade centre- one at Sutarkandi in Karimganj district and the other
at Mankachar in Dhuburi district to facilitate the border trade with the neighboring country of
Bangladesh. The main objective of the Border Trade Centre is to provide high standard
infrastructure, information and service facilities to the exporter and importer.
Tourism is a fastest growing industry in the world. Tourism in Assam is based on wildlife,
natural beauty, unique flora & fauna, holy shrines, lush green tea gardens, turbulent rivers,
vibrant and colourful cultural festivals. Assam has immense tourism potentials, which are to
be explored as commercial resources. Eco-tourism is one of the fastest growing tourism
segments and therefore the State Government of Assam has given tremendous thrust with
relevant to natural beauty and bounty. For the growth of tourism sector, special emphasis has

15 | Journal of Management and Science | Vol.3.No.3 | September 2013 ISSN: 2249-1260|eISSN: 2250-1819
been given on Tourism Circuit Development, Destination Development, Wayside Amenities
etc., through public and private partnership to tap the unexplored potential opportunities.
Assam Tourism Policy, 2008 has also been adopted by the State Government giving special
emphasis to encourage private investment in Tourism sector by providing financial and
logistic support. Efforts have been made to establish linkages with the neighbouring North-
eastern States and countries of Bhutan, Nepal, Bangladesh and Thailand for Assam as a
regional tourism hub. The State Government has also proposed to create an East India circuit
linking Assam, Bihar, Odisha, West Bengal and Sikkim.
The announcement of the North East Industrial Investment Promotion Policy (NEIIPP), 2007
by the Government of India is another important step towards industrialization of the State
where special emphasis has been given on the word ―INVESTMENT‖. Through this Policy,
the Government of India has approved a package of fiscal incentives and other concession for
the entire North Eastern Region (NER) and Assam will be the leading State to reap benefit
from it.
Further, special provisions like providing comprehensive insurance subsidy, incentives for
setting up of Bio-Technology Industry, Power Generating Plants (both from conventional and
non-conventional sources) up to 10MW, Transport Subsidy Scheme etc are incorporated into
the Policy to attract more and more investors to the region.
Assam intends to attract maximum Foreign Direct Investment (FDI) and will put sustained
efforts to achieve the objective. The State Government has constituted a separate cell – The
Industrial Investment Secretariat Cell (IISC) to facilitate investment and a High Level
Committee to accord fast track clearance for investment proposals.
To generate economic development by accelerating the process of industrialization and to
generate employment and increase income, the Government of Assam has declared
Industrial Policy 2008 with high expectations to attract more investment from other parts of
the Country as well as to provide more support to the local entrepreneurs. The policy also
aimed at revival of sick industries as well as gives more focus to Micro and Small Sector.
To generate economic development by accelerating the process of industrialization and to
generate employment and increase income, the Government of Assam has declared Industrial
Policy 2008 with high expectations to attract more investment from other parts of the Country
as well as to provide more support to the local entrepreneurs. The policy also aimed at revival
of sick industries as well as gives more focus to Micro and Small Sector.
The General Agreement in Trade in Services (GATS) under the World Trade Organization
(WTO) divides services into four independent modes of supply:
Mode 1 - cross border supply
Mode 2 - consumption abroad
Mode 3 - commercial presence
Mode 4 - movement of natural persons
Many studies confirm a strong association between trade in services and economic growth
of a country. Services are considered to be major inputs in the production of goods since some
services encourage trade efficiency through improvement in labour productivity. In India, services
trade has seen massive increases in the last one decade. In 2008/09 services exports were around US
$ 88 Billion, of which 50% was accounted by software exports. Software services exports grew at
CAGR of 32% from 2000-2008. Apart from software exports India exports mainly transport, travel,
business, financial and communication services (CII Report, 2011).
Services sector growth can also complement growth in manufacturing sector. There are
sectors where a lot of complementarity exists between services & manufacturing growth e.g.

16 | Journal of Management and Science | Vol.3.No.3 | September 2013 ISSN: 2249-1260|eISSN: 2250-1819
Telecom Services and Telecom equipment manufacturing, electronic hardware & software where a
hardware-software combination can accelerate growth of both hardware and software as suggested in
the Medium Term Export Strategy (MTES) of the Department of Commerce, healthcare services and
pharmaceutical sector, shipbuilding along with ship repair & maintenance services and shipping
where growth is sure with growth in volume of trade, R&D services and pharma & biotech sectors,
etc. Identifying and promoting the growth of these sectors with considerable backward – forward
linkages can help growth of both services and manufacturing and some manufacturing sub-sectors
can ride piggy back on the success of the complementary services to achieve quick growth. The
recent growth in export of professional services is an example of the potential of other services. The
world Investment Report 2004 has stated that world over there is a shift in FDI towards services.
This is more so with India‘s FDI inflow to services sector. Another important development in the
services sector is the ongoing negotiations at WTO on Services. A clear-cut strategy for services
highlighting the potential gains for India in terms of growth, employment and exports is needed to
give a possible new direction to the Indian strategy in WTO negotiations (Report by Directorate of
External Affairs, 2007).
The role of the service sector in the transformation of economies of the world has been
significant. It has an advantage over economic activities in most countries, not considering the level
of economic development. Approximately 60% global output and around 30% global employment is
made up of services. Even in many developing countries, services represent more than half of their
GDP, with agriculture and industry each making up less than 30 percent of total production.
Moreover, the service sector now diverts an emergent section of cross-border trade and investment
business. Its rapid expansion has outpaced the growth in merchandise trade. Between 1990 and 2002,
world trade in services grew by 155 percent in contrast to 40 percent for agriculture and 97 percent
for manufacturing. Much of this growth can be attributed to the advances in information and
communication technology and the deregulation and privatization of the service sector around the
world, which have made services increasingly tradable. Hong Kong and Singapore became richer
than European nations only when they switched from manufacturing to services. The share of
services in GDP in Hong Kong is 83 percent, the highest in the world. The share in the United States
is 71 percent, and has made the country an economic powerhouse in the 1990s. Manufacturing will
still matter in the future, but services will matter more. The South Asian region, comprising India,
Bangladesh, Nepal, Pakistan and Sri Lanka, is no exception to this trend. Services have come to
occupy between 40 to 50 percent of GDP in these countries. The service sector is the second most
important source of employment, after agriculture, in these countries, absorbing about 20-30 percent
of the labor force. Certain sectors such as information technology (IT), business process outsourcing
(BPO), tourism, construction, and energy services are important contributors to value added,
employment, exports, and investment flows in these countries. Countries like India have emerged on
the global map due to their success in exporting IT and BPO services. If one examines the
composition of services trade, no clear pattern emerges for most of the countries. Only in the case of
India, has there been a strong and consistent structural shift in services exports away from traditional
areas like travel and transport services and towards other services, mainly business services such as
information technology, business process outsourcing, and various professional services as well as
tourism (Sanzgiri, 2010).
While the prospect of export in services is varied, but if we look at the literature, there is
hardly any exports in services and FDI inflows in services from Assam.
2.4 Correlation between FDI, Exports and Economic Growth: Some Evidences from the past
It needs little emphasis that a nation‘s international competitiveness today crucially depends
upon the growth and technological dynamism of firms belonging to knowledge-based industries.

17 | Journal of Management and Science | Vol.3.No.3 | September 2013 ISSN: 2249-1260|eISSN: 2250-1819
These high-technology firms lead innovations and create knowledge, which results in enhancing a
nations‘ ability to sell more in the world market (Nagesh and Pradhan, 2005). This paper thus
examines the export performance of Indian manufacturing enterprises particularly in the knowledge-
based industries. The researchers cited some instances by trying to show the picture of Indian
manufacturing industries which is witnessing increasing exposure to foreign direct investment (FDI)
by Multinational Enterprises (MNEs). It is also emphasized in the literature on international
production that foreign firms have advantages over domestic firms in respect of export performance.
In view of their access to parents‘ resources such as ownership of new technologies, skills, brand
names, aggressive advertising strategies, globally established marketing channels and distribution
networks, and experience of operating in international markets. With access to such intangible assets,
foreign firms can be instrumental in promoting exports from the host developing countries.
Therefore, this study examines the role of foreign firms in the export performance of Indian
Manufacturing. The findings of the study suggests that foreign presence is an important factor for
achieving export success as it enhances the capability of exporting firms to ensure better after-sales
services and interaction with global buyers.
A number of econometric studies have been done in the recent past to prove the validity of
the relationship between FDI infusion in an economy and economic growth. A panel data analysis
was done to examine the relationship between Foreign Direct Investment (FDI), financial
development and economic growth using Generalised Method of Moments in a group of 70
developed and developing countries from 1988 to 2002 (Choong and Lam, 2011). It was found that
FDI has a negative and significant impact on economic growth in developing countries. The
interpretation for the negative sign of FDI is that the weak regulations and the low degree of the
financial sector development in developing countries lead to misallocation of this private capital
flow, which reduces and even reverses its impact on economic performance. To support this idea, the
researchers interacted FDI with different measures of financial sector development. The finding is
that when FDI was interacted with financial development indicators, the interaction terms are
positive and significant. The finding supports the notion that a certain level of financial sector
development is a significant and prerequisite for FDI to have a positive effect on economic growth.
The major findings of the study are that FDI generally has a positive impact on the economic growth
rate of countries. To host country, FDI offers much more than necessary investment as it raises the
factor productivity as well as enhances the ability to better integrate the domestic industries with
global markets. A time-series analysis was also employed to prove the causal relationship between
FDI and economic growth of Bangladesh using annual data from 1975 to 2005 (Md. Gazi Salah
Uddin and Md. Wahidul Habib, 2008). The Granger Causality test and Error Correction Models
were employed taking care of stochastic properties of the variables. Time-series analysis indicates
the causal nexus between export, FDI and growth. The results indicated that FDI and exports are co-
integrated and suggest a one-way causation from FDI to export growth. This implies FDI causes
export growth in the long-run but does not influence in the short-run. The specific objective of the
study was to identify factors affecting export in the economy and to test co-integration relationship
between a few variables affecting FDI in the country.
A macroeconomic study in this area of study was conducted to validate the importance of
FDI in a region. As has been rightly quoted by the authors (Verma and Arora, 2008), ―FDI continues
to gain in importance as a form of international economic transactions and as an instrument of
international economic integration‖. In judging the significance of FDI especially from the viewpoint
of developing countries, the peculiarity amid macro-economic and micro-economic effects of FDI
becomes obligatory to elucidate. Whereas the macro-economic effects of FDI are connected with the
issue of domestic capital formation, improving balance of payments crisis, creating employment
opportunities and taking advantage of external markets for achieving faster growth rates, the micro-

18 | Journal of Management and Science | Vol.3.No.3 | September 2013 ISSN: 2249-1260|eISSN: 2250-1819
economic effects are associated with the issue of cost reduction, product quality improvement,
making changes in industrial structure and developing global inter-firm linkages. The study thus tried
to check the existence of long-run causal relationship between FDI and economic growth in India.
The overall conclusions that emerged from the empirical analysis suggested that FDI is an important
variable to augment economic growth. Domestic Investment in the avenues of infrastructure, skills
formation, and private corporate sector especially in the manufacturing sector can play a lead role to
attract FDI inflows in the economy. Thus the study confirms that the economy can get the benefits of
filling up investment gap in the domestic economy through globalization in general, domestic
investment and FDI in particular. Further, proper skill development can also help the disguisedly
unemployed workers to adopt advanced technology, transferred through the channels of FDI.
In the last three decades, FDI flows have grown rapidly all over the world. This is because
many developing countries see FDI as an important element in their strategy for economic
development. The FDI has both benefits and costs and its impact is determined by the country‘s
specific condition in general and the policy environment in particular. It is a fact that FDI is one of
the most effective ways by which developing economies are integrated with the rest of the world, as
it provides not only capital but also a medium of acquiring skills, technology, organizational and
managerial practices and access to markets. The relationship between FDI and economic growth is
very controversial as it varies from country to country. The basic objective of this paper was
therefore to investigate the causality between economic growth and FDI in India and China. Ganesh
Kumar (2011) examines the direction of causality between FDI and GDP for India and China using
the Granger Causality test. It is evident from the study that in the world total FDI, the shares of FDI
inflows in India have increased from 0.15% in 1980 to 3.11% in 2009. However, in case of china it
has increased from 0.10% in 1980 to 8.53% in 2009. In the case of China, a high level of economic
growth can generate more FDI but a high level of FDI cannot generate additional economic growth.
The inflows in a country should be in such a way which leads to the economic growth of the country.
For this, such sectors should be explored which actually require FDI for the development of the
country.
A study made by Balamurali (2004) examines the relationship between foreign direct
investment and economic growth of Sri Lanka for the period 1977-2003 using Johansen‘s full
information maximum likelihood method by considering relationship between real gross domestic
product, foreign direct investment, domestic investment and openness of the trade policy regime. The
results indicate that foreign direct investments exert an independent influence on economic growth
and there is bidirectional causality between foreign direct investment and economic growth.
Roy and Mandal (2009), examined the dynamics between economic growth and FDI for a
selected group of Asian economies namely India, China, Hong Kong, Malaysia and Philippines. This
paper examined the issue of crowding-in or out effect between foreign and domestic Investment in
the long-run. Although it may be seen natural to argue that FDI can convey great advantages to host
countries. Laura (2003) showed that the benefits of FDI vary greatly across sectors by examining the
effect of FDI on growth in the primary, manufacturing and services sector. An empirical analysis
using cross-country data suggested that total FDI exerts an ambiguous effect on growth. Another
paper (Ilan, 2007) investigates the impact of foreign direct investment (FDI) on economic growth
using detailed sectoral data for FDI inflows to Indonesia over the period 1997-2006. In the aggregate
level, FDI is observed to have a positive effect on economic growth. However, when accounting for
the different average growth performance across sectors, the beneficial impact of FDI is no longer
apparent. When examining different impacts across sectors, estimation results show that the
composition of FDI matters, for its effect on economic growth with very few sectors showing
positive impact of FDI and one sector even is showing a robust negative impact of FDI inflows.
19 | Journal of Management and Science | Vol.3.No.3 | September 2013 ISSN: 2249-1260|eISSN: 2250-1819
International policy makers have long advocated that developing countries should attract
the right FDI to tap into the new international production systems of transnational corporations
(TNCs), perhaps the most dynamic elements of international trade. The importance of export-
platform FDI in stimulating economic growth is well established (Lall, 2000). Export platform FDI
is that in which foreign affiliates of multinational enterprises (MNEs) export most of their output,
with the local market in the host country being less significant to the MNE‘s location decision
(Markusen, et al. 2007). Such FDI exhibits two distinctive characteristics. First, there exist certain
industries that may exploit the international fragmentation of technologies; for example, products
developed in high-tech industries such as electronics, information technology and pharmaceuticals.
Low transportation costs in those industries then allows fragmentation in production and benefits
from differences in factor costs across economies (Arndt and Kierzkowski 2001). Second, it is
typically actively promoted by policy makers in small economies that explicitly seek access to
international technology for ―export-driven‖ growth. MNEs then utilize low cost factor resources and
use the host country as the export platform to cater to demand in foreign markets. Export platform
firm level FDI may exert two positive effects: (1) the firm will decide to export (which is arguably
good for the economy), and (2) firms that already have exported, will export more. Firms that export
generally show high productivity growth and contribute to increasing the overall productivity of the
host country (Kimura & Kiyota 2006; Baldwin & Gu 2003), thus justifying host country policies to
attract such FDI.
In addition to the studies made which dealt with assessing the overall impact of FDI on
growth, a study made by Singh (2011) focused on the impact of foreign investment on host country
industrial structure with special reference to India‘s manufacturing sector during post reform period.
The paper discussed various indicators related to liberalization such as foreign investment, export
and import intensities, share of foreign firms etc. Moreover, the core variable of the study namely
foreign presence indicated positive and significant association with industrial market concentrations.
Among other, the other variables such as import intensity and different levels of technology had
positive and significant impact on firm‘s concentration ratio. Therefore, the findings of the study
point to the regulatory authority to be more vigilant in order to ensure the efficient function of the
market in the liberal investment regime.
3. GAPS FOUND IN THE STUDIES MADE SO FAR:
• Lack of adequate data and focused research has not been taken up yet in the NER of India.
• Research is mostly inadequate in finding out the commodities where Assam can gain
comparative and competitive advantage over other countries.
• Since Assam is considered as the gateway of north-east and the only thin line of connectivity
between mainland India and the rest of the NER, Assam has only confined itself in becoming
a transit route rather than an export hub.
• Lack of strong manufacturing base has limited the scope of increasing exports beyond the
locally manufactured products.
• Trade in services is completing a neglected area (future prospects considered so far).
• Investment (domestic and foreign) flow in the region is almost negligible.
• The region never tried to revive itself from the clutches of backwardness through the
adoption of trade facilitation and infusion of investments.
4. CONCLUDING REMARKS
International competitiveness has become a key issue in the context of the current economic
reforms and the global integration thereof pursued by developing countries (Nagesh, 2005). In a
globalized world, the export success of a nation is ever more critical for its long-term economic
performance. Export success is likely to lead to productivity growth by reducing technical
inefficiency and enabling greater exploitation of economies of scale by augmenting the size of the
market. It may also result into higher innovative activity as exporting firms are conscious of
technological development abroad in order to stay in the business. Higher export expansion through

20 | Journal of Management and Science | Vol.3.No.3 | September 2013 ISSN: 2249-1260|eISSN: 2250-1819
establishment of export processing zones and a reduction of anti-export bias in inward looking
policies can even attract higher quantity and quality of FDI into the economy. And thus generate
additional growth impetus. Therefore, the importance of FDI in development is being emphasized by
increasing number of developing countries. According to Cable and Persaud (1987), ―FDI is
considered as a means of obtaining not only capital but also technology, scarce management and skill
and improved marketing know-how and outlets for non-traditional exports of manufactures,
processed commodities and traded services‖.
The mixed findings pertaining to the export performance of foreign and local firms across
countries may suggest that some countries have been successful in harnessing the potential of MNEs
through expanding their manufactured exports. However, lack of adequate data and focused research
has not been taken up yet in the NER of India and specifically in the region of Assam and it still
remains to be an untapped field.
5. REFERENCES
[1] (2006). Report- ―Transport Connectivity and economic Opportunities- South and South East
Asia‖. Guwahati: OKDISCD.
[2] Acharya, J. (June 2009). "FDI, Growth and the Environment: Evidence from India on CO2
Emission during the last two decades". Journal of Economic Development.
[3] ADB. (2012). Asian Development Bank. Retrieved from http://www.adb.org/countries.
[4] Amita Batra, Z. K. (2005). 'Revealed Comparative Advantage: An Analysis for India and
China'. New-Delshi: Indian Council for Research and International Economic
Relations.
[5] Anindita Adikary, B. B. (2009). ―Export from North-East India: Status and Challenges
ahead‖. Social Change and Development .
[6] Arnold, J. (2006). ―Connectivity and Logistics for the North-East and Beyond‖. In North-East
India Trade.
[7] Arora, D. S. (2009). ―Foreign Direct Investment and economic growth in India: A
Macroeconomic Appraisal‖. Asian Economic Review .
[8] Arshad, F. M. (2006). ―Complementarities and Areas for Mutual Economic Collaborations:
ASEAN- India‖. International Seminar. Guwahati: OKDISCD.
[9] Atif, M. A.-u.-R. (2012). "Impacts of Imports, Exports, and Foreign Direct Investment on the
Gross Domestic Product Growth". International Conference of Business Management.
Lahore.
[10] Ayanwale, A. B. (2007). "FDI and Economic Growth: Evidence from Nigeria". African
Economic Research Consortium.
[11] Balassa, B. (1965). 'Trade Liberalization and Revealed Comparative Advantage'. The
Manchester School of Economic and Social Studies.
[12] Batra, A. (2010). "Asian-Economic Integration and Sub-Regionalism: A Case Study of the
BIMSTEC. International Studies .
[13] Bender, Siegfried, Li (2002) ―The Changing Trade and Revealed Comparative Advantages
of Asian and Latin American Manufacture Exports‖, Yale University, Economic Growth
Center Discussion Paper Series No. 843
[14] Bezbaruah, M. (2006). ―Trade across Indo-Myanmar Border: A bridge for the North-East to
Asian Prosperity‖. OKDISCD.
[15] Bogahawatte, N. B. (2004). "Foreign Direct Investment & Economic Growth in Sri Lanka".
Sri Lankan Journal of Agricultural Economics.
[16] Cali, H.-P. B. (2006). ―North-East India Trade and Investment, and Comparative
Advantage‖. In North-East India Trade.
[17] Chandra, R. (2007). ―Trade in Services in South Asia: Opportunities and Risks in
Liberalization- The Indian Case‖. Institute of Policy Studies of Sri Lanka.

21 | Journal of Management and Science | Vol.3.No.3 | September 2013 ISSN: 2249-1260|eISSN: 2250-1819
[18] Felicitas Nowak-Lehmann, S. V.-Z. (2008, July). 'Does Comparative Advantage Make
Countries Competitive? A Comparison of China and Mexico'. Centre for European,
Governance and Economic Development Research .
[19] Fortanier, F. (August 2007). "Foreign Direct Investment and Host Country Economic
Growth: Does the investor's country of origin play a role?". Transnational Corporation.
[20] Furuoka, 1. F. (2009). "Exports and Economic growth in ASEAN Countries: Evidence from
Panel Data Analysis".
[21] Habib, M. G. (2009). ―Causal Relationship between FDI and export for Bangladesh: A
Time-Series analysis‖. Asian Economic Review .
[22] Habib, M. G. (2009). ―Causal Relationship between FDI and export for Bangladesh: A
Time-Series analysis‖. Asian Economic Review.
[23] Huay-Huay Lee, H.-A. L.-S. (2007). ―India- ASEAN-5 Economic Integration: Impact of
Liberalization‖. The Icfai Journal of Applied Economics .
[24] IIFT. (2008). ―Estimates of Exports from the North-Eastern Region‖. Ministry of
Commerce (Govt. of India).
[25] Kondapalli, S. (2010). ―India‘s interactions with East Asia: Opportunities and Challenges‖.
International Studies , 305-321.
[26] Kumar, G. (2011). ―Causality between FDI and economic growth: A comparative study of
India and China‖. Man and Development .
[27] Kumar, G. (2011). ―Causality between FDI and economic growth: A comparative study of
India and China‖. Man and Development.
[28] Kurudu, A. (2010). Export and Economic Growth in the Economy of India: An Econometric
Study(1971-2005). The IUP Journal of Applied Economics .
[29] Lam, C. K.-Y. (2011). ―Foreign Direct Investment, Financial Development and Economic
Growth: Panel data Analysis‖. The IUP Journal of Applied Economics .
[30] Lam, C. K.-Y. (2011). ―Foreign Direct Investment, Financial Development and Economic
Growth: Panel data Analysis‖. The IUP Journal of Applied Economics.
[31] Ljungwall, C. (2007). "Financial Sector Development, FDI and Economic Growth in
China". China Center for Economic Research.
[32] Madaan, R. S. (2011). ―Trade and Investment Relations between India and Bangladesh:
Status and Possibilities‖. Man and Development .
[33] Ministry of Commerce & Industry, Govt. Of India. (2012, January). Department of
Industrial Policy and Promotion. Retrieved from FDI Statistics: http://www.dipp.nic.in/
[34] Moenius, J. (2006). 'Measuring Comparative Advantage: A Ricardian Approach'. University
of Redlands.
[35] Mousumi Bhattacharya, S. N. (2011). "The Interrelationship between Merchandize Trade,
Economic Growth and FDI Inflows in India‖. South-Eastern Europe Journal of Economics.
[36] Murthy, G. (2009). India and South-East Asia:Civilizational Ties and New Partnerships.
Asian Economic Review .
[37] Mustafizur Rahman, T. I. (2011). "Bangladesh's Export Opportunities in the Indian Market:
Addressing Barriers and Strategies for Future". South Asia Economic Journal , 117-141.
[38] Naidu, G. (2010). ―India and South-East Asia‖. International Studies , 285-304.
[39] Nations, U. (2011). UN Comtrade: United Nations Commodity Trade Statistics Database.
Retrieved from http://unstats.un.org/.
[40] NEC, D. a. (2008). Northeastern Region Vision 2020. Govt. of India.
[41] Oliveira, L. H. (2001). "FDI and Export-led Growth: A Challenge to Brazil". The Institute
of Brazillian Business and Public Management Issues .
[42] Pradhan, N. K. (2005). ―Knowledge-based Exports from India: Recent Trends, Patterns and
Implications‖. In N. Kumar, International Competitiveness and Knowledge-Based Industries.

22 | Journal of Management and Science | Vol.3.No.3 | September 2013 ISSN: 2249-1260|eISSN: 2250-1819
[43] Preet S. Aulakh, M. H. (2011). "Export Strategies & Performance of Firms from Emerging
Economies". In Massaki, The Future of Global Business (pp. 279-318). Taylor & Francis.
[44] Rahul Sen, M. G. (2006). "ASEAN- India Economic Relations: Current Status". OKDISCD
Conference. Guwahati.
[45] Ramkishen S. Rajen, S. M. (2009). 'How can India Increase its Attractiveness as a
Destination for FDI?' In R. S. Rajen Monetary Investment and Trade Issues in India (pp. 127-
151). New-Delhi: Oxford.
[46] Ramkishen S. Rajen, S. M. (2009). 'How have the Export Structures of India and China
Evolved?'. In R. S. Rajen, Monetary, Investment and Trade Issues in India, New-Delhi:
Oxford.
[47] Raychaudhuri, A. (2005). ―India- Bangladesh border trade: Some Analytical issues‖. In
Cross Border Trade.
[48] Richardson, David. J and Chi Zhang (1999) ―Revealing Comparative Advantage: Chaotic or
Coherent Patterns Across Time and Sector and U.S Trading Partner?‖, National Bureau of
Economic Research, Working Paper 7212
[49] Sampath, D. (2006). ―How can Indian SMEs become export competitive?‖. CRISIL Young
Thought Leader Series , pp. 169-180.
[50] Samrat Roy, K. M. (2009). "Empirical Evidence on the Relationship between Foreign Direct
Investment and Economic Growth: A Cross-Country Exploration in Asia".
[51] Sarma, A. (2011). ―A Unified North-East Economy: Road to gainful economic integration
with South-East Asia‖. Social Change and Development .
[52] Sarma, A. J. "India-ASEAN relations in 21st Century: The North-East India in Between. In
Agenda for Assam and the North-east: Issues and trends.
[53] Sarma, D. K. (2005). "Bilateral Trade between NER and Bangladesh: Challenges and
Prospects. In Indo-Bangladesh Border Trade.
[54] Singh, J. (2010). ―Concentration in India‘s Manufacturing Industry: Impact of Investment
Liberalization‖. Man and Development .
[55] Singh, J. (2011). ―Concentration in India‘s Manufacturing Industry: Impact of Investment
Liberalization‖. Man and Development.
[56] Smit, A. J. (2010). 'The Competitive Advantage of Nations: Is Porter's Diamond Framework
a new theory that explains the International Competitiveness of Countries'. Southern African
Business Review Vol. 14 .
[57] Thulin, P. B. (2006). 'Can Countries Create Comparative Davantage? R&D-Expenditures,
High-tech exports and Country Size in 19 OECD countries, 1981-1999'. Centre of Excellence
for Studies in Science & Innovations .
[58] UNCTAD. (2012). United Nations Centre for Trade and Development. Retrieved from
http://www.unctad.org/
[59] UNCTAD. (2012). United Nations Centre for Trade and Development. Retrieved from
http://www.unctad.org
[60] Unit, T. E. (2007-11). The Economist Intelligence Unit (EIU). Retrieved May 23, 2013,
from World Investment Prospects to 2011:
http://www.vcc.columbia.edu/pubs/documents/WorldInvestmentProspectsto2011
[61] Utku Utkulu, D. S. (2004). 'Revealed Comparative Advantage: and Competitiveness:
Evidence for Turkey vis-a-vis the EU/15'. European Trade Study Group. Nottingham.
[62] Yeats, Alexander J (1997) ―Does Mercosur‘s Trade Performance Raise Concerns about the
Effects of Regional Trade Arrangements‖, International Economics Department, The World
Bank
[63] Yue, Changjun (2001) ―Comparative Advantage, Exchange Rate and Exports in China‖,
paper prepared for the international conference on Chinese economy, CERDI, France
******

23 | Journal of Management and Science | Vol.3.No.3 | September 2013 ISSN: 2249-1260|eISSN: 2250-1819
AN EVALUATION OF THE COMMUNITY-BASED
PARTICIPATORY EXTENSION APPROACH (PEA) IN
OKEHI LOCAL GOVERNMENT AREA, OF KOGI,
STATE NIGERIA aSaliu Hassan Onipe,
aOdoma Michael,
aEmeje Hassan and
aOlajide Kolawole
aDepartment of Agricultural Education, School of Vocational Education,
Kogi State College of Education (Technical) Kabba, Kogi State.
Email: [email protected]
ABSTRACT: This study was carried out to evaluate the community-based participatory
extension approach in Okehi Local Government Area of Kogi State. The specific objectives
were to examine the socio-economic profile of the farmers, level of participation,
effectiveness of the PEA model in addressing farmers technological needs and problems
militating against effective operation. Data were collected using structured interview
schedule from 60 respondents who were randomly selected. The data collected were
analyzed by the use of descriptive statistics such as tables, percentages frequencies and
means. The Result from the analysis showed that 60 percent were within (40-59years) which
could be considered to be the age bracket for economically active population. The level of
participation was found to be (65 percent). The study shows that the community-based
participatory extension approach has positive effects in the area because production was
higher after the intervention of PEA model. The major problem identified with the PEA model
in the area include, illiteracy, inputs not readily available, approach is time consuming, lack
of credit as well as inadequate extension contact. The study concluded by recommending that
efforts should be intensified on provision of adequate rural infrastructure like school, feeder
roads and marketing outlet for the farmers produce. This would help improve and sustain the
gains accruable from participating in this project.
Keywords: Participatory, Extension, Approach, Kogi state
INTRODUCTION
Project experience over the last twenty years has fueled debate concerning the role of public
sector agricultural extension strategies to increase agricultural productivity and alleviate rural
poverty. The dominant approach in World Bank supported projects since the early 80‘s is the
training and visit (T and V) system. This approach had some note worthy successes and some
failures, although the system is intended to incorporate feedback from farmers, this is not
always accomplished and the role of farmers as receivers of instruction is often passive.
Consequently, the results of investment in training and visit have sometimes been
disappointing and unsatisfactory regarding sustainability ( Burkey, 1993).
Perhaps a quite revolution has also been launched in agricultural extension approach model
by the National Agricultural Extension Research and Liaison Service of Ahmadu Bello
University Zaria who has a national mandate to co-ordinate agricultural extension in Nigeria.
In making extension more demand driven and more accountable to farmers, the participatory
approaches is being recognised as possible options of ensuring that services are relevant and
responsive to local condition as well meet the real needs of users (Eremie, 2001).

24 | Journal of Management and Science | Vol.3.No.3 | September 2013 ISSN: 2249-1260|eISSN: 2250-1819
Participatory method makes the distribution of extension service more equitable and putting
responsibility in the hands of farmers to determine agricultural extension programmes.
OBJECTIVES OF THE STUDY
The broad objective of this study is to evaluate the community-based farmers‘ participatory
extension approach in Okehi Local Government Area of Kogi State. The specific objectives
are as follows:
i. to describe the socio-economic profile of the farmers been studied
ii. to assess the level of participation of local farmers to the PEA model
iii. to identify the effectiveness of the PEA model in addressing farmers technological needs.
iv. to examine those problems militating against effective operation.
METHODOLOGY
Kogi State is bordered by nine other States and is the most centrally located State in Nigeria.
Kogi State has an average maximum temperature of 33.2°c and average minimum of 22.8°c.
(Kogi State Government, 2007). The State has two distinct weathers – dry season, which lasts
from November to February and the raining season that lasts from March to October. Annual
rainfall ranges from 1016 to 1524 mm. The study was undertaken in okehi local government
areas of kogi state.
A total of 60 respondents were selected using stratified random sampling technique. The
farmers are drawn from three different communities in okehi local government. These were
Ihima, Obangede and Eika. In each community, 20 farmers were randomly selected for the
study . For collecting relevant data from the respondents, an interview schedule was prepared
considering the objectives in view. Personal Interview was conducted with all the 60
respondents using interview schedule.
Data were analyzed using simple description statistical tools, which include the use of tables,
mean and percentages.
Simple descriptive statistic is calculated as follows:
I Mean = 𝑋
𝑛 where = summation
X = individual observation
n = total observation
II Percentage = 𝑜𝑏𝑠𝑒𝑟𝑣𝑒𝑑 𝑓𝑟𝑒𝑞𝑢𝑒𝑛𝑐𝑦
𝑡𝑜𝑡𝑎𝑙 𝑓𝑟𝑞𝑢𝑒𝑛𝑐𝑦𝑋 100
RESULTS AND DISCUSSION
The results are presented and discussed in line with the objectives of the study
Socio Economic Profile of the Respondents
The socioeconomic characteristics of the respondent, namely age of respondents, educational
qualification, marital status, the major and minor occupation of individuals and land
ownership pattern may have a pattern effect on organizational activities, including
establishment of association or groups.

25 | Journal of Management and Science | Vol.3.No.3 | September 2013 ISSN: 2249-1260|eISSN: 2250-1819
Age Distribution of the Respondents Data in table below show that the respondent age fall into three categories , the lower age
(20-39) years, the middle age (40-59) years and the older age. The mean age of the farmers is
47 years. From the result, about 60percent of the respondent belongs to the middle age, this
category of farmers could be considered to be the most economically active and such
productive population(Oluwasami,1986).
Educational Attainment
Analysis of data on the table below revealed that 50percent indicated they had no formal
education, about 30percent had attained adult education, while 5 percent had quranic
education , 10percent had primary education while 5percent indicated they had attained
secondary education and none of the farmers had attained post-secondary education. The
largest proportion of the respondent is 50percent which had no formal education indicating a
high illiteracy level among most of the farmers, since farmers participation is a function of
educational level(Clark and Akinbode,1986)
Land Ownership Pattern
The result revealed that all respondents indicated a uniform land ownership pattern, that is,
land could be either through inheritance, renting or freehold where farmer could be allocated
a parcel of land by the community leader for cultivation and subsequent ownership.
Marital Status
The data in table revealed that 3percent of the farmers are single, about 60 percent of the
farmers were married, while 37 percent of the farmers were divorced. This means that the
population interviewed during the field survey exercise was mature and responsible, saddled
with various family responsibilities as a result would naturally engage in viable program that
will enhance their economic status and income for the uplift of their livelihood and their
dependants
Major and minor Occupation
The data revealed that all the respondents indicates farming to be their main occupation. All
takes minor activities like trading and other activities such as blacksmithing , brick layering
and basket making to supplement income from their farms. This is mostly done during the
relatively idle period of between December and May when the dry season is at its peak. Thus,
one can conclude that farming is the bedrock of the economy of those communities in the
area of study.
Distribution of Socio Economic Profile of the Respondents
Frequency
Percentages(%)
Age Ranges in Years
20-39 16 26.7
40-59 36 60
60 and above 8 13.3
Total 60 100
Members Status
No formal education 30 50
Adult education 18 30

26 | Journal of Management and Science | Vol.3.No.3 | September 2013 ISSN: 2249-1260|eISSN: 2250-1819
Quranic education 3 5
Primary education 6 10
Secondary education 3 5
Post secondary education - -
Total 60 100
Marital Status
Single 2 3.3
Married 36 60
Divorce 22 36.7
Total 60 100
Occupation
Farming 60 100
Others 60 100
Total 120*
200*
*Multiple Response
Distribution of Respondents based on Participation
The Level of Participation of Local Farmers to the PEA model
The result revealed that 65 percent of the farmers are having regular contact with extension
agent while 35 percent of the farmers are not having regular contact with the extension
agents. The result shows that majority of the farmers had participated with extension agents
since agricultural extension delivery by the way of participatory approach involves problem
identification and solution proffering.
Distribution of Respondent based on participation
Contact Frequency Percentages(%)
Regularly 39 65
Not regularly 21 35
Total 60 100
The Effectiveness of PEA model in addressing Farmers Technological Needs
Farmers Perception and Rating of PEA Model
The data revealed that 50percent rated the PEA model as good, while 42 percent rated the
model to be difficult, 8 percent rated the model to be complementary. This is an indication
that with the involvement of the local farmers at all levels of the farming programs, they will
be empowered and the model is actually set to increased agricultural production and
subsequently income of the rural farmers.
Distribution of Farmers Perception and Rating of the PEA Model
Rating Frequency Percentages(%)
Good 30 50
Difficult 25 41.7
Complementary 5 8.3
Total 60 100
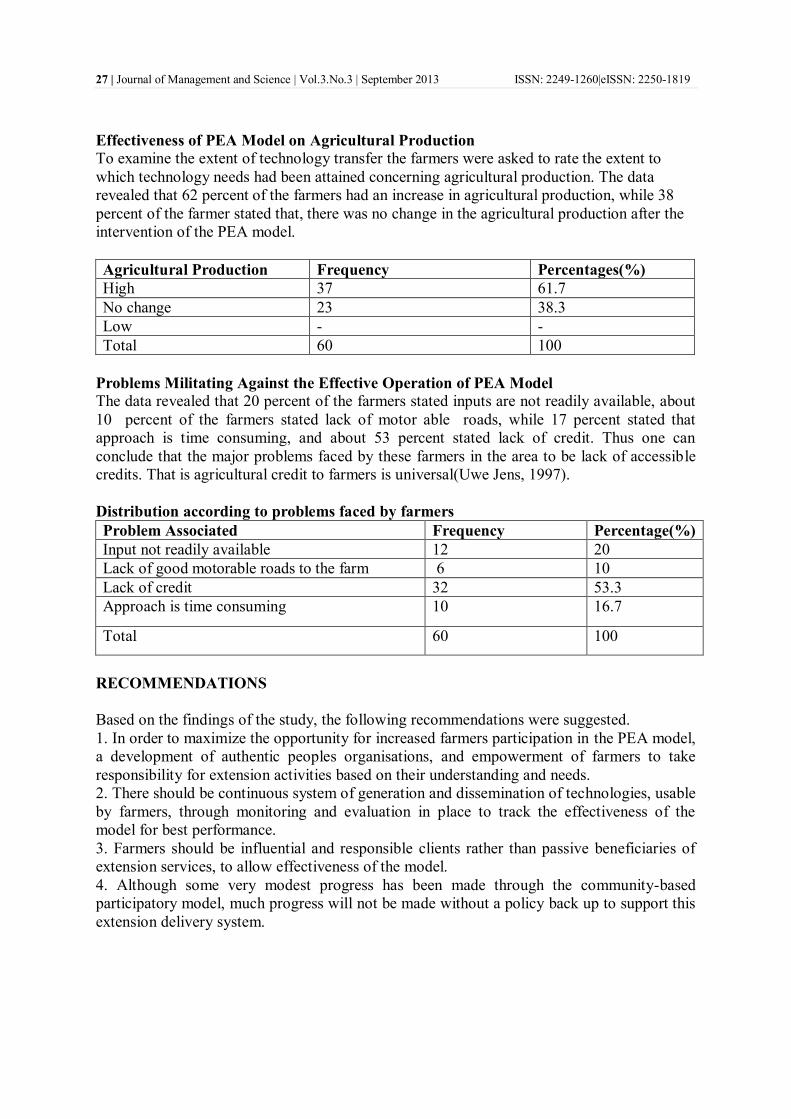
27 | Journal of Management and Science | Vol.3.No.3 | September 2013 ISSN: 2249-1260|eISSN: 2250-1819
Effectiveness of PEA Model on Agricultural Production
To examine the extent of technology transfer the farmers were asked to rate the extent to
which technology needs had been attained concerning agricultural production. The data
revealed that 62 percent of the farmers had an increase in agricultural production, while 38
percent of the farmer stated that, there was no change in the agricultural production after the
intervention of the PEA model.
Agricultural Production Frequency Percentages(%)
High 37 61.7
No change 23 38.3
Low - -
Total 60 100
Problems Militating Against the Effective Operation of PEA Model
The data revealed that 20 percent of the farmers stated inputs are not readily available, about
10 percent of the farmers stated lack of motor able roads, while 17 percent stated that
approach is time consuming, and about 53 percent stated lack of credit. Thus one can
conclude that the major problems faced by these farmers in the area to be lack of accessible
credits. That is agricultural credit to farmers is universal(Uwe Jens, 1997).
Distribution according to problems faced by farmers
Problem Associated Frequency Percentage(%)
Input not readily available 12 20
Lack of good motorable roads to the farm 6 10
Lack of credit 32 53.3
Approach is time consuming 10 16.7
Total 60 100
RECOMMENDATIONS
Based on the findings of the study, the following recommendations were suggested.
1. In order to maximize the opportunity for increased farmers participation in the PEA model,
a development of authentic peoples organisations, and empowerment of farmers to take
responsibility for extension activities based on their understanding and needs.
2. There should be continuous system of generation and dissemination of technologies, usable
by farmers, through monitoring and evaluation in place to track the effectiveness of the
model for best performance.
3. Farmers should be influential and responsible clients rather than passive beneficiaries of
extension services, to allow effectiveness of the model.
4. Although some very modest progress has been made through the community-based
participatory model, much progress will not be made without a policy back up to support this
extension delivery system.

28 | Journal of Management and Science | Vol.3.No.3 | September 2013 ISSN: 2249-1260|eISSN: 2250-1819
REFERENCES
[1] Akinbode J, Clark H. (1986) Agricultural Extension and Rural Sociology. Osun: League
of Researchers in Nigeria.
[2] Burkey, S. (1993). People First. A Guide to Self-Reliant Participatory Rural
Development. Zed Books, London.
[3] Eremie, S.W. (2001). Determined Agricultural Extension Services more productive .
Agric-business, This Day Newspaper September, pp.27-28.
[4] Oluwasami A. (1986). Agricultural Extension and Rural Sociology, University of Nigeria
press, Nsukka.
[5] Uwe Jens Nagel, (1997). Alternative Approaches to Organizing Extension. Berlin,
Germany:http://www.fao.org/docrep/W 5830e04.htm.
*****

29 | Journal of Management and Science | Vol.3.No.3 | September 2013 ISSN: 2249-1260|eISSN: 2250-1819
IMPACT OF MERGER & ACQUISITION
ANNOUNCEMENTS ON SHARE PRICE – A CASE OF
SELECTED INDIAN LISTED COMPANIES
Dr.S.Poornima1 and V.Chitra
2
1Associate Professor, P.S.G.R.Krishnammal College for Women, Coimbatore
2Assistant Professor, Karpagam Institute of Technology, Coimbatore
ABSTRACT: This study examines the impact of merger and acquisition announcements on
share price towards acquiring companies during the year 2012 listed on National Stock
Exchange, India. The investigation has been carried out using traditional event study
methodology. The present study is an empirical analysis to examine the stock price reaction
to information content of merger and acquisition announcements with a view of finding
whether Indian stock market is semi-strong efficient or not. Impact has been analyzed
between 7 days from the date of merger and acquisition announcement. The result divulges
that around the announcement period the returns for the acquiring companies are higher. In
the post merger announcement period there is an upward trend in the cumulative returns
implying a positive result of the merger.
Keywords: Mergers & Acquisitions, Event study, Announcement date, Abnormal return.
1. Introduction
In today's challenging global business environment and demanding economy,
companies must seek unconventional techniques to remain competitive. Managers are
constantly devising means to create corporate value in order to translate this to shareholders
through higher dividend payments or higher share prices. In recent years, mergers and
acquisitions have become an increasingly important method for companies to survive in the
competitive global business arena. The law of the jungle is hitting the business environment,
where only the strongest corporations stay in business. That is one of the reasons why the
number of mergers and acquisitions (hereinafter ―M&A‖) have augmented.
The announcement of a Merger or an Acquisition is considered as an event in this
study. The objectives of this paper are: (a) to investigate whether insider information or
publicly available information drives the observed price pattern of the acquirer companies
using event studies, and (b) to examine the effect of merger and acquisition announcement on
acquirer companies‘ stock prices. Comparisons of the price run ups prior to the
announcement of the merger and post announcement price pattern has also been studied.
Further we also analyze the merged entity‘s stock price post merger, by examining the daily
closing price of all the stocks prior and post merger announcement. The rest of the paper is
divided into reviews the literature related to event studies, especially relating to merger. The
data description and methodology are presented in next section. The empirical findings are
given in next section and the last section concludes.
2. Review of Literature
Numerous studies estimate the effects of announcements related to Bonus issues,
dividend declaration, mergers & acquisition on the stock prices of the firms involved in the
process. In the present study the impact of merger announcement is analyzed and the
pertinent literature in this context is as follows:

30 | Journal of Management and Science | Vol.3.No.3 | September 2013 ISSN: 2249-1260|eISSN: 2250-1819
Ball, Brown & Finn (1977) examined stock price reaction around the announcement
of ‗stock capitalization changes‘ (bonus, stock issues, stock splits & right issues) in Australia
for the period between 1960 &1969 using monthly data. They found 20.2% abnormal return
for 13 months up to & including the month of bonus issue announcement.
Foster & Vickrey (1978) examined the signaling hypothesis of the information
content of 82 stock dividend announcements using data of daily returns. They found
significant positive abnormal returns around the announcement dates.
Lakonishok & Lev (1987) studied the trading volume changes after the announcement
of stock dividend. They researched the characteristics of the companies with stock dividends
& without stock dividends. They concluded that there is no significant increase in trading
volume as a result of stock dividends & no significant difference in the prices of two groups.
Lijleblom (1989) researched the signaling hypothesis by examining stock price
reaction to stock dividends for firms that also released simultaneous contaminating
announcements. Findings indicated significantly greater positive price reactions for the stock
dividend- paying group than for the control group, which was interpreted as support for the
signaling hypothesis in the presence of contaminating announcements.
Spuma M. Rao (1997) studied the effect of announcement of Bribery, scandals, white
collar crime & illegal payment on returns to shareholders. The analysis shows that the actual
stock prices for those companies were lower than the expected market adjusted returns after
the announcement.
Ahmed Sohrabian & Jeanni Kusaudi (1999) investigated the impact of insurance
mergers on shareholders returns. The results reveal that acquiring firms do not post any
positive significant abnormal returns during the announcement period while the target firms
get positive significant abnormal returns.
Balachandran Bala Singham (2001) examines the share price reaction to
announcement of bonus share issues of Australian companies. They analyzed that the
magnititude of price reaction to bonus issue announcements is statistically related to the size
of bonus issues and pre-announcement effect.
Mulugetta Abraham et al (2002) examined the impact of standard and Poor‘s ranking
changes on stock prices. The study used the traditional market model and found statistically
significant abnormal returns on the announcement & surrounding dates.
Malhotra Madhuri et al (2003) provided evidence to support signaling hypotheses by
examining the relationship between bonus issue announcement and stock price reaction. The
study concluded that there is a negative reaction after the bonus issue announcement
conveying that the market under reacts after the announcement.
Frank T. Delaney & Sam C. Wamuziri (2004) inferred the impact of mergers and
acquisitions on shareholders wealth. The overall results from their study indicate that related
construction mergers create wealth for shareholders of the target firm.
Xiaoww Huang (2004) analyzed the market reactions to financial announcement and
provided the evidence that announcement related to earnings can lead to excess returns.
31 | Journal of Management and Science | Vol.3.No.3 | September 2013 ISSN: 2249-1260|eISSN: 2250-1819
Delaney T. Frank and Wamuziric C. Sans (2004) analyzed wealth effects from the
construction mergers. The study concluded that wealth effects from construction mergers are
positive.
Mishra A K (2005) examined the stock price reaction to information content of bonus
issue. The results indicated significant positive abnormal returns for a five-day period prior to
bonus announcement. The results indicate stronger evidence of semi- strong market
efficiency of the Indian stock market.
Chander Ramesh, Sharma Renuka, Mehta Kiran (2007) studied the informational
content of dividend announcement. The results showed average abnormal returns for capital
asset pricing model around the dividend announcement.
Vergos, Christopoulous & Mylonakis (2008) investigated the effects of political,
economic, investment & analysts report announcement on share prices of Hellenic
telecommunication organization. The study found that stock prices do not react to public
announcement & continue to increase or decrease until 10 days after the event.
Anup Agrawal Jeffrey F. Jaffe (1999), in their article ―The Post - merger Performance
Puzzle‖, examines the literature on long- run abnormal returns following mergers. The paper
also examines explanations for any findings of underperformance following mergers. We
conclude that the evidence does not support the conjecture that underperformance is
specifically due to a slow adjustment to merger news. We convincingly reject the EPS
myopia hypothesis, i.e. the hypothesis that the market initially overvalues acquirers if the
acquisition increases EPS, ultimately leading to long - run under - performance.
3. METHODOLOGY
This section is divided into two parts: Data sources & data design. The data sources
section explains the criteria applied in this study & data collection process. The data design
section, on the other hand, describes the procedure of event study conducted in this research.
The research hypotheses examined in this study are tested by applying an event study
methodology described by Stephen J. Brown & Jerold B. Warner (1985).
A) DATA SOURCES:
The present study is descriptive and empirical in nature and it is based on secondary
data. To obtain sample for the study, all firms that were either an acquirer or a target of the
merger announcements during the period of January 2012- December 2012 are identified. In
order to be included in the study, the acquiring company should be listed National Stock
Exchange (NSE) during the period. A total of 6 companies met the above criteria and hence
form the final sample in the study. The data on stock prices of the sample for the entire period
of study are extracted from cmie-prowess, www.captialine.com and www.nseindia.com.
The selected companies are Binani Industries Ltd, Piramal Healthcare Ltd, Infosys
Ltd, Rain Commodities Ltd, Cipla Ltd and Oil & Natural Gas Corp Ltd has been selected and
data obtained from Prowess. The data used for the study are for the period from January
2012- December 2012. Closing Market Price of shares before seven days of date of merger
announcement and after seven days of date of merger announcement has been taken for
analysis. The announcement date is identified as the day when the target or acquiring
company first publishes disclosed information about the merger. This was specified as day
zero in the event time of our study. There were cases where some public announcements were

32 | Journal of Management and Science | Vol.3.No.3 | September 2013 ISSN: 2249-1260|eISSN: 2250-1819
also made after the market closed and some were made before. Importantly, in the latter case,
market reaction took place a day before the merger news appeared in the national dailies.
Hence, in this case we might incorrectly interpret the market reaction as a day before the
news appeared in the national dailies as existence of ―abnormal return‖ based on trading on
non-public information. Thus, in order to eliminate this bias the announcement date is
defined as a range covering the date when the news appeared in the national dailies and the
immediate preceding day, if it was a trading day. In such case, stock price for day ‗0‘, i.e. the
announcement date is calculated using a simple average of prices on the day when the news
appeared in the national dailies and on the day immediately preceding it, if it was a trading
day.
Summary Statistics, difference Paired t-test has been used for measuring the change in
share price with merger announcement.
The information about the company‘s merger announcements, their announcement
dates are obtained from Capitaline database. The individual firm‘s security return & market
return were also gathered from Capitaline Database. Values of the companies were also
obtained from Capitaline Database.
B) DATA DESIGN:
To examine the market response to merger announcement standard event study
methodology is used. The ordinary least square (OLS) market model is applied for estimation
of abnormal return on a specific stock. The event study procedures in this study are gathered
from previous researches by Bowman (1983) and Brown & Warner (1980 & 1985).To
construct an event study the event, event date, event window, estimation window &
estimation model should be determined. The event is what the researcher would like to study.
The relationship of the said event is studied with the share prices. The events defined for this
study are the merger announcements. The event date is the date of announcement of merger
announcement by the sample firm. It can be expressed as to. The event window comprises
some period before and after the event day. The event window in this study is days before
and 7 days after merger announcement. It can be expressed as -7 to +7. The estimation period
is the period prior to the occurrence of the event. Generally estimation period & event
windows are chosen in such a way so that they don‘t overlap. The estimation period for this
study is 7 days before to 7 days after the event date.
It can be expressed as t = -7 to t = -7. The selected examination model for this study is
standard market model. The model assumes that there is a linear relationship between the
return of the security and the return of market portfolio. For the purpose of studying the
impact of right issues on share prices abnormal returns are computed. Abnormal returns are
obtained by finding the difference between actual returns of the security j on day t &
expected returns of security j on day t.
For the purpose of studying the impact of right issues on share prices abnormal
returns are computed. Abnormal returns are obtained by finding the difference between actual
returns of the security j on day t & expected returns of security j on day t. The following is
the formula for OLS market model to compute abnormal returns:-

33 | Journal of Management and Science | Vol.3.No.3 | September 2013 ISSN: 2249-1260|eISSN: 2250-1819
ARjt = Rjt - ERjt
Where
ARjt = Abnormal return of security j on day t
Rjt = Actual return on security j on day t
ERjt = Expected return on security j on day t
Expected return on security j in period t is computed as follows:-
ERjt = aj + bj Rmt
Where
aj = Risk free rate of return i.e. Treasury bill rate of RBI
bj = Relative riskiness of the security to market index i.e. BSE Sensex
Rmt = The rate of return on market index on the day t
4. LIMITATIONS OF THE STUDY
The present study is confined to only one event announcement.
This study is restricted with only few companies.
All the limitations of the tools used are applicable to this study.
5. EMPIRICAL RESULTS
This section describes various analyses carried out to predict the impact of merger
announcements on share prices during the study period.
The share price reaction has been studied from the base data considered for this study.
The base data consists of closing price of the selected sample. Similarly, -7 days, event day
and +7 days share price were captured for every year and for all the companies.
Table 1: List of Mergers during the year 2012
S.No. Acquiring
Company Target Company Target Industry
Merger
Announcement
date
Share
Price
1 Binani Industries
Ltd, India
3B The Fiberglass
Company, Belgium
Textile and
Apparel Products
2nd
Feb 2012 116.2
2 Piramal
Healthcare Ltd,
India
Decision Resources
Group LLC, United
States
Business Services 16th
May 2012 427.25
3 Infosys Ltd, India Lodestone
Management
Consultants AG,
Switzerland
Business Services 10th
Sep 2012 2511
4 Rain Commodities
Ltd, India
Rutgers Belgium NV,
Belgium
Chemicals and
Allied Products
22nd
Oct 2012 41.15
5 Cipla Ltd, India Cipla Medpro South
Africa Ltd
Drugs 21st Nov 2012 389.4
6 Oil & Natural Gas
Corp Ltd, India
NCOC BV,
Kazakhstan
Oil and Gas;
Petroleum
Refining
26th
Nov 2012 241.92

34 | Journal of Management and Science | Vol.3.No.3 | September 2013 ISSN: 2249-1260|eISSN: 2250-1819
The above table shows the date on which, the merger was announced and the share
price details on the date of announcement of the acquiring companies. From these dates, daily
adjusted prices for sample stocks for 7 days before and 7 days after the event date were taken
and the event window were determined as t = 7 to t = +7 relative to the event day t =0 (date
of announcement of merger and acquisitions). The study aim is to find whether the events
have any signaling impact on the share prices or not.
Table 2 Distribution of the Closing prices
Acquiring Companies and their Industries
Average
Closing
Price
Skewness Kurtosis
Textile and
Apparel
products
Binani Industries Ltd,
India
Post 123.4286 1.712867 -0.55901
Pre 109.3429 -0.40163 0.432809
Business
Services
Piramal Healthcare
Ltd, India
Post 420.0214 0.543116 0.156411
Pre 439.1929 -1.30699 1.084904
Business
Services Infosys Ltd, India
Post 2573.179 0.425023 1.287926
Pre 2391.407 -1.1867 1.683302
Chemicals
and Allied
Products
Rain Commodities Ltd,
India
Post 39.15714 -0.49743 -0.39598
Pre 43.1 -0.90377 1.534301
Drugs Cipla Ltd, India Post 393.05 1.064662 0.171788
Pre 386.7214 -0.34689 -2.35232
Oil and
Gas;
Petroleum
Refining
Oil & Natural Gas
Corp Ltd, India
Post 259.05 0.32002 2.24478
Pre 253.1929 1.53959 2.672751
From the above table, it can be observed that Binani Industries Ltd had shown a
positive skewness value of 1.712867 during the post-merger announcement period.
Similarly, Piramal Healthcare Ltd, Infosys Ltd, Cipla Ltd and Oil & Natural Gas Corp Ltd
had shown a positive skewness value of 0.543116, 0.42502, 1.0646623 and 0.32002 during
the post-merger announcement period. This shows that there is a positive impact on share
prices during the post-merger announcement period for the above said companies. But,
Rain Commodities Ltd had shown negative impact on share price during both pre- and post-
merger announcement period. Oil & Natural Gas Corp Ltd had shown positive impact on
share prices during both pre- and post-merger announcement period.

35 | Journal of Management and Science | Vol.3.No.3 | September 2013 ISSN: 2249-1260|eISSN: 2250-1819
Table 3 Comparison of the closing prices of the Pre-Merger Announcements and
Post-Merger Announcement
Companies Pre-Merger
Announcements
Post-Merger
Announcements Variance
Binani Industries Ltd, India 109.3429 123.4286 111.1096
Piramal Healthcare Ltd, India 439.1929 420.0214 124.7673
Infosys Ltd, India 2391.407 2573.179 106.3439
Rain Commodities Ltd, India 43.1 39.15714 4.4000659
Cipla Ltd, India 386.7214 393.05 95.92286
Oil & Natural Gas Corp Ltd,
India 253.1929 259.05 39.34412
The above table shows that there are positive variances found in all acquiring
companies during the study period. Binani Industries had shown a positive variance of
111.1096, Piramal Healthcare Ltd had shown a positive variance of 124.7673, Infosys Ltd
had shown a positive variance of 106.3439, Rain Commodities Ltd had shown a positive
variance of 4.4000659, Cipla Ltd had shown a positive variance of 95.92286 and Oil
& Natural Gas Corp Ltd had shown a positive variance of 39.34412.
Table 4: AAR, CAAR and t-statistic for Acquiring companies
Companies Pre-Merger Announcements Post-Merger Announcements
AAR CAAR t-stat AAR CAAR t-stat
Binani Industries Ltd, India 0.1032 -0.0192 0.1376 1.2880 0.1684 0.4051
Piramal Healthcare Ltd,
India -0.1618 -0.0607 0.0926 -0.3384 -0.0340 0.5198
Infosys Ltd, India 0.0322 0.0289 0.0548 0.0321 0.0543 0.1232
Rain Commodities Ltd, India -0.9074 -0.2790 0.0888 -0.0045 0.0394 0.0915
Cipla Ltd, India 0.2017 -0.0311 0.3536 0.2636 0.0828 0.1345
Oil & Natural Gas Corp Ltd,
India 0.0351 -0.0062 0.0604 -0.1162 -0.0212 0.0760
It is observed from the above table that average abnormal return and t-statistics of
share price have been calculated for above companies. For the Binani Industries Ltd, the
average abnormal return for pre-merger and post-merger announcements shows positive
performance on share price of 0.1032 and 1.2880. T-statistics was performed to measure the
significant difference, during the study period, pre-merger announcement shows a value of
0.1376 and post-merger announcement had shown a value of 0.405. The Company found
significant difference in both pre-merger announcement and post-merger announcement. It is
tested at 5% level of significant.
Similarly, abnormal return has been computed for Piramal Healthcare Ltd it shows
that pre-merger and post-merger announcements shows a negative performance of share price
of -0.1618 and -0.3384. T-statistics was performed to measure the significant
difference, during the study period, pre-merger announcement shows a value of 0.0926
and post-merger announcement had shown a value of 0.5198. The Company found

36 | Journal of Management and Science | Vol.3.No.3 | September 2013 ISSN: 2249-1260|eISSN: 2250-1819
significant difference in both pre-merger announcement and post-merger announcement. It is
tested at 5% level of significant.
Similarly, abnormal return has been computed for Infosys Ltd it shows that
pre-merger and post-merger announcements shows a positive performance on share price of
0.0322 and 0.0321. T-statistics was performed to measure the significant difference, during
the study period, pre-merger announcement shows a value of 0.0548 and post-merger
announcement had shown a value of 0.1232. The Company found significant difference in
both pre-merger announcement and post-merger announcement. It is tested at 5% level of
significant.
Similarly, abnormal return has been computed for Rain Commodities Ltd it shows
that pre-merger and post-merger announcements shows a negative performance on share
price of -0.9074 and -0.0045. T-statistics was performed to measure the significant
difference, during the study period, pre-merger announcement shows a value of 0.0888 and
post-merger announcement had shown a value of 0.0915. The Company found significant
difference in both pre-merger announcement and post-merger announcement. It is tested at
5% level of significant.
Similarly, abnormal return has been computed for Cipla Ltd it shows that
pre-merger and post-merger announcements shows a positive performance of share price of
0.2017 and 0.2636. T-statistics was performed to measure the significant difference, during
the study period, pre-merger announcement shows a value of 0.3536 and post-merger
announcement had shown a value of 0.1345. The Company found significant difference in
both pre-merger announcement and post-merger announcement. It is tested at 5% level of
significant.
Similarly, abnormal return has been computed for Oil & Natural Gas Corp Ltd it
shows that pre-merger and post-merger announcements shows a positive performance of
share price of 0.0351 and -0.1162. T-statistics was performed to measure the significant
difference, during the study period, pre-merger announcement shows a value of 0.0604 and
post-merger announcement had shown a value of 0.0760. The Company found significant
difference in both pre-merger announcement and post-merger announcement. It is tested at
5% level of significant.
6. CONCLUSION
This paper examines the announcement effects of merger and acquisition
announceemnt on the selected scrip‘s during the period January 2012 to December 2012. An
event study is conducted using a 7 days event window. There is a significant impact with
respect to Merger announcement on the acquiring company. Merger announcement have
given impact during post-merger announcement period compared with pre-merger
announcement period.
7. REFERENCES
[1] http://www.nseindia.com/qresann/compres.asp
[2] White R.W.and Lusztig P.A., ―The Price Effects of Right Offering: Journal of
Financial and Quantitative Analysis‖( 1980) .
[3] Kalle Rinne and Matti J. Suominen, ―A Behavioral Theory of Public and Rights
Offerings‖:Empirical Evidence from Europe (Feb28,2007),
http://ssrn.com/abstract=966156
[4] Raste, Deepak R.Chari and Vijaylaxmi, ―Regulatory impact: a case study of right
issues in emerging capital market of India‖ (17 Jan, 2010)

37 | Journal of Management and Science | Vol.3.No.3 | September 2013 ISSN: 2249-1260|eISSN: 2250-1819
[5] Lukose jiji PJ and Rao S Narayan , ―Operating Performance of Firms Issuing Equity
through Right offer‖, VIKALPA • VOLUME 28 • NO 4 • OCTOBER - DECEMBER
2003
[6] http:// www.money.sulekha.com/bse-right-share-announcement
[7] http://www.freemba.in/articlesread.php?artcode=454&substcode=27&stcode=10 .
http://www.svtuition.org/2010/10/right-shares.html
*****

38 | Journal of Management and Science | Vol.3.No.3 | September 2013 ISSN: 2249-1260|eISSN: 2250-1819
Empirical Evidence of Television Advertising
Effectiveness on Selected Brands of Cellular Phones
Saumendra Dasa and Kusumuru Vijaya Kumar
b
a Assistant Professor, MBA Department, Aditya Institute of Technology & Management, K.
Kotturu, Tekkali, Srikakulam Dist, Andhra Pradesh-532201, India
Email Id: [email protected] b Student of 2
nd MBA, MBA Department, Aditya Institute of Technology & Management, K.
Kotturu, Tekkali, Srikakulam Dist, Andhra Pradesh-532201, India
Email Id: [email protected]
ABSTRACT: Every day we are watching enumerable advertisements in different media
whether in television or newspaper. Watching advertisements became the part of our lifestyle
to select any categories of product or any type of brand. In this regard advertisements played
a vital role to inform, persuade and remind us on a product. The types of advertisements in
different media with specific location are attracting us to select a particular brand. Thus
advertising is not only giving us the information but also pulling us to purchase the products.
Almost each and every brand of products are associated with advertisements whether a
consumer durable or non durable products. It depends on the market capabilities and also
with customer demand. Basing on the demand, the company use to select the market as well
creates the need and expectation of consumers. Today cellular phone marketing has become
the bandwagon of popular media of reaching the target audience. The cellular phone
subscribers in the developed world has already reached saturation point with at least one cell
phone subscription per person. All these progress is due to the advertising effectiveness in
different media which reveals the growth of telecom sector as well as the penetration of
brand. In this article the researcher tried to emphasise the effectiveness of television
advertising with a particular brand of cell phone subscription and presented it in an
empirical manner by the help of tables.
KEY WORDS: Advertising Effectiveness, Brand And Branding, Positioning, Media,
Television, TRAI etc.
1. INTRODUCTION: Every day we are watching enumerable advertisements in different
media whether in television or newspaper. Watching advertisements became the part of our
lifestyle to select any categories of product or any type of brand. In this regard advertisements
played a vital role to inform, persuade and remind us on a product. The types of
advertisements in different media with specific location are attracting us to select a particular
brand. Thus advertising is not only giving us the information but also pulling us to purchase
the products. Almost each and every brand of products are associated with advertisements
whether a consumer durable or non durable products. It depends on the market capabilities
and also with customer demand. Basing on the demand, the company use to select the market
as well creates the need and expectation of consumers. Today cellular phone marketing has
become the bandwagon of popular media of reaching the
target audience. The cellular phone subscribers in the developed world has already reached
saturation point with at least one cell phone subscription per person. According to Informatics
Research, market growth is being driven by demand from developing countries like China
and India led by rapid cellular phone adoption already reached 5.9 billion by 2013. Telecom
Regulatory Authority of India (TRAI) has revealed that the country's cell phone subscriber

39 | Journal of Management and Science | Vol.3.No.3 | September 2013 ISSN: 2249-1260|eISSN: 2250-1819
base has increased from 893.84 million in December 2011 to 903.73 million in January 2012.
Telecom operators added 9.88 million cell phone subscribers in January 2012 where total
wireless subscriber base increased from 929.37 million in May2012 to 934.09 million at the
end of June 2012, registering a growth of 0.51% (Menon & Ghule, 2012).
Research indicated that India is the fastest growing cell phone market in the world. The
number of telephone subscriber base in the country reached 671.69 million as on June 30,
2010 from 653.92 million in May 2010, as per the Telecom Regulatory Authority of India
(TRAI). According to the latest survey by Voice and Data, Cyber Media group journal,
Bharti Airtel declared as India's top mobile phone operator in 2009-10 and captured around
185.92 million people by September 2012. These all progress is due to the advertising
effectiveness in different media which reveals the growth of telecom sector as well as the
penetration of brand. According to recent information the growth of cell phone subscription is
a way of demand created by the advertising effectiveness of the particular brand; it may be
television or newspaper. Therefore the researcher gathered the information from the customer
database and interpreted for suitable result.
2. SCOPE OF THE STUDY: According to the TRAI report of February 2013, Indian
telecom sector have emerged as a most dynamic and fast pace industries with 892.02 million
subscribers including 544.86 million in urban and 347.16 million in rural areas. It is fast
forward with a growth of 898.02 million in the month of March also which covered 87%
private firms and only 12% government sectors. At present Bharati Airtel dominated 21.69%
of market share in Indian telecom sector which has 20.58% in 2012. It is all due to the
privatization of telecom sector in India. The dominance of private sector and their marketing
strategies reveals that the service and the advertising effectiveness worked in a beautiful
manner. In terms of making the customers more aware about the product the companies are
investing more money on advertisements. As per TAM report, the advertisement expenditure
was 279 billion INR in 2011 and expected to grow 449 billion INR in 2016. Among all media
television is having 14.7% of growth in 2012 to 2016. Particularly, cell phone service sector
advertisement is having 3% of market share in television. However to find out the relevancy
of advertising effectiveness with a brand selection the researcher collected the secondary
information and implemented in the primary investigation.
3. OBJECTIVE OF THE STUDY:
To know the present position of telecom sector in India.
To study the market share of different telecom companies in India.
To study the advertising effectiveness of different media.
To find out the gap between advertising effectiveness of a brand and its penetration
in the local market.
4. LITERATURE REVIEW: Advertising as any paid form of non-personal presentation
and promotion of ideas, goods, or services through mass media such as newspaper, magazine,
television or radio by an identified sponsor (Kotlar, Armstrong, Sounder and Wong, 2009).
Advertising, in its non-commercial guise, is a powerful tool capable of reaching and
motivating large audiences. Although advertising justifies its existence when used in the
public interest, it is much too powerful a tool to use solely for commercial purposes (by
David Ogilvy a prominent author of advertising). Therefore advertising is any form of non-
personal presentation of ideas, goods, or services by the use of mass communication through
advertising media such as print, broadcast, cinema, outdoor, or electronic media (Czinkota &
Ronkainen, 2001).
4.1 Media Market: The Indian media industry is growing faster with revenues of about 805
billion INR (17.2 billion USD) in 2011, is set to grow robustly over the next few years. The
industry revenues are expected to reach 1,764 billion INR (37.6 billion USD) by 2016, with a
CAGR of about 17% from 2012 to 2016. Currently, India is only the 14th largest media
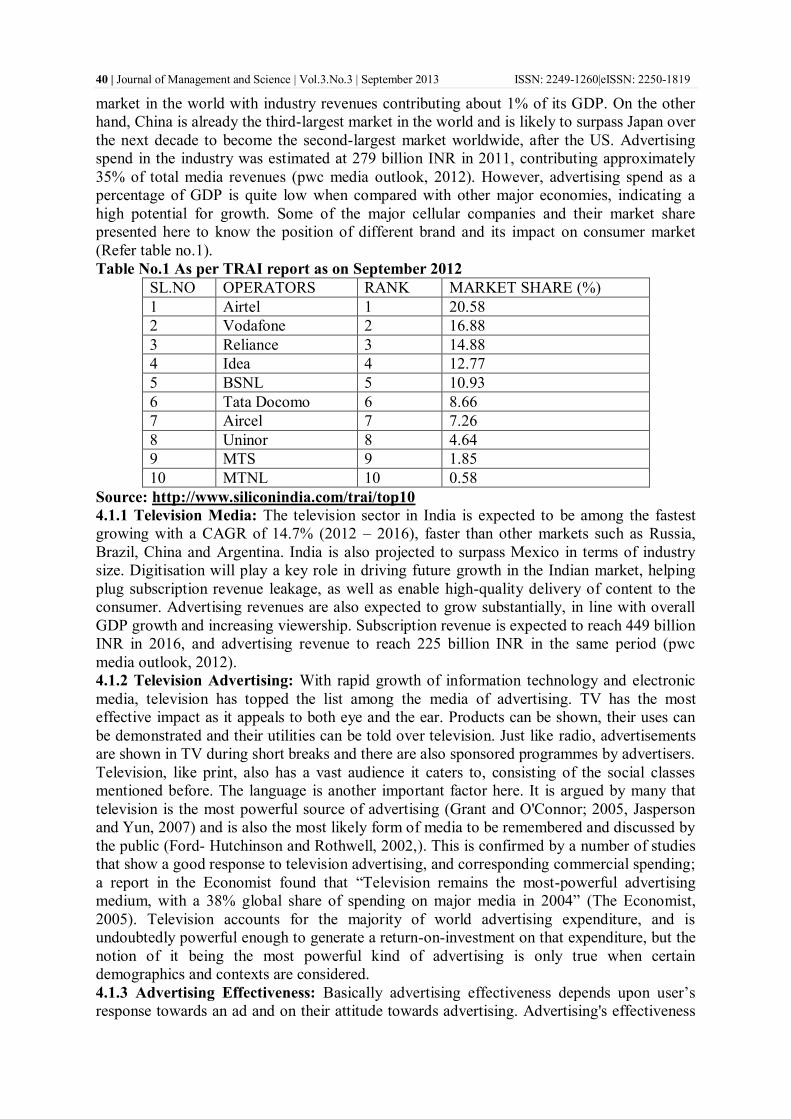
40 | Journal of Management and Science | Vol.3.No.3 | September 2013 ISSN: 2249-1260|eISSN: 2250-1819
market in the world with industry revenues contributing about 1% of its GDP. On the other
hand, China is already the third-largest market in the world and is likely to surpass Japan over
the next decade to become the second-largest market worldwide, after the US. Advertising
spend in the industry was estimated at 279 billion INR in 2011, contributing approximately
35% of total media revenues (pwc media outlook, 2012). However, advertising spend as a
percentage of GDP is quite low when compared with other major economies, indicating a
high potential for growth. Some of the major cellular companies and their market share
presented here to know the position of different brand and its impact on consumer market
(Refer table no.1).
Table No.1 As per TRAI report as on September 2012
SL.NO OPERATORS RANK MARKET SHARE (%)
1 Airtel 1 20.58
2 Vodafone 2 16.88
3 Reliance 3 14.88
4 Idea 4 12.77
5 BSNL 5 10.93
6 Tata Docomo 6 8.66
7 Aircel 7 7.26
8 Uninor 8 4.64
9 MTS 9 1.85
10 MTNL 10 0.58
Source: http://www.siliconindia.com/trai/top10
4.1.1 Television Media: The television sector in India is expected to be among the fastest
growing with a CAGR of 14.7% (2012 – 2016), faster than other markets such as Russia,
Brazil, China and Argentina. India is also projected to surpass Mexico in terms of industry
size. Digitisation will play a key role in driving future growth in the Indian market, helping
plug subscription revenue leakage, as well as enable high-quality delivery of content to the
consumer. Advertising revenues are also expected to grow substantially, in line with overall
GDP growth and increasing viewership. Subscription revenue is expected to reach 449 billion
INR in 2016, and advertising revenue to reach 225 billion INR in the same period (pwc
media outlook, 2012).
4.1.2 Television Advertising: With rapid growth of information technology and electronic
media, television has topped the list among the media of advertising. TV has the most
effective impact as it appeals to both eye and the ear. Products can be shown, their uses can
be demonstrated and their utilities can be told over television. Just like radio, advertisements
are shown in TV during short breaks and there are also sponsored programmes by advertisers.
Television, like print, also has a vast audience it caters to, consisting of the social classes
mentioned before. The language is another important factor here. It is argued by many that
television is the most powerful source of advertising (Grant and O'Connor; 2005, Jasperson
and Yun, 2007) and is also the most likely form of media to be remembered and discussed by
the public (Ford- Hutchinson and Rothwell, 2002,). This is confirmed by a number of studies
that show a good response to television advertising, and corresponding commercial spending;
a report in the Economist found that ―Television remains the most-powerful advertising
medium, with a 38% global share of spending on major media in 2004‖ (The Economist,
2005). Television accounts for the majority of world advertising expenditure, and is
undoubtedly powerful enough to generate a return-on-investment on that expenditure, but the
notion of it being the most powerful kind of advertising is only true when certain
demographics and contexts are considered.
4.1.3 Advertising Effectiveness: Basically advertising effectiveness depends upon user‘s
response towards an ad and on their attitude towards advertising. Advertising's effectiveness
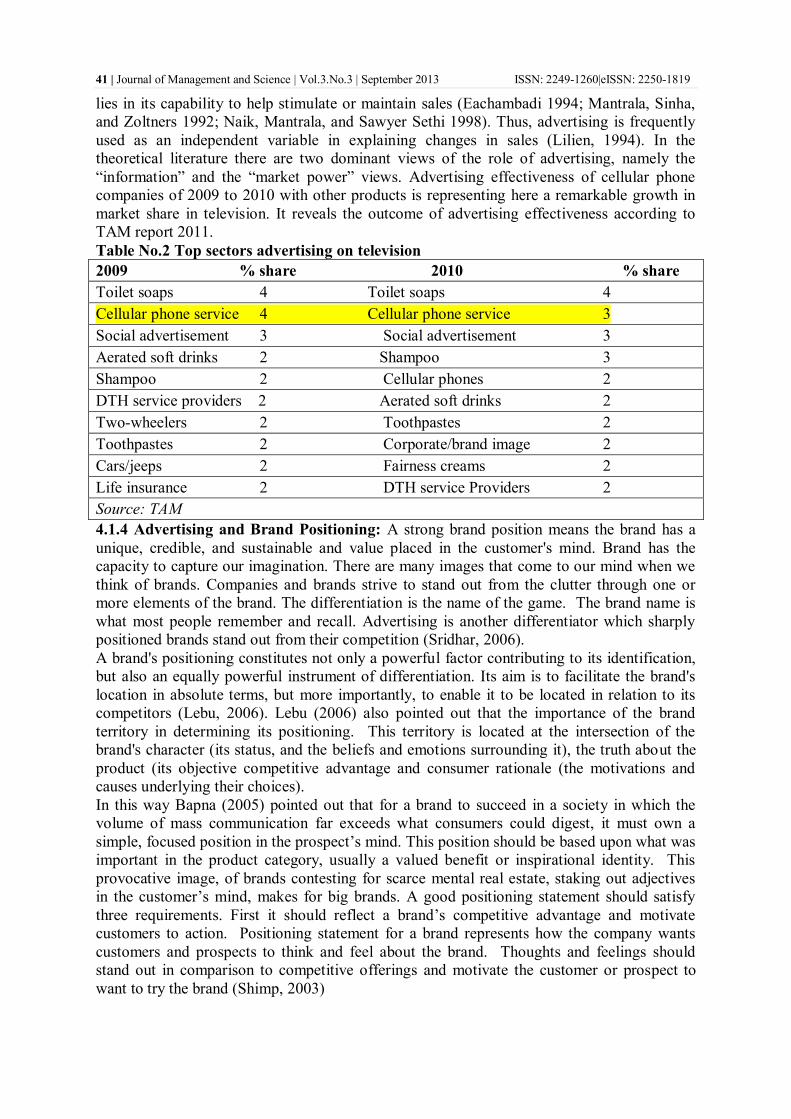
41 | Journal of Management and Science | Vol.3.No.3 | September 2013 ISSN: 2249-1260|eISSN: 2250-1819
lies in its capability to help stimulate or maintain sales (Eachambadi 1994; Mantrala, Sinha,
and Zoltners 1992; Naik, Mantrala, and Sawyer Sethi 1998). Thus, advertising is frequently
used as an independent variable in explaining changes in sales (Lilien, 1994). In the
theoretical literature there are two dominant views of the role of advertising, namely the
―information‖ and the ―market power‖ views. Advertising effectiveness of cellular phone
companies of 2009 to 2010 with other products is representing here a remarkable growth in
market share in television. It reveals the outcome of advertising effectiveness according to
TAM report 2011.
Table No.2 Top sectors advertising on television
2009 % share 2010 % share
Toilet soaps 4 Toilet soaps 4
Cellular phone service 4 Cellular phone service 3
Social advertisement 3 Social advertisement 3
Aerated soft drinks 2 Shampoo 3
Shampoo 2 Cellular phones 2
DTH service providers 2 Aerated soft drinks 2
Two-wheelers 2 Toothpastes 2
Toothpastes 2 Corporate/brand image 2
Cars/jeeps 2 Fairness creams 2
Life insurance 2 DTH service Providers 2
Source: TAM
4.1.4 Advertising and Brand Positioning: A strong brand position means the brand has a
unique, credible, and sustainable and value placed in the customer's mind. Brand has the
capacity to capture our imagination. There are many images that come to our mind when we
think of brands. Companies and brands strive to stand out from the clutter through one or
more elements of the brand. The differentiation is the name of the game. The brand name is
what most people remember and recall. Advertising is another differentiator which sharply
positioned brands stand out from their competition (Sridhar, 2006).
A brand's positioning constitutes not only a powerful factor contributing to its identification,
but also an equally powerful instrument of differentiation. Its aim is to facilitate the brand's
location in absolute terms, but more importantly, to enable it to be located in relation to its
competitors (Lebu, 2006). Lebu (2006) also pointed out that the importance of the brand
territory in determining its positioning. This territory is located at the intersection of the
brand's character (its status, and the beliefs and emotions surrounding it), the truth about the
product (its objective competitive advantage and consumer rationale (the motivations and
causes underlying their choices).
In this way Bapna (2005) pointed out that for a brand to succeed in a society in which the
volume of mass communication far exceeds what consumers could digest, it must own a
simple, focused position in the prospect‘s mind. This position should be based upon what was
important in the product category, usually a valued benefit or inspirational identity. This
provocative image, of brands contesting for scarce mental real estate, staking out adjectives
in the customer‘s mind, makes for big brands. A good positioning statement should satisfy
three requirements. First it should reflect a brand‘s competitive advantage and motivate
customers to action. Positioning statement for a brand represents how the company wants
customers and prospects to think and feel about the brand. Thoughts and feelings should
stand out in comparison to competitive offerings and motivate the customer or prospect to
want to try the brand (Shimp, 2003)

42 | Journal of Management and Science | Vol.3.No.3 | September 2013 ISSN: 2249-1260|eISSN: 2250-1819
In the context of the dynamics of the particular marketplace, the positioning of other brands
and forecasts of likely directions for the market, the brand manager and the agency have to
construct the future scenario and the required values for their brand to achieve increased
competitive advantage (Pringles, 2004). In this context the role of advertising and marketing
communications usually acts for a brand in one of three main ways: launch, reinforcement or
repositioning.
The first of these opportunities to consider is in actually launching the brand in the first place.
Here the use of a celebrity can be particularly powerful, especially if the brand is establishing
a new category where customers need the reassurance and leadership an appropriate star can
give them.
The second way in which advertising can be very effective is in maintaining and reinforcing a
brand‘s competitive position in the marketplace. Again the use of celebrity can be very
effective in this instance, especially if other brands have entered the marketplace and have
changed its dynamics.
The third way in which advertising can work for a brand is in repositioning it in the context
where market development and the maturing in the evolving of customer taste have created
greater potential in a different sector of the market than the one in which the brand is
currently positioned. An appropriate celebrity can be used as the focus of the brand
communications and as a signal to customers that it‘s positioning is changing to suit a new
and perhaps emerging target audience (Pringles, 2004). Particularly for selecting a best brand
of cell subscription customer often look at the position of the company in local market as well
as the connectivity and also they may consider the price. Therefore the best valued brand will
always position i the mind set of customers which has already mentioned in TAM report.
5. RESEARCH METHODOLOGY: The objective of the research is to know the
perception of the customers on a brand which influence in decision making. In this regard the
survey was conducted with a structured questionnaire consisting of 100 samples in Sikakulam
district of Andhra Pradesh. The questions were asked randomly to 100 respondents in
different time according to their convenience and also avoided the bias responses. The
research was prepared with the help of percentage method and made correlation with each
variables. There are 10 research questionnaire correlated with 7 brands and 5 media which
could give perfect result.

43 | Journal of Management and Science | Vol.3.No.3 | September 2013 ISSN: 2249-1260|eISSN: 2250-1819
6. DATA ANALYSIS & INTERPRETATIONS:
R.1. Like to watch different advertisement in different media for selecting a brand
Brand/Media
Ads
News
Paper
Radio Television Outdoor Internet Total
Airtel 6 4 10 10 5 35
Reliance 0 2 2 1 0 5
Idea 3 4 3 2 2 14
Bsnl 4 4 2 5 1 16
Vodafone 2 3 7 3 3 18
Uninor 1 1 3 1 0 6
Tataindicom 0 3 1 1 1 6
Total 16 21 28 23 12 100
Inference: The above table shows that Airtel became the dominated brand in all media which
occupied around 35% of response and as well advertised more in television.
R.2. My brand of mobile is heavily advertised
Brand/Media
Ads
News Paper Radio Television Outdoor Internet Total
Airtel 5 10 5 5 10 35
Reliance 1 1 4 1 1 5
Idea 1 2 4 4 3 14
Bsnl 1 4 6 4 1 16
Vodafone 3 4 5 5 1 18
Uninor 0 1 1 1 3 6
Tataindicom 1 1 2 1 1 6
Total 12 22 24 21 20 100
Inference: The above table shows that Airtel is advertising more on different media out of
which television dominated more percentage.
R.3. Preference of the company that given accurate information on the brand
Brand/Media
Ads
News Paper Radio Television Outdoor Internet Total
Airtel 4 6 12 3 10 35
Reliance 0 2 1 1 1 5
Idea 2 4 4 3 1 14
Bsnl 3 2 3 4 4 16
Vodafone 3 1 4 5 5 18
Uninor 0 2 3 0 1 6
Tataindicom 1 1 1 1 2 6
Total 13 18 28 17 24 100
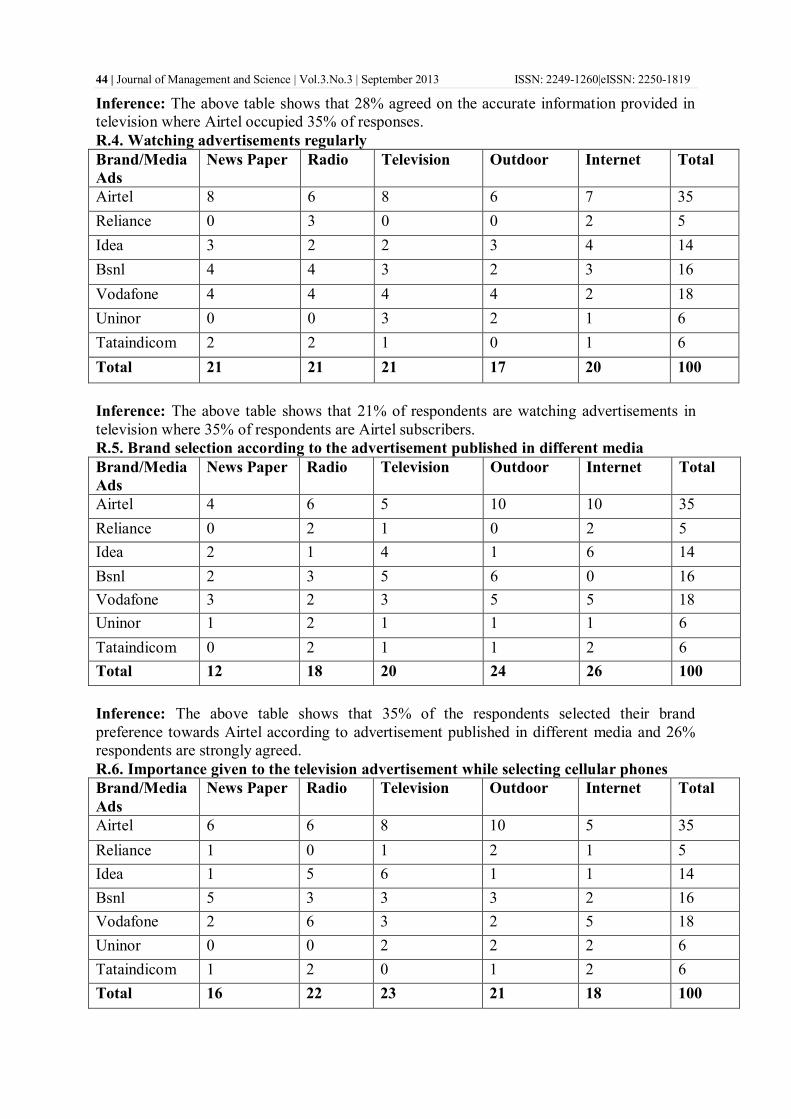
44 | Journal of Management and Science | Vol.3.No.3 | September 2013 ISSN: 2249-1260|eISSN: 2250-1819
Inference: The above table shows that 28% agreed on the accurate information provided in
television where Airtel occupied 35% of responses.
R.4. Watching advertisements regularly
Brand/Media
Ads
News Paper Radio Television Outdoor Internet Total
Airtel 8 6 8 6 7 35
Reliance 0 3 0 0 2 5
Idea 3 2 2 3 4 14
Bsnl 4 4 3 2 3 16
Vodafone 4 4 4 4 2 18
Uninor 0 0 3 2 1 6
Tataindicom 2 2 1 0 1 6
Total 21 21 21 17 20 100
Inference: The above table shows that 21% of respondents are watching advertisements in
television where 35% of respondents are Airtel subscribers.
R.5. Brand selection according to the advertisement published in different media
Brand/Media
Ads
News Paper Radio Television Outdoor Internet Total
Airtel 4 6 5 10 10 35
Reliance 0 2 1 0 2 5
Idea 2 1 4 1 6 14
Bsnl 2 3 5 6 0 16
Vodafone 3 2 3 5 5 18
Uninor 1 2 1 1 1 6
Tataindicom 0 2 1 1 2 6
Total 12 18 20 24 26 100
Inference: The above table shows that 35% of the respondents selected their brand
preference towards Airtel according to advertisement published in different media and 26%
respondents are strongly agreed.
R.6. Importance given to the television advertisement while selecting cellular phones
Brand/Media
Ads
News Paper Radio Television Outdoor Internet Total
Airtel 6 6 8 10 5 35
Reliance 1 0 1 2 1 5
Idea 1 5 6 1 1 14
Bsnl 5 3 3 3 2 16
Vodafone 2 6 3 2 5 18
Uninor 0 0 2 2 2 6
Tataindicom 1 2 0 1 2 6
Total 16 22 23 21 18 100
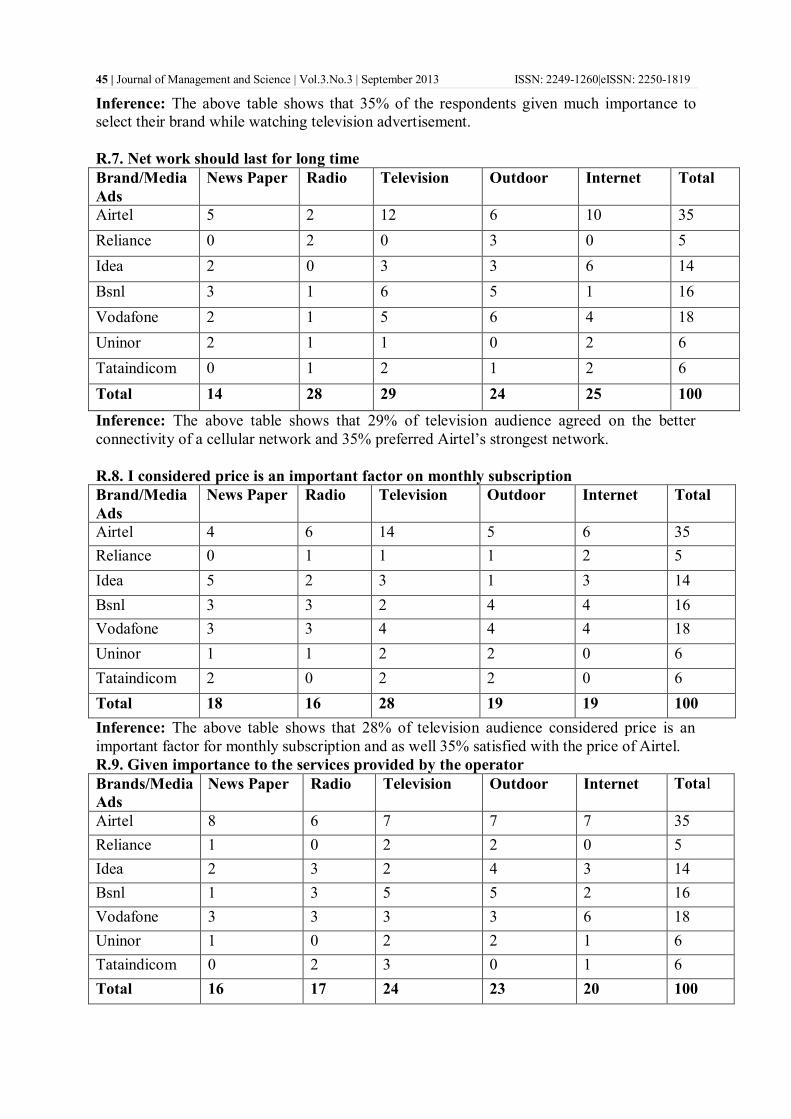
45 | Journal of Management and Science | Vol.3.No.3 | September 2013 ISSN: 2249-1260|eISSN: 2250-1819
Inference: The above table shows that 35% of the respondents given much importance to
select their brand while watching television advertisement.
R.7. Net work should last for long time
Brand/Media
Ads
News Paper Radio Television Outdoor Internet Total
Airtel 5 2 12 6 10 35
Reliance 0 2 0 3 0 5
Idea 2 0 3 3 6 14
Bsnl 3 1 6 5 1 16
Vodafone 2 1 5 6 4 18
Uninor 2 1 1 0 2 6
Tataindicom 0 1 2 1 2 6
Total 14 28 29 24 25 100
Inference: The above table shows that 29% of television audience agreed on the better
connectivity of a cellular network and 35% preferred Airtel‘s strongest network.
R.8. I considered price is an important factor on monthly subscription
Brand/Media
Ads
News Paper Radio Television Outdoor Internet Total
Airtel 4 6 14 5 6 35
Reliance 0 1 1 1 2 5
Idea 5 2 3 1 3 14
Bsnl 3 3 2 4 4 16
Vodafone 3 3 4 4 4 18
Uninor 1 1 2 2 0 6
Tataindicom 2 0 2 2 0 6
Total 18 16 28 19 19 100
Inference: The above table shows that 28% of television audience considered price is an
important factor for monthly subscription and as well 35% satisfied with the price of Airtel.
R.9. Given importance to the services provided by the operator
Brands/Media
Ads
News Paper Radio Television Outdoor Internet Total
Airtel 8 6 7 7 7 35
Reliance 1 0 2 2 0 5
Idea 2 3 2 4 3 14
Bsnl 1 3 5 5 2 16
Vodafone 3 3 3 3 6 18
Uninor 1 0 2 2 1 6
Tataindicom 0 2 3 0 1 6
Total 16 17 24 23 20 100
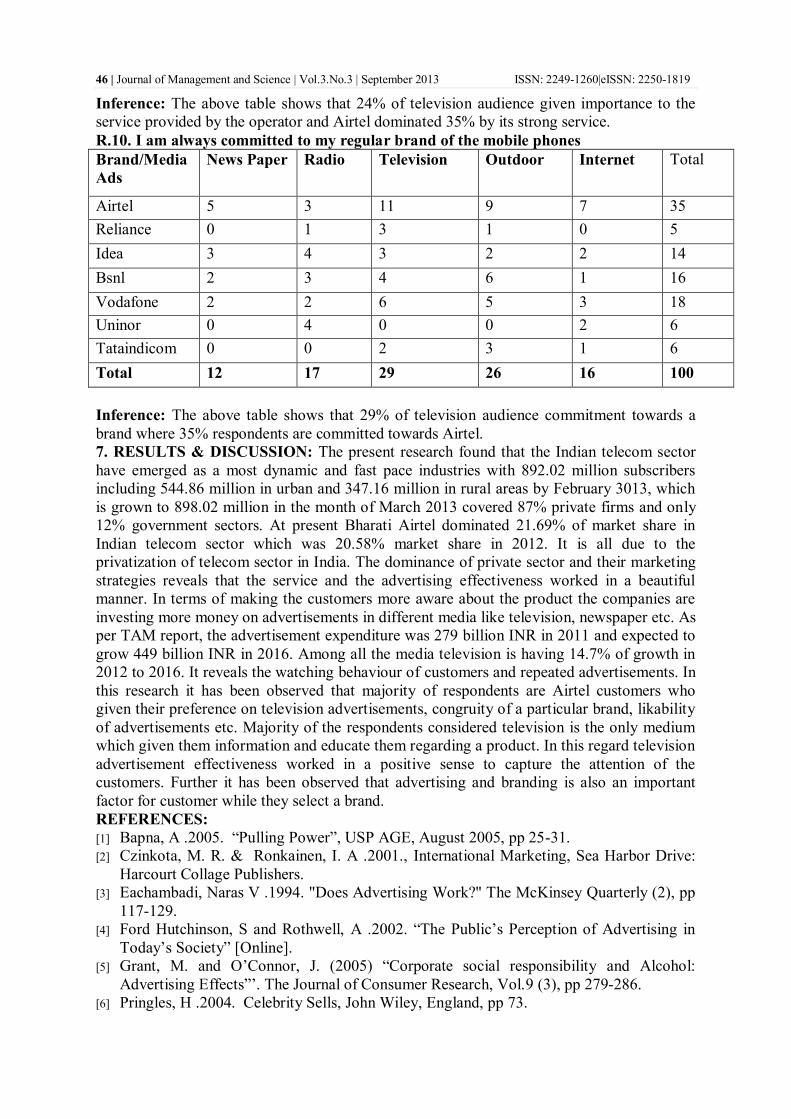
46 | Journal of Management and Science | Vol.3.No.3 | September 2013 ISSN: 2249-1260|eISSN: 2250-1819
Inference: The above table shows that 24% of television audience given importance to the
service provided by the operator and Airtel dominated 35% by its strong service.
R.10. I am always committed to my regular brand of the mobile phones
Brand/Media
Ads
News Paper Radio Television Outdoor Internet Total
Airtel 5 3 11 9 7 35
Reliance 0 1 3 1 0 5
Idea 3 4 3 2 2 14
Bsnl 2 3 4 6 1 16
Vodafone 2 2 6 5 3 18
Uninor 0 4 0 0 2 6
Tataindicom 0 0 2 3 1 6
Total 12 17 29 26 16 100
Inference: The above table shows that 29% of television audience commitment towards a
brand where 35% respondents are committed towards Airtel.
7. RESULTS & DISCUSSION: The present research found that the Indian telecom sector
have emerged as a most dynamic and fast pace industries with 892.02 million subscribers
including 544.86 million in urban and 347.16 million in rural areas by February 3013, which
is grown to 898.02 million in the month of March 2013 covered 87% private firms and only
12% government sectors. At present Bharati Airtel dominated 21.69% of market share in
Indian telecom sector which was 20.58% market share in 2012. It is all due to the
privatization of telecom sector in India. The dominance of private sector and their marketing
strategies reveals that the service and the advertising effectiveness worked in a beautiful
manner. In terms of making the customers more aware about the product the companies are
investing more money on advertisements in different media like television, newspaper etc. As
per TAM report, the advertisement expenditure was 279 billion INR in 2011 and expected to
grow 449 billion INR in 2016. Among all the media television is having 14.7% of growth in
2012 to 2016. It reveals the watching behaviour of customers and repeated advertisements. In
this research it has been observed that majority of respondents are Airtel customers who
given their preference on television advertisements, congruity of a particular brand, likability
of advertisements etc. Majority of the respondents considered television is the only medium
which given them information and educate them regarding a product. In this regard television
advertisement effectiveness worked in a positive sense to capture the attention of the
customers. Further it has been observed that advertising and branding is also an important
factor for customer while they select a brand.
REFERENCES:
[1] Bapna, A .2005. ―Pulling Power‖, USP AGE, August 2005, pp 25-31.
[2] Czinkota, M. R. & Ronkainen, I. A .2001., International Marketing, Sea Harbor Drive:
Harcourt Collage Publishers.
[3] Eachambadi, Naras V .1994. "Does Advertising Work?" The McKinsey Quarterly (2), pp
117-129.
[4] Ford Hutchinson, S and Rothwell, A .2002. ―The Public‘s Perception of Advertising in
Today‘s Society‖ [Online].
[5] Grant, M. and O‘Connor, J. (2005) ―Corporate social responsibility and Alcohol:
Advertising Effects‖‘. The Journal of Consumer Research, Vol.9 (3), pp 279-286.
[6] Pringles, H .2004. Celebrity Sells, John Wiley, England, pp 73.

47 | Journal of Management and Science | Vol.3.No.3 | September 2013 ISSN: 2249-1260|eISSN: 2250-1819
[7] Kotlar, Armstrong, Sounder & Wong .2009. ―Principles of Marketing‖, European Edition,
Financial Times Press, Prentice Hall.
[8] Lebu, J.M .2006. ―Brand Rejuvenation‖, Kogan page, London, pp 46-48.
[9] Li en G.L.1994. ―Marketing Models, Past, Present and Future in Research tradit ions in
Marketing‖ G. Laurenet, G.L. Lilen & B.Pars.,eds., Boston:Kluwar, pp 1-20.
[10] Mantrala M., Naik P and Sawyer .1998. ―A Planning Media Schedules in the Presence of
Dynamic Advertising Quality‖ Marketing Science, Vol.17 (3), pp 214-235.
[11] Mantrala M., Sinha P and Zoltners .1992. ―A Impact of Resource Allocation Rules on
Marketing Investment-Level Decisions and Profitability‖ Journal of Marketing Research,
Vol. 29 (2 ) May, pp 162-175.
[12] Menon, S & Ghule, T. 2012. ―An Overview of Mobile Marketing In India‖ APJEM Arth
Prabhand: A Journal Of Economics And Management, Vol.1 (7), October, pp 23-30.
[13] Sridhar, R .2006. ―A case for internal brand building‖, Brand line- Business line, 21
December.
[14] Terence A. Shimp .2003. ―Advertising and Promotion‖, 6th Edition, Thomson- South
Western, Singapore, p 51.
[15] http://www.pinnaclejournals.com
[16] http://www.trai.org
[17] http://www.pwcworld.com
*****
48 | Journal of Management and Science | Vol.3.No.3 | September 2013 ISSN: 2249-1260|eISSN: 2250-1819
Expiry day Impact on return on Indian Stock market (NSE)-
an Empirical Study
Mr.Krunal K Bhuvaa
and Dr. Vijay H Vyasb
aAssistant Professor at Shri Jaysukhlal Vadhar Institute of Management Studies
“Shri Vallabh Nikunj”, Nilkanth Nagar, Gate No.2, B/h Bombay Dying, Jamnagar -361005,
GUJARAT.
Contact: Mo., 09033675164,Email: , [email protected] bDesignation: Professor at RK University, Email: , [email protected]
ABSTRACT: Derivative products are alleged to have a sharp affect on the stock market in various
ways ever since their inception in June 2000. Currently, derivative trading constitutes
approximately 90% of the total turnover of the NSE (National Stock Exchange). Launching of
derivatives and their expiration (last Thursday of every month) in the Indian stock market has been
perceived to have direct corollary on the return, volatility, efficiency and marketability of the
stock market. This paper tries to analyze empirically the expiration day effect of stock
derivatives on underlying securities. This study tests the presence of the last Thursday of the month
effect on stock market volatility by using the S&P 500 market index during the period of January
2012 and December 2012 and sample companies which are trading on derivative market. The
findings show that the last Thursday of the month effect on stock market volatility is not present in
volatility and return equations.
Keywords: Expiry day, last Thursday impact, derivatives
INTRODUCTION
In India, trading in derivatives started in June 2000 with the launch of futures contracts in the BSE
Sensex and the S&P CNX Nifty Index on the Bombay Stock Exchange (BSE) and National Stock
Exchange (NSE), respectively. Options trading commenced in June 2001 in the Indian market. Since
then, the futures and options (F&O) segment has been growing continuously in terms of new
products, contracts, traded volume and value. At present, the NSE has established itself as the market
leader in this segment in India, with more than 99.5 percent market share (NSE Fact Book, 2006, p.
85). The F&O segment of the NSE outperformed the cash market segment with an average daily
turnover of Rs291.91 billion, as compared to Rs114.79 billion in the cash segment from 2006 to
2007 (Derivatives Updates on NSE website, www.nseindia.com, 2007). This shows the importance
of derivatives in the capital market sector of the economy. Previous studies on the volatility effects
of derivatives listing provide mixed results, suggesting case-based biases. In addition, in India, there
is a lack of robust examination of the impact of derivatives on market volatility. In India, trading in
derivatives contracts has existed for the last six years, which is an adequate time period to evaluate
its major pros and cons. Against this backdrop, it is important to empirically examine the impact of
derivatives on the stock market.
In this paper, we attempt to study the volatility implications of the introduction of derivatives on the
cash market.

49 | Journal of Management and Science | Vol.3.No.3 | September 2013 ISSN: 2249-1260|eISSN: 2250-1819
LITERATURE REVIEWS
Literature that shows the impact of expiration day of derivatives (financial) on stock market to
international market is as follows:
Rahman (2001) examined the impact of index futures trading on the volatility of component stocks
for the Dow Jones Industrial Average (DJIA). The study used a simple GARCH (1, 1) model to
estimate the conditional volatility of intra-day returns. The empirical results confirm that there is no
change in conditional volatility from pre- to post-futures periods. Figuerola-Ferretti and Gilbert
(2001) used error-correction models and the GARCH (1, 1) regression model to study the effect of
futures trading on volatility. In addition, they reported the results of a VAR model and presented an
impulse response analysis to track the effects of a shock to each of the volatilities. The results show
that volatility decreases in the post-futures period. Bologna and Cavallo (2002) examined the effect
of the introduction of stock index futures for the Italian market. Their empirical results show that the
introduction of stock index futures affects the volatility of the spot market. In addition, the results
from various GARCH (1, 1) models for pre-futures and post-futures sub-periods suggest that the
index futures market reduces volatility.
Chow Y.F., Yung H.M. and Zhang H (2003) observed the impact of the expiration of HSI
(Hang Seng Index) derivatives on the underlying cash market in Hong Kong for the period from
1990 to 1999. The study used an alternative setting for testing the expiration day and concluded
that expiration days in Hong Kong might be associated with a negative price effect and some
return volatility on the underlying stock market. But there was no evidence of the abnormal
trading volume on the expiration day or price reversal after expiration. Hence, the existence
of expiration-day effects could not be confirmed in the Hong Kong market.
Lien D and Yang L (2005) compared the expiration-day impact of the stock options traded
on Australian Stock Exchange on return, volatility, trading volume, and temporary price changes
of individual stocks with settlement method of individual stock futures contracts. The period
of study was from 1993 to 1997. The study concluded that the options expiration has
significant impact on return and volatility of the underlying stocks in absence of individual stock
futures. After introduction of a cash-settled stock future contract, the effect decrease notably.
And then the switch of a futures contract from cash settlement to physical delivery promotes the
expiration effects on return and volatility and boosts temporary price change on expiration days.
Finally, the study concluded that options expiration has little effect on trading volume.
Chou HC, Chen NW, Chen HD (2006) examined the expiration effects of TAIFEX index
derivative on the underlying stock market between 1998 and 2002. The empirical findings
showed no significant expiration day effect, but concluded that expiration effect has strengthened as
more relative index derivatives are listed on the TAIFEX. In general, the research concluded that
the expiration effects in Taiwan are not as significant as those in U.S. market but are stronger
than those in the Hong Kong market. The special settlement procedures adopted by the
TAIFEX may account for the difference.
Drimbetas, Nikolaos and Porfiris (2007) explored the effects of the introduction of futures and
options into the FTSE/ASE 20 Index on the volatility of the underlying index using an EGARCH
model. It is shown that the introduction of derivatives induces a reduction of conditional volatility in
the FTSE/ASE20 Index and consequently increases its efficiency. Mallikarjunappa and Afsal (2007)
studied the volatility behaviour of the Indian market by focusing on the CNX IT Index, which is a
sectoral index, and found that underlying volatility increases with the onset of futures trading. Their
result contradict many other studies carried out in India, and it is reasoned that the sectoral index
showed different behaviour in terms of returns and volatility, especially during the 2001 period of
market scam in India. They attributed these results to a sharp decrease in the prices of IT stocks after
the stock market scam broke out in 2001. Since the sectoral index showed different results than those

50 | Journal of Management and Science | Vol.3.No.3 | September 2013 ISSN: 2249-1260|eISSN: 2250-1819
of earlier studies, these results must be examined as to whether they hold for the Indian market when
a broader market index is studied. Their study also pointed out that results depend on the time period
as well as the country studied. These results indicate the needed scope for further research as well as
suggest the relevance of different samples and methodologies.
Studies given below shows previous researches on expiration effect of derivatives on Indian Stock
Market:
Vipul (2005) examined the future and option expiration effect on selected 14 stocks of
Indian capital market. The study compared the price, volatility, and volume of the underlying
shares in the cash market one day prior to expiration, on the day of expiration and one day after
expiration with the corresponding values of these variables one week and two weeks prior to the
expiration days by using the Wilcoxon matched-pairs signed-ranks test. It was found that prices
in the cash market were depressed a day before the expiration on the derivative contracts, but
got strengthened significantly the day after the expiration.
Jindal and Bodla (2007) analyzed the effect of expiration of stock derivatives on the
volatility and marketability of Indian stock market as well as the underlying individual stocks.
The results presented that the expiration days of financial derivative witnessed an abnormally
high volume trading which was attributed to arbitrage activities in the market. This clearly
shows that expiration day results into high volatility in the stock market.
Bhaumik Sumon and Bose Suchismita (2007) analyzed the impact of expiration of
derivative contracts on the underlying cash market, trading volume, and volatility of returns. The
tool used for analysis was AR-GARCH. The study concluded that trading volume were
significantly higher on expiration days and during the five days leading up to expiration days
(―expiration weeks‖), compared with non expiration days (weeks). The study also showed that
expiration day has a significant effect on daily returns of market index and their volatility.
Wats Sangeeta (2010) examined the impact of expiration of spot market volatility using NSE Nifty
as market proxy. The study indicated that due to the introduction of future and option, the spot
market volatility has increased on the expiration days and expiration weeks. The study also
concluded that expiration week effect on volatility of the spot market is more predominant than
expiration day effect.
Shembagaraman (2003) explored the impact of the introduction of derivative trading on cash
market volatility using data on stock index futures and options contracts traded on the Nifty Index.
The results suggest that futures and options trading has not led to a change in the volatility of the
underlying stock index, but the nature of volatility seems to have changed in the post-futures market.
The study also examined whether greater futures trading activity in terms of volume and open
interest was associated with greater spot market volatility. It found no evidence of any link between
trading activity variables in the futures market and spot market volatility.
RESEARCH METHODOLOGY:
Expiration day effect of derivatives on the returns of the underlying stocks:
To analyze the expiration day effect on the returns of the underlying securities event study
methodology has been adopted. The event in this case is defined as expiration of stock derivatives.
Data for the share prices has been collected from the official website of National Stock Exchange
(www.nseindia.com). For calculation purposes the following steps has been followed:
The actual returns for individual securities and S&P CNX NIFTY have been calculated for
estimation window. The following formulas have been used for this purpose:
R t = (Pt-Pt-1)/Pt-1 (i)
R nifty = (It- It-1)/ It-1 (ii)
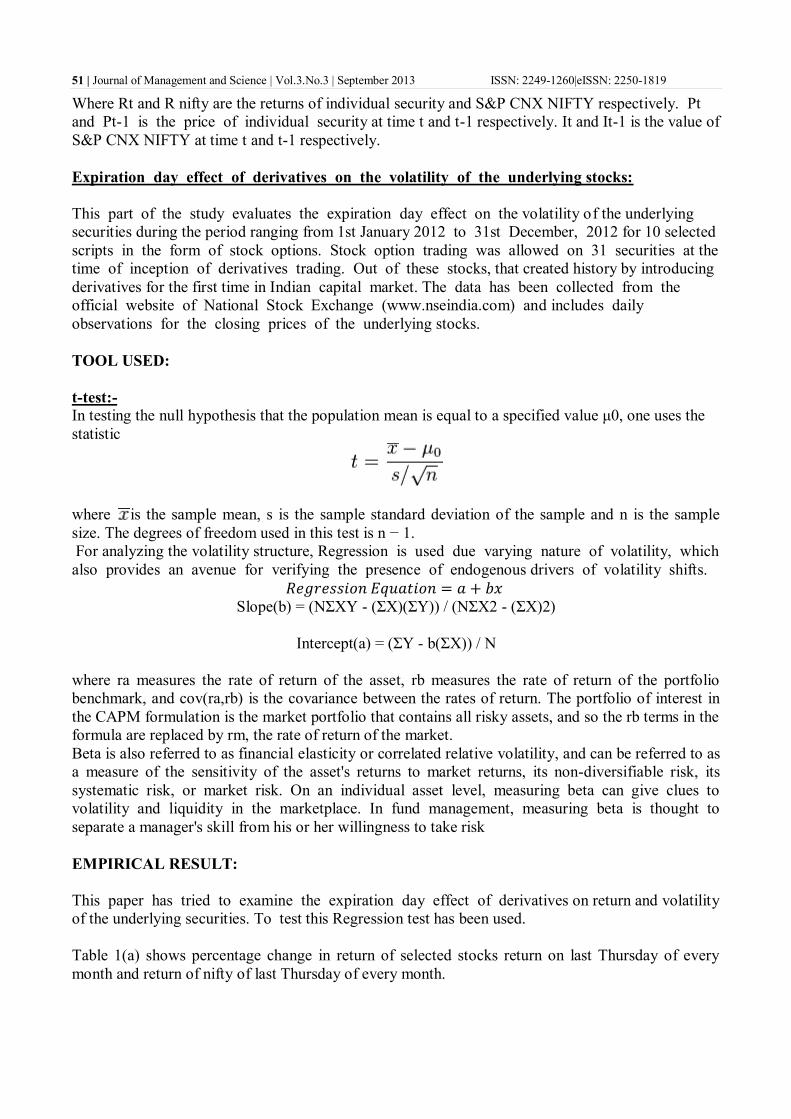
51 | Journal of Management and Science | Vol.3.No.3 | September 2013 ISSN: 2249-1260|eISSN: 2250-1819
Where Rt and R nifty are the returns of individual security and S&P CNX NIFTY respectively. Pt
and Pt-1 is the price of individual security at time t and t-1 respectively. It and It-1 is the value of
S&P CNX NIFTY at time t and t-1 respectively.
Expiration day effect of derivatives on the volatility of the underlying stocks:
This part of the study evaluates the expiration day effect on the volatility of the underlying
securities during the period ranging from 1st January 2012 to 31st December, 2012 for 10 selected
scripts in the form of stock options. Stock option trading was allowed on 31 securities at the
time of inception of derivatives trading. Out of these stocks, that created history by introducing
derivatives for the first time in Indian capital market. The data has been collected from the
official website of National Stock Exchange (www.nseindia.com) and includes daily
observations for the closing prices of the underlying stocks.
TOOL USED:
t-test:-
In testing the null hypothesis that the population mean is equal to a specified value μ0, one uses the
statistic
where is the sample mean, s is the sample standard deviation of the sample and n is the sample
size. The degrees of freedom used in this test is n − 1.
For analyzing the volatility structure, Regression is used due varying nature of volatility, which
also provides an avenue for verifying the presence of endogenous drivers of volatility shifts.
𝑅𝑒𝑔𝑟𝑒𝑠𝑠𝑖𝑜𝑛 𝐸𝑞𝑢𝑎𝑡𝑖𝑜𝑛 = 𝑎 + 𝑏𝑥 Slope(b) = (NΣXY - (ΣX)(ΣY)) / (NΣX2 - (ΣX)2)
Intercept(a) = (ΣY - b(ΣX)) / N
where ra measures the rate of return of the asset, rb measures the rate of return of the portfolio
benchmark, and cov(ra,rb) is the covariance between the rates of return. The portfolio of interest in
the CAPM formulation is the market portfolio that contains all risky assets, and so the rb terms in the
formula are replaced by rm, the rate of return of the market.
Beta is also referred to as financial elasticity or correlated relative volatility, and can be referred to as
a measure of the sensitivity of the asset's returns to market returns, its non-diversifiable risk, its
systematic risk, or market risk. On an individual asset level, measuring beta can give clues to
volatility and liquidity in the marketplace. In fund management, measuring beta is thought to
separate a manager's skill from his or her willingness to take risk
EMPIRICAL RESULT:
This paper has tried to examine the expiration day effect of derivatives on return and volatility
of the underlying securities. To test this Regression test has been used.
Table 1(a) shows percentage change in return of selected stocks return on last Thursday of every
month and return of nifty of last Thursday of every month.
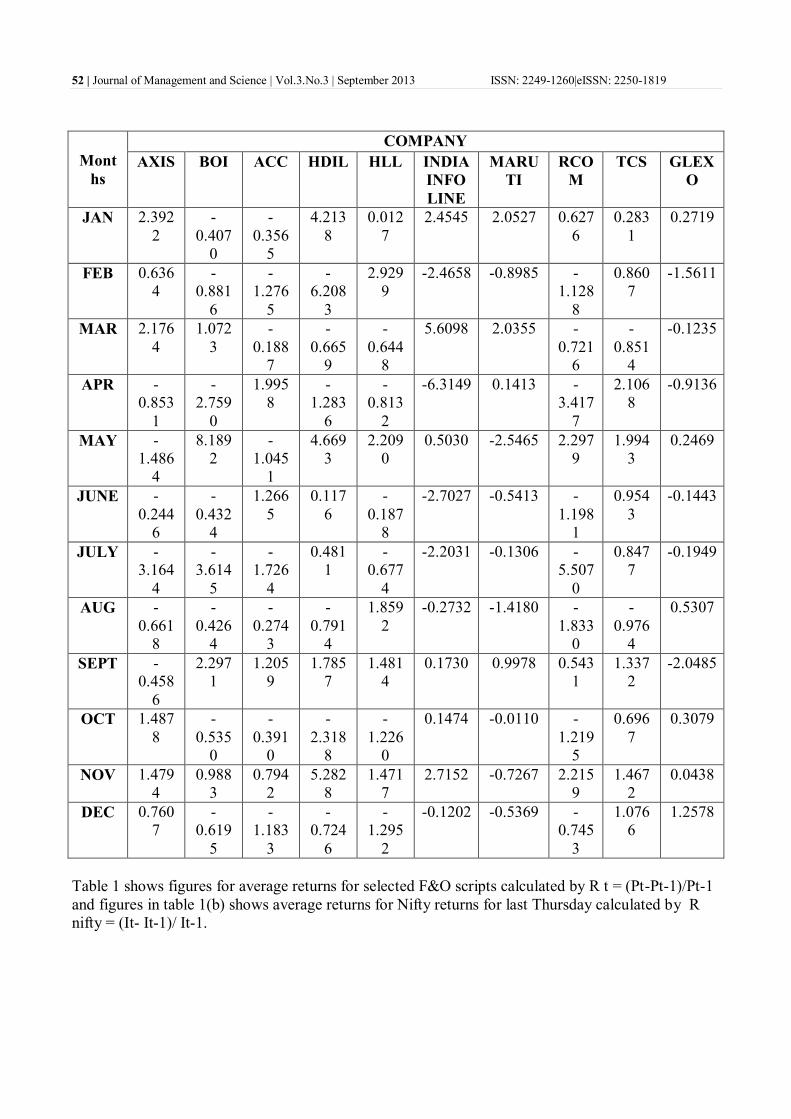
52 | Journal of Management and Science | Vol.3.No.3 | September 2013 ISSN: 2249-1260|eISSN: 2250-1819
Mont
hs
COMPANY
AXIS BOI ACC HDIL HLL INDIA
INFO
LINE
MARU
TI
RCO
M
TCS GLEX
O
JAN 2.392
2
-
0.407
0
-
0.356
5
4.213
8
0.012
7
2.4545 2.0527 0.627
6
0.283
1
0.2719
FEB 0.636
4
-
0.881
6
-
1.276
5
-
6.208
3
2.929
9
-2.4658 -0.8985 -
1.128
8
0.860
7
-1.5611
MAR 2.176
4
1.072
3
-
0.188
7
-
0.665
9
-
0.644
8
5.6098 2.0355 -
0.721
6
-
0.851
4
-0.1235
APR -
0.853
1
-
2.759
0
1.995
8
-
1.283
6
-
0.813
2
-6.3149 0.1413 -
3.417
7
2.106
8
-0.9136
MAY -
1.486
4
8.189
2
-
1.045
1
4.669
3
2.209
0
0.5030 -2.5465 2.297
9
1.994
3
0.2469
JUNE -
0.244
6
-
0.432
4
1.266
5
0.117
6
-
0.187
8
-2.7027 -0.5413 -
1.198
1
0.954
3
-0.1443
JULY -
3.164
4
-
3.614
5
-
1.726
4
0.481
1
-
0.677
4
-2.2031 -0.1306 -
5.507
0
0.847
7
-0.1949
AUG -
0.661
8
-
0.426
4
-
0.274
3
-
0.791
4
1.859
2
-0.2732 -1.4180 -
1.833
0
-
0.976
4
0.5307
SEPT -
0.458
6
2.297
1
1.205
9
1.785
7
1.481
4
0.1730 0.9978 0.543
1
1.337
2
-2.0485
OCT 1.487
8
-
0.535
0
-
0.391
0
-
2.318
8
-
1.226
0
0.1474 -0.0110 -
1.219
5
0.696
7
0.3079
NOV 1.479
4
0.988
3
0.794
2
5.282
8
1.471
7
2.7152 -0.7267 2.215
9
1.467
2
0.0438
DEC 0.760
7
-
0.619
5
-
1.183
3
-
0.724
6
-
1.295
2
-0.1202 -0.5369 -
0.745
3
1.076
6
1.2578
Table 1 shows figures for average returns for selected F&O scripts calculated by R t = (Pt-Pt-1)/Pt-1
and figures in table 1(b) shows average returns for Nifty returns for last Thursday calculated by R
nifty = (It- It-1)/ It-1.

53 | Journal of Management and Science | Vol.3.No.3 | September 2013 ISSN: 2249-1260|eISSN: 2250-1819
Table 2 Analyzing the Expiration Day Effect of Stock Derivatives on the Volatility of the
Underlying Securities
Company Regression
AXIS 0.187005413
BANK OF INDIA 0.397788964
ACC 0.000910665
HDIL 0.283723073
HINUDSTAN
LEVER 0.019167668
INDIA
INFOLINE 0.437000521
MARUTI 0.016790362
RCOM 0.601228648
TCS 0.038150422
GLEXO 0.002929146
Table 2 shows regression analysis of selected companies for the research. The test shows that
whether companies are having impact on changes in the NIFTY returns or not. From the analysis it
can be interpreted that company like RCOM having impact on last Thursday up to 60.12% i.e.
changes in the NIFTY prices up to 60.12% can be directly identifiable because of RCOM, Indian
Infoline is having 43.70% impact while Bank of India is having 39.77% impact on NIFTY return,
while others are having quite less impact on NIFTY returns which can be called as negligible impact.
Results of T-test:
Table 3 shows analysis of t-test calculation for the Expiration Day Effect of Stock Derivatives
on the Volatility of the Underlying Securities
H0: there is no significance impact of F&O stocks on Nifty returns.
COMPANY
t
calculated t critical
accept/
reject
AXIS 0.247525 1.770933 accept
BANK OF INDIA 0.217946 0.217946 accept
ACC -0.40573 1.75305 accept
HDIL 0.346873 1.782288 accept
HINUDSTAN
LEVER 0.838963 1.770933 accept
INDIA
INFOLINE -0.28722 1.782288 accept
MARUTI -0.44367 1.76131 accept
RCOM -1.3712 1.782288 accept
TCS 2.457744 1.745884 accept
GLEXO -0.81467 1.739607 accept
The above table shows analysis of t-test for the selected companies for impact of last Thursday on
NSE India. By applying t-statistics it can be interpreted that there is no impact of trading activity of

54 | Journal of Management and Science | Vol.3.No.3 | September 2013 ISSN: 2249-1260|eISSN: 2250-1819
F&O companies on NSE returns. From the test its clear that returns on Nifty is statistically
independent and having less impact of returns of F&O stocks.
CONCLUSION
The empirical study revealed the impact of expiration day on the return and volatility of
underlying stocks. The study indicates a significant effect of expiration day on the returns of the
underlying securities. This price effect of expiration can be due to the cash settlement
mechanism of futures contracts which facilitate the unwinding of arbitrage positions causing
price distortions and also position adjustments by the market makers. As a whole, it can be said
that the returns and volatility in returns is higher on expiration days as compared to other days.
But the changes in the prices are not because of only expiration impact, due to some other factors
also. The results obtained also signify that on expiration day, not all the companies which are trading
in futures and options are having impact on cash market, but changes in the cash market price it can
also because of the arbitrageurs and speculators join the market to take advantage of price
differentials and price discovery.
REFERENCES:
[1] Chow Y.F., Yung H.M. and Zhang H, 2003, ―Expiration Day Effects: The Case of Hong Kong‖,
Journal of Future Markets, Vol. 23, issue 1, pp 67-86.
[2] Lien D and Yang L, 2005, ―Availability and Settlement of Individual Stock Futures and
Options Expirations Effects: Evidence from High-Frequency Data‖, Review of Economic and
Finance, Vol. 45, issue 4-5, pp 730-747.
[3] Chou HC, Chen NW, Chen HD, 2006, ―The Expiration Effects of Stock- Index Derivatives:
Empirical Evidence from the Taiwan Futures Exchange‖, Journal of Emerging Markets Finance
and Trade, Vol 42, No. 5, pp 81-102.
[4]. Vipul 2005, ―Futures and Options Expiration Day Effect: The Indian Evidence‖‘ Journal of
Future Markets, Vol 25, No. 11, pp 1045-1065.
[5] Jindal Kiran and Bodla B S, 2007, ―Expiration Day Effect of Stock Derivatives on the Volatility,
Return and Trading Volume of Underlying Stocks‖, ICFAI Journal of Derivative Markets, Vol 4, pp
46-57.
[6] Bhaumik Sumon and Bose Suchismita 2007, ―Impact of Derivatives Trading on Emerging
Capital Markets: A Note on Expiration Day Effects in India‖, William Davidson Institute (WDI)
- Working Papers, Report No. 863.
[7] Wats Sangeeta 2010, ―Impact of Expiration on Spot Market Volatility: A Study of NSE
Nifty‖, The IUP Journal of Applied Finance, Vol 16, N0.4, pp- 51-61.
[8] Karolyi AG, 1996, ―Stock Market Volatility Around Expiration Days in Japan‖, Journal of
Derivatives, Vol 4, No. 2, pp 23-43.
*****

55 | Journal of Management and Science | Vol.3.No.3 | September 2013 ISSN: 2249-1260|eISSN: 2250-1819
OPINION OF INDIAN RETAILERS ON THE IMPACT OF
FDI POLICY AMENDMENTS ON THE EXISTING INDIAN
RETAIL MARKET: A SELECTIVE STUDY
Akondi Srikantha
aPh.D Scholar, Dr.B.R.Ambedkar Open University, Road No.46, Jubilee Hills, Hyderabad-33, AP,
INDIA.
ABSTRACT: This paper seeks to know the correspondence opinion of Indian retailers including
traditional and organized retailers upon the impact of FDI policy amendments made by the Indian
government on the Indian retail market. In methodology, purposive sampling technique was used for
collecting 43 samples, out of which 32 samples had provided the data. The schedule had become a
data collection tool whereas descriptive statistics and Mann –Whitney U test was used for analyzing
the data. The results gave about 57.14% of organized retailers agreed in gaining employment
opportunities by allowing FDI. From the survey, it was also found that 53.13% and 65.63% of all
retailers had also agreed with the decrement in store profits and store sales respectively. In
conclusion, the results found matching the perspective of traditional and organized retailers. With
the direct opinion of retailers, only 37.5% have agreed and 62.5% have not agreed for allowing FDI.
In limitation, the survey results are confined to an area in Hyderabad, Andhra Pradesh. In practice,
this paper can bring to the awareness about FDI and its impact on the existing retailers that help
them in building their competitive strategies to sustain and growth.
Keywords: Traditional retailers; organized retailers; Mann-Whitney U test; descriptive
statistics; FDI
I. INTRODUCTION The size of Indian retail market is USD 435billions (Mukherjee and Kalbag 2011) out of which the
modern retail represents only 7%, indicates a room of 93% for the organized retailers to grab.
Globally, India has secured the fifth position in retail expansion attractiveness (Global Retail
Expansion: Keeps on Moving, 2012) and secured position as the second most attractive Investments
destination (Cautious Investors Feed a Tentative Recovery, 2012) for the retailers from the surveys
conducted by AT Kearney. Therefore, the Indian retail market is becoming a hottest destination for
foreign retailers across the globe. It is also observed from these studies that size of consumer market
and its growth draw investors to these emerging markets. Not only this the permission of 100%
Foreign Direct Investment (FDI) in cash and carry wholesale trading in 1997 under government route
and further acceptance of it under automatic route in 2006 have provided opportunity for retailing
big shots like Wal-Mart (USA), Carrefour (French), Metro AG (German), Booker (UK) and
Woolworths (Australia) running together almost forty stores in India, with huge plans for rolling
their stores in future. The decision of the government to allow 100% in single brand retailing and
51% in multi-brand retailing by the union cabinet (Ghosh, Ray, & Shah, 2011) may provide wings
for the foreign retailers. Now, there arises a need for studying the impact of these FDI reforms made
by the government on traditional as well as organizational retailers in India, is the point of study of
this paper. The present study and results are confined to an area considered for the survey in
Hyderabad, Andhra Pradesh and the segments covered under survey are food and Grocery, Clothing
and textile, Books & music and footwear only. The study can be enhanced for more areas for better
response and suitability. The second section deals with Literature review and the third deals with

56 | Journal of Management and Science | Vol.3.No.3 | September 2013 ISSN: 2249-1260|eISSN: 2250-1819
objectives followed by methodology in the fourth, results in the fifth section, findings in the sixth
and finally deals with Discussion in the seventh including conclusion. Let us move to the next
section, Literature Review.
II. LITERATURE REVIEW
2.1 Definition
In layman‘s terms, FDI is ―outsider‘s cash invested directly into the production sector of another
country‖ (sudh, 2006). The foreign direct investment purpose is to produce units or to purchase a
company or a part of it for selling goods or services to the market where it has entered. In all cases,
profit is the motive.
2.2 FDI Reforms
In 1995, the Wholesale and Retailing services came into effect under General Agreement on Trade in
Services (GATS). After which in 1997, 100% FDI in cash and carry in wholesale trading was
allowed under the government approval route and in 2006, it was brought under automatic route.
Simultaneously, the Indian government has permitted 51% of investments in single brand retailing
(Shrivastava, Shira, Devonshire -Ellis, & Associates, 2012). Metro AG was the first international
retailer entered into the Indian retail market as a cash and carry wholesaler in 2003 with a store in
Bangalore (Singh, 2011). Presently, it has eleven retail outlets in India. The Indian retail market got
expanded with the further entry of other players like Woolworths of Australia in 2006(operating six
locations), Wal-Mart of the United States (Operating 17 stores) and Booker of United Kingdom
(Operating 4 stores) in 2009 and Carrefour of France (Operating 2 stores) in 2010 (Mukherjee N. ,
2012) f. On 10th
January 2012, Indian government lifted the existing FDI norms in single brand
retailing i.e. 51% and made it 100% (India Today Online: story, 2012), paving the way for big single
brand retailer chains like Adidas, Gucci, Louis Vuitton, Nike, Apple, IKEA and for so many others
those are waiting for the opportunity to clutch. Pavers limited, a UK based footwear company sells
its leather footwear products under the brand ―Pavers England‖, become the first retailer to seek the
government approval to operate without a local partner after the announcement of 100% FDI made
in single brand retailing in India. Later IKEA, Swedish home furnishing major approached
government with a proposal of investing Rs.10,500 cr to set up 25 stores across the country (Home :
story, 2012). But it was said from the studies that 100% in single brand is not encouraging the
foreign players to operate because it makes them to source 30% of the goods they sell in India from
the local SMEs and cottage industries artisans and craftsmen. In Multi-brand retail also the
conditions are such, which may make the retailers think twice to enter. The conditions are like a
minimum investment of USD 100millions to be kept and stores are restricted to those cities(53) with
a population of one million or more within 10 kms of area. Not only this, 30% of manufactured items
should be procured from the local SMEs (Ghosh, Ray, & Shah, 2011).
2.3 Agitations against FDI
The announcement of FDI in retail made so many activities to protest the decision leads to Pan-India
Bundh on December 1st,2011 (Financial Express.com, 2011). The secretary general of Confederation
of All India Traders (CAIT), Shri. Praveen Khandelwal said that nearly five crore traders from
10,000 trader‘s bodies are participating in bandh across the country. Major contributors are from
Tamil Nadu(20 lakh traders) , Maharstra ( 35 lakh traders), West Bengal (5 lakh traders) and others
are Bihar, Andhr Pradesh, Assam, Orissa, Karnataka and Delhi as specified in the report. The trader
and their associations believe that the farmers and local traders won‘t get benefited. Even the chief
ministers of certain states are not willing to allow FDI in their states as they themselves stated openly
(Vakayil, 2011).
2.4 Opinion on FDI Amendments
One of the studies conducted a survey at chandigargh (Gupta, 2012) to know the ―reaction towards
the recent announcement of allowance to foreign groups to own up to 51% in Multi-brand retailing‖,
upon 200 customers, 14 vegetables and fruit halkers, 26 Mom and Pop stores and 2 organized
retailers, provided responses as follows. In one case, 66% of customers welcome the decision and

57 | Journal of Management and Science | Vol.3.No.3 | September 2013 ISSN: 2249-1260|eISSN: 2250-1819
34% of customers are not willing to welcome the decision. In the other, vegetable & hawkers' and
Mom & Pop stores reacted quite opposite where 86% of them have opposed the decision as they
believe it may affect their business, only 4% are in favor as they believe that they get benefited from
the competition between locally organized and the entered foreign players and 10% of them can‘t
able to express their opinion.
Another researcher has conducted a study (Kore, 2012) on the ―Impact of FDI in retail sector‖
by considering the secondary sources available to him. The study concluded that there are several
factors affecting by FDI such as Economy, producers, suppliers and farmers. FDI provides
employment for 1crore personnel increases economy, but what about 10 crore retailers is a point of
discussion. It was concluded that semi- urban retailers may not worry as foreign retailers can‘t open
their stores in those towns where the population is below 10 lakhs as per the specified regulations.
The other study (Baskaran, 2012) has discussed certain myths with which the Wal-mart, Carrefour
and other retailers play in International destinations. Especially, the myths about Wal-mart was
totally exposed in best seller ―Wal-mart effect‖ by Charles Fishman. The myths stated are
localization, an ally (friend) of small retailers, provide quality jobs, help develop and grow local
suppliers. But it was said these are not realities. Apart several other myths are also stated by the
study, some of them are low price offerings, eliminating middlemen, generates employment, farmer
gets better deal, corporate sells fresh, promotes local economy, efficient supply chain, sell cheap and
consumers save money. These are the reasons to be understood to conclude why an FDI is a bad
idea. But from the reports the key perceived benefits are improvement in supply chain/distribution
efficiencies, reduce inflationary pressures, improvement in productivity and realizations for farmers
eliminating middle men, stimulates the local technical know-how and employment generation of
around 10 million jobs (Ghosh, Ray, & Shah, 2011). The driving factors of Indian retail market are
increasing disposable Income, increase in dual income nuclear families, changing lifestyle and
consumer behavior, experiments with formats, store design, low sharing of organized retailing, credit
availability and fall in real estate prices may lead FDI growth in India (Handa & Grover, 2012). All
this literature leads to an attempt in knowing the actual impact of FDI amendments on Indian
retailers that acts as a base for the objectives under study. Let us move to Research methodology.
III. OBJECTIVES OF THE STUDY
The objectives of the study are as follows,
1. To study the individual opinion of Traditional as well as Organized retailers on the impact of
FDI amendments on the existing Indian retail market.
2. To analyze the corresponding opinion between the traditional and organized retailers upon the
impact of FDI amendments on the existing Indian retail market.
The study goes ahead with a single Hypothesis statement as follows-
Null Hypothesis H0 : There is a corresponding opinion between the traditional and organized retailers
upon the impact of FDI amendments on the existing Indian retail market.
Alternative Hypothesis H1 : There is no corresponding opinion between the traditional and organized
retailers upon the impact of FDI amendments on the existing Indian retail market.
IV. RESEARCH METHODOLOGY
The following methodology was adopted for fulfilling the objectives and for testing the hypothesis of
the study.
4.1 Research Design
In this study, it requires a research design that best suits for describing the opinions or Interests of
population on the subject chosen and the results cannot be generalized to the other retailers in other
area as the demographic, social, economic, political, technological factors vary. Therefore, the
research design chosen was descriptive research that better suits in obtaining the opinion of retailers.
4.2 Sampling size
The sample size is chosen as a 50 as the numbers of retail outlets in the chosen area are approx. 80 in
number, out of which tailoring shops, Xerox shops, Tiffin centers, curry points, barber shops and

58 | Journal of Management and Science | Vol.3.No.3 | September 2013 ISSN: 2249-1260|eISSN: 2250-1819
sweet shops cover 30 outlets. The survey was able to fill 43 schedules out of 50, where only 32
schedules were provided with sufficient data for analysis. The rest of the 11 schedules were
unanswered by the retailers.
4.3 Sampling Procedure
The purposive sampling is used in picking the sample units, as the selected area also includes
unwanted units as mentioned in the above section 4.2.
4.4 Data collection method
The face to face method is a survey method, which was used for data collection using a schedule as a
data collection tool. The schedule was used as the researcher was directly involved in conducting the
survey. In the schedule, Likert scale was used on a 5 point scale ranging from 1 to 5 indicating 1 as
strongly disagree and 5 as strongly agree with relevant intermediate options. The schedule includes
broadly four questions with internal supporting factors. The first question is a dichotomous one i.e.
yes/No type question. Second one is to know the type of retailer. The third question is on the opinion
of organized retailers and fourth on the opinion of traditional retailers upon twelve factors and five
factors respectively, on the impact of FDI roll out on the Indian retail market.
4.5 Data analysis
In this study, the descriptive statistics and Mann-Whitney U test are used for data analysis. In detail,
descriptive statistics are used to analyze the individual opinions of retailers on respective factors
whereas Mann-Whitney U test, a non-parametric test was used to analyze the corresponding opinion
of retailers. Under descriptive statistics, the mode was preferred for analyzing the data obtained from
the Likert scale (ordinal scale), whose data cannot be analyzed using mean. In this study, the opinion
of organized retailers and traditional retailers was compared, where the sizes are unrelated i.e. 7 and
25 respectively. For such cases, studies suggest that the Mann-Whitney U test as an appropriate test.
The statistical tool used for computing Mann- Whitney U test was statext v1. 5 software. Let us
move towards the result analysis.
V. RESULT ANALYSIS
A. As discussed above, the study was conducted by using a schedule with four questions and got
distributed and obtained responses from 32 retailers. The question wise analysis is shown below.
Question 1: Have you ever heard about Foreign Direct Investment-FDI?
Response 1: Out of 32 retailers, 11 retailers have not heard about FDI. The reason is that they can‘t
understand the English language. But they knew the concept behind it.
Question 2: From the following, choose the option you belong. (Either traditional or organized
retailer)
Response 2: Out of 32, 25 are traditional and 7 are organized retailers.
Question 3: Express your opinion on the following statements on the impact of FDI allowed in
single/ Multi- brand retailing on the organized retailing in India.
Response 3: The responses are asked for 12 options placed under Likert scale as shown in the
schedule in Appendix. The mode was applied and the responses are shown in Table.1, in
a sequential order matching with the schedule.
i. In total, all the organized retailers have agreed that FDI permit improves employment
opportunities, where 57.14% have strongly agreed.
ii. 85.71% of organized retailers agreed that FDI permit decreases the customer‘s footprint in
their stores.
iii. 57.15% of the organized retailers are disagreeing that there will be decrease in store profits
due to FDI.
iv. 71.43% of organized retailers agreed to have a decrement in store sales.
v. Can‘t say situation, in terms of decision towards providing more quality products by
retailers entering through FDI to Indian customers.
vi. Almost all have agreed that there be availability of abundant products to the customer.

59 | Journal of Management and Science | Vol.3.No.3 | September 2013 ISSN: 2249-1260|eISSN: 2250-1819
vii. About 57.15% have agreed to provide products at competitive prices irrespective of the
entry of foreign retailers through FDI policy.
viii. 85.71% of organized retailers have agreed that allowing FDI will disrupt the livelihood
of poor people engaged in this trade of retailing.
ix. 57.14% of organized retailers have agreed that the entry of foreign retailers through FDI
will improve the efficiency of existing supply chain.
x. Can‘t say situation towards the increase in real estate rates. Only 28.57% of organized
retailers have agreed and the same percentage of them has disagreed.
xi. Only 42.86% of organized retailers have expressed their opinion towards welfare of
farmers stating that they may not get better prices.
xii. 57.15% of organized retailers have agreed that the FDI permit may cause inflation.
Table 1. Opinion of Organized Retailers on FDI‘s Impact on Indian retailers
Note: All values in the Table No.1, 2 and 3 are Mode values. Percentages are drawn for better
analysis.
Question 4: Express your opinion on the following statements on the impact of FDI allowed in
single/ Multi- brand retailing on the traditional retailing in India.
Response 4: This includes six factors under study. The responses are shown in Table.2
Organized Retailers opinion on FDI Ratings 1 2 3 4 5
3Q SD1
D2
UD3
A4
SA5
Improves retail employment opportunities 1 0 0 0 3 4
% 0.00 0.00 0.00 42.86 57.14
Decreases customers footprint 2 0 1 0 2 4
% 0.00 14.29 0.00 28.57 57.14
Decreases store profits 3 1 3 0 1 2
% 14.29 42.86 0.00 14.29 28.57
Decreases store sales 4 0 2 0 3 2
% 0.00 28.57 0.00 42.86 28.57
Provides more quality products to customers than us 5 0 2 3 1 1
% 0.00 28.57 42.86 14.29 14.29
Availability of abundant products to the customer 6 0 0 0 3 4
% 0.00 0.00 0.00 42.86 57.14
Provide products at competitive prices 7 0 1 2 1 3
% 0.00 14.29 28.57 14.29 42.86
Disrupt the livelihood of poor people in this trade. 8 0 1 0 2 4
% 0.00 14.29 0.00 28.57 57.14
Improves Supply chain 9 0 3 0 4 0
% 0.00 42.86 0.00 57.14 0.00
Increases Real Estate rates 10 0 2 3 2 0
% 0.00 28.57 42.86 28.57 0.00
Farmers will not get better prices 11 0 0 0 3 0
% 0.00 0.00 0.00 42.86 0.00
Causes Inflation 12 0 2 1 3 1
% 0.00 28.57 14.29 42.86 14.29
1- Strongly Disagree; 2- Disagree;3-Undecided;4-Agree;5-Strongly Agree

60 | Journal of Management and Science | Vol.3.No.3 | September 2013 ISSN: 2249-1260|eISSN: 2250-1819
Table 2.Opinion of Traditional Retailers on FDI‘s Impact on Indian retailers
i. 56% of traditional retailers have agreed that FDI kills traditional store profits.
ii. 64% have agreed that FDI permit kills store sales.
iii. 68% agreed that FDI permit will decrease the customer‘s traffic.
iv. 60% of retailers agreed that it‘s a blow and may cause them to shut down their operations.
v & vi. About 60% of traditional retailers believe that they can compete with the prices of
foreign retailers.
B. The overall opinion of all retailers was also studied but limited to only four parameters.
Table 3. Overall opinion of retailer‘s on FDI‘s impact on existing Indian retail market
From the above Table.3, it can be understood that 53.13% and 65.63% of retailers agreed that
the FDI permit will kill the store's profits as well as store sales respectively whereas 71.88% of
retailers agreed for a fall in customer‘s traffic into their stores.
In the end, the opinion on providing products at competitive price to a customer is approximately
a balanced one, as 50% said difficult to provide whereas 43.75% said they can provide.
C. Now, let us move to the analysis of four factors regarding the corresponding opinion between
the traditional and organized retailers upon the impact of FDI amendments on the existing Indian
retail market. From the Table .4, it is clear that all the obtained probability values are greater than
alpha i.e. 0.05 (level of significance).
Traditional retailers opinion on FDI 4Q SD1
D2
UD3
A4
SA5
Kills traditional store profits 1 6 4 1 6 8
% 24.00 16.00 4.00 24.00 32.00
Kills traditional store sales 2 4 4 1 8 8
% 16.00 16.00 4.00 32.00 32.00
Decreases customer traffic 3 1 6 1 7 10
% 4.00 24.00 4.00 28.00 40.00
Traditional stores shutdown 4 7 8 0 6 4
% 28.00 32.00 0.00 24.00 16.00
Products can't be provided at CP 5 8 7 0 7 3
% 32.00 28.00 0.00 28.00 12.00
Products at competitive prices 5' 3 7 0 7 8
% 12.00 28.00 0.00 28.00 32.00
1- Strongly Disagree; 2- Disagree;3-Undecided;4-Agree;5-Strongly Agree
Overall retailers opinion on FDI
1.00 2.00 3.00 4.00 5.00
SD1
D2
UD3
A4
SA5
Kills store profits 1 7 7 1 7 10
% 21.88 21.88 3.13 21.88 31.25
Kills store sales 2 4 6 1 11 10
% 12.50 18.75 3.13 34.38 31.25
Decreases customer traffic 3 1 7 1 9 14
% 3.13 21.88 3.13 28.13 43.75
Products at competitive prices 4 8 8 2 8 6
% 25.00 25.00 6.25 25.00 18.75
1- Strongly Disagree; 2- Disagree;3-Undecided;4-Agree;5-Strongly Agree

61 | Journal of Management and Science | Vol.3.No.3 | September 2013 ISSN: 2249-1260|eISSN: 2250-1819
Table 4. Probability values of choosing parameters
If the p- value is greater than alpha, the null hypothesis could not be rejected. It indicates all retailers
agreed with all parameters, thereby there is no significant difference between the opinions of
traditional and organized retailers on the impact of FDI amendments on the existing Indian retail
market. All felt that allowing FDI effects adversely on their store profits, store sales and customer
traffic too. The other way they expressed the confidence that they could be able to provide products
to the customers at competitive prices irrespective of any one entry into the market through FDI.
VI. FINDINGS
The above conducted survey highlights certain findings towards the impact of FDI amendments on
Indian retail market from the opinion of Indian retailers. They are
1. Maximum retailers feel that the there will be a decrease in their store profits, store sales and
customer traffic. But in the discussion that had with retailers the responses came such as profits
remain and sales may vary.
2. Almost all the retailers have agreed that there will be a rise in employment opportunities. This is
similar opinion made by the government in considering FDI reforms. But, some retailers have
thrown light on this aspect by stating ―one side the employment will increase with the FDI
reforms and the other side, thousands of small retailers getting wiped out from the market‖ . What
to do?
3. The greatest part of retailers is that they do not fear of FDI permit, they are freely saying that they
can provide the products to the customers at more competitive prices as they are local to the
market.
4. The opinion of Traditional retailers got matched with the opinion of organized retailers indicate
that both are looking the FDI permit on same lines.
5. In discussion with the retailers, one interesting thing came out that only 37.5 % have agreed for
FDI permit whereas 62.5% have not agreed. Out of these 37.5%, the retailers are so confident in
stating that ―what we did when our organised retailers started grabbing the market, the same we
do now also‖. This admits a positive outlook that the regional organized retailers entry or foreign
retailers entry creates competition and also forms a hub, where the people start moving around in
search of required products or services, provides them equal opportunity to grow.
6. From the survey, it can be understood that the retailers are not clear about the full length norms
stated by the Indian government in single brand and multi-brand retailing.
7. In suggestions, some retailers gave their opinion not to encourage foreign retailers, instead
encourage local retailers that can improve their livelihood and economic status, may contribute
towards GDP.
8. The farmers and the intermediaries dependent on the traditional supply chain may suffer a lot. The
government must consider this aspect seriously.
S. No
Parameters
U* Values
Probability value
p- values
1 Decrease store profits 83 0.841
2 Decrease store sales 82 0.806
3 Decreases customer traffic 86.5 0.947
4 Can provide products at competitive prices 72 0.489
* U values help in obtaining p- values

62 | Journal of Management and Science | Vol.3.No.3 | September 2013 ISSN: 2249-1260|eISSN: 2250-1819
VII. CONCLUSION
Overall, 62.5% of retailers have not agreed for permitting FDI but the rest 37.5% of retailers
surveyed have agreed to permit FDI. Here, the study produces two interesting outcomes. The first
outcome is opposing the FDI and the other is in favour of FDI. The first outcome expresses that both
the traditional and organized retailers have agreed that allowing FDI reduces customer footfalls
which in turn ruins their profits and sales and the customer traffic. In addition, some more retailers
also express that so many small retailers, farmers and intermediaries may suffer those depend on a
traditional supply chain. But, the other outcome welcomes FDI by stating that it helps in increasing
employment, creates a hub of retailers which helps in gathering more customers in turn helps in
increasing their sales. Even, the favoured retailers expressed that they are confident enough in giving
a tough competition for the foreign retailers in terms of price and quality.
VIII. ACKNOWLEDGEMENT
The author is thankful to all the store managers of organized retail chains and owners of traditional
retailers those participated in the survey for providing their valuable feedback on the proposed FDI
policy amendments by the Indian Government.
REFERENCES
[1] (2011, December 1). Retrieved July 19, 2012, from Financial Express.com:
http://www.financialexpress.com/news/fdi-storm-traders-shut-shop-across-country/882774/0
[2] Baskaran, K. (2012). THE FDI PERMIT FOR MULTI BRAND RETAIL TRADING IN
INDIA - GREEN SIGNAL OR RED SIGNAL. Business Intelligence Journal , 5 (1), 176-
186.
[3] (2012). Cautious Investors Feed a Tentative Recovery. AT Kearney.
[4] Ghosh, A., Ray, S., & Shah, K. (2011). INDIAN RETAIL INDUSTRY: An Update. ICRA
Limited.
[5] (2012). Global Retail Expansion:keeps on Moving. Illinois: AT Kearney.
[6] Gupta, S. (2012, February). Allowance of FDI up to 51% in Multi-Brand Retailing. The
Managment Accountant , 47 (2), pp. 185-192.
[7] Handa, V., & Grover, N. (2012). Retail sector in India: Issues & Challenges. International
Journal of Multidisciplinary Research , 2 (5), 244-264.
[8] Home : story. (2012, June 22). Retrieved July 18, 2012, from
http://businesstoday.intoday.in/story/ikea-india-singlebrand-retail/1/185744.html
[9] India Today Online: story. (2012, January 10). Retrieved July 18, 2012, from
http://indiatoday.intoday.in/story/fdi-in-single-brand-retail-foreign-direct-
investment/1/168142.html
[10] Kore, S. C. (2012, Februaryy). Impact of FDI on Retail Sector. Golden Research Thoughts , 1
(8), pp. 1-4.
[11] Makol, S., & Rajput, P. S. (2012). FOREIGN DIRECT INVESTMENT IN INDIA"S
RETAIL MARKET: AN ANALYSIS. International Journal of Research in IT, Management
and Engineering , 2 (5), 47-65.
[12] Mukherjee, D., & Kalbag, H. (2011). The case for " Compact Hypermarkets" in India.
Illinois: AT Kearney.
[13] Mukherjee, N. (2012, May 28). Home :Companies& industry. Retrieved July 18, 2012, from
Business Standard Website: http://www.business-standard.com/india/news/india-
expansionfor-global-cashcarry-chains/475544/
[14] Shrivastava, A., Shira, D., Devonshire -Ellis, C., & Associates. (2012, February 2). Industry
Reports: Retail. Retrieved July 18, 2012, from India Briefing: http://www.india-
briefing.com/news/foreign-direct-investment-indias-single-multibrand-retail-5232.html/

63 | Journal of Management and Science | Vol.3.No.3 | September 2013 ISSN: 2249-1260|eISSN: 2250-1819
[15] Singh, S. (2011, December 17). FDI in Retail: Misplaced Expectation and Half-truths.
Economic and Political Weekly , 26 (51), pp. 1-16.
[16] sudh, H. (2006, May 10). Papers:1796. Retrieved July 18, 2012, from
http://www.southasiaanalysis.org/paperindex.asp?currentpage=134
[17] Vakayil, J. (2011, December). SME news and Views: FDI in retail decison divides India.
Retrieved July 19, 2012, from sulekha.com: http://smehorizon.sulekha.com/fdi-in-retail-
decision-divides-india_sme-viewsitem_6048
*****

64 | Journal of Management and Science | Vol.3.No.3 | September 2013 ISSN: 2249-1260|eISSN: 2250-1819
An Introduction To Green Marketing-Emerging
Dimensions, Strategies, Opportunities, Challenges and
Trends: A Review
Jiwan Jyoti
Kurukshetra University,Kurukshetra, 136118,India
ABSTRACT: Green marketing is a phenomenon which has developed particular important in
the modern market. This concept has enabled for the re-marketing and packaging of existing
products which already adhere to such guidelines. The importance of Green Marketing can well
be emphasised by stating the fact that majority of consumers in all the countries want to buy
from environmentally responsible companies. Consumers say environmental consciousness is an
important corporate priority – ranking behind good value, trustworthy, and cares about
customers. Consumers expect green companies to engage in a broad set of actions, particularly
reducing toxics, recycling and managing water. Many consumers prefer to spend more on green
products, especially in developing economies. Green marketing is a phenomenon which has
developed particular important in the modern market. This concept has enabled for the re-
marketing and packaging of existing products which already adhere to such guidelines.
Additionally, the development of green marketing has opened the door of opportunity for
companies to co-brand their products into separate line, lauding the green-friendliness of some
while ignoring that of others. Such marketing techniques will be explained as a direct result of
movement in the minds of the consumer market. As a result of this businesses have increased
their rate of targeting consumers who are concerned about the environment.
Keywords: Green marketing; Green-friendliness; Eco-Friendly products; Green Products.
1. INTRODUCTION
According to the American Marketing Association (AMA), green marketing is the marketing of
products that are presumed to be environmentally safe. Thus green marketing incorporates a
broad range of activities, including product modification, changes to the production process,
packaging changes, as well as modifying advertising. Yet defining green marketing is not a
simple task where several meanings intersect and contradict each other; an example of this will
be the existence of varying social, environmental and retail definitions attached to this term.
Other similar terms used are Environmental Marketing and Ecological Marketing. As society
becomes more concerned with the natural environment, businesses have begun to modify their
process in an attempt to address society‘s new issues. Some businesses have been quick to accept
the newer challenges or changes like environmental management, minimization of the waste
aligning with organizational activities. For a company to be successful in implementing green
marketing strategy, it should not forget attitude of consumers towards green marketing. "Green
Marketing" refers to holistic marketing concept wherein the production, marketing consumption

65 | Journal of Management and Science | Vol.3.No.3 | September 2013 ISSN: 2249-1260|eISSN: 2250-1819
an disposal of products and services happen in a manner that is less detrimental to the
environment with growing awareness about the implications of global warming, non-
biodegradable solid waste, harmful impact of pollutants etc., both marketers and consumers are
becoming increasingly sensitive to the need for switch in to green products and services. While
the shift to "green" may appear to be expensive in the short term, it will definitely prove to be
indispensable and advantageous, cost-wise too, in the long run.
Pride and Ferrell (1993) Green marketing, also alternatively known as environmental
marketing and sustainable marketing, refers to an organization's efforts at designing, promoting,
pricing and distributing products that will not harm the environment.
Polonsky (1994) defines green marketing as .all activities designed to generate and
facilitate any exchanges intended to satisfy human needs or wants, such that the satisfaction of
these needs and wants occurs, with minimal detrimental impact on the natural environment.
Elkington (1994) defines green consumer as one who avoids products that are likely to
endanger the health of the consumer or others cause significant damage to the environment
during manufacture, use or disposal, consume a disproportionate amount of energy, cause
unnecessary waste, use materials, derived from threatened species or environments; involve
unnecessary use of, or cruelty to animals; adversely affect other countries. Green marketing
subsumes greening products as well as greening firms. In addition to manipulating the 4Ps
(product, price, place and promotion) of the traditional marketing mix, it requires a careful
understanding of public policy processes.
2. WHY GREEN MARKETING?
It is really scary to read these pieces of information as reported in the Times recently: "Air
pollution damage to people, crops and wildlife in US. Total tens of billions of dollars each year".
"More than 12 other studies in the US, Brazil Europe, Mexico, South Korea and Taiwan have
established links between air pollutants and low birth weight premature birth still birth and infant
death". As resources are limited and human wants are unlimited, it is important for the marketers
to utilize the resources efficiently without waste as well as to achieve the organization's
objective. So green marketing is inevitable. There is growing interest among the consumers all
over the world regarding protection of environment. Worldwide evidence indicates people are
concerned about the environment and are changing their behaviour. As a result of this, green
marketing has emerged which speaks for growing market for sustainable and socially responsible
products and services. Thus the growing awareness among the consumers all over the world
regarding protection of the environment in which they live, People do want to bequeath a clean
earth to their 10 offspring. Various studies by environmentalists indicate that people are
concerned about the environment and are changing their behaviour pattern so as to be less hostile
towards it. Now we see that most of the consumers, both individual and industrial, are becoming
more concerned about environment friendly products. Green marketing was given prominence in
the late 1980s and
1990s after the proceedings of the first workshop on Ecological marketing held in Austin, Texas
(US), in 1975. Several books on green marketing began to be published thereafter. According to
the Joel makeover (a writer, speaker and strategist on clean technology and green marketing),
green marketing faces a lot of challenges because of lack of standards and public consensus to
what constitutes "Green". The green marketing has evolved over a period of time. According to
Peattie (2001), the evolution of green marketing has three phases. First phase was termed as
"Ecological" green marketing, and during this period all marketing activities were concerned to

66 | Journal of Management and Science | Vol.3.No.3 | September 2013 ISSN: 2249-1260|eISSN: 2250-1819
help environment problems and provide remedies for environmental problems. Second phase
was "Environmental" green marketing and the focus shifted on clean technology that involved
designing of innovative new products, which take care of pollution and waste issues. Third phase
was "Sustainable" green marketing. It came into prominence in the late 1990s and early 2000.
3.MARKETING MIX OF GREEN MARKETING
Every company has its own favourite marketing mix. Some have 4 P's and some have 7 P's of
marketing mix. The 4 P's of green marketing are that of a conventional marketing but the
challenge before marketers is to use 4 P's in an innovative manner.
Product
The ecological objectives in planning products are to reduce resource consumption and pollution
and to increase conservation of scarce resources (Keller man, 1978).
Price
Price is a critical and important factor of green marketing mix. Most consumers will only be
prepared to pay additional value if there is a perception of extra product value. This value may be
improved performance, function, design, visual appeal, or taste. Green marketing should take all
these facts into consideration while charging a premium price.
Promotion
There are three types of green advertising: -
1. Campaigns that address a relationship between a product/service and the biophysical
environment.
2. Campaigns that promote a green lifestyle by highlighting a product or service.
3. Campaigns that present a corporate image of environmental responsibility
Place
The choice of ‗where and when‘ to make a product available will have significant impact on the
customers. Very few customers will go out of their way to buy green products. When looking
through the literature there are several suggested reasons for firms increased use of Green
Marketing.
Five possible reasons are as follows:
1. Organizations perceive environmental marketing to be an opportunity that can be used to
achieve its objectives.
2. Organizations believe they have a moral obligation to be more socially responsible.
Governmental bodies are forcing firms to become more responsible.
3. Competitors' environmental activities pressure firms to change their environmental
marketing activities.
4. Cost factors associated with waste disposal, or reductions in material usage forces firms
to modify their behaviour.
5. As resources are limited and human wants are unlimited, it is important for the marketers
to utilize the resources efficiently without waste as well as to achieve the organization's
objective. So green marketing is inevitable.

67 | Journal of Management and Science | Vol.3.No.3 | September 2013 ISSN: 2249-1260|eISSN: 2250-1819
There is growing interest among the consumers all over the world regarding protection of
environment. Worldwide evidence indicates people are concerned about the environment and are
changing their behaviour. As a result of this, green marketing has emerged which speaks for
growing market for sustainable and socially responsible products and services.
4. OPPORTUNITIES IN GREEN MARKETING
It appears that all types of consumers, both individual and industrial are becoming more
concerned and aware about the natural environment. In a 1992 study of 16 countries, more than
50% of conumers in each country, other than Singapore, indicated they were concerned about the
environment [Ottman 1993].
A 1994 study in Australia found that 84.6% of the sample believed all individuals had a
responsibility to care for the environment. A further 80% of this sample indicated that they had
modified their behaviour, including their purchasing behaviour, due to environmental reasons
[EPA-NSW 1994]. As demands change, many firms see these changes as an opportunity to be
exploited. Given these figures, it can be assumed that firms marketing goods with environmental
characteristics will have a competitive advantage over firms marketing non-environmentally
responsible alternatives. There are numerous examples of firms who have strived to become
more environmentally responsible, in an attempt to better satisfy their consumer needs.
McDonald's replaced its clam shell packaging with waxed paper because of increased
consumer concern relating to polystyrene production and Ozone depletion [Gifford 1991,
Hume 1991].
Tuna manufacturers modified their fishing techniques because of the increased concern
over driftnet fishing, and the resulting death of dolphins [Advertising Age 1991].
Xerox introduced a "high quality" recycled photocopier paper in an attempt to satisfy the
demands of firms for less environmentally harmful products.
This is not to imply that all firms who have undertaken environmental marketing activities
actually improve their behaviour. In some cases firms have misled consumers in an attempt to
gain market share. In other cases firms have jumped on the green bandwagon without
considering the accuracy of their behaviour, their claims, or the effectiveness of their products.
This lack of consideration of the true "greenness" of activities may result in firms making false
or misleading green marketing claims.
5. SOCIAL RESPONSIBILITY
Many firms are beginning to realize that they are members of the wider community and therefore
must behave in an environmentally responsible fashion. This translates into firms that believe
they must achieve environmental objectives as well as profit related objectives. This results in
environmental issues being integrated into the firm's corporate culture. Firms in this situation can
take two perspectives; 1) they can use the fact that they are environmentally responsible as a
marketing tool; or 2) they can become responsible without promoting this fact.
There are examples of firms adopting both strategies. Organizations like the Body Shop heavily
promote the
fact that they are environmentally responsible. While this behaviour is a competitive advantage,
the firm was established specifically to offer consumers environmentally responsible alternatives
68 | Journal of Management and Science | Vol.3.No.3 | September 2013 ISSN: 2249-1260|eISSN: 2250-1819
to conventional cosmetic products. This philosophy is directly tied to the overall corporate
culture, rather than simply being a
competitive tool.
An example of a firm that does not promote its environmental initiatives is Coca-Cola. They
have invested large sums of money in various recycling activities, as well as having modified
their packaging to minimize its environmental impact. While being concerned about the
environment, Coke has not used this concern as a marketing tool. Thus many consumers may not
realize that Coke is a very environmentally committed organization.
6. GREEN MARKETING STRATEGIES
Marketing literature on greening products/firms builds on both the societal and social marketing
research. Societal marketing implies that organizations (governments, businesses and nonprofits)
need to determine the needs of target markets and to deliver the desired satisfactions in a way
that enhances the consumer‘s and the society‘s well being. Social marketing focuses on
designing and implementing programs that increase the acceptability of a social idea, cause, or
practice in (a) target group(s) (Kotler, 1994). Traditionally, marketers focus on individual needs
for designing/marketing products to best serve these needs. This approach is predicated on two
assumptions. First, individuals are motivated by the promise that products will satisfy their needs
at outlays acceptable to them.
Second, individual actions do not have significant externalities (the divergence between
public and private costs/benefits), positive or negative. The presence of externalities often
instigates actions from the nonmarket environment, mainly in the form of governmental
regulations. Unlike traditional marketers, social and societal marketers seek to persuade
consumers to alter their behaviours that have significant externalities. However, these
behavioural modifications may not directly/sufficiently benefit consumers or the benefits may
also be nonexcludable.
In addition, social marketing literature suggests that consumers‘ incentives may be
eroded if they believe that their actions alone may not enhance the community‘s welfare (Weiner
and Doescher, 1991). Thus, the challenges for social/societal marketers are complex. Three such
challenges – the role of incentives and structural factors, information disclosure strategies and
greening products versus greening firms – are examined below. The role of incentives and
structural factors Drawing insights from the political economy literature discussed previously,
marketing literature debates the relative efficacy of individual-level sacrifices (direct costs)
versus collective sacrifices (indirect costs). Instead of individual-level sacrifices (paying a
premium for green products or altering life styles to lessen the burden on the environment), from
which consumers can opt out, some social marketers favour collective sacrifices or indirect costs,
from which individuals cannot opt out (Weiner, 1993). It is predicted that by providing new
institutional contexts, such collective sacrifices will persuade consumers to change their
lifestyles.
If the objective is to reduce emissions of greenhouse gases, collective sacrifices could be
manifest as higher taxes (energy tax), stringent standards (residential building codes, automobile
fuel efficiency standards) or some other collective restrictions that impose costs on or potentially
change lifestyles of many people. In addition to mitigating collective action dilemmas, collective
sacrifices provide consumers with greater levels of confidence that their actions will make a
difference. One must note, however, that opting out from individual-level sacrifices may not be
the only way for consumers to express their preferences. As the public policy literature suggests,

69 | Journal of Management and Science | Vol.3.No.3 | September 2013 ISSN: 2249-1260|eISSN: 2250-1819
individuals signal their preferences for a policy through ‗exit, voice, and loyalty‘ (Hirschman,
1970). If they cannot ‗exit‘ due to the imposition of collective sacrifices, consumers may seek to
voice their preferences in the nonmarket arenas (see the previous discussion on stakeholder and
institutional theories). They could, for example, undertake political activity to shift the burden of
sacrifices to firms. In some cases, they may even oppose the imposition of collective sacrifices
(Vogel, 1996).
Marketing literature also examines the relative salience of consumers‘ attributes and
structural parameters (market environment, social norms and institutions) in inducing
environment-friendly behaviour. There is also a debate on the relative efficacy of economic and
noneconomic factors in inducing behavioural changes. In their review of the literature on
recycling, Derksen and Gartrell (1993) argue that demographic variables show little association
with recycling behaviour and the social context is the key determinant: people having access to
recycling programs exhibit higher levels of recycling than those not having such access.
Individuals‘ attitudes towards recycling cannot overcome structural barriers; attitudes impact
behaviours only if individuals have easy access to recycling programs (De Young, 1988–89).
This, however, begs the question: why do only some communities have recycling programs? If
public policies reflect (at least, partially) citizens‘ preferences, then citizens have some degree of
influence over policies such as recycling programs. Thus, structures (public policies) are not
entirely exogenous to consumers/citizens. As the reader will note, the politics of public policy
processes enters our discussion on green marketing. In examining the role of financial incentive
in inducing consumers to support green products, energy policy literature offers useful insights.
Much of the research on energy conservation dates back to the 1970s, when energy
shortages emerged as amajor business strategy and public policy issue in the wake of 1973 and
1979 oil crises. This literature seeks to understand how much energy, consumers use, how they
use it and how they can be motivated to conserve energy (Ritchie and McDougall, 1985). These
questions can be generalized to other aspects of green marketing. While some suggest that
consumers are motivated to conserve energy primarily due to economic incentives/disincentives
(McClelland and Canter, 1981; O‘Brien and Zoumbaris, 1993), others emphasize noneconomic
factors (Black et al., 1985; Kempton et al., 1992). The impact of economic
incentives/disincentives varies across income brackets. For upper income levels, energy use is
relatively price inelastic (economic incentives/disincentives are less efficacious because they
spend only a small percentage of their income on energy. Savings offered by energy-efficient
appliances also may not motivate them to replace their extant well functioning, but energy-
inefficient, appliances. Even when consumers are motivated to conserve energy, they may not
replace appliances or change their behaviours due to inconvenience and/or inertia. Analogously,
green marketing can be conceptualized as a three-pronged exercise. Consumers can be motivated
to curtail (reduce the impact on the environment by modifying extant living patterns), to
maintain (keep equipment in good working order) and to be efficient (undertake structural
changes such as buying environment-friendly equipment). Marketers need to correctly identify
consumers‘ propensities for the three routes at different value/price levels and accordingly
design/market their products.
7. TWENTY RULES OF GREEN MARKETING
Twenty rules of green marketing are also created which are essential strategies to play by the
new rules. (1) Green is the mainstream. In the past years, few people forming groups of
genuine green consumers existed; today every generation is somehow attached to the green

70 | Journal of Management and Science | Vol.3.No.3 | September 2013 ISSN: 2249-1260|eISSN: 2250-1819
revolution. In fact, there now exists, categories of green consumers all around the world. (2)
Green is cool. Before green has been viewed within negative connotation, however, as of today,
green has become a worldwide trend. In fact, green consumers these days are the biggest
influences on purchasing powers and behaviours. For instance, celebrities and other highly
regarded groups or individuals who cater towards green products are seen as trendsetters within
current markets worldwide. (3) Greener products work equally or better-and are often worth
a premium price. Due to advances in technology, we have moved forward from days where
green products were often ignored and were attributed with low qualities and values. As of
today, the most expensive products are those that are labelled as organics, hybrid, and
environmental friendly. (4) Green inspires innovative products and services that can result
in better consumer value, enhanced brand, and stronger company. Managers, those from big
transnational companies to small businesses, no longer consider the environment as an
extraneous variable that presents difficulties in advertising, marketing and managing strategies.
These days, the environment is the primary source of high rates of returns on investment for any
company. (5) Values guide consumer purchasing. Historically, consumers bought solely on
price, performance, and convenience. These days, premium attention is drawn towards the
value that is attached to every aspect of purchasing products. For instance, people no longer
simply take into consideration the price, quality and convenience of a product; rather, they think
outside and also consider how these products could affect the environment through their
packaging, manufacturing, etc. (6) A life-cycle approach is necessary. A life-cycle approach,
which refers to a technique used in assessing the long-term condition of a product, is used to
assess the impacts of any given product on the environment. Therefore, claims such as recyclable
or reusable are no longer enough for consumers since these materials still create wastes that are
deemed as harmful to the environment. (7) Manufacturer and retailer reputation count now
more than ever. Manufacturers as well as retailers are also taken into consideration at the onset
of a purchase. The surroundings wherein products are made and stored are also often taken into
account by consumers—thus, immediate background checks on companies are already gaining a
certain amount of necessity with regards to green consumption. (8) Save me! Green
consumerism is also reflective, not only of advocacies to help the environment. Consumers are
not only concerned with saving the planet, but rather, they are even more concerned with
protecting their health. As such, products must cater to their needs with regards to health, money
and also to proficiency. (9) Businesses are their philosophies. Businesses are now assessed
according to what they stand for—their principles and values—and no longer according to how
they are built. (10) Sustainability represents an important consumer need, and is now an
integral aspect of product quality. Green marketing is not only a preference or a viewpoint – it
is the way of the company. As such, it is imperative that products must be green and that they
must reflect a sense of responsibility not only towards the environment but also towards the
society. (11) The greenest product represents new concepts with business models with
significantly less impact. The most innovative green products are the most valued. Green
products need to advance towards sustainability and not only be repetitive of what is already
evident within the community. There must be a constant effort renew and revitalize old concepts
and traditions in order to achieve more and in order to create more significant impacts. (12)
Consumer’s don’ necessarily need to own products; services can meet their needs, perhaps
even better. Green marketing must not be limited to the manufacturing of green products, but
must also include services that are of equal value. For example, electronic versions of books
(eBooks) are proven to be a service that efficiently meets the needs of consumers. (13) The

71 | Journal of Management and Science | Vol.3.No.3 | September 2013 ISSN: 2249-1260|eISSN: 2250-1819
brands consumers buy and trust today educate and engage the in a meaningful
conversation through a variety of media, especially via websites and online social networks.
Green Marketing is already inclusive of advances in technology – traditional forms of
communication such as print and paid advertising is no longer enough in promoting green
marketing as a strategy. (14) Green consumers are strongly influenced by recommendations
of friends and family, and trusted third parties. Due to a phenomenon noted as green
washing, trust is an important tool in the success of any green marketing strategy. As such,
influences through recommendations by families, friends, and genuine third parties (NGOs and
eco-labellers) are a necessity within green marketing. (15) Green consumers trust brands that
tell all. Brands or companies that practices ―radical transparency‖ are often trusted by consumers
the most. Radical transparency is achieved through disclosing all information to the public,
whether good or bad. The willingness of any company to do such entitles them to genuine
principles that are highly regarded and appreciated by customers. (16) Green consumers don’t
expect perfection. Consumers are not looking for perfect and faultless products and services;
rather, they are looking at the height of the standards raised by a company in achieving their
environmental goals. (17) Environmentalists are no longer the enemy. Environmentalists must
not be regarded as critics to any company, but rather, must be considered as allies in achieving
the goals set by the company. Partnering with environmentalists who can provide irrefutable
suggestions would make a very solid green marketing strategy. (18) Nearly everyone is a
corporate stakeholder. Corporate stakeholders are no longer inclusive of only customers,
employees and investors. Due to the ability of every individual to create an influence that could
affect the behaviour of any other individual, almost everyone is already considered as a
stakeholder. (19) Authenticity. Bringing something new and innovative in the market will help a
product stand out. As such, recycling logos or biodegradability claims are no longer enough—
brands must keep on developing new foundations that would reflect their sustainable benefits to
the environment and to their consumers. (20) Keep it simple. Less is more. In the advocacy of
promoting the environment and other issues that concern health and safety, it is imperative that
simplicity be made as a mirror that would reflect the nature of these concerns.
8. CHALLENGES IN GREEN MARKETING
8.1 Need for Standardization
It is found that only 5% of the marketing messages from ―Green‖ campaigns are entirely true and
there is a lack of standardization to authenticate these claims. There is no standardization to
authenticate these claims. There is no standardization currently in place to certify a product as
organic. Unless some regulatory bodies are involved in providing the certifications there will not
be any verifiable means. A standard quality control board needs to be in place for such labelling
and licensing.
8.2 New Concept
Indian literate and urban consumer is getting more aware about the merits of Green products. But
it is still a new concept for the masses. The consumer needs to be educated and made aware of
the environmental threats. The new green movements need to reach the masses and that will take

72 | Journal of Management and Science | Vol.3.No.3 | September 2013 ISSN: 2249-1260|eISSN: 2250-1819
a lot of time and effort. By India's ayurvedic heritage, Indian consumers do appreciate the
importance of using natural and herbal beauty products. Indian consumer is exposed to healthy
living lifestyles such as yoga and natural food consumption. In those aspects the consumer is
already aware and will be inclined to accept the green products.
8.3 Patience and Perseverance
The investors and corporate need to view the environment as a major long-term investment
opportunity, the marketers need to look at the long-term benefits from this new green movement.
It will require a lot of patience and no immediate results. Since it is a new concept and idea, it
will have its own acceptance period.
8.4 Avoiding Green Myopia
The first rule of green marketing is focusing on customer benefits i.e. the primary reason why
consumers buy certain products in the first place. Do this right, and motivate consumers to
switch brands or even pay a premium for the greener alternative. It is not going to help if a
product is developed which is absolutely green in various aspects but does not pass the customer
satisfaction criteria. This will lead to green myopia. Also if the green products are priced very
high then again it will lose its market acceptability.
9. PRESENT TRENDS OF GREEN MARKETING IN INDIA
Organizations are Perceive Environmental marketing as an Opportunity to achieve its objectives.
Firms have realized that consumers prefer products that do not harm the natural environment as
also the human health. Firms marketing such green products are preferred over the others not
doing so and thus develop a competitive advantage, simultaneously meeting their business
objectives. Organizations believe they have a moral obligation to be more socially responsible.
This is in keeping with the philosophy of CSR which has been successfully adopted by many
business houses to improve their corporate image.
Firms in this situation can take two approaches:
• Use the fact that they are environmentally responsible as a marketing tool.
• Become responsible without prompting this fact.
Governmental Bodies are forcing Firms to Become More Responsible. In most cases the
government forces the firm to adopt policy which protects the interests of the consumers.
It does so in following ways:
• Reduce production of harmful goods or by products
• Modify consumer and industry's use and /or consumption of harmful goods.
• Ensure that all types of consumers have the ability to evaluate the environmental composition
of goods.
Competitors' Environmental Activities Pressure Firms to change their Environmental Marketing
Activities. In order to get even with competitors claim to being environmentally friendly, firms
change over to green marketing. Result is green marketing percolates entire industry. Cost
Factors Associated With Waste Disposal or Reductions in Material Usage Forces Firms to
Modify their Behaviour.

73 | Journal of Management and Science | Vol.3.No.3 | September 2013 ISSN: 2249-1260|eISSN: 2250-1819
It may pursue these as follows:
• A Firm develops a technology for reducing waste and sells it to other firms.
• A waste recycling or removal industry develops.
10. THE FUTURE OF GREEN MARKETING
There are many lessons to be learned to be learned to avoid green marketing myopia, the short
version of all this is that effective green marketing requires applying good marketing principles
to make green products desirable for consumers. The question that remains, however, is, what is
green marketing's future? Business scholars have viewed it as a ―fringe‖ topic, given that
environmentalism's acceptance of limits and conservation does not mesh well with marketing's
traditional axioms of ―give customer what they want‖ and ―sell as much as you can‖. Evidence
indicates that successful green products have avoided green marketing myopia by following
three important principles, that are:
Consumer Value Positioning
• Design environmental products to perform as well as (or better than) alternatives.
• Promote and deliver the consumer desired value of environmental products and target relevant
consumer market segments.
• Broaden mainstream appeal by bundling consumer desired value into environmental products.
Calibration of Consumer Knowledge
• Educate consumers with marketing messages that connect environmental attributes with desired
consumer value.
• Frame environmental product attributes as ―solutions‖ for consumer needs.
• Create engaging and educational internet sites about environmental products desired consumer
value.
Credibility of Product Claim
• Employ environmental product and consumer benefit claims that are specific and meaningful.
• Procure product endorsements or eco-certifications from trustworthy third parties and educate
consumers about the meaning behind those endorsements and eco certifications.
• Encourage consumer evangelism via consumers social and internet communication network
with compelling, interesting and entertaining information about environmental products.
11. CONCLUSION
Green marketing covers more than a firm's marketing claims. While firms must bear much of the
responsibility for environmental degradation, ultimately it is consumers who demand goods, and
thus create environmental problems. One example of this is where McDonald's is often blamed
for polluting the environment because much of their packaging finishes up as roadside waste.
Now this is the right time to select ―Green Marketing‖ globally. It will come with drastic change
in the world of business if all nations will make strict roles because green marketing is essential
to save world from pollution. From the business point of view because a clever marketer is one
who not only convinces the consumer, but also involves the consumer in marketing his product.
Green marketing should not be considered as just one more approach to marketing, but has to be
pursued with much greater vigour, as it has an environmental and social dimension to it. With the

74 | Journal of Management and Science | Vol.3.No.3 | September 2013 ISSN: 2249-1260|eISSN: 2250-1819
threat of global warming looming large, it is extremely important that green marketing becomes
the norm rather than an exception or just a fad. Recycling of paper, metals, plastics, etc., in a safe
and environmentally harmless manner should become much more systematized and universal. It
has to become the general norm to use energy-efficient lamps and other electrical goods.
Marketers also have the responsibility to make the consumers understand the need for and
benefits of green products as compared to non-green ones. In green marketing, consumers are
willing to pay more to maintain a cleaner and greener environment. Finally, consumers,
industrial buyers and suppliers need to pressurize effects on minimize the negative effects on the
environment-friendly. Green marketing assumes even more importance and relevance in
developing countries like India.
12. REFERENCES
[1] Aseem Prakash, ―Green Marketing, Public Policy and Managerial Strategies‖, Journal of
Business Strategy and the Environment, 2002, pp. 285–297.
[2] http://escholarship.org/uc/item/49n325b7.
[3] Kotler P., ―Marketing Management: Analysis, Planning, Implementation and Control‖, 8th
edn. Prentice-Hall: Englewood Cliffs, NJ, 1994.
[4] Noamesi Adinyra, ―Green Marketing Potential as Assessed from Consumer's Purchasing
Behaviors: The Case Of Ghana‖, Master‘s Thesis In Business Administration 2011.
[5] Pavan Mishra and Payal Sharma, ―Green Marketing In India: Emerging Opportunities and
Challenges‖, Journal of Engineering, Science and Management Education, Vol. 3, 2010, pp. 9-
14.
[6] Sandeep Tiwari1, Durgesh Mani Tripathi, Upasana Srivastava, Yadav P.K., ―Green
Marketing-Emerging Dimensions‖, Journal of Business Excellence, Vol. 2, Issue 1, 2011, pp.18-
23.
[7] Vogel D., ―Kindred Strangers: the Uneasy Relationship between Politics and Business in
America‖, Princeton University Press: Princeton, NJ, 1996.
[8] Weiner JL, Doescher, ―A framework for promoting cooperation‖, Journal of Marketing, pp.
377-387.
*****

75 | Journal of Management and Science | Vol.3.No.3 | September 2013 ISSN: 2249-1260|eISSN: 2250-1819
IMPACT OF MULTIMEDIA IN EARLY CHILDHOOD
EDUCATION
Singh Shilpa1 & Mishra Sunita
2
M.Sc. Student1 & Professor
2 (Dean & Head)
Department of Human Development & Family Studies
School for Home Sciences, Babasaheb Bhimrao Ambedkar University, Lucknow-226025
ABSTRACT: - Multimedia is multiple forms of media integrated together, i.e. the collection of
audio, sounds, text, graphics, animation etc which develop in programs. Multimedia increased
Knowledge about concept and critical literacy and specific number and language concepts in the
students. Multimedia plays a very important role in assisting students in learning processes.
Multimedia uses computers to present text, audio, video, animation, interactive features, and still
images in various ways and combinations made possible through the advancement of
technology. Technology is a tool that can provide another way for children to learn and make
sense of their world. Educational technology such as multimedia plays a fundamental and
crucial role in teaching learning process at primary level. It makes teaching learning process
more effective and successful. In present investigation to identify the impact the use of
multimedia in student‟s academic achievements in early childhood education.The study was
conducted in the year 2013. The main area selected for the study was Alambagh. In this area
selected five mohllas Pawanpuri, Kailaspuri, Geetapalli, Krishnapalli and Sujanpura. A total of
120 Pre-primary and primary teachers were selected for the study. Random sampling method
was used for sample selection and questionnaire schedule was used for data collection. t test
used in research for data analysis. The results revealed that the multimedia increased
dependency. Multimedia is enabling to clarify content knowledge. It affects children‟s
personality in negative way.
Keywords: - Multimedia, Early childhood, Early childhood education, Physical dependency,
Personality.
I. INTRODUTION
Multimedia refers to the multi dimensions of media, which can be an amalgamation of text,
sound effects, light, animated figures, still images, videos and interactive content forms.
Multimedia is simply multiple forms of media integrated together.
The word comes multimedia comes from the Latin word ―multus‖ which means
―numerous‖ & media which means ―middle‖ and ―centre‖. Multimedia is general sense therefore
means ―multiple intermediaries‖ between sources and sink of information or multiple means by
which information is stored, transmitted, presented and perceived. Multimedia is communication
that uses any combination of different media, it may or may not involve computers.
Early childhood is a stage of fast development. Due to fast physical development, child
becomes more active. In this stage child learn new behavior patterns. Early childhood often
seems endless as they wait impatiently for the magic time to come when society will regard them

76 | Journal of Management and Science | Vol.3.No.3 | September 2013 ISSN: 2249-1260|eISSN: 2250-1819
as ―grown ups‖ and no longer as children. Early childhood is the age when dependency is
practically a thing of the past and is being replaced by growing independence and ends at about
the time the child enters first grade in school. Characteristics of early childhood, it is a preschool
age, an age of curiosity, it is a pregang age, a problem age.
Early childhood education consists of activities and/or experiences that are intended to
effect developmental changes in children prior to their entry into elementary school. Early
childhood education is a term that is used to commonly describe the formal teaching and care of
young children by individuals or professionals other than their family or in settings outside the
child‘s home.
Frequency of interactive or cooperative play decreased when computers were present.
Initial fears of social isolation were unfounded and overall, the social environment of the
classroom did not appear to change substantially with the introduction of computers. The use of
computers in a preschool classroom does not significantly inhibit or encourage language use.
Therefore, computers provide equally language-enriching environments for young children.
Computers do provide an environment in which children use a large amount of language with
both peers and teachers Children demonstrated more active interest and joy when using the
computer programs. They also showed more concentration using the computer than watching
TV. As evidenced by their greater use of facial blends and changes in expression, children using
the computer seemed to be engaged in a more cognitively complex activity. It was concluded
that the children had more motivation for using the computer, were more happy using the
computer, and appeared to ―get more out‖ of that experience. Computers also appear to be highly
motivating for young children. They generally have very positive experiences on the computer
and tend to stay on task for a long period of time. (Mccarrick & Li, 2007). There is no conclusive
evidence that multimedia useful in early childhood education in the right way. There is no
consistent evidence that multimedia increase either hyperactivity or passivity in children.
Multimedia not enhances academic activities such as reading or homework. Research shows that
viewing violence in classroom is moderately correlated with aggression in children. Children
with emotional or developmental problems are more likely to have difficulty understanding
television and advertising in the same way as their peers. This group of children is likely to be
more vulnerable to the potentially harmful consequences of media content.
The impact of technology on the overall interaction patterns in the classroom was also
explored. These results indicated that parallel play was still the most common form of interaction
in preschool classrooms. Solitary play did not increase in the classrooms and
cooperative/interactive play decreased slightly. Harmful physical effects of prolonged computer
use by children. Negative effects on children‘s social development (such as promote anti social
behavior like isolation or aggressive behavour). Developmental concerns (such as computer use
can interfere with children‘s cognitive development). (Mishra & Acharya, 2011)
II. OBJECTIVE OF THE STUDY
1. To know impact the use of multimedia in student‘s academic achievements in early
childhood education.
2. To Study about the multimedia increased dependency in students.
III. RESEARCH METHODOLOGY
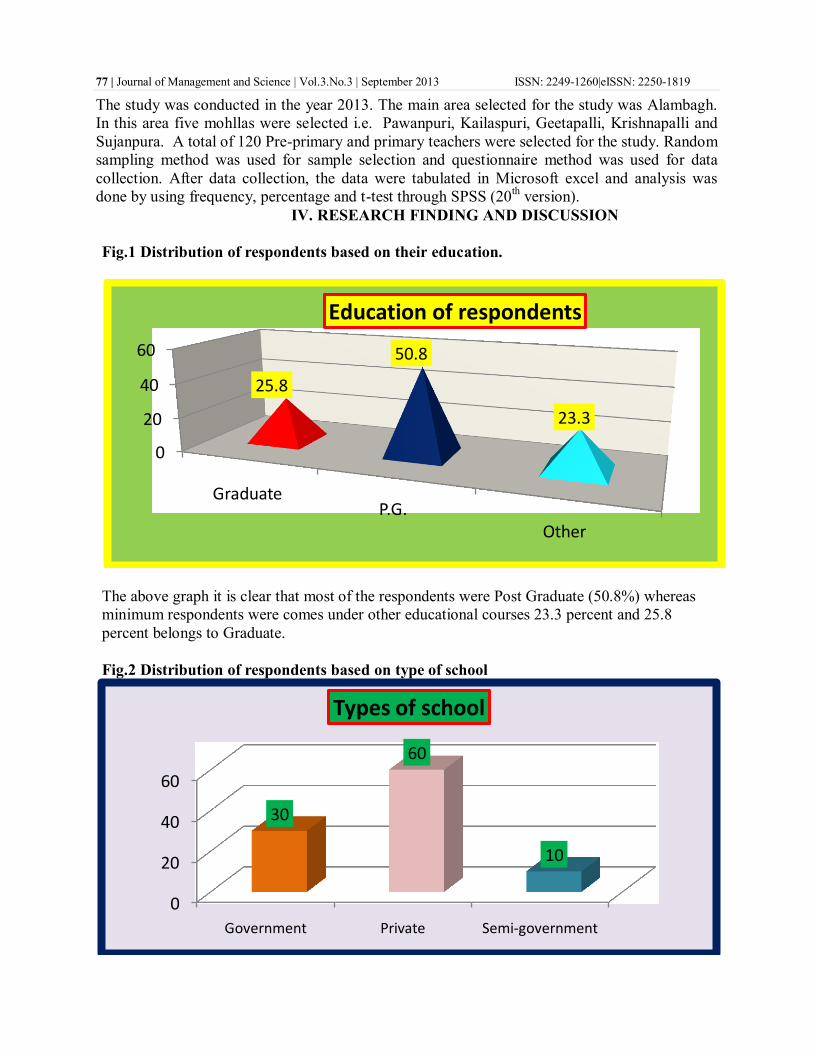
77 | Journal of Management and Science | Vol.3.No.3 | September 2013 ISSN: 2249-1260|eISSN: 2250-1819
The study was conducted in the year 2013. The main area selected for the study was Alambagh.
In this area five mohllas were selected i.e. Pawanpuri, Kailaspuri, Geetapalli, Krishnapalli and
Sujanpura. A total of 120 Pre-primary and primary teachers were selected for the study. Random
sampling method was used for sample selection and questionnaire method was used for data
collection. After data collection, the data were tabulated in Microsoft excel and analysis was
done by using frequency, percentage and t-test through SPSS (20th
version).
IV. RESEARCH FINDING AND DISCUSSION
Fig.1 Distribution of respondents based on their education.
The above graph it is clear that most of the respondents were Post Graduate (50.8%) whereas
minimum respondents were comes under other educational courses 23.3 percent and 25.8
percent belongs to Graduate.
Fig.2 Distribution of respondents based on type of school
0
20
40
60
GraduateP.G.
Other
25.8
50.8
23.3
Education of respondents
0
20
40
60
Government Private Semi-government
30
60
10
Types of school

78 | Journal of Management and Science | Vol.3.No.3 | September 2013 ISSN: 2249-1260|eISSN: 2250-1819
The above graph showed the distribution of respondents on based of school where they taught.
Majority (60%) of respondents belongs to private schools and minimum 10 percent of
respondents belong to semi-government schools and 30 percent respondents belong to
government school.
Fig.3 Distribution of respondents based on language use in school
The above graph it is clear that language use in the school in those where respondents done
teaching. The most (61.7%) of Hindi language used in schools and minimum 38.3 percent of
English language used in schools.
Fig.4 Distribution of respondents based on post in schools (teachers)
The table has shown the post of respondents in schools. Majority (61.7%) of respondents is
primary teachers and minimum (38.3) are pre-primary teachers.
Table.1- Mean, SD and t- value of the impact of multimedia based on language use in
schools:
Variable Hindi English t-value Sig
Mean SD Mean SD
61.7
38.3
Language use in schools
Hindi
English
38.3
61.7
Post of respondents
Pre primary teacherPrimary teacher

79 | Journal of Management and Science | Vol.3.No.3 | September 2013 ISSN: 2249-1260|eISSN: 2250-1819
Multimedia elements
make children more
dependants in education.
.69 .466 .87 .341 26.564 .000***
Multimedia effects
children personality.
.70 .460 .96 .206 90.641 .000***
Multimedia makes
children‘s education
limited.
.61 .492 .57 .501 .728 .395
Lack of knowledge
regarding multimedia
teachers can‘t provide
correct knowledge.
.50 .503 .83 .383 53.857 .000***
Multimedia education
effect children mind in
which case when they see
violence or negative
things in videos.
.49 .503 .74 .444 21.301 .000***
Text or graphics
sometimes does not
sufficiently explain the
definitions of new words.
.74 .440 .48 .505 13.712 .000***
(p<0.05*) & (P<0.001***)
The above table shown the significance different in multimedia elements makes children more
dependant in education, multimedia effects children personality, lack of knowledge regarding
multimedia teachers can‘t provide correct knowledge, multimedia education effect children
mind in which case when they see violence or negative things in videos, text or graphics
sometimes does not sufficiently explain the definitions of new words. No significance shown in
multimedia make children‘s education limited.
V. CONCLUSION
The results show the impact of multimedia in early childhood education. In it is clear that
multimedia makes student more physically dependent. It includes harmful effects which affect
children personality and mind too. Due to lack of knowledge in teachers regarding multimedia,
they don‘t provide correct knowledge that‘s by decreased student‘s academic achievement.
Multimedia elements not provide proper knowledge related to concepts.
REFERENCES
[1] Mccarrick, K. & Xiaoming, Li. (2007). Buried treasure: the impact of computer use on
young children‘s social, cognitive, language development and motivation. AACE Journal.
15(1). 73-95.
[2] Mishra, K. P. & Acharya, S. (2011). ICT in the early years: balancing the risk and
benefits. RIE. NCERT. Bubaneswar. Odisha. 138-143.www.riebbs.ori.nic
[3] Mishra, S. (2011). Quality dimensions of early childhood care and education concerns
and issues. RIE. NCERT. Bubaneswar Odisha.15-28. www.riebbs.ori.nic
[4] Reeves C. T. (1998). The Impact of Media and Technology in Schools. The University of
Georgia. A Research Report prepared for The Bertelsmann Foundation.
[5] Chandra, R. (2005) ‗Impact of media and technology in education. Kalpaz Publications.
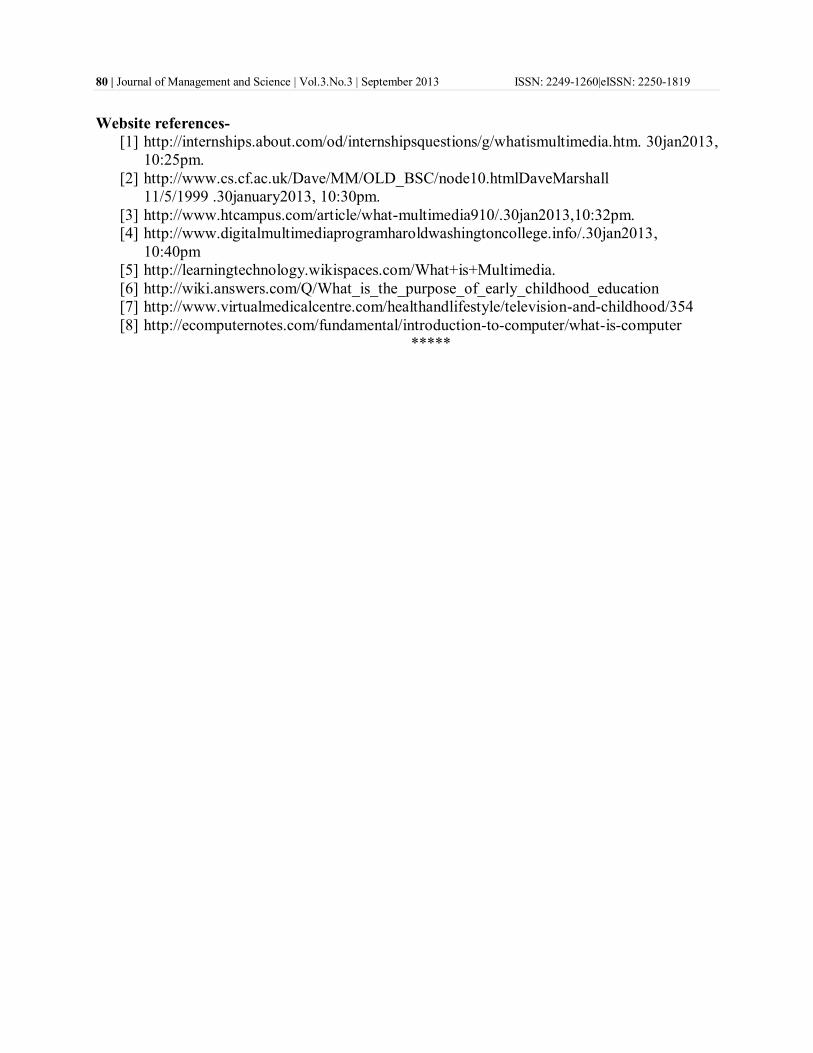
80 | Journal of Management and Science | Vol.3.No.3 | September 2013 ISSN: 2249-1260|eISSN: 2250-1819
Website references-
[1] http://internships.about.com/od/internshipsquestions/g/whatismultimedia.htm. 30jan2013,
10:25pm.
[2] http://www.cs.cf.ac.uk/Dave/MM/OLD_BSC/node10.htmlDaveMarshall
11/5/1999 .30january2013, 10:30pm.
[3] http://www.htcampus.com/article/what-multimedia910/.30jan2013,10:32pm.
[4] http://www.digitalmultimediaprogramharoldwashingtoncollege.info/.30jan2013,
10:40pm
[5] http://learningtechnology.wikispaces.com/What+is+Multimedia.
[6] http://wiki.answers.com/Q/What_is_the_purpose_of_early_childhood_education
[7] http://www.virtualmedicalcentre.com/healthandlifestyle/television-and-childhood/354
[8] http://ecomputernotes.com/fundamental/introduction-to-computer/what-is-computer
*****

81 | Journal of Management and Science | Vol.3.No.3 | September 2013 ISSN: 2249-1260|eISSN: 2250-1819
Preference and performance analysis of community college
students using Bayesian classification
S.Balaji PhD J.Senthil Kumar PhD S.K.Srivatsa PhD
Asst.Professor Asst.Professor Senior Professor
D.B.Jain College(Autonomous) D.B.Jain College(Autonomous) St.Jospeh‘s College
Chennai-97 Chennai-97 Chennai
ABSTACT: The Community College system in India aims at the empowerment of the
disadvantaged persons through appropriate skills development leading to gainful
employment..The process of predicting students preference towards the courses and analyzing
performance is the biggest challenge for the community college institutions.In
addition,community college education is booming in India.There is a need for analyzing the
preference of students to provide courses of the need. Data Mining can be used in educational
field to enhance our understanding of learning process to focus on identifying, extracting and
evaluating variables related to the learning process of students.The investigation considered the
bayes theorm based posteriori probabilities of dependent attributes.The objectives of the present
investigation were framed so as to assist the enrollment process in vocational education of
community colleges and they are:
(a) Generation of a data source of predictive variables,
(b) Identification of different factors, which effects a student‟s preference and performance
and
(c) Construction of a prediction model using classification data mining techniques on the basis
of identified predictive variables
Keywords: Data Mining;Bayes theorm;Predictive analysis.
1.INTRODUCTION
Community college system gives a second chance to those who have dropped out of
school.It provides opportunity for those who otherwise would have been excluded[12]. In
information systems, classification is one of the key parts for data mining. Such analysis can
provide us with a better understanding of the important data classes and predict current and
future data trends. The ability to predict/classify a student‘s performance is very important in
community college.The community college having vocational education programmes aimed at
three target groups-tenth failed (Primary),tenth passed/Twelth failed(secondary) and twelth
passed(higher secondary).The courses for this group can be considered as computer
courses,Technician courses and Hand_made_training courses.The computer courses taught are
Diploma in DTP Operator (DDTP),Diploma in Animation,Diploma in Computer
Applications,Diploma in Multimedia System and Diploma in Computer Hardware Servicing
(DCHS).The programmes under Technician category are Diploma in Refrigeration and Air
Conditioning Technician (DRAT),Diploma in House Electrician (DHE),Diploma in Plumbing
Technician (DPT),Diploma in Four Wheeler Mechanism (DFWM),Diploma in Mobile Phone

82 | Journal of Management and Science | Vol.3.No.3 | September 2013 ISSN: 2249-1260|eISSN: 2250-1819
Servicing and Diploma in Home Appliances Repair and Servicing.The Hand_made_training
courses covers the programmes such as Diploma in Catering Assistant (DCA),Diploma in
Fashion Design and Garment Making (DFGM),Diploma in Health Assistant (DHA),Diploma in
Early Childhood Care and Education (Kindergarten),
Diploma in Beautician,Diploma in Bakery and Confectionery and Diploma in Food
Production.The primary objective of community college system is to provide life,quality
education for the needy by removing blockades age bar and minimum qualification.With the
changing scenario in the industry and job markets there is a need for identifying the preferences
of community college students towards courses and providing the apt course based on
demographic and socio-economic variables. In addition,the factors that affect the performance of
students in terms of upward and downward trends in results can also be identified to make
remidal measures for their upliftment. A very promising arena to attain this objective is the use
of Data Mining (DM) [1].
2, RELATED WORK
Data Mining can be used in educational field to enhance our understanding of learning
process to focus on identifying, extracting and evaluating variables related to the learning
process of students as described by Alaa el-Halees [11]. Mining in educational environment is
called Educational Data Mining.
Han and Kamber [10] describes data mining software that allow the users to analyze data from
different dimensions, categorize it and summarize the relationships which are identified during
the mining process.
In fact, one of the most useful Data mining tasks in education applications is classification.
There are different educational objectives for using classification, such as: to discover potential
student groups with similar characteristics and reactions to a particular pedagogical strategy [2],
to detect students‘ misuse or game-playing [2], to group students who are hint-driven or failure-
driven and find common misconceptions that students possess [3], to identify learners with low
motivation and find remedial actions to lower drop-out rates [4], to predict/classify students
when using intelligent tutoring systems [5], etc. And there are different types of classification
methods and artificial intelligent algorithms that have been applied to predict student outcome,
marks or scores. predicting student academic success (classes that are successful or not) using
discriminant function analysis [6]; classifying students using genetic algorithms to predict their
final grade [7]; predicting a student‘s academic success (to classify as low, medium and high risk
classes) using different data mining methods [8]; predicting a student‘s marks (pass and fail
classes) using regression techniques in Hellenic Open University data [9].
Pandey and Pal conducted study on the student performance based by selecting sixty students
from a degree college of Dr. R. M. L. Awadh University, Faizabad, India. By means of
association rule they find the interestingness of student in opting class teaching language[13].
Hijazi and Naqvi conducted as study on the student performance by selecting a sample of 300
students (225 males, 75 females) from a group of colleges affiliated to Punjab university of
Pakistan. The hypothesis that was stated as "Student's attitude towards attendance in class, hours
spent instudy on daily basis after college, students' family income, students' mother's age and
mother's education are significantly related with student performance" was framed. By means of
simple linear regression analysis, it was found that the factors like mother‘s education and
student‘s family income were highly correlated with the student academic

83 | Journal of Management and Science | Vol.3.No.3 | September 2013 ISSN: 2249-1260|eISSN: 2250-1819
performance[14].Brijesh et al work based on the student database to predict the students division
on the basis of previous database using decision tree. Information‟s like Attendance, Class test,
Seminar and Assignment marks were collected from the student‟s previous database, to predict
the performance at the end of the semester[18].
Galit gave a case study that use students data to analyze their learning behavior to predict the
results and to warn students at risk before their final exams[15].
On-line collaborative discussions have significant role in distance education courses. Automatic
tools for assessing student activities and promoting collaborative problem solving can offer an
improved learning practice for students and also offer useful assistance to teachers. Researchers
developed a specific mining tool for making the configuration and execution of data mining
techniques easier for instructors and in
order to be of use for decision making, using real data from on-line courses [16][17].
In this paper,we considered the factors that influence the students preference towards the
courses of community colleges and their performance in end semester results.The impact of
socio-economic,demographic and academic attributes were considered for investigation.
3. NAIVE BAYES METHODOLOGY
Navie Bayes is the basis for many machine learning and data mining methods.In
Bayesian classification is a classification method is applicable for huge dataset.Naive Bayesian
classifier works with hypothesis H such as that the data tuple X belongs to a specified class
C.The determination of P(H/X) that the hypothesis H holds given the evidence or observed data
tuple X..P(H/X) is the posterior probability of H conditioned on X.Bayes‘ theorem is useful in
that it provides a way of calculating the posterior probability ,P(H/X) ,from P(X/H) and P(X),
Bayes theorem is
P(H/X)=P(X/H)P(H)/P(X).
The naive Bayesian classifier, or simple Bayesian classifier, works as follows:
1. Let D be a training set of tuples and their associated class labels. As usual, each tuple is
represented by an n-dimensional attribute vector, X=(x1, x2,…, xn), depicting n
measurements made on the tuple from n attributes, respectively, A1, A2,.., An.
2. Suppose that there are m classes, C1, C2,…, Cm. Given a tuple, X, the classifier will predict
that X belongs to the class having the highest posterior probability, conditioned on X. That is, the
naïve Bayesian classifier predicts that tuple x belongs to the class Ci if and only if
P (Ci|X)>P (Cj|X) for 1≤ j≤m, j ≠ i
Thus we maximize P(Ci|X). The class Ci for which P(Ci|X) is maximized is called the maximum
posteriori hypothesis. By Bayes‘ theorem
3. As P(X) is constant for all classes, only P (X|Ci) P (Ci) need be maximized. If the class prior
probabilities are not known, then it is commonly assumed that the classes are equally likely, that
is, P(C1)=P(C2)
=…=P(Cm), and we would therefore maximize P(X|Ci). Otherwise, we maximize P(X|Ci)P(Ci).
Note that the class prior probabilities may be estimated by P(Ci)=|Ci,D|/|D|, where |Ci,D| is the
number of training tuples of class Ci in D.
4. Given data sets with many attributes, it would be extremely computationally expensive to
compute P(X|Ci).
In order to reduce computation in evaluating P(X|Ci), the naïve assumption of class conditional
independence is made. This presumes that the values of the attributes are conditionally

84 | Journal of Management and Science | Vol.3.No.3 | September 2013 ISSN: 2249-1260|eISSN: 2250-1819
independent of one another, given the class label of the tuple (i.e., that there are no dependence
relationships among the attributes). Thus,
=P(x1|Ci)x P(x2|Ci)x… P(xm|Ci).
We can easily estimate the probabilities P(x1|Ci), P(x2|Ci),… ,P(xm|Ci) from the training tuples.
Recall that here xk refers to the value of attribute Ak for tuple X.
For instance, to compute P(X|Ci), we consider the following:
(a) If Ak is categorical, then P(Xk|Ci) is the number of tuples of class Ci in D having the value
xk for Ak, divided by |Ci,D|, the number of tuples of class Ci in D.
(b) If Ak is continuous valued, then we need to do a bit more work, but the calculation is pretty
straightforward. A continuous-valued attribute is typically assumed to have a Gaussian
distribution with a mean μ and standard deviation σ, defined by
g(x,,μ,σ)=1/¬2Д σ e-(x- μ)2/2 σ2
So that
P(xk|Ci)=g(xk, μci, σci)
We need to compute μci and σci, which are the mean and standard deviation, of the values of
attribute Ak for training tuples of class Ci. We then plug these two quantities into the above
equation.
5. In order to predict the class label of X, P(X|Ci)P(Ci) is evaluated for each class Ci. The
classifier predicts that the class label of tuple X is the class Ci if and only if
P(X|Ci)P(Ci)>P(X|Cj)P(Cj) for 1 ≤ j ≤ m, j ≠ i
In other words, the predicted class label is the class Ci for which P(X|Ci)P(Ci) is the
maximum.Bayes‘ theorem assumes that all attributes are independent and that the traning sample
is a good sample to estimate probabilities.
4. EXPERIMENT AND ITS RESULTS
4.1 Data Preparation
Our dataset considers the students data from Fourteen ommunity colleges in Chennai and
Kanchipuram districts of seven each.The dataset having students strength of Three hundred
admitted during calendar year admissions of 2011-2012.
4.2 Data selection and Transformation
Data cleaning processes enable us to fill in missing values,reduce noise while
recognizing outliers, and accurate inconsistencies in the data (Han J. and Kamber M. 2008).It is
known that too many attributes involved will very possibly result in discovered information that
is difficult to interpret, or even meaningless. The first task is to remove from the dataset those
fields/ attributes/ variables which were irrelevant to the task of analysis.The attributes such as
community college code,caste,attendance and date of birth were not considered.Therefore, by in-
depth discussion with domain managers, we eliminated some of the attributes and finally came to
a conclusion of 9 attributes, namely 1)Place of residence 2)Gender 3) Marital_status
4)Qualification5)Life_generation 6)Employment_status 7)Course_opted
8)Family_financial_status&9)Result_division.The data transformation task is data
generalization,where low-level or primitive data are substituted by higher-level concepts during
the use of concept hierarchies (Han J. and Kamber M. 2008). In the working set,eighteen

85 | Journal of Management and Science | Vol.3.No.3 | September 2013 ISSN: 2249-1260|eISSN: 2250-1819
vocational courses of community college stream fall in three categories. The Eighteen different
vocational courses taught under community college is being brought under three different
classification such as Computer courses,Hands_on_skill and Technician courses.Students
academic performance and their preferences towards the courses is analysed with
demographic,academic and socio-economic variables.
Given a training set the naïve Bayes algorithm first estimates the prior probability P (Cj) for each
class by counting how often each class occurs in the training data. For ach attribute value xi can
be counted to determine P (xi). Similarly the probability P (xi | Cj) can be estimated by counting
how often each value occurs in the class in the training data. When classifying a target tuple, the
conditional and prior probabilities generated from the training set are used to make the
prediction. The present investigation used data mining as a tool with naïve Bayes classification
algorithm as a technique to design the student performance and preference prediction model.
Filtered feature selection technique was used to select the best subset of variables on the basis of
the values of probabilities.
Our Bayesian approach based model makes prediction analysis with maximum posteriori
hypothesis.Posteriori probabilities of independent variables for the dependent class of
result_division attribute is given table 4.1.
Table 4.1 Probabilities of Independent attributes on dependent attribute result_division
Slno Attribute Probability
1 Gender 0.37766
2 Marital_status 0.29638
3 Finacial_status 0.25378
4 Course_opted 0.19186
5 Life_generation 0.13702
6 Qualification 0.12216
7. Employment_status 0.05401
8. Place_of_residence 0.00369
In order to predict students performance in end_semester is observed with attributes whose
probability is greater that 0.30.In the above study,the attributes Gender and Marital_status are the
highly influencial variables to predict the dependent attribute result _division score of the
students of the community college.

86 | Journal of Management and Science | Vol.3.No.3 | September 2013 ISSN: 2249-1260|eISSN: 2250-1819
The relationship between the highly influencial attribute gender and dependent attribute
divison_obtained is shown in Figure 4.1.From the figure it is evident that female students highly
dominated in C-grade where as male student groups equally dominated in A and B-grades.
The preference towards the dependent attribute course is decided by independent attributes and
their corresponding posteriori probabilities are given in table 4.2.
Table 4.2 Probabilities of Independent attributes on dependent attribute course_opted
Slno Attribute Probability
1 LIFE_GEN 0.2749
2 M_STATUS 0.2506
3 DISTRICT 0.1919
4 DIV 0.1919
5 F-INCOME 0.1183
6 QUALI 0.094
7 EMP 0.0258
8 GENDER 0.0258
From table 4.2,It is evident that the attributes Life_generation and M_status are the highly
influencial variables to predict the course_opted by the student.
The figure 4.2 shows the effect of independent attribute Life_generation which has highest
probability dependent attribute grade score.Youth ones are the most predominate score in grade
A .Grade B is scored by Middle age groups followed by senior age ones,where as senior age
Figure 4.1 Gender impact on
Division_scored
0
20
40
60
80
100
A B C
Grade/Division_scored
Gend
er_va
lues
M
F

87 | Journal of Management and Science | Vol.3.No.3 | September 2013 ISSN: 2249-1260|eISSN: 2250-1819
groups normally score symmetric performances in all divisions.From the study of this paper,it is
observed that the preference of community college students towards the course are not always
depending on their own effort,the impact of life generation has the impact on it.In addition,the
present study outlines the dependentability of gender and Marital_status and its impact on
academic performances of the students. The life_generation of candidate has an major impact of
course preferences of stundents followed by marital status of
the candidate.This proposal will improve the insights over existing methods.
5. CONCLUSION
The interesting possibilities for the education domain can be achieved with the help of highlevel
extraction of knowledge from raw data using datamining techniques.This study was based on
very specific to vocational courses of community colleges.The students preference towards the
vocation courses was observed with Bayesian approach based on demographic and socio-
economic variables. The preliminary results presented in this paper give us a first indication on
how the information of community college students can be used to enhance better enroll and
improve the performance of students as a result of data mining technique.The behaviour of
stakeholders can be predicted with a greater degree of accuracy with the models that predict
hidden patterns in large databases of community colleges and universities .These predictive
models will help educational institutions like community colleges to address issues of students
enrollement,performance and better reach of education to the needy.
6. REFERENCES
[1].Romero, C., Ventura, S. Educational Data Mining: a Survey from 1995 to 2005. Expert
Systems with Applications, 2007, 33(1), pp.135-146
[2] Baker, R., Corbett, A., Koedinger, K. Detecting Student Misuse of Intelligent Tutoring
Systems. Intelligent Tutoring Systems. Alagoas, 2004. pp.531–540.
[3].Yudelson, M.V., Medvedeva, O., Legowski, E., Castine, M., Jukic, D., Rebecca, C. Mining
Student Learning Data to Develop High Level Pedagogic Strategy in a Medical ITS. AAAI
Workshop on Educational Data Mining, 2006. pp.1-8.
[4]Yudelson, M.V., Medvedeva, O., Legowski, E., Castine, M., Jukic, D., Rebecca, C. Mining
Student Learning Data to Develop High Level Pedagogic Strategy in a Medical ITS. AAAI
Workshop on Educational Data Mining, 2006. pp.1-8.
[5].Hämäläinen, W., Vinni, M. Comparison of machine learning methods for intelligent tutoring
systems. Conference Intelligent Tutoring Systems, Taiwan, 2006. pp. 525–534.
[6].Martínez, D. Predicting Student Outcomes Using Discriminant Function Analysis. Annual
Meeting of the Research and Planning Group. California, 2001. pp.163-173.
[7].Minaei-Bidgoli, B., Punch, W. Using Genetic Algorithms for Data Mining Optimization in an
Educational Web-based System. Genetic and Evolutionary Computation, Part II. 2013. pp.2252–
2263.
[8].Superby, J.F., Vandamme, J.P., Meskens, N. Determination of Factors Influencing the
Achievement of the First-year University Students using Data Mining Methods.Workshop on
Educational Data Mining, 2011. pp.37-44.

88 | Journal of Management and Science | Vol.3.No.3 | September 2013 ISSN: 2249-1260|eISSN: 2250-1819
[9].Kotsiantis, S.B., Pintelas, P.E. Predicting Students Marks in Hellenic OpenUniversity.
Conference on Advanced Learning Technologies. IEEE, 2005. pp.664- 668.
[10].U. Fayadd, Piatesky, G. Shapiro, and P. Smyth, From data mining to knowledge discovery
in databases, AAAI Press / The MIT Press, Massachusetts Institute Of Technology. ISBN 0–262
56097–6, 1996.
[11] J. Han and M. Kamber, ―Data Mining: Concepts and Techniques,‖ Morgan Kaufmann,
2000.
[12].Fr.Xavier Alphone.S.J,Journal of Christan Manager,2008,pp.20-25.
[13.] Pandey, U. K. and Pal, S., ―A Data Mining View on Class Room Teaching Language‖,
(IJCSI) International Journal of Computer Science Issue, Vol. 8, Issue 2, March -2011, 277-282,
ISSN:1694-0814.
[14.] Hijazi, S. T., and Naqvi, R.S.M.M., ―Factors Affecting Student‘s Performance: A Case of
Private Colleges‖, Bangladesh e-Journal of Sociology, Vol. 3, No. 1, 2006.
[15]. Galit.et.al, ―Examining online learning processes based on log files analysis: a case study‖.
Research, Reflection and Innovations in Integrating ICT in Education 2007.
[16]. Romero C., Ventura S., Espejo P. and Hervas C., Data Mining Algorithms to Classify
Students, Proceedings of Educational Data Mining , The 1st International Conference on
Educational Data Mining Montreal, Quebec, Canada, June 20-21, 2008 pp. 8-17.
[17]. Vasile Paul Bresfelean, Data Mining Applications in Higher Education and Academic
Intelligence Management, Theory and Novel Applications of Machine Learning,2009,pp.209-
228.
[18]. Brijesh Kumar Baradwaj, Saurabh Pal, Mining Educational Data to Analyze Students‟
Performance, International Journal of Advanced Computer Science and
Applications,2011,vol.2.No.6,pp.63-69.
*****

89 | Journal of Management and Science | Vol.3.No.3 | September 2013 ISSN: 2249-1260|eISSN: 2250-1819
Relationship Marketing: A competitive Marketing Strategy-
It’s Importance, Nature and Need: A Review
Jiwan Jyoti
Kurukshetra University,Kurukshetra, 136118,India
ABSTRACT: In today‟s intense competition, it is very important for any business organization
to keep their customers otherwise the competitors will attract them as business is all about
creating customer, satisfying a customer and retaining a customer. Increasing inflation rate,
increasing rate of interests, hike in fuel prices, global slowdown in economic growth are a few
reasons of worry for the companies to think differently to maintain their sales and profit. The
business organizations are struggling for their survival and sustainable growth. On the other
hand, the new economic policy of India has also opened its trade for the multinational
companies. Therefore companies are trying to do something by which they can keep their
customers and it is the Relationship Marketing which helps the companies to do so. It is an
important tool for strategic competition management. As it is well known fact that a satisfied and
loyal customer brings three new customers, therefore companies try all their efforts to maintain
good relations with its customers. They are providing value for their money & efforts, they are
providing information about their actions, they are inviting them for feedback etc.
Key words: Customer Retention, Channel Partnership, Emotional Bonding, Customer Loyalty,
Customer Expectation.
1. INTRODUCTION
Relationship marketing was first defined as a form of marketing developed from direct response
marketing campaigns which emphasizes customer retention and satisfaction, rather than a
dominant focus on sales transactions. As a practice, relationship marketing differs from other
forms of marketing in that it recognizes the long term value of customer relationships and
extends communication beyond intrusive advertising and sales promotional messages.
Relationship marketing has been positioned variously between being a set of marketing tactics,
in which any interaction between buyers and sellers is described as a relationship, regardless of
the parties‘ affective commitment to each other, and a fundamental
marketing philosophy which goes to the core of the marketing concept through its customer
lifetime focus (Gummesson, 1999).
Relationship marketing is often defined as ―a synthesis of marketing, customer service
and quality management‖ (Christopher, Payne and Ballantyne 1991). It involves cultivating the
right kind of relationships with the right constituent groups. The ultimate outcome of relationship
marketing is the building of a unique company asset called a marketing network. A marketing
network consists of the company and its supporting stakeholders (customers, suppliers,
employees, distributors, retailers, ad agencies, and others) with whom it has built mutually
profitable business relationships (Kotler, 2006). The move from transactional to relational
exchange and relationship marketing has resulted in a shift in emphasis in both marketing theory
and practice.
Relationship marketing is emerging as the core marketing activity for businesses
operating in fiercely competitive environments. On average, businesses spend six times more to

90 | Journal of Management and Science | Vol.3.No.3 | September 2013 ISSN: 2249-1260|eISSN: 2250-1819
acquire customers than they do to keep them. Therefore, many firms are now paying more
attention to their relationships with existing customers to retain them and increase their share of
customer‘s purchases. Worldwide service organizations have been pioneers in developing
customer retention strategies. Banks have relationship managers for select customers, airlines
have frequent flyer programs to reward loyal customers, credit cards offer redeemable bonus
points for increased card usage, telecom service operators provide customised services to their
heavy users, and hotels have personalized services for their regular guests.
Relationship Marketing involves building relationships at many levels –economic, social,
technical and legal resulting in high customer loyalty. It involves database marketing, interaction
marketing and network marketing. Smart companies capture information at every possible touch
point. Data base marketing integrates everything that a company‘s sales, service and marketing
teams know about individual customers to provide a 360-degree view of customer relationship.
With the use of CRM (customer relationship management) it pulls together, analyses and
provides easy access to customer information from all of various touch points (Kotler, P., Wong,
V., Saunders, J., and Armstrong, G.,2005). Interactive marketing focuses on the organizations
interactions with consumers on various touch points like service and support calls, website visits,
satisfaction surveys, market research studies, introduction of loyalty cards like Sainsbury
collaborating with Nectar.
2. HISTORICAL PERSPECTIVE
Researchers argue that RM represents a ―paradigm shift in marketing‖ from its previous focus on
―transactions,‖ in which firms use the ―4P model‖ to manage marketing-mix variables (Gronroos
1994, p. 4; Sheth and Parvatiyar 2000). But is RM really a new phenomenon? What underlying
trends or factors drive such a change? To answer these questions, this text offers a historical
perspective of marketing thought and practice. Researchers have made the compelling case that
relational-based exchange was the norm for most of recorded history; the anomaly of
transaction-based marketing emerged only in the early 1900s. Thus, relationship marketing ―is
really a rebirth of marketing practices of the pre-industrial age‖ (Sheth and 2006). Thus, not
surprisingly, research and practice in services, business-to business, and channels contexts often
include relational constructs. Early research in the service context also provides the roots for
many key RM concepts (Berry 1983; Berry 1995). In reality, relationship marketing and
branding strategies that focus on building brand equity also overlap.
Researchers suggest that relationships and brands represent two critical sources of intangible,
market-based assets that can be leveraged into superior financial performance (Srivastava,
Shervani, and Fahey 1998). But brand equity represents the differential effect of brand
knowledge on customer action, such that customers behave more favorably toward a product
when they can identify the brand (Keller 1993). Others argue that brand equity may be ―a
fundamentally product-centered concept‖ that does not capture drivers of customer behavior
fully (Rust, Lemon, and Zeithaml 2004, p.110). Although RM and branding activities similarly
focus on building intangible customer assets that positively influence customer loyalty, purchase
behaviours, or financial performance while reducing marketing costs, they differ fundamentally
in that branding focuses on ―product(s)‖ with extensions to the firm, whereas RM primarily
focuses on ―relationship(s)‖ and their extensions to the firm. The distinction between branding
and RM remains clear at the core level of products versus relationships, but as customers develop
attitudes toward and beliefs about the overall firm, the individual impact of brands and
relationships becomes difficult to separate. Thus, overall customer equity is generated from both

91 | Journal of Management and Science | Vol.3.No.3 | September 2013 ISSN: 2249-1260|eISSN: 2250-1819
brand equity and relational equity. The relative importance of brands compared with
relationships often depends on the context and/or the researcher‘s perspective. For example,
when a survey asks a customer to report on his or her ―trust in a firm,‖ the question comprises
both product and relationship-based trust. Differentiating brands and relationships pragmatically
requires identifying the constructs measured and the focal referent of the construct; that is,
relationship marketing focuses on the relationship (versus product) and measures relational
characteristics such as trust, commitment, reciprocity norms, cooperation, and conflict.
3. IMPORTANCE OF RELATIONSHIP MARKETING
Relationship marketing has the aim of building mutually satisfying long-term relationships with
key-parties-customers, suppliers, distributors, and other marketing partners- in order to earn and
retain business. Relationship marketing builds strong economic, social, technical ties among
parties (Kotler, 2006). The simplest reason why firms seek to develop ongoing relationships with
their customers is that it is generally much more profitable to retain existing customers than
continually seeking to recruit new customers to replace lapsed ones (Palmer, 2001). Relationship
marketing can be beneficial to the organization as well as to the consumers. From the firms
perspective it helps to earn customer loyalty and customer retention. This can be done by
primarily adding financial benefits to customer relationship. For example airlines offer frequent-
flyer programmes, hotels give room upgrades to their frequent guests and supermarkets give
patronage refunds. All these help in gaining customer loyalty, which in turn brings financial
benefits to the firm. From the customers perspective it brings them psychological as well as
rational benefits. A brand like Nike gives its customers more than just a athletic gear, beyond
shoes, apparel and equipment Nike markets a way of life, a sports culture, a ‗Just do it!‘ attitude.
Brands like Mc Donald‘s, Starbucks provide a sense of genuine customer involvement. At a store
like Apple customers can just try out and see which electronic products they are interested in and
accordingly make a purchase. At Subway customers can create their own sandwich with
whatever they like! All these interactions with the customers just bring them emotional
pleasures.
4. The Nature of Relationship Marketing
Understanding relationship marketing requires distinguishing between the discrete transaction,
which has a "distinct beginning, short duration, and sharp ending by performance," and relational
exchange, which "traces to previous agreements and is longer in duration, reflecting an ongoing
process. Categorized with reference to a local firm and its relational exchanges in supplier,
lateral, buyer and internal partnerships.
Fig.1 The Relational Exchanges in Relationship Marketing

92 | Journal of Management and Science | Vol.3.No.3 | September 2013 ISSN: 2249-1260|eISSN: 2250-1819
Figure 1 shows ten discrete forms of relationship marketing: (1) the partnering involved in
relational exchanges between manufacturers and their goods' suppliers, as in "just-in-time"
procurement and "total quality management" (Frazier, Spekman, and O'Neal 1988; O'Neal
1989); (2) relational exchanges involving service providers, as between advertising or marketing
research agencies and their respective clients (Beltramini and Pitta 1991; Moorman, Zaltman,
and Deshpande 1992); (3) strategic alliances between firms and their competitors, as in
technology alliances (Nueno and Oosterveld 1988); co-marketing alliances (Bucklin and
Sengupta 1993); and global strategic alliances (Ohmae 1989); (4) alliances between a firm and
non profit organizations, as in public purpose partnerships (Steckel and Simons 1992); (5)
partnerships for joint research and development, as between firms and local, state, or national
governments (Comer, O'Keefe, and Chilenskas 1980); (6) long-term exchanges between firms
and ultimate customers, as particularly recommended in the services marketing area (Berry
1983); (7) relational exchanges of working partner-ships, as in channels of distribution
(Anderson and Narus 1990); (8) exchanges involving functional departments (Ruekert and
Walker 1987); (9) exchanges between a firm and its employees, as in internal marketing (Arndt
1983; Berry and Parasuraman 1991); and (10) within-firm relational exchanges involving such
business units as subsidiaries, divisions, or strategic business units (Porter 1987).
Though adequately conceptualizing relationship marketing requires a definition that
accommodates all forms of relational exchanges, extant definitions cover some kinds but not
others. For example, in the services marketing area, Berry( 1983, p. 25) states, "Relationship
marketing is attracting, maintaining and-in multi-service organizations-enhancing customer
relationships" and Berry and Parasuraman (1991, p. 133) propose that "relationship marketing
concerns attracting, developing, and retaining customer relationships.
5. RELATIONSHIP MARKETING IN PRACTICE
A good product or service should back a good relationship. A relationship is a mutual give and
take. A relation occurs when the transaction occurs. However, transaction focus is mechanical
and with human relations the managers cannot be mechanical. It is beneficial for both
individuals, in good and bad times. If we take the example hotels, one hotel defines the elements
of a good relation to be honesty, transparency, be forthright, and not differentiate between Indian
and foreign customers. Expenses are not the focus in RM; facility development and provision is
basic to RM, the focus is that the ‗Customer should not suffer‘. The hotels act as solution
providers.
One hotel for example provided wireless Internet connectivity, corporate loyalty
programs, and international AVIS tie-ups. RM is very strong in hotels; it exists from Secretaries
to CEOs. RM efforts are directed at CEOs, government, decision making people in
organizations, ancillaries, related businesses, dealers, individual travellers, travel agents,
upmarket socialites. RM efforts are also targeted at the officials who are in charge of bookings.
Even a standard smile builds a relationship. Relation development takes place both through
personal relation building and word-of-mouth relationships. In some hotels there are dedicated
RM executives, RM managers who take care of account management of customers on an ABC
classification.
In other hotels, the entire sales team is relationship building. In one hotel, one sales
manager acts as the one source answer to around 120 companies. Trust in RM is very important.
In some hotels this is the main focus. It needs to go along with commitment. It needs to develop
93 | Journal of Management and Science | Vol.3.No.3 | September 2013 ISSN: 2249-1260|eISSN: 2250-1819
with the business. If deliverable is good then trust increases. There is no explicit buy in of
customer; however the relationships are so well nurtured that the customer automatically buys.
There is no need of selling after that. The switching costs are increased so that the customer is
retained. The switching costs may be increased by emotional lock-ins, good experiences,
excellent conferencing facility, holidaying for executives‘ etc. In one hotel the concept is of
ultimate service and they have won global awards for ultimate service. Such hotels do not focus
on relationship marketing efforts but expect the customer to buy from them in a repeated manner
owing to their ultimate service. Employees are empowered to decide that will reflect a sense of
willingness to deliver impeccable service. Such organizations are very strong in operations and
relationship marketing is only a small part of the customer pleasing process. Hotels offering
ultimate service are part of a larger group of hotels offering value (through products, technology,
and security) service quality.
The role of RM is to take care of emotional well being of customer. This is an important
role of RM in marketing strategy. The emotional quotient level is high in the hotel business.
Protecting emotional well being is linked to building trust. In one 5 star hotels for example, they
take care of health – one Indian hotel calls Thailand massage experts to relieve stress of its
guests who travel across countries and are subjected to stress. In another hotel they strive to
provide the best security systems with good floor security, CCTV. There are also periodic reports
on food tests on whatever is eaten to say that they care for the customer. Another hotel went all
the way with police procedures to retrieve a stolen / misplaced item of a client who held a
wedding party in a hotel. Relationships with the government are also important. In one hotel,
there were 70 licenses allotted to run the hotel. Relationships with the government lead to
important information, which can lead to advantages.
One example is of a hotel that got advance information through a relationship of the
location of an international airport and bought land at a low price. Apart from relationships with
government, external partnerships with vendors, food sampling and testing through microbiology
sections, employee satisfaction, senior citizen package etc help improve company image in the
market. It is not possible to displease the customer and maintain effective ongoing relationships.
Customer retention is a very important part of RM and is the link to relationship management. In
one hotel for example at one point of time there are 158 Managers from 130 companies to be
serviced and every care should be taken that the customers are simultaneously well serviced.
Customer acquisition is also important and is normally more expensive. RM also helps
understand and track customer psyche and its changes based on which customer value
propositions can be built. They also try to customize offerings based on their understanding of
the customer psyche. RM programs in hotels include loyalty programs (dedicated loyalty
programs are sometimes included), frequency marketing, tie-up with credit card companies,
database marketing (local and central databases, segment focus), direct marketing, guest
relationship program, preferred partner programs (one hotel had 350 preferred partners in city),
direct email, newsletter, food festivals. Relationships are also driven by rate fixing for room rent,
which goes on a variable rate depending on the business.
Customer management practices in one hotel includes (a) communication starting with
RM manager (b) broadband facilities (c) complementary cocktail hour (d) complementary
boardroom facility (e) international newspaper (f) Japanese breakfast (g) capture of customer
profile and appropriate reactions. One hotel gave a helping hand to customers who stayed with
them a long time for settling in a new home. Relationship marketing efforts give feedback for
strategic decisions such as (1) opening up of new hotel, (2) start of new advertising campaign,

94 | Journal of Management and Science | Vol.3.No.3 | September 2013 ISSN: 2249-1260|eISSN: 2250-1819
(3) competition action / reactions to be made. RM is normally expected to improve profitability,
though it is the long-term profitability and not the short-term profitability that is expected to
improve. The improvement in profitability also comes from the elements of trust. RM managers
gather market intelligence and give market information advantages to strategic marketers, which
enable better adjustments of the firm to the market over time. RM managers work on experience,
that is the basic thrust. RM helps the seller to guide the moments of truth in his favour. The
revolutionary thought in relationship marketing is to give what the customer wants and not what
the selling firm wants.
6. WHY DO COMPANIES NEED RELATIONSHIP MARKETING?
The global economy is again on a roller coaster. Global crisis which started in 2008 is still
affecting the whole world. In G20 summit at France, the main issues were related to global
slowdown especially latest crisis in Greece and Europe. India cannot remain in isolation. It is
also affected by European crisis. This is one of the reasons why the export is declining in last
quarters. Data released by the commerce and industry ministry on Nov 8th 2011 showed India‘s
exports fell to a 12 months low of $ 19.9 billion in October 2011 pushing trade deficit to a four
year high of $ 19.6 billion. Apart from this global slowdown we can summarise a few other
reasons why do a company need relationship marketing:
Increasing inflation rate
Increasing rate of interests
Hike in fuel prices
Customers are becoming smarter and choosy
Customers are well informed due to social networking and media awareness
Cut throat competition
Globalization and entry of MNCs
Availability of substitute brands
Low margin of profit
Emerging rural market
Emerging organized retailing
New legal threats like competition bill and other proposed company bill
Environment threats etc.
The following figure shows the fundamentals of Relationship Marketing.

95 | Journal of Management and Science | Vol.3.No.3 | September 2013 ISSN: 2249-1260|eISSN: 2250-1819
These are a few reasons of worry for the companies to think differently to maintain their sales
and profit. On the other hand, the new economic policy of India which is based on LPG has also
opened its trade for the multinational companies. MNCs are coming. Government is planning for
FDI in multi brand retailing while single brand retailing already had a provision of 100% FDI.
Companies are facing tuff competition. There is a clutter of brands available to customers as a
substitute. Therefore customers are free to bargain and negotiate to choose the best option which
ultimately reduces the profit of margin too. According to the provisional data available of the
15th Census 2011, India now has a population of 1.21 billion, comprising 624 million males and
587 million females. The preliminary figures of the census 2011 show that India‘s literacy rate
has gone up from 63.83% in 2001 to 74.04% in 2011. Male literacy and female literacy stand at
82.14% and 65.46% respectively. Literates constitute 74% of population aged seven and above.
This change in demographic environment shows that customers are becoming more literate and
educated which makes them smarter & informative and companies are having big potential
market to tape too even rural population has grown up. Social networking and media coverage
has connected the whole world. Anything happens in the one corner of the world affects the
other corner too. We have seen the recent developments in gulf countries which started one by
one. Even Michel Dell in his visit to Bangalore recently in Jan 2012 said,‖ social media has
enhanced relations with customers‖. His company has two billion interactions with customers
through social media. Emerging organized retailing format is also a cause for adopting
relationship marketing by the traditional marketers. New laws and legal developments for saving
interests of customers, environment threats which compel companies to produce eco friendly
products is also one of the concerns. Inflation is out of control. Inflation rate is almost equal to or
above 9 % for last 11 months. Fuel prices are increasing day by day. RBI has increased 13 times
Repo rate as well as reverse Repo rate but it is unable to manage the increasing rate of inflation.
This is also keeping customers away from their shopping habit. Impulse buying is gone,
customers are very choosy. Shopping is not done as a fashion or time pass but only when it is
needed. The business organizations are struggling for their survival and sustainable growth.
Therefore companies are trying to do something by which they can keep their customers and it is
the Relationship Marketing which helps the companies to do so.
7. IMPORTANCE OF SERVICE QUALITY FOR MAINTAINING RELATIONSHIPS
WITH CUSTOMERS
Service quality is often posited in the literature as an antecedent of customer/service Satisfaction.
According to Coulter and Coulter (2002), a ―service‖ is defined as, ―any act or performance that
one party can offer to another that is essentially intangible, and does not result in the ownership
of anything‖. Unlike physical products, services (as products) cannot be seen, tasted, felt, heard,
or smelled before they are bought (Parasuraman et al., 1985). Because of a service‘s
intangibility, clients are often faced with not knowing what to expect of a service until they have
tried that service. And since there are costs associated with trying services, clients perceive
services as risky. In the financial services industry, the provision and delivery of services
involves a variety of dimensions a variety of interactions between providers and customers. In
particular, personnel are instrumental in the creation and provision of service quality and, in
doing so, they need to ‗care‘ for the customer. Fig. 2 shows Effect of service quality on building
relationship quality.

96 | Journal of Management and Science | Vol.3.No.3 | September 2013 ISSN: 2249-1260|eISSN: 2250-1819
Figure.2 Effect of service quality on building relationship quality
The concept of service quality is concerned with customer satisfaction: putting the customer first,
anticipating needs and problems, tailoring products and services to meet needs and problems,
and being ‗nice‘ to the customer. It also includes: service to the customer, delivery operations,
employee relationships with customers, and internal relationships between employees and
management.
Service quality for the customer requires an organization to pay attention to its
products/services, delivery systems, delivery environment, technology and employees, which are
highly interdependent.
Product/service range: This will include both basic products and augmented service offerings.
Delivery systems: Delivery systems and procedures need to operate efficiently they should be
responsive and reliable.
Technology: It may be integral to a service product, its environment and delivery, and in
financial services recent technological advances have made major contributions to facilitating
customer-company exchanges and to increasing levels of service.
For example, mechanization and computerization can increase speed, efficiency and accuracy of
service. Technology will not replace people in the provision of financial services, and ‗high tech‘
and ‗high touch‘ go hand in hand, with enhanced use of technology acting as a basis for the
provision of better personal service.
Employees: The role of employees in customer care cannot be overstated and includes their
personal qualities, ability to understand and satisfy customer needs, and their skills and
knowledge- including flexibility. Key characteristics for employees to perform effectively may
relate to: process and technical skills, interpersonal and communication skills; team work skills,
flexibility and adaptability, and empathy with the external customer. In general, employees must
be able and willing to deliver desired levels of service in order to minimize gaps between service
specifications and delivered service.
Typically, training programmes cover product, company and systems knowledge,
awareness of employees‘ role in assessing and meeting customer needs, and the economic impact
97 | Journal of Management and Science | Vol.3.No.3 | September 2013 ISSN: 2249-1260|eISSN: 2250-1819
of everyone working together to support company goals. Critical to this is to focus on service
encounters or relationships within organizations, at all levels and between levels (Lewis and
Entwistle, 1990), which contribute to the service delivered to external customers. In addition
product/technical knowledge and relationship management, personal skills and interpersonal
communication skill development is vital. This allows organizations to empower employees to
exercise judgment and creativity in responding to customer needs and problems (Schlesinger and
Heskett, 1991b). Knowing that management has confidence in employees helps create positive
attitudes in the workplace and good relationships between employees, and between employees
and customers.
8. CONCLUSION
Today companies are facing cut throat competition. Customers are becoming harder to retain.
They are smarter, more demanding, informative and price sensitive. They always try to compare
the offers given by different companies. Therefore relationship marketing is the strategic tool to
retain the customers by way of emotional bonding and managing the competition. Simplified
interpretations of relationship effects should be abandoned in favour of better models of
relationship development and value determination. Relationship marketing is still in its ‗infancy
stage‘ among service companies in India due to several reasons. First and foremost there is a lack
of understanding of the concept of relationship marketing among financial services firms and
some firms have not properly understood the terms RM and hence assess the implications of this
paradigm shift in the marketing practices of their companies.
9. REFERENCES [1] Lawrence A. Crosby And Nancy Stephens, ―Effects of Relationship Marketing on
Satisfaction, Retention, and Prices in the Life Insurance Industry‖, Journal of Marketing
Research, Vol. 24, No. 4, 1987, pp. 404-411.
[2] Rakesh Kumar Yadav, ―Relationship Marketing: A Tool For Strategic Competition
Management‖, International Journal of Research in Finance & Marketing, Volume 2, Issue 2,
2012, pp.186-194.
[3] Silky .B. Kothari, ―A Study of Relationship Marketing In Commodities Exchanges Like Mcx
In India‖, dissertation of MA Marketing,2007.
[4] Robert M. Morgan & Shelby D. Hunt, ―The Commitment-Trust Theory of Relationship
Marketing‖, The Journal of Marketing, Vol. 58, No. 3, 1994, pp. 20-38.
[5] Relationship Marketing 3.0: Thriving in Marketing‘s New Ecosystem,
www.peppersandrogersgroup.com.
[6] Andrei Maxim, ―Relationship Marketing – A New Paradigm in Marketing Theory and
Practice‖, 2009.
[7] Nagasimha Kanagal, ―Role of Relationship Marketing in Competitive Marketing Strategy‖,
Journal of Management and Marketing Research, 2005, pp.1-17.
*****

98 | Journal of Management and Science | Vol.3.No.3 | September 2013 ISSN: 2249-1260|eISSN: 2250-1819
Role of Women Entrepreneurship in Indian Economy:
Related Challenges and Opportunities
Dr. Sachin R. Agrawala and Gajanan S. Deshmane
b
aNew Model Degree College, Hingoli, Near Datta Mandir, Mangalwara, Hingoli, Dist. Hingoli,
431513, India bNew Model Degree College, Hingoli, Near Datta Mandir, Mangalwara, Hingoli, Dist. Hingoli,
431513, India
Abstract:- Woman constitutes the family, which leads to society and Nation. Social and
economic development of women is necessary for overall economic development of any society
or a country. Entrepreneurship is the state of mind which every woman has in her but has not
been capitalized in India in way in which it should be. Due to change in environment, now
people are more comfortable to accept leading role of women in our society, though there are
some exceptions.
The educated women do not want to limit their lives in the four walls of the house. They
demand equal respect from their partners. However, Indian women have to go a long way to
achieve equal rights and position because traditions are deep rooted in Indian society. Woman
constitutes the family, which leads to society and Nation. Despite all the social hurdles, many
women have become successful in their works. These successful women have made name &
wealth for themselves with their hard work, diligence, competence and will power. Ability to
learn quickly from her abilities, her persuasiveness, open style of problem solving, willingness to
take risks and chances, ability to motivate people, knowing how to win and lose gracefully are
the of the Indian women entrepreneurs. These women leaders are assertive, persuasive and
willing to take risks. They managed to survive and succeed in this cut throat competition with
their hard work, diligence and perseverance.
Keywords: - Entrepreneurship, Women, Business, Gender.
Introduction:-
Entrepreneurship refers to the act of setting up a new business or reviving an existing
business so as to take advantages from new opportunities. Thus, entrepreneurs shape the
economy by creating new wealth and new jobs and by inventing new products and services.
However, an insight study reveals that it is not about making money, having the greatest ideas,
knowing the best sales pitch, applying the best marketing strategy. It is in reality an attitude to
create something new and an activity which creates value in the entire social eco-system. It is the
psyche makeup of a person. It is a state of mind, which develops naturally, based on his/her
surrounding and experiences, which makes him/her think about life and career in a given way.
The women have achieved immense development in their state of mind. With increase in
dependency on service sector, many entrepreneurial opportunities especially for women have
been created where they can excel their skills with maintaining balance in their life. Accordingly,
during the last two decades, increasing numbers of Indian women have entered the field of
entrepreneurship and also they are gradually changing the face of business of today, both literally
and figuratively. But still they have not capitalized their potential in India the way it should be.

99 | Journal of Management and Science | Vol.3.No.3 | September 2013 ISSN: 2249-1260|eISSN: 2250-1819
Woman constitutes the family, which leads to society and Nation. Social and economic
development of women is necessary for overall economic development of any society or a
country. Entrepreneurship is the state of mind which every woman has in her but has not been
capitalized in India in way in which it should be. Due to change in environment, now people are
more comfortable to accept leading role of women in our society, though there are some
exceptions. Our increasing dependency on service sector has created many entrepreneurial
opportunities especially for women where they can excel their skills with maintaining balance in
their life. Propose of this empirical study is intended to find out various motivating and de-
motivating internal and external factors of women entrepreneurship. The position of women and
their status in any society is an index of its civilization.
Women have been successful in breaking their confinement within the limits of their
homes by entering into varied kinds of professionals and services women entrepreneurs have
proved to be on par with their men counterparts in business acumen and are emerging as smart
and dynamic entrepreneurs. There are many reasons for women to enter into entrepreneurial
ventures in a predominantly society. Entrepreneurship among women is an important avenue
through which women can overcome their subordination within the family and the family and the
society as a whole. Therefore, development of entrepreneurship among women has received
special attention of the policy makers. In this direction, a special character in the seventh plan
has converted into the integration of women in economic development. The new industrial policy
has stressed the need for conducting special Entrepreneurial Development Programme (EDPs)
for women. Besides this, today, a network of institutions exists in the country to promote women
entrepreneurship. The commercial banks and the financial institution are an integral part of this
network. Many organizations/ institutions and association promote and develop women
entrepreneurship by providing financial assistance at concessional rates of interest and also
organize industrial fairs and exhibitions. Entrepreneurship Development Programme (EDPs) for
women creates entrepreneurial awareness among them.
Objectives of the Study:-
1. To identify the reasons for women for involving themselves in entrepreneurial
activities
2. To identify the factors of hindrance for women entrepreneurship
3. To determine the possible success factors for women in such entrepreneurial
activities.
4. To make an evaluation of people‘s opinion about women entrepreneurship.
Research Methodology:-
This research is a descriptive study in nature. The secondary data was collected from
various journals, magazines, and websites.
Review of Literature:-
Das, 2000 performed a study on women entrepreneurs of SMEs in two states of India,
viz, Tamilnadu and Kerala. The initial problems faced by women entrepreneurs are quite similar
to those faced by women in western countries. However, Indian women entrepreneurs faced
lower level of work family conflict and are also found to differ from their counterparts in western
countries on the basis of reasons for starting and succeeding in business. Similar trends are also
found in other Asian countries such as Indonesia and Singapore. Again the statistics showed that
the proportion of business setup and operated by women is much lower than the figures found in
western countries.

100 | Journal of Management and Science | Vol.3.No.3 | September 2013 ISSN: 2249-1260|eISSN: 2250-1819
Singh, 2008, identifies the reasons & influencing factors behind entry of women in
entrepreneurship. He explained the characteristics of their businesses in Indian context and also
obstacles & challenges. He mentioned the obstacles in the growth of women entrepreneurship are
mainly lack of interaction with successful entrepreneurs, social un-acceptance as women
entrepreneurs, family responsibility, gender discrimination, missing network, low priority given
by bankers to provide loan to women entrepreneurs. He suggested the remedial measures like
promoting micro enterprises, unlocking institutional frame work, projecting & pulling to grow &
support the winners etc. The study advocates for ensuring synergy among women related
ministry, economic ministry & social & welfare development ministry of the Government of
India.
Jalbert, 2000 performed a study to explore the role of women entrepreneurs in a global
economy. It also examined how women‘s business associations can strengthen women‘s position
in business and international trade. The analysis is performed on the basis of facts and data
collected through field work (surveys, focus groups and interviews) and through examining the
existing published research. The study has shown that the women business owners are making
significant contributions to global economic health, national competitiveness and community
commerce by bringing many assets to the global market. As per the analysis of the research
study, women entrepreneurs have demonstrated the ability to build and maintain long-term
relationships and networks to communicate effectively, to organize efficiently, to be fiscally
conservative and to be aware of the needs of their environment and to promote sensitivity to
cultural differences. Researchers contend that women business owners possess certain specific
characteristics that promote their creativity and generate new ideas and ways of doing things.
These characteristics include focus, high energy level, personal motivations, self-employed
father, social adroitness, interpersonal skills etc. There is a worldwide pool of economically
active persons, known as the Women‘s Indicators and Statistical Data Base (WISTAT), from
which one can extrapolate the general number of women entrepreneurs. WISTAT titles the
category ―employers and own-account workers,‖ but the category could be termed as well as
self-employed or business owners. The category describes those who are economically
independent and who could be entrepreneurs. The number of women to 100 men in each region
is represented for three decades spanning 1970 to 1990. The study revealed that the gap between
men and women business owners has narrowed significantly. In 1970 women numbered 26 for
each 100 men, but by 1990 women numbered 40 for each 100 men who were self employed
―Women‖ as Entrepreneurs in India:-
Women owned businesses are highly increasing in the economies of almost all countries.
The hidden entrepreneurial potentials of women have gradually been changing with the growing
sensitivity to the role and economic status in the society. Skill, knowledge and adaptability in
business are the main reasons for women to emerge into business ventures. ―Women
Entrepreneur‖ is a person who accepts challenging role to meet her personal needs and become
economically independent. A strong desire to do something positive is an inbuilt quality of
entrepreneurial women, who is capable of contributing values in both family and social life. With
the advent of media, women are aware of their own traits, rights and also the work situations.
The challenges and opportunities provided to the women of digital era are growing rapidly that
the job seekers are turning into job creators. They are flourishing as designers, interior
decorators, exporters, publishers, garment manufacturers and still exploring new avenues of
economic participation. In India, although women constitute the majority of the total population,

101 | Journal of Management and Science | Vol.3.No.3 | September 2013 ISSN: 2249-1260|eISSN: 2250-1819
the entrepreneurial world is still a male dominated one. Women in advanced nations are
recognized and are more prominent in the business world. But the Indian women entrepreneurs
are facing some major constraints like-Lack of confidence in their strength and competence.
• Identifying the available resources
• Knowledge in Business Administration
• Awareness about the financial assistance
• Socio-cultural barriers
• Market-oriented risks
• Motivational factors
• Exposed to the training programs
Concept of Women Entrepreneurs:-
Women Entrepreneurs may be defined as the women or a group of women who initiate,
organize and operate a business enterprise. The Government of India has defined women
entrepreneurs as ―an enterprise owned and controlled by women having a minimum financial
interest of 51 per cent of the capital and giving at least 51 per cent of the employment generated
in the enterprise to women.‖ According to Suresh Reddy women entrepreneurship is a composite
skill, the resultant of a mix of many qualities and traits these include tangible factors as
imagination, readiness to take risks, ability to bring together and put to use other factors of
production, capital, labour, land, as also intangible factors such as the ability to mobilize
scientific and technological advances. Samwel (2003) viewed women entrepreneurship as a
function which seeks investment and production process by raising capital, arranging labour and
raw materials, finding site, introducing new techniques and commodities and discovering new
sources for the enterprises. When we speak about the term ―Women Entrepreneurship‖ we mean,
an act of business ownership and business creation that empowers women economically,
increases their economic strength as well as position in society.
Hence women-entrepreneurs have been making a considerable impact in all most all the
segments of the economy which is more than 25% of all kinds of business. In India
―Entrepreneurship‖ is very limited amongst women especially in the formal sector, which is less
than 5% of all the business. Women Entrepreneurship Role in the emergence of entrepreneurs in
a society depends to a great extent on economic, social, religious, cultural and psychological
factors prevailing in the society. In many of the advanced countries of the world there is a
phenomenal increase in the number of self-employed women after the world war. In U.S women
own 25% of all business, even though there sales on an average are less than 2/5th of those of
other small business groups. In Canada, 1/3rd of small business are owned by women and in
France, it is 1/5th. In U.K., since 1990, the number of self-employed women has increased 3
times as fast as the number of self-employed men.
Women and the Economy:-
The participation of women in the workforce, the quality of work allotted to them and
their contribution to the GDP are indicators of the extent of their being main streamed into the
economy. The National Skill Development Programme (NSDP) has identified 231 modular
courses for women. It is critical that the training has relevance to the changing labour markets.
Efforts are needed to link skill development programmes to the NSDP to ensure relevance and
enhance employability. An important strategy for financial inclusion of women, which is crucial
for their integration into the economy, has been micro-finance. The model encourages access of
SHGs to banks both as a means of savings and as providers of loan services. By March 2010,
69.53 lakh SHGs including those formed under the SGSY had been covered under the National
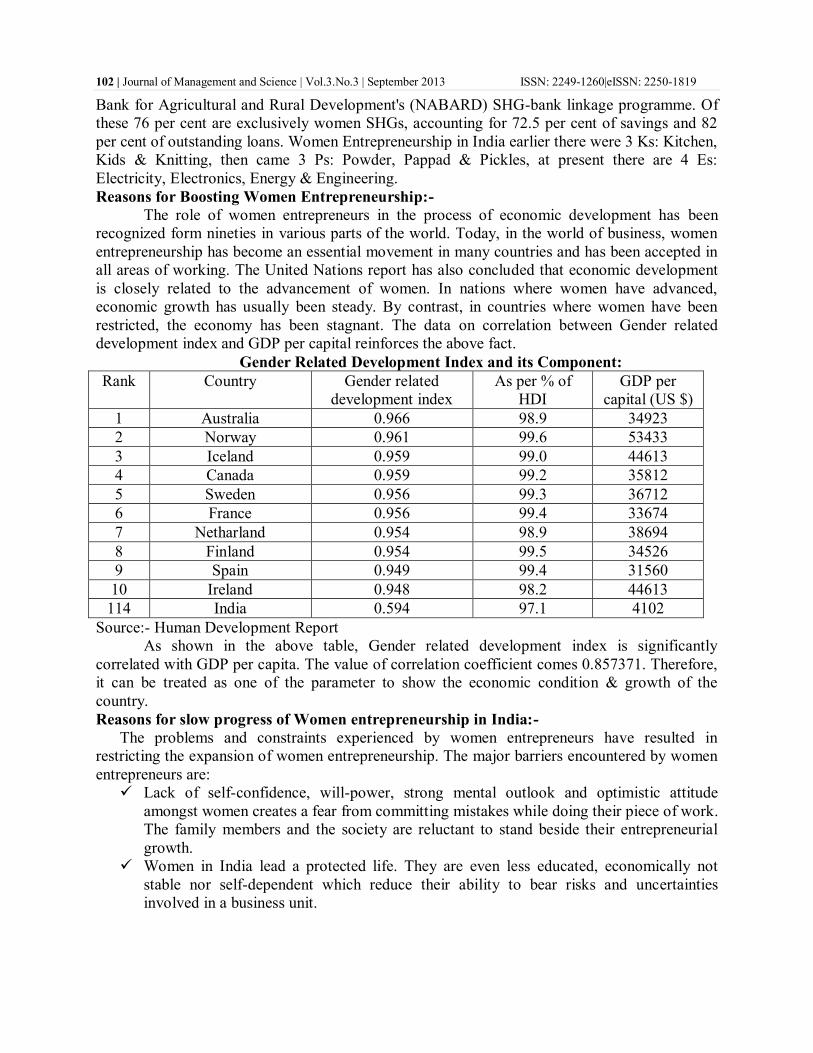
102 | Journal of Management and Science | Vol.3.No.3 | September 2013 ISSN: 2249-1260|eISSN: 2250-1819
Bank for Agricultural and Rural Development's (NABARD) SHG-bank linkage programme. Of
these 76 per cent are exclusively women SHGs, accounting for 72.5 per cent of savings and 82
per cent of outstanding loans. Women Entrepreneurship in India earlier there were 3 Ks: Kitchen,
Kids & Knitting, then came 3 Ps: Powder, Pappad & Pickles, at present there are 4 Es:
Electricity, Electronics, Energy & Engineering.
Reasons for Boosting Women Entrepreneurship:-
The role of women entrepreneurs in the process of economic development has been
recognized form nineties in various parts of the world. Today, in the world of business, women
entrepreneurship has become an essential movement in many countries and has been accepted in
all areas of working. The United Nations report has also concluded that economic development
is closely related to the advancement of women. In nations where women have advanced,
economic growth has usually been steady. By contrast, in countries where women have been
restricted, the economy has been stagnant. The data on correlation between Gender related
development index and GDP per capital reinforces the above fact.
Gender Related Development Index and its Component:
Rank Country Gender related
development index
As per % of
HDI
GDP per
capital (US $)
1 Australia 0.966 98.9 34923
2 Norway 0.961 99.6 53433
3 Iceland 0.959 99.0 44613
4 Canada 0.959 99.2 35812
5 Sweden 0.956 99.3 36712
6 France 0.956 99.4 33674
7 Netharland 0.954 98.9 38694
8 Finland 0.954 99.5 34526
9 Spain 0.949 99.4 31560
10 Ireland 0.948 98.2 44613
114 India 0.594 97.1 4102
Source:- Human Development Report
As shown in the above table, Gender related development index is significantly
correlated with GDP per capita. The value of correlation coefficient comes 0.857371. Therefore,
it can be treated as one of the parameter to show the economic condition & growth of the
country.
Reasons for slow progress of Women entrepreneurship in India:-
The problems and constraints experienced by women entrepreneurs have resulted in
restricting the expansion of women entrepreneurship. The major barriers encountered by women
entrepreneurs are:
Lack of self-confidence, will-power, strong mental outlook and optimistic attitude
amongst women creates a fear from committing mistakes while doing their piece of work.
The family members and the society are reluctant to stand beside their entrepreneurial
growth.
Women in India lead a protected life. They are even less educated, economically not
stable nor self-dependent which reduce their ability to bear risks and uncertainties
involved in a business unit.
103 | Journal of Management and Science | Vol.3.No.3 | September 2013 ISSN: 2249-1260|eISSN: 2250-1819
The old and outdated social outlook to stop women from entering in the field of
entrepreneurship is one of the reasons for their failure. They are under a social pressure
which restrains them to prosper and achieve success in the field of entrepreneurship.
The greatest deterrent to women entrepreneurs is that they are women. A kind of
patriarchal male dominant social order is the building block to them in their way towards
business success. Male members think it a big risk financing the ventures run by women.
Male chauvinism is still prevalent in many parts of the country yet. Women are looked
upon as ‗abla‖ i.e. weak in all respects. In a male dominated society, women are not
treated equal to men that act as a barrier to woman‗s entry into business.
Women entrepreneurs have to face a stiff competition with the men entrepreneurs who
easily involve in the promotion and development area and carry out easy marketing of
their products with both the organized sector and their male counterparts. Such a
competition ultimately results in the liquidation of women entrepreneurs.
Unlike men, women mobility in India is highly limited due to many reasons. A single
women asking for room is still looked with suspicion. Cumbersome exercise involved in
starting with an enterprise coupled with officials humiliating attitude towards women
compels them to give up their spirit of surviving in enterprise altogether.
Women's family obligations also bar them from becoming successful entrepreneurs in
both developed and developing nations. The financial institutions discourage women
entrepreneurs on the belief that they can at any time leave their business and become
housewives again.
Indian women give more emphasis to family ties and relationships. Married women have
to make a fine balance between business and family. The business success also depends
on the support the family members extended to women in the business process and
management.
Various Measures by Govt. of India:-
At present, the Government of India has over 27 schemes for women operated by
different departments and ministries. Some of these are:
Integrated Rural Development Programme (IRDP)
Khadi And Village Industries Commission (KVIC)
Training of Rural Youth for Self-Employment (TRYSEM)
Prime Minister‗s Rojgar Yojana (PMRY)
Entrepreneurial Development programme (EDPs)
Management Development progammes
Women‗s Development Corporations (WDCs)
Marketing of Non-Farm Products of Rural Women (MAHIMA)
Assistance to Rural Women in Non-Farm Development (ARWIND) schemes
Trade Related Entrepreneurship Assistance and Development (TREAD)
Working Women‗s Forum
Indira MahilaYojana
Indira Mahila Kendra
Mahila Samiti Yojana
Mahila Vikas Nidhi
Micro Credit Scheme
Rashtriya Mahila Kosh
SIDBI‗s Mahila Udyam Nidhi

104 | Journal of Management and Science | Vol.3.No.3 | September 2013 ISSN: 2249-1260|eISSN: 2250-1819
Mahila Vikas Nidhi
SBI‗s Stree Shakti Scheme
NGO‗s Credit Schemes
Micro & Small Enterprises Cluster Development Programmes (MSE-CDP).
National Banks for Agriculture and Rural Development‗s Schemes
Rajiv Gandhi Mahila Vikas Pari yojana (RGMVP)
Priyadarshini Project- A programme for Rural Women Empowerment and Livelihood in
Mid Gangetic Plains
NABARD- KfW-SEWA Bank project
Opportunities to Women Entrepreneurs:-
Highly educated, technically sound and professionally qualified women should be
encouraged for managing their own business, rather than dependent on wage employment
outlets. The unexplored talents of young women can be identified, trained and used for various
types of industries to increase the productivity in the industrial sector. A desirable environment is
necessary for every woman to inculcate entrepreneurial values and involve greatly in business
dealings. The additional business opportunities that are recently approaching for women
entrepreneurs are:
Tourism industry
Telecommunication
Plastic materials
Mineral water
Eco-friendly technology
Herbal & health care
Food, fruits & vegetable processing
Bio-technology
IT enabled enterprises
Event Management
Obstacles for Women Entrepreneurship:-
The entrepreneurial process is same for men and women. Successful men and women
entrepreneurs undergo similar motivations and thus achieve success in largely same way under
similar challenges. They are also found to have access to fund from the same sources. The same
condition both men and women can be successful entrepreneurs. However, in practice most of
the upcoming women entrepreneurs face problems that are of different dimensions and
magnitudes than that faced by their male counterparts. These problems, generally, prevent these
women entrepreneurs from realizing their potential as entrepreneurs. The major hurdles that the
women face during starting and running a company generally come from financing and
balancing of life. The balancing of life is caused due to lack of family support for the women.
The other hindering external factors include gender discrimination, inaccessibility to
information, training opportunities, infrastructure etc. Some internal factors like risk aversion by
women, lack of confidence, lack of vision of strategic leader etc. can also create obstacles for the
women entrepreneurship development.
Measures to Remove Obstacles:-
The elimination of obstacles for women entrepreneurship requires a major change in
traditional attitudes and mindsets of people in society rather than being limited to only creation
of opportunities for women. Hence, it is imperative to design programmes that will address to
attitudinal changes, training, supportive services. The basic requirement in development of

105 | Journal of Management and Science | Vol.3.No.3 | September 2013 ISSN: 2249-1260|eISSN: 2250-1819
women entrepreneurship is to make aware the women regarding her existence, her unique
identity and her contribution towards the economic growth and development of country. The
basic instinct of entrepreneurship should be tried to be reaped into the minds of the women from
their childhood. This could be achieved by carefully designing the curriculum that will impart
the basic knowledge along with its practical implication regarding management (financial, legal
etc.) of an enterprise.
Adopting a structured skill training package can pave the way for development of women
entrepreneurship. Such programmes can train, motivate and assist the upcoming women
entrepreneurship in achieving their ultimate goals. Various schemes like the World Bank
sponsored programmes can be undertaken for such purposes. The course design should focus on
imparting input on profitability, marketability and practical management lessons. Besides, there
should be consideration in helping the women entrepreneurs in balancing their family life and
work life. As a special concern, computer illiterate women can be trained on Information
Technology to take the advantage of new technology and automation. The established and
successful women entrepreneurs can act as advisors for the upcoming women entrepreneurs. The
initiatives taken from these well-established entrepreneurs for having interaction with such
upcoming women entrepreneurs can be proved to be beneficial in terms of boosting their morale
and confidence. It may result in more active involvement of women entrepreneurs in their
enterprises. Infrastructure set up plays a vital role for any enterprise. Government can set some
priorities for women entrepreneurs for allocation of industrial plots, sheds and other amenities.
However, precautionary measures should be undertaken to avoid the misuse of such facility by
the men in the name of the women. Even in today‘s era of modernization the women
entrepreneurs depend on males of their family for marketing activities. This is simply because
they lack the skill and confidence for undertaking such activities. Women development
corporations should come forward to help the women entrepreneurs in arranging frequent
exhibitions and setting up marketing outlets to provide space for the display of products or
advertisement about services made by women.
Suggestions for Improving Women Entrepreneurship in India:-
Following suggestion are made for being about improvement in the direction of women
entrepreneurship.
1. Government should facilitate top ranker women entrepreneurs.
2. Women entrepreneurs should be more competitive and efficient in the local and
international market.
3. Government should arrange special training programmes for the women
entrepreneurship.
4. We should invite successful women entrepreneurs from foreign nations so as their Indian
counterpart scan share their experience.
5. Government should provide separate financial funds for women entrepreneurs.
6. We should provide her with special infrastructure facilities whatever she needs.
Conclusion:-
The study tried to find out the difference among various set of people of the crucial
factors which are concerned with the women entrepreneurial opportunities at large. Issues have
been identified through various review of literature. It should be cross checked with the real
entrepreneurs. These factors may vary from place to place business to business but women
entrepreneurship is necessary for the growth of any economy weather it large or small.
106 | Journal of Management and Science | Vol.3.No.3 | September 2013 ISSN: 2249-1260|eISSN: 2250-1819
It can be said that today we are in a better position wherein women participation in the
field of entrepreneurship is increasing at a considerable rate. Efforts are being taken at the
economy as brought promise of equality of opportunity in all spheres to the Indian women and
laws guaranteed equal rights of participation in political process and equal opportunities and
rights in education and employment were enacted. But unfortunately, the government sponsored
development activities have benefited only a small section of women i.e. the urban middle class
women. Women sector occupies nearly 45% of the Indian population. Despite all these odds,
successful women‘s entrepreneurs do exist. Women entrepreneurs have evidently more to
―acquire‖ than their males counterparts. This is largely due to the socio-cultural environment in
which Indian women are born and raised. Social customs, caste restriction, cultural restraints and
norms leave women lagging behind men. They are not mentally geared to slip into an
entrepreneurial role becomes of their family orientation, restricted mobility and limited access to
resources. But given the opportunity, direction and guidance, they are capable of overcoming
these limitations.
References:-
[1] Handbook on Women-owned SMEs, Challenges and Opportunities in Policies and
programmes, International Organization for Knowledge Economy and Enterprise
Development.
[2] Lall, Madhurima, & SahaiShikha, 2008, Women in Family Business, presented at first
Asian invitational conference on family business at Indian School of Business,
Hyderabad.
[3] Mathew, Viju,(2010), ―Women entrepreneurship in Middle East: Understanding barriers
and use of ICT for entrepreneurship development‖, Springer Science + Business Media,
LLC 2010
[4] Moore, D. P. &Buttner, E. H. (1997). Women entrepreneurs: Moving beyond New
Generation of Women Entrepreneurs Achieving Business Success.
[5] Handbook on Women-owned SMEs, Challenges and Opportunities in Policies and
programmes, International Organization for Knowledge Economy and Enterprise
Development.
[6] Damwad, (2007), Women Entrepreneurship – A Nordic Perspective, August 2007,
Nordic Innovation Centre.
[7] Women Entrepreneurship Development in India,
www.indianmba.com/Faculty_Column/FC1073/f c1073.html
[8] Women in Business & Decision Making – A survey on women entrepreneurs, women
network, euro chambers Association of European Chambers of Commerce and Industry
[9] Women in Business: A Demographic Review of Women‘s Business Ownership, Office
of Advocacy U.S. Small Business Administration, August 2006.
[10] Arora, R. and Sood, S.K. (2005), ―Fundamentals of Entrepreneurship and Small
Business‖.
107 | Journal of Management and Science | Vol.3.No.3 | September 2013 ISSN: 2249-1260|eISSN: 2250-1819
Stress among Students — A Descriptive Study Poonam Arora
Assistant Professor,
Amity Global Business school, Ahmedabad, India
ABSTRACT: Technology advancements have always helped to constantly multitask and take
more and more work and targets due to which people are under stern time pressures and are
constantly moving which leads to stress. Increasing number of people seems to be overcharged
and overburdened. People are finding it difficult to keep up their energy levels up and live a
normal, peaceful life; instead most of their useful time gets wasted in coping from stress.
This paper focuses on finding the stress level of management students who are working under
immense pressure by meeting day to day deadlines, studying a number of subjects at a time,
doing to many assignments and submitting the term projects on deadlines. Apart from fulfilling
their course requirement, students also have to deal with different other pressures and fulfill
their parent‟s expectations. This study is done with the objective of discovering the causes of
stress in the lives of students, the effects of stress, identifying the various variables associated
with it and establishing definite relationships between these variables. The study also tries to
identify the prominent underlying variables responsible for causing stress. For this a
comprehensive survey via an online questionnaire has been conducted. This paper uses a
descriptive methodology and focuses to find the effect of different causes on the stress levels and
hence is an insight into the behavioral patterns of students when they experience the same.
Keywords: Stress quotient; Stress stimulants; peer pressure; stress factors; parental
expectations.
1. INTRODUCTION
Everyone in this new world is in the race of getting and achieving as much as possible.
Everybody wants the best piece of the cake that too with cream and cherry on the top. When
everybody is in for the race and the goal is same, the competition becomes tough. Money is the
root cause of everything and man has become the money making machine. To achieve success,
luxuries, and a life full of convenience one has to work hard.
Day-to-day life used to be very different for many people. People used to have more time to play
and hang around with friends and family. They could go on vacations without worrying about the
work. But now because of the accelerating pace of modern life and constant change, most people
feel themselves under extreme pressures and this leads to stress. Because of this, life has now
become full of hassles, deadlines, frustrations and demands. For many people, stress is so
common that it has become a way of life. Stress is not always bad. It sometimes helps people
and motivates them to perform better. A certain level of stress is healthy and can be motivating.
In fact, if balanced correctly, stress can be a positive element in our lives.
According to American Psychological Association, Stress is a normal psychological and
physical reaction to the ever increasing demands of life. Stress is a normal physical response to
events that make people feel threatened or upset the life‘s balance in some way. Stress is a
constant for many of us because we live in a world full of stress. Stress can be about money,

108 | Journal of Management and Science | Vol.3.No.3 | September 2013 ISSN: 2249-1260|eISSN: 2250-1819
marriage, job security, health issues, about studies, about children, about parents and can be
about other relationships.
Academic stress among students is now the talk of the town and one of the very
interesting topics to be studied. The earlier studies have identified different stressors affecting
students. Specifically Students entering into the professional education needs to face many
challenges to which they have never been exposed earlier. The pressure of achieving good grades
and achieving a degree is very high. The potential sources of stress for these include excessive
and unclear assignments, difficult worksheets, lengthy projects, uncomfortable classrooms, new
classmates and new environment and in addition to this time pressures and deadlines may also be
the sources of stress. Do these states of affairs are really the areas of concern and are causing
academic stress?
2. STRESS TO STUDENTS
Stress is inevitable. Stress is an everyday occurrence and regardless of the profession of a person
it cannot be eradicated from life because of the demands of our fast-paced and busy lives. Stress
may occur to an adult, to a housewife, to a youngster or even to a student. Students‘ stress is
usually related to everyday experiences, worries and challenges at home, in college, in the
community and within the peer group. A student may feel stressed because of various factors like
social issues relating to peer group and group of friends and pressures related to that. It can be
due to the family issues like family and the relationships or can be work leisure balance like
maintaining balance between studies and other activities like hobbies.
Student may experience stress resulting from swaggering, ragging, social isolation, a
sense of dissatisfaction, academic difficulties and new environment. The impact of ongoing
stress, whether resolved or unresolved, can lead to feelings of eagerness, slump, natural
frustration, depression, and poor assiduity, loss of compatibility, physical sickness, fatigue, sleep
disorders and poor understanding. College can be stressful for many reasons: some get stressed
because of a new environment, sudden changes in environment, loss of solace or greater
academic requirements, loads of assignments, competitions with fellow students, a crest of
success, a lump of failures, poor relationships with other students, fear of teachers, overcrowded
or noisy lecture halls, semester/trimester system, multiple subjects and subject related problems
and inadequate resources to perform academic work. Last but not the least, very important is the
pressure to perform well in the examination. This makes academic environment very stressful.
When students feel stressed at college, they may resort to the excessive use of stimulants like tea
or coffee or they may indulge in different types of intoxicants like alcohol, tobacco or drugs.
College life can be sometimes so stressful that students cannot function properly. Their health, overall performance, ability to think and social life can all suffer when stress becomes too much to handle. Stress may lead to severe and grave health conditions including high blood pressure, digestive issues, depression, and anxiety and they become prone to illness. Stress can affect student’s academic life.

109 | Journal of Management and Science | Vol.3.No.3 | September 2013 ISSN: 2249-1260|eISSN: 2250-1819
Prof. Nidhi, an experienced academician says that: There is nobody in the world, which is not
stressed due to one or other reason. Stress does not come alone; it brings anxiety, fear and anger
along with it. Students are more prone to stress due to lot of reasons viz. curriculum load,
competition, pressure from home to prove themselves, social activities etc. Under stress, the
students become irritated on small things, remain nervous all the day and are usually unable to
handle situations. Choosing to deal with stress may result into over thinking, smoking, or over
eating. But every one of us should live knowing that it‟s just a matter of choice. Our health,
happiness and life depend on it. A simple mantra to deal with stress is to identify the reason
behind it, find a timely solution and if no solution is within the sight, better ignore it.
3. PURPOSE OF STUDY
Due to extreme stress in this fast paced world a student‘s social relations both within the
institution and outside are affected. There are many milestones which college students have to
overpower in order to achieve their optimum academic performance. This highlights the need for
research to examine the root cause of academic stress faced by students at various levels of
learning at management institutions. In this regard, this paper tries to identify the different levels
of stress which students are facing and to know the frequency of and the variables causing stress.
It also tries to find out the dependence and independence of various factors involved.
4. OBJECTIVES
The main objectives of this study are:
1.To know the level of stress among students.
2.To find out the factors causing stress.
3.The dependence of usage of stimulants or drug intake and frequency of stress.
4.The dependence of frequency of stress and the peer pressure.
5.The dependence of parental expectations and the frequency of stress.
5. RESEARCH METHODOLOGY
The study follows a systematic and scientific approach. The Research Methodology used here is
descriptive in nature. Since already much has been said and written on similar topics across
various studies, this study is aimed to gain further insight into the topic and look at it with a new
perspective. For this, a survey is conducted on100 students of the B school where I am working,
was taken and recorded using an online questionnaire. It had questions on the following
categories:
1. Bio-data: to gain an idea about the sample demographics like age group, etc.
2. Causes of stress: Factors that the respondents believed are causes for stress in their lives.
3. Effects of stress: The perceived effects of stress on the life and behaviour patterns of the
respondents.
5.1 Hypothesis
A research always starts with a presumption. The assumption is based on some variables under
study. This study also started with some assumptions. Prior to collection of data and while
designing the questionnaire, the following variables were identified on the basis of which the
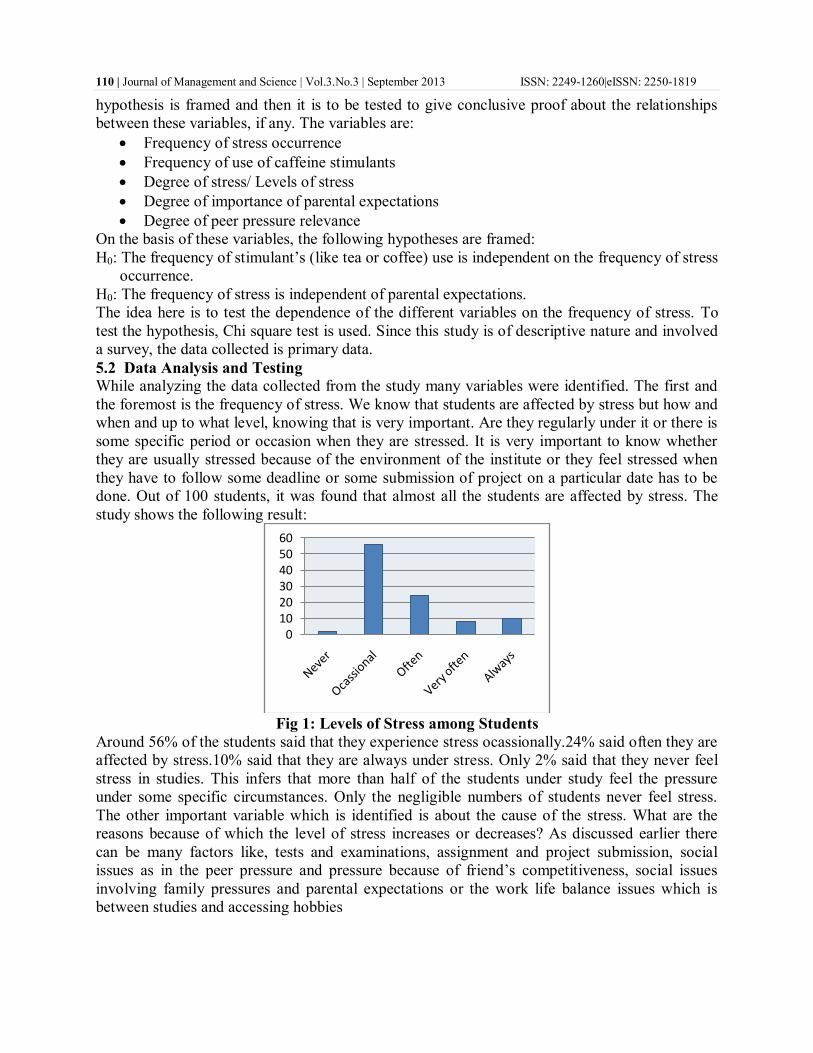
110 | Journal of Management and Science | Vol.3.No.3 | September 2013 ISSN: 2249-1260|eISSN: 2250-1819
hypothesis is framed and then it is to be tested to give conclusive proof about the relationships
between these variables, if any. The variables are:
Frequency of stress occurrence
Frequency of use of caffeine stimulants
Degree of stress/ Levels of stress
Degree of importance of parental expectations
Degree of peer pressure relevance
On the basis of these variables, the following hypotheses are framed:
H0: The frequency of stimulant‘s (like tea or coffee) use is independent on the frequency of stress
occurrence.
H0: The frequency of stress is independent of parental expectations.
The idea here is to test the dependence of the different variables on the frequency of stress. To
test the hypothesis, Chi square test is used. Since this study is of descriptive nature and involved
a survey, the data collected is primary data.
5.2 Data Analysis and Testing
While analyzing the data collected from the study many variables were identified. The first and
the foremost is the frequency of stress. We know that students are affected by stress but how and
when and up to what level, knowing that is very important. Are they regularly under it or there is
some specific period or occasion when they are stressed. It is very important to know whether
they are usually stressed because of the environment of the institute or they feel stressed when
they have to follow some deadline or some submission of project on a particular date has to be
done. Out of 100 students, it was found that almost all the students are affected by stress. The
study shows the following result:
Fig 1: Levels of Stress among Students
Around 56% of the students said that they experience stress ocassionally.24% said often they are
affected by stress.10% said that they are always under stress. Only 2% said that they never feel
stress in studies. This infers that more than half of the students under study feel the pressure
under some specific circumstances. Only the negligible numbers of students never feel stress.
The other important variable which is identified is about the cause of the stress. What are the
reasons because of which the level of stress increases or decreases? As discussed earlier there
can be many factors like, tests and examinations, assignment and project submission, social
issues as in the peer pressure and pressure because of friend‘s competitiveness, social issues
involving family pressures and parental expectations or the work life balance issues which is
between studies and accessing hobbies
0102030405060

111 | Journal of Management and Science | Vol.3.No.3 | September 2013 ISSN: 2249-1260|eISSN: 2250-1819
Fig 2: Causes of Stress among Students
The result says that 42 out of 100 students feel stressed because of tests and examination, 32 said
the reason is the work life balance issues. Very close to them are the two other group of
students.23 said the stress is due to social issues and 20 said due to personal issues. Only 9 said it
is due to assignments that means students are used to writing assignments and don‘t feel stressed
because of that.
Fig 3: Levels of Stress among Students
When stress engulfs a student‘s mind and his life, they are not able to cope the stress and they
indulge into the use of stimulants and intoxicants. When asked, the students got divided into
three clusters. The major cluster was formed of 40 students saying that they never indulge into
such activities. But a very good amount of students said that they daily use stimulants to avoid
stress and the count are 31%. 75% students said no matter how much is the stress, they never
take drugs or use tobacco. The analysis shows that 55% of the students agree that peer pressure
enhances stress while 36% said that their social status hardly affect their state of mind. It was
surprising to study that only 37% students believe that parental expectations put pressure on
them and they are not pressurized much because of this factor.
Earlier whenever we mentioned the causes of stress, we talked about the environment, the social
or personal reasons but one of the very important point is to know what students think and
against whom they compete with. They were given basic three options which were, against
themselves, against immediate competitor and against the topper. 57% students said that they
just compete against themselves. They believe in increasing their grades by motivating
themselves. They don‘t look to anybody for it. A very interesting point that came up is 24%
students said that they don‘t believe in competition. They don‘t compete instead they just believe
in studying and working hard. Rest 12% responded that they are stressed as they compete against
the immediate competitor.
42
9
2320
320
204060Tests and …
Assignme…
Social …Personal …
Work …
31%
29%
40%
Daily Ocassionally Never

112 | Journal of Management and Science | Vol.3.No.3 | September 2013 ISSN: 2249-1260|eISSN: 2250-1819
Fig 4: Competition among Students
We expected that mentors and teachers can be a good source of reducing stress as students can
feel relaxed, light and motivated talking to mentors. When asked, 59% students said that the
advice of their mentors reduces their stress and encourages them. But against that 31% said this
advice has no effect on them; neither positive nor negative.
Fig 5: Effect of Mentoring from Teachers
Also, few variables were identified and hypothesis is tested using the chi square tests. The first
Hypothesis is:
H0: The frequency of stimulant‘s use and the level of stress are independent of each other.
Ha: The frequency of stimulant‘s use and the level of stress are dependent of each other.
Assuming the level of significance to be 5% the tabulated value calculated came out be, χ2
tab =
15.507and the calculated value of χ2 i.e
. χ2
cal, came out to be 0.098579.On comparison against
χ2
tab , it is realized that the value of χ2
cal is smaller hence, H0is accepted i.e. the hypothesis,
frequency of caffeine stimulant use is independent on the frequency of stress occurrence is
accepted.
The second hypothesis is: H0: The frequency of stress is independent of parental expectations.
Again chi square was applied using 5% level of significance. It was found that χ2 tab = 26.296
and the calculated value of χ2 i.e. χ2cal, came out to be 27.171.On comparison against χ2 tab, it
is realized that the value of χ2cal is greater hence, H0 is rejected i.e. the hypothesis, frequency of
stress is independent on parental expectations is rejected and hence it says that the level of stress
increases as the parental expectations increases.
6. RESULTS AND FINDINGS
The above survey clearly infers the following points:
59%
10%
31%
Reduces stress and encourages
Raises expectations
Has no effect
113 | Journal of Management and Science | Vol.3.No.3 | September 2013 ISSN: 2249-1260|eISSN: 2250-1819
56% of students said they experience stress occasionally. There are many factors which cause
stress in a student‘s life but 42%, which is highest, agreed that maximum pressure is built
whenever there is some test or examination approaching. More than half of the respondents rated
4 as there level of stress on a scale of 1 to 5. The opinion about whether they get affected by their
friends opinion, the response was scattered, still the majority i.e. 38% rated it 2 on a scale of 1 to
5 which infers that they don‘t care about their social status and it doesn‘t affect the stress in their
life. No matter how stressed respondents are the survey says that 75% of them never indulge in
the use of intoxicants. A very good finding here is that the students feel very relaxed and
motivated when their mentors coach them. Their guidance encourages them to perform better
and relieve stress too. This coaching helps them to be confident and they keep themselves as the
benchmark. They never compete with each other, they believe in competing with themselves.
7. CONCLUSION
From the results of analysis, it was observed that a student‘s life can be very pressurized and
stressful. Students experience stress due to many reasons like peer pressure, social pressures,
work life balance, personal issues and the environment of the institute, where they are studying.
Maximum stress is experienced due to tests and assignments and their deadlines. It was found
that students experience stress mostly because of peer pressure and parental expectations. They
are not much affected by their competitors in class. It is also observed that students compete with
themselves and don‘t compete with others. Advice and counseling of mentors is one thing which
helps them relieving from stress and motivates them. The test says that the students under
analysis don‘t indulge in stimulants and intoxicants when they feel stressed. They sometimes use
tea/coffee but not regularly and they are not addicted. The hypothesis that was framed about a
relationship between the identified variables, frequency of occurrence of stress and frequency of
use of caffeine stimulants, proved that latter is independent on the former and define the behavior
of students.
8. REFERENCES
[1] Cohen, Sheldon, Wills, Thomas A., Stress, social support, and the buffering hypothesis,
Psychological Bulletin, 1985, Volume 98(2), 310-357.
[2] Mosley, T H Jr, Perrin, S G, Neral, S M, Dubbert, P M, Grothues, C A, Pinto, B M, Stress,
coping, and well-being among third-year medical students.
[3] Rakesh Kumar Agarwal, Shailendra Singh Chahar, Examining role stress among technical
students in India, Social Psychology of Education, 2007, Volume 10(1), 77-91.
[4] Christian S. Crandall, Jeanne J. Preisler, Julie Aussprung, Measuring life event stress in the
lives of college students: The Undergraduate Stress Questionnaire (USQ), Journal of
Behavioral Medicine, , 1992, Volume 15(6).
[5] Pareek, Uday, Making organizational roles effective, 1993, Tata McGraw Hill; New Delhi.
[6] Goodman, E.D., How to handle the stress of being a student, Imprint, 1993, 40-43.
[7] Nuran Bayram, Nazan Bilgel, The prevalence and socio-demographic correlations of
depression, anxiety and stress among a group of university students.
[8] Misra, Ranjita, McKean, Michelle, college students' academic stress and its relation to their
anxiety, time management, and leisure satisfaction, American Journal of Health
Studies Publisher: American Journal of Health Studies, 2000.
[9] Kohn, J. P., & Frazer, G. H., An academic stress scale: Identification and rated importance of
academic stressors. Psychological Reports, 1986, Volume 59, 415-426.
[10] Dale Carnegie, How to Enjoy Your Life and Your Job.

114 | Journal of Management and Science | Vol.3.No.3 | September 2013 ISSN: 2249-1260|eISSN: 2250-1819
[11] Purna Prabhakar, Nandamuri Gowthami, Hunter Road, Sources of academic stress – a study
on management students, Asia Pacific Journal of Management and Entrepreneurship.
[12] Jeffrey A. Kottler, Stress Management and Prevention: Applications to Daily Life.
[13] Archer, J., Lamnin, A., An investigation of personal and academic stressors on college
campuses, Journal of Student Personnel, 1985, Volume 26, 210-215.