vol. i – scoping report · this, the scoping report clearly sets out the relevant requirements of...
TRANSCRIPT

SCOTT WILSON BUSINESS CONSULTANCY Strategic Environmental Assessment / Sustainability Appraisal of the Royal Borough of Kensington and Chelsea Local Development Framework V o l . I – S c o p i n g R e p o r t
September 2005


SEA / SA of the Royal Borough of Kensington and Chelsea LDF Scoping Report
©Scott Wilson Business Consultancy September 2005 1
TABLE OF CONTENTS
1 Introduction _________________________________________________ 3
2 Task A1: Identifying other relevant plans, programmes and sustainability objectives (Context Review). ______________________ 12
3 Task A2 – Collecting baseline data _____________________________ 22
4 Task A3 – Identifying sustainability issues ______________________ 43
5 Task A4 – Developing the SA Framework________________________ 47
6 Task A5 – Consulting on the scope of the SA ____________________ 57
7 Next Steps _________________________________________________ 59
8 Further Information __________________________________________ 60
Glossary ________________________________________________________ 61
Appendix I – Quality Assurance Checklist ____________________________ 63
Appendix II – Baseline and Sustainability Issues Workshop Report _______ 65
Appendix III – Originally Proposed SA Objectives ______________________ 67
Appendix IV – Changes made to the original objectives._________________ 69
Appendix V – Consultation responses________________________________ 71
Appendix VI – Stakeholders consulted on Scoping Report_______________ 81
Appendix VII – Baseline spreadsheet_________________________________ 83
Appendix VIII – Assessment Table proforma __________________________ 85

SEA / SA of the Royal Borough of Kensington and Chelsea LDF Scoping Report
©Scott Wilson Business Consultancy September 2005 2
List of Tables Page
Table 1. SEA Directive requirements 8
Table 2. Royal Borough of Kensington and Chelsea SA Objectives
11
Table 3. List of relevant PPPSIs assessed 15
Table 4. Key PPPSI messages 19
Table 5. Proposed Baseline indicators 28
Table 6. Baseline indicators performance 33
Table 7. Sustainability problems 46
Table 8. SA Objectives and framework 52

SEA / SA of the Royal Borough of Kensington and Chelsea LDF Scoping Report
©Scott Wilson Business Consultancy September 2005 3
1 INTRODUCTION 1.1.1 Scott Wilson have been commissioned by the Royal Borough of Kensington and Chelsea
(‘the Council’) to undertake the Strategic Environmental Assessment (SEA) / Sustainability Appraisal (SA) of their Local Development Framework (LDF). The scope of this work is to complete a full SA of the following component parts of the Council’s LDF, the Development Plan Documents for:
• The Core Strategy;
• Development Control policies (Generic); and
• The Site Specific Allocations. 1.1.2 Additional appraisal of a number of Supplementary Planning Documents (SPDs) will also
be carried out at a later stage by Scott Wilson on behalf of the Council. These include the SPDs for Designing Out Crime, Access Design Guide, Brompton Hospital Planning Brief and Princes Louise Hospital Planning Brief.
1.1.3 This Scoping Report documents Stage A and the assessment process as set out in
Government Guidance, for the LDF and all three the documents referred to in 1.1.1. 1.2 SEA / SA 1.2.1 SEA involves the systematic identification and evaluation of the environmental impacts of a
strategic action (e.g. a plan or programme). In 2001, the EU legislated for SEA with the adoption of Directive 2001/42/EC on the assessment of the effects of certain plans and programmes on the environment (the ‘SEA Directive’). The Directive entered into force in the UK on 21 July 2004 and applies to a range of English plans and programmes including LDFs. LDFs replace the current local hierarchy of development plans (Unitary Development Plans, and Local Plans).
1.2.2 Under the Planning and Compulsory Purchase Act 2004 (PCPA), Local Authorities must
undertake SA for each of their DPDs and SPDs – the constituent parts of the LDF. SA is therefore a statutory requirement for LDFs along with SEA.
1.2.3 The Government’s approach is to incorporate the requirements of the SEA Directive into a
wider SA process that considers economic and social as well as environmental effects. To this end, in September 2004, the Government published draft guidance – which the Consultants are following - on undertaking SA of LDFs which incorporates the requirements of the SEA Directive1 (‘the Guidance’). The combined SEA / SA process is referred to in this document as ‘Sustainability Appraisal (SA)’.
1 ODPM (2004). Sustainability Appraisal of Regional Spatial Strategies and Local Development Frameworks – Consultation Paper.

SEA / SA of the Royal Borough of Kensington and Chelsea LDF Scoping Report
©Scott Wilson Business Consultancy September 2005 4
It is primarily a residential area providing a high quality residential environment. The 2001 Census reported that the Borough is home to a resident community of 159,000 people but thousands more come into the borough each day to work and visit. In addition, around 30,000 visitors stay each night.
1.3.4 As an historic area of London on the borders of the West End, the borough plays host to a
number of international attractions and institutions, many of which are rooted in its
1.2.4 The Guidance (in this case revised in light of Interim Advice2) advocates a five-stage approach to undertaking SA (see Figure 1). According to the Guidance, the Scoping Report should set out the findings of Stage A together with information on what happens next in the process.
1.2.5 The SEA Directive sets out a legal assessment process that must be followed. In light of
this, the Scoping Report clearly sets out the relevant requirements of the SEA Directive and explains how these have been satisfied (or will be satisfied). In particular, the SEA Directive requires the preparation of an ‘Environmental Report’ on the implications of the plan or programme in question. This report incorporates several of the required components of the Environmental Report.
1.2.6 This process therefore aims to satisfy the requirements of the SEA Directive and those of
Government guidance. More specifically the process aims:
• To promote sustainable development
• To provide for a high level of protection for the environment;
• To integrate sustainability and environmental considerations into the preparation of plans and programmes;
• To take a long term view of whether and how the area covered by the plan is expected to develop, taking account of the social, environmental and economic effects of the proposed plan;
• To provide a mechanism for ensuring that sustainability objectives are translated into sustainable planning policies;
• To reflect global, national, regional and local concerns; • To provide an audit trail of how the plan has been revised to take into account the
findings of the SA; and • To form an integral part of all stages of the plan preparation.
1.3 The Royal Borough of Kensington and Chelsea 1.3.1 The Royal Borough of Kensington and Chelsea is one of the smaller London boroughs in
terms of area and population, but because of its history and position close to the centre of London, it is the location for a wide variety of activities.
1.3.2 The borough covers an area of approximately 5 square miles and extends from Chelsea
Embankment in the south, through Kensington, Notting Hill and Ladbroke Grove up to Kensal Green in the north. It is bounded to the east by Kensington Gardens and to the west by the West London Railway Line.
1.3.3
2 ODPM (2005) Sustainability Appraisal of Regional Spatial Strategies and Local Development Frameworks – Interim Advice on Frequently asked questions. ODPM

SEA / SA of the Royal Borough of Kensington and Chelsea LDF Scoping Report
©Scott Wilson Business Consultancy September 2005 5
s. The Borough is also home to a number of institutions with international reputations. These features contribute to the economic wellbeing and
1.4 1.4.1 As part of the new pla Development Scheme in
May 2005. The Lo e-year basis (updated an to deliver the Local Development Framework.
ents (LDDs) to be produced, and the
.4.3 velopment Scheme (LDS), and more information on the Royal Borough of
Kensington and Chelsea and the development of the LDF can be found at: http://www.rbkc.gov.uk/Planning/localdevelopmentframework/default.asp
character and tradition. The major shopping streets of Knightsbridge, King’s Road, Kensington High Street and Portobello Road, along with the Earl’s Court Exhibition Centre, the South Kensington Museums, Kensington Palace and Holland Park are important international attraction for tourist
national and international standing of the Borough. Figure 1. Five stage approach to SA
Stage A: Setting the context and objectives, establishing the baseline and deciding on the scope
Stage B: Testing the LDF Objectives against the SA Framework, developing and refining options, predicting and assessing effects, identifying
mitigation measures and developing proposals for monitoring
Stage E: Monitoring implementation of the plan
Stage C: Documenting the appraisal process
Stage D: Consulting on the plan and SA Report
The Local Development Framework (LDF)
nning system, the Council adopted a Localcal Development Scheme sets out the timetable on a thre
nually) of the programme necessary
1.4.2 It will specifies the Local Development Docum
timetables and milestones against which progress will be measured. The Scheme is also be the starting point for the community and the public generally to ascertain the status of the LDF, and the processes and timetables for its future development.
The Local De1

SEA / SA of the Royal Borough of Kensington and Chelsea LDF Scoping Report
©Scott Wilson Business Consultancy September 2005 6
1.5.1
issued by the ODPM . Stage A is covered in this document as set out below and consists of 5 key tasks:
ty objectives.
ing sustainability issues
1.5.2 d t prac es of the process in the context of the whole
oce art at the beginning of each task, quirement of the SEA Directive, the text will
be provided. A break ctive requirements and where they are The stages in the LDF development process
able 1: SEA Directive Requirements
1.5 Methodology
The methodology of this SA broadly follows that outlined in the integrated SEA / SA guidance issued by the ODPM3 and the interim advice note also 4
• Task A1: Identifying other relevant plans, programmes and sustainabili
• Task A2: Collecting baseline information
• Task A3: Identify
• Task A4: Developing the SA framework
• Task A5: Consulting on the scope of the SA Scott Wilson realise that this is an area in constant evolution, in terms of requirements anbes tice. In order to retain clarity, the stagpr ss are clearly signposted using the flowchadditionally, where a component addresses a re
down of the SEA Direaddressed in this report are shown in Table 1. are illustrated in the flowchart in Figure 2. T
Environmental Report requirements5 Section of this report (a)an outprogrammprogramm
line of the contents, main objectives of the plan or e and relationship with other relevant plans and es;
Chapter 2
(b) the reenvironmimplemen
levant aspects of the current state of the ent and the likely evolution thereof without tation of the plan or programme;
Chapter 3
(c) the en kely to be Chapter 3 vironmental characteristics of areas lisignificantly affected; (d) any existing environmental problems which are relevant to
ch as areas designated pursuant to Directives (The
Chapter 4 the plan or programme including, in particular, those relating to any areas of a particular environmental importance, su79/409/EEC (The Birds Directive) and 92/43/EEC Habitats Directive); (e) the environmental protection objectives, established at
programme and the way those
Chapter 2 and 5 international, Community or Member State level, which arerelevant to the plan or objectives and any environmental considerations have been taken into account during its preparation; (f) the likely significant effects on the environment, on issues such as biodiversit
including y, population, human health, To follow in Interim SA
3 ODPM (2004). Sustainability Appraisal of Regional Spatial Strategies and Local Development Framework – Consultation Paper (available at: http://www.odpm.gov.uk/stellent/groups/odpm_planning/documents/page/odpm_plan_030923.pdf) 4 ODPM (2005) Sustainability Appraisal of Regional Spatial Strategies and Local Development Frameworks: Interim advice note on frequently asked questions. ODPM (available at: http://www.odpm.gov.uk/stellent/groups/odpm_planning/documents/page/odpm_plan_037013.pdf) 5 As listed in Annex I of the SEA Directive (Directive 2001/42/EC on the assessment of the effects of certain plans and programmes on the environment)

SEA / SA of the Royal Borough of Kensington and Chelsea LDF Scoping Report
©Scott Wilson Business Consultancy September 2005 7
ts, architectural and archaeological
Report and SA Report fauna, flora, soil, water, air, climatic factors, material assecultural heritage including heritage, landscape and the interrelationship between the above factors; (g) the measures envisaged to prevent, reduce and asas possible offset any significant adverse effects on the environment of implementing the plan or p
fully
rogramme;
To follow in Interim SA Report and SA Report
(h) an outline of the reasons for selecting the alternatives dealt with, and a description of how the assessment was undertaken including any difficulties (such as technical deficiencies or lack of know-how) encountered in compiling the required information;
To follow in Interim SA Report and SA Report
(i) a description of the measures envisaged concerning To follow in Interim SA monitoring in accordance with Article 10; Report and SA Report
(j) a non-technical summary of the information provided under To follow in Interim SA the above headings. Report and SA Report

SEA / SA of the Royal Borough of Kensington and Chelsea LDF Scoping Report
©Scott Wilson Business Consultancy September 2005 8
Pre - Production Production Examination Adoption
Evidence gathering
Figure 2. LDF and SA Flow Diagram
Evidence gathering
LDS LDS
SCI SCI
Pre -submission Community InvolvementPre -submission Community Involvement
Issues and options
Issues and options Consultation
on preferred options
Consultation on preferred
optionsSubmission to
SoS Submission to SoS
SEA / SASEA / SA
ExaminationExamination
Pre -Examination
meeting
Pre -Examination
meeting
Representations on submitted
DPD
Representations on submitted
DPD
Conformity and soundness of
DPD
Conformity and soundness of
DPD
Binding Report Binding Report
Annual Monitoring
Report
Annual Monitoring
Report
Adoption / entry into LDF Adoption / entry into LDF
Environment / Sustainability
Report
Environment / Sustainability
Report Key test of ‘soundness’
Pre - Production Production Examination Adoption
Evidence gathering Evidence gathering
LDS LDS
SCI SCI
Pre -submission Community InvolvementPre -submission Community Involvement
Issues and options
Issues and options Consultation
on preferred options
Consultation on preferred
optionsSubmission to
SoS Submission to SoS
SEA / SASEA / SA
ExaminationExamination
Pre -Examination
meeting
Pre -Examination
meeting
Representations on submitted
DPD
Representations on submitted
DPD
Conformity and soundness of
DPD
Conformity and soundness of
DPD
Pre - Production Production Examination Adoption
Evidence gathering
Binding Report Binding Report
Annual Monitoring
Report
Annual Monitoring
Report
Adoption / entry into LDF Adoption / entry into LDF
Environment / Sustainability
Report
Environment / Sustainability
Report
Evidence gathering
LDS LDS
SCI SCI
Pre -submission Community InvolvementPre -submission Community Involvement
Issues and options
Issues and options Consultation
on preferred options
Consultation on preferred
optionsSubmission to
SoS Submission to SoS
SEA / SASEA / SA
ExaminationExamination
Pre -Examination
meeting
Pre -Examination
meeting
Representations on submitted
DPD
Representations on submitted
DPD
Conformity and soundness of
DPD
Conformity and soundness of
DPD
Binding Report Binding Report
Annual Monitoring
Report
Annual Monitoring
Report
Adoption / entry into LDF Adoption / entry into LDF
Environment / Sustainability
Report
Environment / Sustainability
Report Key test of ‘soundness’
SEA / SA of the Royal Borough of Kensington and Chelsea LDF Scoping Report
©Scott Wilson Business Consultancy September 2005 9
1.6 This report
1.6.1 The Scoping Report is the first of two formal reports to be produced as part of the SA process. The Scoping Report consists of 3 volumes, this Scoping Report (Vol. 1) Baseline Characterisation Figures (Vol. II) and the Context Review Technical Appendix (Vol. III) and it is recommended that Vol. I and Vol. II are read in conjunction.
1.6.2 This report documents the findings from Stage A as well as what happens next in the
process. This report will be sent to the four SEA Consultation Bodies6 for comment, the participants of a scoping workshop (see Appendix III) as well as other selected stakeholders (listed in Appendix VII). It will, in line with the (Draft) Statement of Community Involvement (SCI)7, also be placed on the Royal Borough of Kensington and Chelsea website8 (and will continue to be available on the site). This report will be made available for consultation for a period of five weeks in line with the SEA Regulations9.
1.6.3 The Council has decided to produce an informal report, the “Interim SA Report” to make
appraisal information available to the public when they are participating in the process of identification and selection of options10 (see Figure 2). The Scoping Report applies to each of the DPDs referred to in Para 1.1.1. However, further baseline information may be assembled to inform the appraisal of each of these DPDs should this be considered necessary (e.g. GIS data to inform the appraisal of the site allocations DPD). Further information on the next steps in the process can be found in Section 7. Depending on the circumstances, one Final SA Report may be prepared or individual reports may be prepared for each DPD.
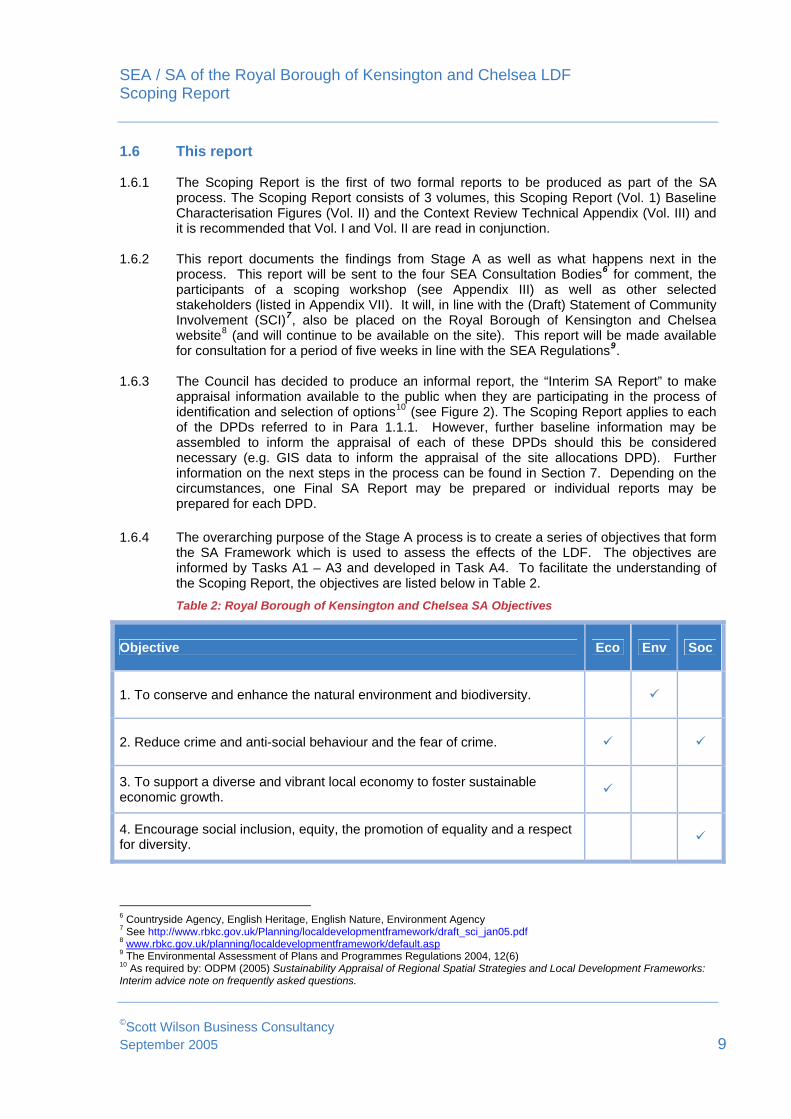
1.6.4 The overarching purpose of the Stage A process is to create a series of objectives that form
the SA Framework which is used to assess the effects of the LDF. The objectives are informed by Tasks A1 – A3 and developed in Task A4. To facilitate the understanding of the Scoping Report, the objectives are listed below in Table 2. Table 2: Royal Borough of Kensington and Chelsea SA Objectives
Objective Eco Env Soc
1. To conserve and enhance the natural environment and biodiversity.
2. Reduce crime and anti-social behaviour and the fear of crime.
3. To support a diverse and vibrant local economy to foster sustainable economic growth.
4. Encourage social inclusion, equity, the promotion of equality and a respect for diversity.
6 Countryside Agency, English Heritage, English Nature, Environment Agency 7 See http://www.rbkc.gov.uk/Planning/localdevelopmentframework/draft_sci_jan05.pdf8 www.rbkc.gov.uk/planning/localdevelopmentframework/default.asp9 The Environmental Assessment of Plans and Programmes Regulations 2004, 12(6) 10 As required by: ODPM (2005) Sustainability Appraisal of Regional Spatial Strategies and Local Development Frameworks: Interim advice note on frequently asked questions.
SEA / SA of the Royal Borough of Kensington and Chelsea LDF Scoping Report
©Scott Wilson Business Consultancy September 2005 10
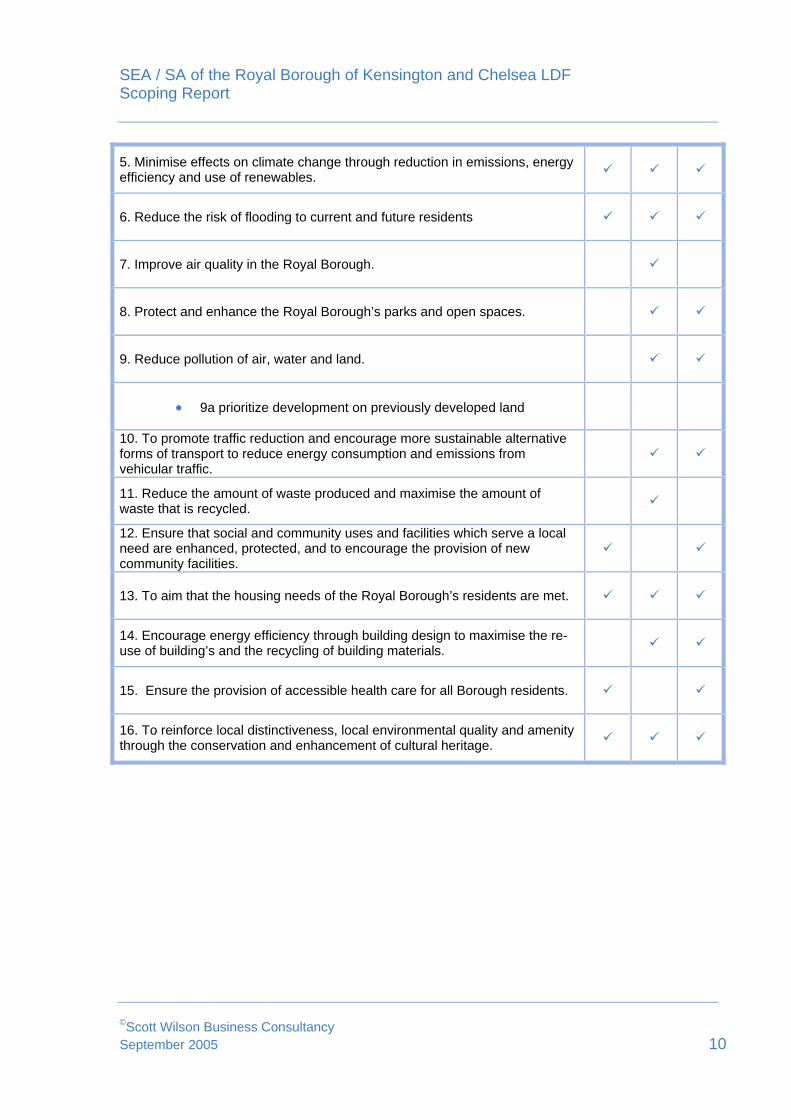
5. Minimise effects on climate change through reduction in emissions, energy efficiency and use of renewables.
6. Reduce the risk of flooding to current and future residents
7. Improve air quality in the Royal Borough.
8. Protect and enhance the Royal Borough’s parks and open spaces.
9. Reduce pollution of air, water and land.
• 9a prioritize development on previously developed land
10. To promote traffic reduction and encourage more sustainable alternative forms of transport to reduce energy consumption and emissions from vehicular traffic.
11. Reduce the amount of waste produced and maximise the amount of waste that is recycled.
12. Ensure that social and community uses and facilities which serve a local need are enhanced, protected, and to encourage the provision of new community facilities.
13. To aim that the housing needs of the Royal Borough’s residents are met.
14. Encourage energy efficiency through building design to maximise the re-use of building’s and the recycling of building materials.
15. Ensure the provision of accessible health care for all Borough residents.
16. To reinforce local distinctiveness, local environmental quality and amenity through the conservation and enhancement of cultural heritage.

SEA / SA of the Royal Borough of Kensington and Chelsea LDF Scoping Report
Figure 3. Outputs from the SA process
Stage A: Setting the context and
objectives, establishing the baseline and deciding on the scope
Stage B: Testing the LDF objectives against the SA framework,
developing and refining options, predicting and assessing effects,
identifying mitigation measures and developing proposals for monitoring
Scoping Report
‘Interim’ SA Report
Stage C: Documenting the appraisal process Final SA Report
Stage D: Consulting on the plan and the SA Report
Stage E: Monitoring implementation of the plan
©Scott Wilson Business Consultancy September 2005 11

SEA / SA of the Royal Borough of Kensington and Chelsea LDF Scoping Report
2 TASK A1: IDENTIFYING OTHER RELEVANT PLANS, PROGRAMMES AND SUSTAINABILITY OBJECTIVES (CONTEXT REVIEW).
Stage A Stage B Stage C Stage D Stage E
A1 – Context A2 – Baseline A3 – Sustainability issues A4 – SA Framework A5 – Consult on scope
2.1.1 The definition of the context in which the LDF is being prepared involves two steps. Firstly,
identifying the relevant Policies / Plans / Programmes / strategies / initiatives (PPPSIs) considered relevant to the LDF and, secondly, reviewing these to establish their implications for the LDF (e.g. the opportunities they create or the constraints they present) as well as for the SEA / SA process.
2.1.2 The requirement to undertake a context review arises from the SEA Directive:
The ‘Environmental Report’ required under the SEA Directive shouldinclude: “an outline of the contents, main objectives of the plan or programme and relationship with other relevant plans and programmes”
(Annex 1(a))
2.1.3 Many policies, plans etc. also set out environmental and wider sustainability objectives.
Under the SEA Directive, reference must be made to environmental objectives. The context review satisfies this requirement.
The ‘Environmental Report’ required under the SEA Directive shouldinclude:
“the environmental protection objectives, established at international, Community or Member State level, which are relevant to the plan or programme…”
(Annex 1 (e)) 2.1.4 The ODPM Guidance states:
“A DPD may be influenced in various ways by other plans and programmes and by external sustainability objectives, such as those laid down in policies or legislation. These relationships should be identified to enable potential synergies to be exploited and any inconsistencies and constraints to be addressed”.
©Scott Wilson Business Consultancy September 2005 12

SEA / SA of the Royal Borough of Kensington and Chelsea LDF Scoping Report
©Scott Wilson Business Consultancy September 2005 13
2.1.5 According to the guidance:
“The review should consider guidance at the international, EU or national level on sustainable development, as well as other policy documents such as Planning Policy Statements. Note should be made of any targets or specific requirements included within them, and what these relate to”.
2.2 Methodology 2.2.1 Table 3 sets out the list of Policies, Plans, Programmes, Strategies and Initiatives (PPPSIs)
reviewed as part of the SEA / SA process. An initial list of those PPPSIs considered relevant was discussed at an workshop session on the 23rd March 2005 (Workshop Report can be found in Appendix II).
Table 3. List of relevant policies / plans / programmes / strategies / initiatives
International
The Johannesburg Declaration on Sustainable Development
European Spatial Development Perspective
Air Quality Framework Directive (96/62/EC) and daughter Directives
Framework Waste Directive (Directive 75/442/EEC, as amended)
Habitats Directive (92/43/EEC)
Birds Directive (79/409/EEC)
Landfill Directive (1999/31/EC)
Water Framework Directive (2000/60/EC)
Convention on Biological Diversity
National
National sustainable development strategy
PPS1: Delivering Sustainable Development
PPS3: Housing
PPG4: Industrial, commercial development and small firms
PPS6: Planning for town centres
PPG8: Telecommunications
PPS9: Biodiversity and Geological Conservation
PPS10: Planning and waste management
PPS12: Local Development Frameworks
PPG13: Transport
PPG14: Development on unstable land
PPG15: Planning and the historic environment

SEA / SA of the Royal Borough of Kensington and Chelsea LDF Scoping Report
©Scott Wilson Business Consultancy September 2005 14
PPG16: Archaeology and planning
PPG17: Planning for open space, sport and recreation
PPG19: Outdoor advertisement control
PPG21: Tourism
PPS22: Renewable energy
PPG23: Planning and pollution control
PPG24: Planning and noise
PPG25: Development and flood risk
Air Quality Strategy for England Wales and Northern Ireland
Environment Act 1995
Planning (Listed Buildings and Conservation Areas) Act 1990
Ancient Monuments and Archaeological Areas Act 1979
National Flood Encroachment Policy (Emerging)
London
The Mayor’s Air Quality Strategy
The Mayor’s Biodiversity Strategy
The Mayor’s Cultural Strategy
The Mayor’s Economic Development Strategy
The Mayor’s Ambient Noise Strategy
The Mayor’s Transport Strategy
The London Plan – Spatial Development Strategy
The Mayor’s Municipal Waste Management Strategy
The Mayor’s Energy Strategy
Thames Flood Encroachment Policy
Local
Air Quality Action Plan
Borough Spending Plan
Environmental Policy Statement
Contaminated Land Strategy – Remediation Strategy
Contaminated Land Inspection Strategy
Housing Strategy
Local Development Scheme 2005
Unitary Development Plan 2002
The Tree Strategy

SEA / SA of the Royal Borough of Kensington and Chelsea LDF Scoping Report
©Scott Wilson Business Consultancy September 2005 15
The Community Strategy: progress Report
The Future of our Community
Cabinet Business Plan
Renewing our Neighbourhoods – Strategy Statement and Action Plan
Community Safety Action Plans
Community Safety Strategy
Homelessness Strategy
Building Communities – A housing strategy for West London
Arts Strategy for Kensington and Chelsea
Interim Local Implementation Plan
Local Biodiversity Action Plan
Municipal Waste Management and Action Plan
Park Strategy
Play Strategy
Sports Strategy
Streetscape Guide
2.2.2 Each PPPSI - was reviewed using a standard pro-forma. This records the following
information:
• Policy / plan / programme / strategy / initiative
• Proponent body
• Status (e.g. statutory, non-statutory)
• Why is it relevant to RBKC?
• Opportunities / synergies
• Constraints / challenges
• Implications for the SA
• Internet link
• Useful cross-references

SEA / SA of the Royal Borough of Kensington and Chelsea LDF Scoping Report
©Scott Wilson Business Consultancy September 2005 16
.2.3 The international / European PPPSIs are, generally speaking, relatively broad brush in are
reflec 2.2.4 e r
the C
2.2.5 en
2
terms of content and have few direct implications for the LDF. Instead, their ambitionsted in low-order PPPSIs.
Th eview of the various PPPSIs is set out in a separate technical appendix available on ouncil’s website11.
Wh considering the context, it is important to recognise three factors:
No list or review of relevant PPPSIs can ever be exhaustive. The context review seeks to identify the key PPPSIs and distil the key messages from these.
PPPSIs often exist in a hierarchy (see Figure 4 for an e
•
• xample). Generally speaking, as the hierarchy is descended from international and European PPPSIs to local PPPSIs, the implications for the LDF become more specific and precise.
• The context is dynamic and new or revised relevant PPPSIs emerge on a regular basis. Of particular relevance is the gradual replacement of Policy Planning Guidance Notes (PPGs) with Planning Policy Statements (PPSs). The Council and the Consultants will keep abreast of any significant changes and the context review will be checked and revised later in the SA process.
11 www.rbkc.gov.uk/planning/localdevelopmentframework/default.asp

SEA / SA of the Royal Borough of Kensington and Chelsea LDF Scoping Report
Figure 4. Example of hierarchical relationship between PPPSIs
Convention on Biological Diversity (CBD) International / European
European Biodiversity Strategy International / European
UK Biodiversity Action Plan
Biodiversity Strategy for England
National
National
London Biodiversity Strategy Regional
RBKC Biodiversity Action Plan Local
Increasing relevance, detail and specificity
2.3 Key messages from the context review 2.3.1 During the initial PPPSI review, RBKC and the consultants identified a number of key
messages that should be taken into account in developing the RBKC LDF and in undertaking the SA process. These messages are intended as guidance for the LDF and the SA to inform the decision making process.
2.3.2 As part of the SA Baseline and Sustainability Issues Workshop (see Appendix II),
participants were asked to comment on these emerging messages and suggest any further relevant messages they considered important. Following the workshop, the participants’ comments and additional messages were examined and integrated into Table 4 and 7. This list of messages is not necessarily exhaustive and no priority should be inferred from the ordering.
©Scott Wilson Business Consultancy September 2005 17

SEA / SA of the Royal Borough of Kensington and Chelsea LDF Scoping Report
©Scott Wilson Business Consultancy September 2005 18
Table 4. Key Messages from Task A1- Context Review
PPPSI Key Message
International
Convention on Biodiversity
Conserve and enhance biodiversity. In particular, the LDF should seek to protect all statutory nature conservation sites as well as focusing on biodiversity in the wider environment, connectivity and the provision of new habitats.
The WSSD on Sustainable Development, Johannesburg Declaration on Sustainable Development – Plan of Implementation
The LDF and SA should include a robust and realistic monitoring framework, carrying out adequate consultation with consultation bodies and stakeholders
Framework Waste Directive,
Options will need to be identified for the disposal, minimisation and treatment of waste.
National
Where possible, promote ‘win-win-win solutions’ that advance economic, social and environmental concerns. In some instances trade-offs between competing objectives may be necessary
Securing the Future – delivering UK sustainable development strategy
Where appropriate, invoke the ‘precautionary principle’ in relation to potentially polluting development Include the 5 principles in policy assessment
Create mixed communities
Reuse urban land and buildings
PPS – 3: Housing
Avoid developments with <30 dwellings per hectare.
PPG – 4: Industrial, commercial development and small firms
Businesses should be located in appropriate areas to service their transport needs and away form areas sensitive to any types of pollution impact
Concentrate major trip generators where there is a choice of means of transport other than the car.
Enhance consumer choice
Regenerate deprived areas
Promote social inclusion
PPS – 6: Planning for Town Centres
Promote good design
PPS – 9: Biodiversity and
Promote the conservation of biodiversity and the enhancement of biodiversity conservation.

SEA / SA of the Royal Borough of Kensington and Chelsea LDF Scoping Report
©Scott Wilson Business Consultancy September 2005 19
Geology Conservation
Conserve and enhance biodiversity. In particular, the protection of all statutory nature conservation sites as well as focusing on biodiversity in the wider environment, connectivity and the provision of new habitats.
PPG – 13: Transport
Reduce car dependence by facilitating more walking and cycling and improving public transport linkages
PPG – 15: Planning and the Historic Environment, PPG – 16: Archaeology and Planning
Preserving and enhancing the Royal Borough’s unique and rich cultural heritage including Conservation Areas, Listed Buildings and sites of Archaeological value.
PPG – 17: Planning for Open Space, sport and recreation
Protect open space and sports and recreational facilities of high quality / value to the local community
Upgrade tourism facilities, promote diversity and reduce seasonality, and ensure that tourist activity is not detrimental to residential amenity
PPS – 21: Tourism
Use existing cultural and historical attributes to encourage sustainable forms of tourism.
The Council may include polices which require a percentage of energy used in new developments to come from on-site, renewable energy developments.
PPS – 22: Renewable Energy
Endeavour to reduce greenhouse gas emissions and adapt to climate changes already underway
PPS – 23: Planning and Pollution Control
Reduce pollutant emissions and enhance air, land and water quality
PPG – 24: Planning and noise
Developments that are potentially noise generating should be permitted provided that they are in appropriate areas to limit impacts on sensitive receptors
Promote more sustainable drainage systems where appropriate PPG – 25: Development and flood risk Development should not be provided in areas at high risk from flooding
London
The Mayor’s Energy Strategy
Develop renewable energy sources and where possible, incorporate renewable energy projects in new developments.
The London Plan Policy 6A.4 indicates that boroughs should reflect the policies of the (London) Plan and include appropriate strategic as well as local needs in their policies. "Affordable housing and public transport improvements should generally be given the highest importance" with priority also given to other areas such as "learning and skills and health facilities and services and childcare provisions".
The Mayor’s Air Quality Strategy
Include policies and objectives with the aim of improving air quality and allocating development according to its effect on air quality.

SEA / SA of the Royal Borough of Kensington and Chelsea LDF Scoping Report
©Scott Wilson Business Consultancy September 2005 20
Endeavour to reduce greenhouse gas emissions and adapt to climate changes already underway
Conserve and enhance biodiversity. In particular, protect all statutory nature conservation sites as well as focussing on biodiversity in the wider environment, connectivity and the provision of new habitats.
The Mayor’s Biodiversity Strategy
Promote the conservation of biodiversity and the enhancement of biodiversity conservation.
The Mayor’s Cultural Strategy
Preserve and enhance the unique and rich cultural heritage including Conservation Areas, Listed Buildings and sites of Archaeological value.
The Mayor’s Economic Development Strategy
Policies should reflect the economic characteristics of the borough.
Local
Air Quality Action Plan
The LDF should acknowledge the targets that need to be met as part of the AQMP and the national targets. Policies should reflect the sources of Air Pollution (motor vehicles, commercial and residential energy uses) and make attempts to address these in future developments and any existing areas within the borough
Environmental Policy Statement
A series of Objectives have been produced through consultation with stakeholders within the borough. The LDF should consider the EPS Objectives
Housing Strategy The Housing Strategy lays out 8 key aims for housing in the borough and a series of key performance indicators. Should use the key principles in creating policy.
The Tree Strategy LDF should reflect the 7 strategic objectives in the strategy
The Future of our Community
The LDF should aim to fulfill residents “wants” in each sector covered by the document and also, commitments within this document will need to be addressed.
Community Safety Strategy
The LDF should concentrate on crime sectors that are highlighted as priorities, and should aim to reduce anti-social behaviour as well as other form s of crime.
Homelessness Strategy
Despite the high house prices within the borough, the needs of the borough in terms of affordable housing will need to be accommodated
Building Communities – A housing strategy for West London
The LDF should ensure that the underlying causes of housing problems are address and suggest suitable mitigation where needed being mindful of the character of the area. Additionally, the bigger picture of housing in West London should be included.
Biodiversity Action Plan
The limited areas of nature conservation interest in the borough should be protected, enhanced, and where possible new habitat should be created.

SEA / SA of the Royal Borough of Kensington and Chelsea LDF Scoping Report
©Scott Wilson Business Consultancy September 2005 21
Waste Management Strategy and Action Plan
Despite constraints, waste management and disposal is a key area where the Borough can improve.

SEA / SA of the Royal Borough of Kensington and Chelsea LDF Scoping Report
3 TASK A2 – COLLECTING BASELINE DATA
Stage A Stage B Stage C Stage D Stage E
A1 – Context A2 – Baseline A3 – Sustainability issues A4 – SA Framework A5 – Consult on scope
3.1.1 Annex I to the SEA Directive states that the Environmental Report (in this case the
‘Sustainability Report’) should include:
(Annex 1(b) and (c))
“the relevant aspects of the current state of the environment and thelikely evolution thereof without implementation of the plan orprogramme”
“the environmental characteristics of areas likely to be significantlyaffected”
3.1.2 The Guidance on Sustainability Appraisal of Local Development Frameworks includes guidance on establishing the context:
“Baseline information provides the basis for predicting and monitoring effects and helps to identify sustainability problems and alternative ways of dealing with them. Sufficient information about the current and likely future state of the plan area should be collected to allow the plan’s or programme’s effects to be adequately predicted.” 12
3.1.3 When collecting baseline data, the aim is to assemble sufficient data on the current and
likely future state of the area to enable the LDF’s effects to be adequately predicted. A key aim is to ensure that, where possible, each of the SA objectives (see Section 5) is ‘underwritten’ with comprehensive and up-to-date baseline information. Baseline information also helps to provide the basis for monitoring effects and helps to identify sustainability problems (see Section 4) and alternative ways of dealing with them.
©Scott Wilson Business Consultancy September 2005 22
12 ODPM (2004). Sustainability Appraisal of Regional Spatial Strategies and Local Development Framework – Consultation Paper (available at: http://www.odpm.gov.uk/stellent/groups/odpm_planning/documents/page/odpm_plan_030923.pdf)
SEA / SA of the Royal Borough of Kensington and Chelsea LDF Scoping Report
©Scott Wilson Business Consultancy September 2005 23
3.1.4 In collecting baseline data, ‘gaps’ in data coverage are inevitably encountered. The
Guidance suggests that where baseline information is unavailable or unsatisfactory, planning authorities should consider how they could improve it for use in assessments of future plans.
3.1.5 The Guidance urges a pragmatic approach to the collection of baseline information: “In
theory, collection of baseline data could go on indefinitely and a practical approach is essential. Where there are gaps, it will be important to record any resulting uncertainties or risks in the appraisal. Provisions should also be made to fill any major gaps for future plans or reviews”.
3.1.6 The Guidance emphasises that it may be necessary to revisit the collection of baseline
information during the SA process as new information and issues emerge. The Council and the Consultants will revisit the baseline information at appropriate instances in the future.
3.2 Indicators 3.2.1 Generally speaking baseline information can be collated from:
• Indicators • Stakeholder consultation • Context review • Studies and reports (e. the forthcoming open spaces strategy
3.2.2 It is helpful within an SA to present much of the baseline information in the form of
indicators. This assists in the process of prioritising the SA issues and contributes to the comparison of the evidence base for the SA with data from other areas or within a time series. Comparing data is important when determining the significance of impacts during Stage B of the SA.
3.2.3 f indicators are monitored over time, the resulting data can reveal trends in performance
(i.e. whether something is getting better or worse). Indicator performance can also be gauged in relation to wider geographical areas (e.g. counties or regions) if comparable data is available. Indicator performance can also be assessed in relation to targets where these exist.
3.2.4 Indicator data can be very useful for identifying the sustainability problems in an area which
an LDF may need to respond to. For example, if an indicator for household recycling showed that the recycling rate was not rising or rising too slowly then the LDF could include an appropriate policy response. Trend data is also useful for identifying the implications of the ‘business-as-usual’ option – i.e. what would happen if no additional action were taken in relation to the indicator – would its performance get better or worse?
3.2.5 For each indicator selected, enough data should be collected to answer a series of
questions including:
• How good or bad is the current situation? Do trends show that it is getting better or worse?
How far is the current situation from any established thresholds or targets? •
3.2.6 Indicator data for RBKC can in some instances be mapped spatially. Spatial data is particularly useful for identifying constraints and opportunities regarding the location of future development. As part of the SA process, the Council and the Consultants have

SEA / SA of the Royal Borough of Kensington and Chelsea LDF Scoping Report
©Scott Wilson Business Consultancy September 2005 24
nformation on the location and delineation of the sustainability issues within the borough.
3.2.7 y Studies, Housing Needs Studies etc. and the appraisal will draw on these as appropriate.
prepared GIS maps of the Royal Borough for several indicators relating to environmental and socio-economic constraints and opportunities, these are located in Vol. II of the Scoping Report. This spatial display of data provides i
Baseline data can also be found in related studies such as Urban Capacit

SEA / SA of the Royal Borough of Kensington and Chelsea LDF Scoping Report
©Scott Wilson Business Consultancy September 2005 25
Data sources
3.3.2
consultation will be held during a Scoping Workshop during the 5 week consultation period.
3.3.3
and the Consultants will work together to characterise these areas (most likely using GIS).
3.3.4 st which the current data for RBKC
can be compared. These comparators take the form of:
(ii) owing how RBKC’s performance compares
(iii) reed target – showing how well RBKC is performing in relation to a certain goal.
3.3.5
3.3 Methodology 3.3.1 The Council and the Consultants have developed an excel spreadsheet for collecting
indicator-based baseline information (see Appendix VIII). This includes columns addressing the following:
• Indicator • RBKC data • London data • National data • Target
larger geographical areas / targets) • Local trend (in relation to past data /s (green, yellow, red) • Indicator statu
• Commentary• Data quality • The Consultants proposed and assembled baseline data (where available) for an initial set of 133 indicators. This set of indicators was subject to discussion at the SA Baseline and Sustainability Issues Workshop and further indicator investigation was subsequently undertaken. As a result, the indicators suggested in the new UK Sustainable Development Strategy13 and the Sustainable Development Framework for London were explored (and some of the originally proposed indicators consequently modified / deleted). Table 5 lists the complete set of baseline indicators investigated (these are organised around the proposed SA objectives – see section 5). Further
It should be noted that the baseline spreadsheet represents ‘work in progress’ since it will be added to / amended as new indicators / sources of baseline information are investigated / brought to the attention of the Council and the Consultants. In particular, data for specific sites cannot be effectively assembled until details of the LDF’s proposed site allocations are made available. Once details of proposed sites emerge, the Council
In order to gauge RBKC’s performance in relation to each indicator, various ‘comparators’ have been identified. These provide a benchmark again
(i) past data for the same indicator – showing the extent of change in RBKC over time; data for a wider geographical area – shwith that of London and the UK; and an ag
Whilst there is a requirement for the effects of the LDF to be monitored, the Council is under no obligation to monitor all of the indicators listed in Table 5. A requirement of the SEA Directive is to identify gaps in baseline knowledge and for a characterisation of the plan area. Therefore, in the initial stages of baseline collection, the net is cast a wide as possible to gather enough data to form a robust characterisation of the borough and assess
13HMSO (2005) Securing the Future - UK Government sustainable development strategy (available from http://www.sustainable-development.gov.uk/documents/publications/strategy/SecFut_complete.pdf)

SEA / SA of the Royal Borough of Kensington and Chelsea LDF Scoping Report
©Scott Wilson Business Consultancy September 2005 26
e proposed at Stage B and finalised at Stage E with which to monitor the effects of the plan
Table 5. Baseline indicators investigated (or under investigation)
which indicators will need further monitoring or studies. In consultation with the council and consultation bodies, a set of indicators will b
Baseline indicators
Objective 1: To conserve and enhance the natural environment and biodiversity. Area of contaminated land Number of waste recycling facilities Achievement of BAP objectives and targets for Key Species Achievement of BAP objectives for key habitats Area of sites of conservation value Bird Populations Biodiversity Conservation priority species status, priority habitat status Number of Tree preservation orders Local environmental quality Habitat Diversity Species Diversity Land Use area used for agriculture, woodland, water or river, urban (contextural indicator) Objective 2. Reduce crime and anti-social behaviour and the fear of crime. Crime survey and recorded crime for a) Vehicles b) domestic burglary c) violence Violence Against the person Sexual Offences Burglary Burglary from Dwelling Theft of a motor vehicle Theft from a motor vehicle Fear of Crime a) Car theft b) burglary c) violence Crime and Disorder Calls to police regarding antisocial behaviour Drug offences Indices of Deprivation - Crime No. of pupils per 1,000 permanently excluded from primary schools Objective 3. To support a diverse and vibrant local economy to foster sustainable economic growth. Unemployment rate Average claimant count rate Proportion of people of working age in employment Proportion of lone parents, long-term ill and disabled people who are economically active Ethnic minority employment and unemployment Low pay Average gross weekly earnings Job Density – Higher the figure, the more jobs. Change in total VAT registered business stock

SEA / SA of the Royal Borough of Kensington and Chelsea LDF Scoping Report
©Scott Wilson Business Consultancy September 2005 27
GVA per capita Proportion of people, in the most deprived areas, of working age in employment Proportion of people, in the most deprived areas, claiming unemployment benefit who have been out of work for more than a year Proportion of young people (18-24 year olds), in the most deprived areas, in full-time education or employment Percentage increase or decrease in work-place based employment in the most deprived areas Average annual increase in GVA per worker for manufacturing and the knowledge sectors Value of manufacturing exports per head Investment a) Total investment b) social investment relative to GDP. Workless households population living in workless households a) Children b) Working age Economically inactive people of working age who are economically inactive Employment in key tourist related sectors in the borough such as hotels and key attractions such as the museums Objective 4. Encourage social inclusion, equity, the promotion of equality and a respect for diversity. Index of multiple deprivation Proportion of children under 16 who live in low income households Benefit recipients Percentage of households in fuel poverty Number of households with no central heating Water affordability Demography population and population of working age Income Deprivation Employment Deprivation Health Deprivation Education , Skills and Training Deprivation Barriers to housing and Services Active community participation informal and formal volunteering at least once a month Childhood poverty children in relative low income households a) before housing costs b) after housing costs Young adults 16-19 year olds not in employment, education or training Pensioner poverty pensioners in relative low income households a) before housing costs b) after housing costs % of pupils achieving Level 4 or above in Key Stage 2 English % of pupils achieving 5 or more GCSEs at grades A* - C or equivalent % of pupils achieving Level 4 or above in Key Stage 2 Maths % of pupils achieving one or more GCSEs at grade G or equivalent % of secondary schools with 25% or more of their places unfilled % of primary schools with 25% or more of their places unfilled Sustainable Development education PTAL scores for the Borough

SEA / SA of the Royal Borough of Kensington and Chelsea LDF Scoping Report
©Scott Wilson Business Consultancy September 2005 28
Objective 5. Minimise effects on climate change through reduction in emissions, energy efficiency and use of renewables Energy use (gas and electricity) Energy use per household CO2 emissions Embodied energy in new buildings Average energy efficiency of buildings SAP Ratings of council's housing stock % Developments with sustainable urban drainage systems Total vehicle kilometres No / % homes in flood plain no / % roads in floodplain No. heat / cold deaths no. cases of subsidence River flows and river quality – River Thames, EA responsibility. No controlled waters in the Borough so not relevant. cost of flooding Greenhouse Gas Emissions Kyoto target and CO2 emissions CO2 Emissions by end user industry, domestic, transport (excluding international aviation Renewable electricity renewable energy generated as a percentage of total energy Electricity generation electricity generated, CO2, Nox, and SO2 emissions by electricity generators and GDP Household energy use domestic CO2 emissions and household final consumption expenditure Energy Supply UK Primary energy supply and gross inland energy consumption Objective 6. Reduce the risk of flooding to current and future residents % of people protected from flooding Riverside development in the site allocation DPD, where the defences have not been proven to have at least the same life expectancy as the development and where a significant set back for access is not achieved. Percentage of developments that provide a FRA, and provide flood mitigation methods where appropriate Proportion of dwellings within indicative floodplain Objective 7. Improve air quality in the Royal Borough. Ecological impacts of air pollution area of UK habitat sensitive to acidification and eutrophication with critical load exceedences Manufacturing sector CO2, NOx, SO2 PM10 Emissions and GVA Service Sector CO, NOx Emissions and GVA Public sector CO2, NOx, Emissions and GVA Resource use Domestic Material Consumption and GDP Road Transport CO2, NOx and PM10 Emissions and GDP. Private Vehicles CO2, emissions and car-km and household final consumption Road Freight CO2 Emissions and GVA Days when Air Pollution is Moderate or Higher (PM10) Days when concentrations of PM10 exceed 50 µg/m3
Annual mean PM concentrations 10
Annual mean NO2 concentrations No of times 1-hour concentration of NO exceed 202 0 µg/m3
Designated Air Quality Management Area/s and Air Quality Action Plan Emissions reduction from Borough Fleet Vehicles

SEA / SA of the Royal Borough of Kensington and Chelsea LDF Scoping Report
©Scott Wilson Business Consultancy September 2005 29
Adoption of Green Travel Plans in Schools Number of (car parking) permit free developments in the Borough Objective 8. Protect and enhance the Royal Borough’s parks and open spaces.
Open space per resident ha / resident
Objective 9. Reduce pollution of air, water and land. Water Resource use total abstractions from non-tidal surface and ground water sources and GDP Domestic water consumption per head Water stress River quality rivers of good Biological and Chemical quality Noise complaints
Objective 9a Prioritize development on previously developed land
Land Recycling a) New dwellings built on previously developed land; b) all new development on previously used land Objective 10. To promote traffic reduction and encourage more sustainable alternative forms of transport to reduce energy consumption and emissions from vehicular traffic. Mobility a) Number of trips per person by mode – trips bu car should be decreasing if objective is being achieved. b) distance travelled per person per year by broad trip purpose. – dependant on trip type, can try to reduce the numbers of trips that could be madfe by alternative transport, say bicycles, this would show in these figures. Travel to work by car Travel to work by public transport Households without car/van Households with 1 car or more Households with 2 or more cars/vans Getting to school how children get to school Road Accidents number of people and children killed or seriously injured Traffic congestion Heavy goods vehicles Leisure trips by mode of transport Monetary investment in public transport, walking and cycling Objective 11. Reduce the amount of waste produced and maximise the amount of waste that is recycled. BV82a Household waste - percentage recycled BV82b Household waste - percentage composted BV82c Household waste - percentage of heat BV82d Household waste - percentage landfilled BV84 Kg of household waste collected per head BV86 Cost of waste collection per household BV87 Cost of waste disposal per tonne for municipal waste BV91 % of pop. served by kerbside collection or within 1km of recycling centre Objective 12. Ensure that social and community uses and facilities which serve a local need are protected, and to encourage the provision of new community facilities. Social investment as per cent of GDP Real changes in the cost of transport

SEA / SA of the Royal Borough of Kensington and Chelsea LDF Scoping Report
©Scott Wilson Business Consultancy September 2005 30
% of local authority buildings suitable for and accessible by disabled people Sports centres Streetscape in need of repair Access to services and facilities
Objective 13. To aim that the housing needs of the Royal Borough’s residents are met. Average house prices House price to income ratio Number of unfit dwellings Numbers of derelict buildings Dwelling Density Households and dwellings households, single person households and dwelling stock (contextural indicator) Housing conditions a) social sector homes below the decent homes standard b) vulnerable households in the private sector in homes below the decent homes standard Households living in fuel poverty a) pensioners b) households with children c) disabled / long-term sick. Homelessness a) rough sleepers b) households in temporary accommodation i) total ii) households with children Change in proportion on non-decent homes Objective 14. Encourage energy efficiency through building design to maximise the re-use of building’s and the recycling of building materials. Percentage of new build and retrofit homes meeting Ecohomes Very Good standard Percentage of commercial buildings meeting BREEAM Very Good standard SAP Ratings of authority owned buildings Objective 15. Ensure the provision of accessible health care for all Borough residents. Long-term illness, health problem or disability which limits people's daily activities or the work they could do Access to a GP Health inequality a) infant mortality(by (socio-economic group) b) life expectancy (by area) for men and women General Health: Good, Fairly Good, Not good Population per GP Mortality rates death rates from a) Circulatory disease b) Cancer, below 75 years and for areas with the worst health and deprivation indicators; c) suicides Smoking prevalence of smoking a) All adults b) 'Routine and manual' socio-economic groups. Childhood obesity prevalence of obesity in 2-10 year-olds. Objective 16. To reinforce local distinctiveness, local environmental quality and amenity through the conservation and enhancement of cultural heritage Conservation areas number and % of borough

SEA / SA of the Royal Borough of Kensington and Chelsea LDF Scoping Report
©Scott Wilson Business Consultancy September 2005 31
Number of listed buildings on BAR register Number of conservation areas and those that do not have Conservation Area Proposals Statements Number and condition of SAMs Number and condition of archaeological priority areas. Historic buildings, sites and conservation areas, including locally listed assets, affected, whether in an adverse or beneficial way”. Visitor numbers to key attractions in RBKC such as the museums. Number and condition of historic parks and gardens 3.3.6
be considered negative from a social point of view (since housing is rendered less affordable) but positive in economic terms
.
3.4.1 indicator was classified as requiring:
en)
•
3.4.2
ell positioned to address some of the issues behind the performance of these
.4.3 necessarily under the
Table 6. Indicators considered a priority for action and needing action
In some instances, an appropriate comparator is not available and indicator status is therefore classified as uncertain. In other cases, indicator status is considered unclassifiable because perspectives on the status of the indicator will vary. For example, relatively high average house prices in RBKC can
(since they can signal a wider economic activity) 3.4 Key messages from the baseline review
In terms of performance, each
• No action needed (gre• Action needed (yellow)
Action a priority (red) • Uncertain or unclassifiable (grey)
Table 6 lists those indicators according to the above classification Although the Council may be windicators, in other cases other organisations or partnerships of organisations may be better placed.
3 It should be noted that some of the highlighted priorities are not
LDF’s field of influence, for example, Average house prices.
Priority for action
Area of sites of nature conservation value
Sexual Offences
Burglary
Fear of Crime
Crime and Disorder
Drug offences
No. of pupils per 1,000 permanently excluded from primary schools
Number of households with no central heating
Days when concentrations of PM10 exceed 50 µg/m3

SEA / SA of the Royal Borough of Kensington and Chelsea LDF Scoping Report
©Scott Wilson Business Consultancy September 2005 32
Annual mean PM10 concentrations
Annual mean NO2 concentrations
Open space per resident ha / resident
BV86 Cost of waste collection per household
Average house prices
Homelessness
May need action
Bird Populations
Violence Against the person
Burglary from Dwelling
Theft of a motor vehicle
Theft from a motor vehicle
Unemployment rate
Proportion of people of working age in employment
Index of multiple deprivation
% of pupils achieving one or more GCSEs at grade G or equivalent
No of times 1-hour concentration of NO2 exceed 200 µg/m3
BV82a Household waste - percentage recycled
BV82b Household waste - percentage composted
BV82c Household waste - percentage of heat
No action needed
Recorded crime for a) Vehicles b) Domestic burglary c) Violence
Average claimant count rate
Job Density
Employment people of working age in employment
Education , Skills and Training Deprivation
% of pupils achieving Level 4 or above in Key Stage 2 English
% of pupils achieving Level 4 or above in Key Stage 2 Maths
% of primary schools with 25% or more of their places unfilled
SAP Ratings of council's housing stock
Travel to work by car

SEA / SA of the Royal Borough of Kensington and Chelsea LDF Scoping Report
©Scott Wilson Business Consultancy September 2005 33
Travel to work by public transport
Households without car/van
Households with 1 car or more
Households with 2 or more cars/vans
Getting to school: children get to school
BV91 % of pop. served by kerbside collection or within 1km of recycling centre
% of local authority buildings suitable for and accessible by disabled people
Long-term illness, health problem or disability which limits people's daily activities or the work they could do
Access to a GP Health inequality a) infant mortality(by (socio-economic group) b) life expectancy (by area) for men and women General Health Good, Fairly Good, Not good Cons ion and Built Heritage ervat
Data ‘gaps’ and availability Inevitably there are considerable gaps in data provision. With the adoption of the updat
3.5
3.5.1 ed K Sustainability Framework14, there are currently many indicators that are ‘under
ics / indicators for which data for RBKC is lacking have been ine spreadsheet, some key areas lacking in data include:
•
sions should not normally be drawn from trends
3.6 3.6.1
c, social and environmental
.6.2 s is fraught with difficulty. These will depend on a wide
range of factors including the global and national economic climate and decisions made at
Udevelopment’. Key areas / topgiven a blank entry in the basel • Sustainable construction
Homes judged fit to live in • Development in the flood plain • Data for AQ trends is not ideal, conclu
based on more than 5 years data. • Carbon dioxide emissions • Ecological and chemical water quality Future trends under the ‘business-as-usual’ option
The SEA Directive requires plan or programme proponents to identify “the relevant aspects of the current state of the environment and the likely evolution thereof without implementation of the plan or programme”. The baseline spreadsheet identifies, using available data, the current state of the RBKC area (in economiterms). The spreadsheet also includes trend data (where available) and the extrapolation of this data can provide clues as to the likely evolution of the RBKC area in the absence of the new LDF and the policies and proposals it will include.
Predicting the nature of future trend3
14 HM Government (2005) Securing the Future – Delivering UK sustainable development strategy. HMSO

SEA / SA of the Royal Borough of Kensington and Chelsea LDF Scoping Report
©Scott Wilson Business Consultancy September 2005 34
tren continue:
ose in medium to low income households;
remaining Open Space; and • Increased pressure on the Biodiversity of the Borough.
3.7
nform the choice of indicators for monitoring the LDF. The Government has recently published Local
Guide. This proposes three types of
• indicators – for monitoring important effects identified by the SA
3.7.3 The following section provides a characterisation of the Royal borough under the banners of the 15 proposed SA Objectives
the national, regional and county level. From the spreadsheet, it appears that the following ds are likely to
• High house prices, acting as a barrier to entry for th
• Increased pressure on the
Links to plan monitoring
The baseline indicators investigated as part of the SA process can i3.7.1
Development Framework Monitoring: A Good Practiceindicators for monitoring development frameworks (see Figure 6):
• Output indicators – for monitoring plan policies
Significant effects
• Contextual indicators – for monitoring the wider background against which the plan operates
3.7.2 Many of the indicators investigated as part of the SA process could be used as contextual
indicators for the LDF or as significant effects indicators, depending on the effects the SA ultimately highlights as important.

SEA / SA of the Royal Borough of Kensington and Chelsea LDF Scoping Report
Figure 6. LDF monitoring
LDD objectives
LDD policies
Policy targets
Output
indicators
Significant effects
Significant effects
indicators
SA targets
Contextual indicators
SA objectives
Core output indicators
Local output
indicators
Appraisal identifies
Regional spatial
monitoring
Give rise to
©Scott Wilson Business Consultancy September 2005 35

SEA / SA of the Royal Borough of Kensington and Chelsea LDF Scoping Report
©Scott Wilson Business Consultancy September 2005 36
3.8 Characterisation of the Royal Borough of Kensington and Chelsea. 3.8.1 This section describes various key attributes of the borough under Objective headings, to
provide an outline of the current situation in the borough. The information presented is included in the baseline spreadsheet (appendix VII) and Figures in Vol. II of this Report and should be read in conjunction.
Objective 1. To conserve and enhance the natural environment and biodiversity.
3.8.2 For one of the most densely populated areas in Europe, there is a significant biodiversity
resource in Kensington and Chelsea. In 1993, 23 Sites of Nature Conservation (SNCI) were proposed for inclusion in the Unitary Development Plan (UDP). In 2002 these sites were reassessed and their conditions appraised15. The study found that there were 3 sites lost or redesignated from 1993 – 2002. There are the Kensal Green Gas Works (BI01), British Rail Western Region Land BII01 and Kings College (BII08). The sites were re-surveyed and modified in 2002 these borough habitat surveys are due to be carried out every ten years. There are now a provisional 23 SNCIs16 that are currently being recommended for designation (Figure OBJ 1.1). There were significant losses in the period 1993 – 2002 and despite effort to create habitat as compensation, the issue of the difficulty of creating like for lie habitats, and the neglect of other sites leads the report to site the situation as “worrying”.
3.8.3 Two strategically important waterways provide boundaries to the borough. In the north the
Grand Union Canal (Paddington Arm) supports a variety of bank-side wildlife and aquatic species. Adjacent to the Canal is Kensal Green Cemetery, the largest area of continuous green-space in the borough and has some of the most flower rich unimproved grasslands in London. In the south, the River Thames, which includes Chelsea Creek, provides an inter-tidal habitat and a valuable fish breeding ground, which in turn attracts many birds to the area. Additionally, Holland Park contains extensive areas of mature woodland, grassland and water habitats with wide diversity of species.
3.8.4 There are many smaller sites within the borough that play a valuable role in the biodiversity
resource. Sites such as the Chelsea Physic Garden, Brompton Cemetery, Kensington Gardens, private gardens such as Ranelagh Gardens and the Ladbroke Grove Garden Complex and school wildlife gardens all provide a place for both native and ornamental species. In addition, the more strategic sites such as the River Thames, Grand Union Canal, and the railway lines that dissect the borough create wildlife corridors.
3.8.5 The Borough’s geology and topography is divided broadly between the low-lying areas to
the south, and the higher ground to the north (Figure OBJ 1.2). The ground gradually rises to the north, with a ridge running from Holland Park through Camden Hill to Kensington Palace, followed by a final rise the highest point in the borough, Kensal Green Cemetery.
3.8.6 The borough has a minor aquifer that covers 90% of the southern part of the borough
(Figure OBJ 1.3). A minor aquifer is variably permeable and seldom produces large quantities of water, however, it may be an important local water source. Groundwater is abstracted at Harrods, Knightsbridge and the water quality is safeguarded by a ‘Source Protection Zone’ (SPZ). The north of the borough is defined as non-aquifer, containing insignificant quantities of groundwater.
15 RBKC (2004) Local Biodiversity Action Plan 2004 – 2006. RBKC 16 RBKC (2004) Local Biodiversity Action Plan 2004 – 2006. RBKC

SEA / SA of the Royal Borough of Kensington and Chelsea LDF Scoping Report
Objective 2. Reduce crime and anti-social behaviour and the fear of crime 3.8.7 The total notifiable offences in the Royal Borough of Kensington and Chelsea have
decrease from the period 2001 – 2004. There have been greater areas of reduction in certain crime demographics, namely burglaries and violent crime which have decreased at a rate higher than the target of 15% reduction. This compares favourably with London crime reduction rates of 1.5%.
3.8.8 The indices of Deprivation Domain for Crime, highlights Super Output Areas (SOA) that lie
within ward boundaries that are within the worst 10% in England and Wales and which are in the 20% worst performing areas. These areas are concentrated in the north of the borough, particularly the areas within the worst 10% (Figure OBJ 2.1).
3.8.9 The Crime and Disorder Audit has revealed other crime characteristics of the borough,
including Disorder and Drug hotspots and their locations within the borough. Much of the core work of the council deals with anti-social behaviour and this has shown in the decreases in anti-social behaviour calls year on year since 2001. Figure 2.2 illustrates these results spatially in the borough.
Objective 3. To support a diverse and vibrant local economy to foster sustainable economic growth.
3.8.10 There has been a growth in the number of people of working age in the Royal Borough of
Kensington and Chelsea from 114710 in 2001 to 131300 in 2004 (mid year estimate) (a 14.5% increase from 2001). Of this number 68.1% (89284) are in employment. The, unemployment rate, as measured by claimants of job seekers allowance, compares well with London, being below the average, and claimants experienced a downward trend between 2000 and 2005 experiencing a 34% drop.
3.8.11 Evidence gathered as part of the review which lead to the 2002 UDP17 indicated that there
is a shortage of small office units, <300m2 and particularly <100m2. Additionally, some wards amongst the most economically deprived in the country in particular, north of the Westway and SW Chelsea18. This is illustrated in Figure OBJ 3.1, Indices of Deprivation – Employment. There is a clear disparity between the north of the borough, particularly, the wards of Golbourne, St Charles and Norland, all of which have SOAs in the 10 most economically deprived in England and Wales.
Objective 4. Encourage social inclusion, equity, the promotion of equality and a respect for diversity.
3.8.12 Within the Royal Borough of Kensington and Chelsea, there is a clear north south
delineation in regard to equity and social inclusion. Figure OBJ 4.1. Indices of Multiple Deprivation, clearly shows that the northern areas of the borough are relatively more deprived than those in the south. Despite perceptions to the contrary, not all of the borough is affluent, indeed there are 3 SOAs in the north of the borough that are in the worst 10% for multiple deprivation in England. This contrasts with the south of the borough where some of the SOAs are in the top 5%, showing the Royal Borough to be an area of extremes.
17 RBKC (1998) Supply and Demand for Small Business Premises in Kensington High Street
18 RBKC Inception Meeting (10 – 02 – 05)
©Scott Wilson Business Consultancy September 2005 37

SEA / SA of the Royal Borough of Kensington and Chelsea LDF Scoping Report
©Scott Wilson Business Consultancy September 2005 38
3.8.13 This is reinforced further in Figures OBJ 4.2 – 4.4, showing in turn the distribution of indices for Education, Skills and Training, Health Deprivation and Disability, Income and Average Income.
Objective 5. Minimise effects on climate change through reduction in emissions, energy efficiency and use of renewables.
3.8.14 The available data for the climate change indicators is scarce. This highlights a problem
that will need to be addressed in the Monitoring Framework to ensure that there is adequate provision of information to assess the contribution to climate change of the borough. Key indicators are seen as: • Number of new developments with BREEAM / Ecohomes ‘Excellent’ rating;
• Average CO2 Emissions per person; 3.8.15 Of the data available, RBKC is currently performing well in regard to council owned
buildings SAP scores, performing better than the UK average and has been rising and achieving in accordance with specified targets
Objective 6. Reduce the risk of flooding to current and future residents
3.8.16 The Royal Borough of Kensington and Chelsea lies to the north of the river Thames. The
Thames barrier offers defense against flooding for all London boroughs with borders to the Thames. Figure OBJ 6.1 illustrates the indicative floodplain for the borough not taking into account the Thames Barrier (i.e. if the flood defenses failed). The flood plains themselves are calculated on a 1 in 200 year flood event basis..
3.8.17 Within the borough there are 8 wards with buildings at risk from a 1 in 200 year event
(including the added variable of a failure in the flood defenses), with total buildings in the flood plain being 2586:
• Notting Barns – 431; • Norland – 1138; • Holland – 800; • Abingdon – 5; • 1; Earl’s Court – • Redcliffe – 2;
• Cremorne – 110; and Royal Hospital – 99. •
Objective 7. Improve air quality in the Royal Borough.
3.8.18 All of the Royal Borough of Kensington and Chelsea has been designated under the
Environment Act 1995 (Part IV) as a Air Quality Management Area (AQMA) for predicted exceedance of the objective values for PM10 (Particulate Matter < 10 micrometres) and the annual mean NO2 (Nitrogen Dioxide). Figure OBJ 7.1. shows the locations of air quality monitoring sites within the borough. Figure 7.2 to 7.5 show the predicted levels of pollutants as used to calculate the predicted exceedances against air quality objectives19.
19 RBKC (2003) Air Quality Action Plan. RBKC

SEA / SA of the Royal Borough of Kensington and Chelsea LDF Scoping Report
©Scott Wilson Business Consultancy September 2005 39
3.8.19 The figures illustrate that the main concentration of pollutants lie on the major roads in the
borough. Further to this, 70% of PM10 and 50% of NO2 emissions are contributed from sources within the Borough. However it is important to note that external sources also contribute to concentrations measured in the borough, particularly in the case of particles sources from outside the borough, and can have a significant impact on concentrations.
3.8.20 In the past 10 years there has been a small decline in nitrogen dioxide levels at two
background sites in the borough (North Kensington and West London). Of the other sites, Cromwell Road appears to show an overall decrease too, however it is difficult to be certain about, as the site was moved in the late 1990’s. Also it is the only site to show a slight increase in nitrogen dioxide levels from 2003 to 2004 this may be due to changes in traffic flows or changes in abatement technology. Trends from the more recently established sites at Knightsbridge and Chelsea (installed April and September 2000 respectively) show overall increases. However, the extraordinary atmospheric conditions of 2003 may skew the results and future monitoring will be very important to predict trends.
3.8.21 The annual mean objective for PM10 was exceeded in 2003 and just above the objective
level in 2004 at the boroughs kerbside monitoring location. This indicates that some busy roadside locations are still breaching the objective. The daily mean objective was not met in 2003 at two of the three sites (one kerb and one roadside). In 2004 only one of the sites exceeded the objective. The introduction of stricter objectives for 2010 will mean that the there will potentially be larger areas exceeding the objectives.
Objective 8. Protect and enhance the Royal Borough’s parks and open spaces.
3.8.22 RBKC has the second lowest proportion of open space to total land areas in London (2.8%)
and the lowest proportion of open space per 1000 population in London (0.26ha)20. Figure OBJ 8.1 highlights the areas within the borough where there open space deprivation. To the south, the wards of Courtfield, Brompton, Redcliffe, Hans Town, Stanley, Royal Hospital and Cremorne are affected, the north west, Golbourne, St Charles, Colville, Notting Barns and Norland wards are affected by open space deprivation.
Objective 9. Reduce pollution of air, water and land.
3.8.23 Noise and nuisance in the borough has fluctuated over the three year period form 2001 –
2004. There was a substantial decrease followed by an increase in 2003 / 2004. This final increase has resulted in the net increase in noise complaint in the borough.
3.8.24 Spatial distribution of these noise complaints is shown in Figure 9.1 as point sources and
type and in Figure 9.2 in incidents per ward. 3.8.25 Water quality in this area of the Thames has been increasing for a period of 8 years. 3.8.26 There is a information gap concerning the incidents of pollutant spills and their location and
content.
Objective 9a. Prioritise development on previously developed land
20 RBKC (2002) Unitary Development Plan (Adopted). RBKC and RBKC (2004) Local Biodiversity Action Plan. RBKC

SEA / SA of the Royal Borough of Kensington and Chelsea LDF Scoping Report
©Scott Wilson Business Consultancy September 2005 40
3.8.27 RBKC perfumes particular well in regard to this objective, having 100% of development on previously developed land for the last four years, exceeding both London and national figures and the Governments headline target of 60%. Objective 10. To promote traffic reduction and encourage more sustainable alternative forms of transport to reduce energy consumption and emissions from vehicular traffic.
3.8.28 The baseline information for air pollution indicates that road vehicles are a significant
source of the air pollution within the borough. The air quality modeling figures reinforce this message with areas of higher pollutant concentrations being the major road transport routes.
3.8.29 The accessibility to public transport in the borough is variable, from Low in the north west
and south to high in a curve from Notting Hill Gate to South Kensington. Figure 10.1 shows the Public Transport Accessibility Levels (PTAL) in the Royal Borough of Kensington and Chelsea, clearly showing this differentiation.
Objective 11. Reduce the amount of waste produced and maximise the amount of waste that is recycled.
3.8.30 The borough compares favorably in regard to the disposal and handling of waste. For 4 out
of 5 indicators, the borough is showing an improving trend (although for some, such as Composted Waste, the increase is slight and does not compare well with the London average).
3.8.31 Anecdotal evidence suggests there is a problem with recycling in the borough21. This is
could be caused by a combination of population density, nature of the built environmental, the transient nature of the population and the provision of facilities in such a heavily populated borough.
Objective 12. Ensure that social and community uses and facilities which serve a local need are enhanced, protected, and to encourage the provision of new community facilities.
3.8.32 There are significant knowledge gaps for this objective, leading to limited scope for
characterisation and choosing indicators. The information available indicates that accessibility in the borough is on the increase, with 17.2% of local authority buildings suitable for and accessible by the disabled.
3.8.33 The indices of deprivation for RBKC (4.1, 4.2 and 4.3) show a clear separation between the
north and the south of the borough in regard to health, training and disability.
Objective 13. To aim that the housing needs of the Royal Borough’s residents are met.
3.8.34 The average house price in the Royal Borough of Kensington and Chelsea is nearly 400%
more than the average price of a house in England and Wales, with average house prices in 2004 being over £700,000, out of the range of low and mid range earners22 Following
21 RBKC Inception Meeting (10 – 02 – 05) 22 Fordham Research (2005) Royal Borough of Kensington and Chelsea Housing Study (Draft). Fordham Research

SEA / SA of the Royal Borough of Kensington and Chelsea LDF Scoping Report
©Scott Wilson Business Consultancy September 2005 41
pervading market trends, the house prices in the Borough, in line with London and South East House prices have been increasing.
3.8.35 With 131 people per hectare density, RBKC has the highest population density of a LPA in
Britain (Figure 13.1). Additionally, some Super Output Areas (SOA) are ranked in the worst 20% of authorities in England in relation to the indices of deprivation for housing (an amalgamated result considering performance in 3 indicators: homeless households in temporary accommodation, household overcrowding and poor private sector housing) (Figure 13.2). Housing problems could also be due to the nature of the built environment, and the transient nature of the population.
Objective 14: Encourage energy efficiency through building design to maximise the re-use of building’s and the recycling of building materials.
3.8.36 In regard to housing stock, 31% of council stock and 13% of private housing stock are
classified as fuel poor. 58% of Council homes were classified as not meeting the Government’s Decent Home Standard. In regard to energy efficiency, there is a lack of data on any BREEAM or Ecohomes or equivalent assessments in the Borough, although the council does perform well in regard to SAP ratings for Council owned buildings.
Objective 15. Ensure the provision of accessible health care for all Borough residents.
3.8.37 The Royal Borough of Kensington and Chelsea generally performs well in regard to health.
RBKC has the sixth highest proportion of GP’s for current population in the country, second only to Westminster in the London Boroughs. However, in considering the distribution and equality of heath care it is interesting to note that the northern area of the borough has an SOA in the ranked in the worst 10% performing SOAs in the UK.
3.8.38 The Royal Borough has higher than the UK average performance for those feeling in good
health and has higher life expectancies that the England and Wales average. However, the borough has a higher proportion of smokers than London and the UK.
Objective 16. To reinforce local distinctiveness, local environmental quality and amenity through the conservation and enhancement of cultural heritage.
3.8.39 A large part of the Borough derives its character and townscape from its heritage of
eighteenth, nineteenth and early twentieth century buildings. The Council has designated 35 Conservation Areas, encompassing about 70% of the Borough. The Borough also contains some 4200 buildings which are listed at Grade II or above for their special architectural or historic interest. Figure OBJ 15.1 illustrates the areas covered by conservation areas, and the location, concentration and designation of listed buildings and monuments in the borough.
3.8.40 There are further areas of architectural character and historic interest such as the
strategically important view of St. Paul’s Cathedral (Figure OBJ 15.2). The strategic importance of the Thames and the functions it serves in addition to its importance for archaeology are recognized (Figure OBJ 15.3).


SEA / SA of the Royal Borough of Kensington and Chelsea LDF Scoping Report
4 TASK A3 – IDENTIFYING SUSTAINABILITY ISSUES
Stage A Stage B Stage C Stage D Stage E
A1 – Context A2 – Baseline A3 – Sustainability issues A4 – SA Framework A5 – Consult on scope
4.1 Introduction 4.1.1 The identification of sustainability problems facing RBKC provides an opportunity to define
key issues for the LDF and to develop sustainable plan objectives and options for resolving these. The identification of sustainability problems can also provide useful information to inform the SA process.
4.1.2 The requirement to identify sustainability problems arises from the SEA Directive:
(Annex 1(d))
The ‘Environmental Report’ required under the SEA Directive should include:
“any existing environmental problems which are relevant to the plan orprogramme including, in particular, those relating to any areas of a particularenvironmental importance, such as areas designated pursuant to Directives79/409/EEC [the ‘Birds Directive’] and 92/43/EEC [the ‘Habitats Directive’]”
4.1.3 In light of the SA requirement, economic and social as well as environmental problems
should be identified.
“The identification of sustainability problems is an opportunity to define key issues for the DPD and develop sustainable plan alternatives and options…”(ODPM 2004)
4.1.4 The Guidance emphasises that any problems identified should, where possible, be
supported by evidence in the form of baseline information. 4.2 Methodology 4.2.1 These problems have been identified through the context review (A1); the baseline review
(A2); an informal brainstorming session with planners; and discussions with the LPA at the Baseline and Sustainability Issues Workshop and reference to various reports. During the workshop, participants were asked to brainstorm the sustainability problems facing RBKC and these are reflected where appropriate in Table 7.
©Scott Wilson Business Consultancy September 2005 43

SEA / SA of the Royal Borough of Kensington and Chelsea LDF Scoping Report
©Scott Wilson Business Consultancy September 2005 44
4.2.2 The assessment of sustainability issues is an iterative process throughout the stages of SA. The key sustainability issues in Table 7 below were identified in 4 discrete stages:
• A1 – Context Review: Constraints and conflicts were identified within the PPPSI
which highlighted key areas which the SA was required to appraise e.g. PPG – 3 and the requirement to “…meet the housing requirements of the whole community, including those in need of affordable and special needs housing”23
• A2 – Baseline Review: During the collation of baseline data, trends and sustainability issues where highlighted in the “indicator status” column in order to identify key issues, e.g. Annual mean NO2 concentrations.
• Consultation with the Council: The inception meeting held on the 10th February 2005 was used to consult with the Council and to gain local knowledge of any sustainability issues that are present in the borough.
• Workshops: A baseline and sustainability issues workshop was held on the morning of the 23rd March to brainstorm both sustainability issues and opportunities but also to draw out any information and documentation that may have been excluded from the baseline review. The workshop report is included in Appendix II.
4.3 Sustainability Issues facing the Royal Borough of Kensington and Chelsea 4.3.1 Table 7 lists the economic, social and environmental problems facing the Royal Borough
together with sources of supporting evidence. This evidence includes findings from the context review since actions for the Council identified in other plans and programmes are likely to be a response to recognised problems.
Table 7. Sustainability problems facing the Royal Borough of Kensington and Chelsea and associated supporting evidence
Sustainability problem
Supporting evidence
Economic Deprivation – some wards amongst the most economically deprived in the country in particular, north of the Westway and SW Chelsea.
RBKC Inception Meeting (10 – 02 – 05) Proportion of people of working age in employment Income Indices of deprivation - Clear inequalities between the North and the South of
the Borough with many SOA’s being in the bottom 10% of those in the UK. Index of multiple deprivation shows a clear delineation between north and south
Shortage of small office units, <300m2 and particularly <100m2.
RBKC Inception Meeting (10 – 02 – 05)
Average house prices Average house prices the highest in the UK at over £700,000, creating a barrier to entry for low and medium level earners.
Environmental Air quality – the whole borough is a declared AQMA for both PM10 and NO2
RBKC Inception Meeting (10 – 02 – 05) Days when concentrations of PM10 exceed 50 µg/m3 Annual mean PM10 concentrations
23 ODPM (2000) Planning Policy Guidance 3: Housing. ODPM: London

SEA / SA of the Royal Borough of Kensington and Chelsea LDF Scoping Report
©Scott Wilson Business Consultancy September 2005 45
Annual mean NO2 concentrations No of times 1-hour concentration of NO2 exceed 200 µg/m3
Open Space – there is a shortage of open space in the borough, and a shortage of areas in which to create additional open space.
RBKC Inception Meeting (10 – 02 – 05) Open space per resident ha / resident – Second lowest proportion of open space to
total land areas and lowest per population in London and the UK24
Noise and Vibration – 10,000 noise complaints last year (2004)
RBKC Inception Meeting (10 – 02 – 05)
Traffic – two thirds more parking permits issued than parking spaces.
RBKC Inception Meeting (10 – 02 – 05)
Waste – RBKC not meeting recycling targets
RBKC Inception Meeting (10 – 02 – 05) Cost of waste collection per household is increasing and higher than London levels Household waste - percentage recycled, Household waste - percentage composted,
Household waste - percentage of heat all below UK and London averages Adequate waste and recycling storage in new builds / housing conversions / office
space (also to include community composting?)
Area of sites of conservation value
Bird Populations in decline Loss of sites of conservation value.
Social Housing – the availability of low cost, affordable housing
RBKC Inception Meeting (10 – 02 – 05) Average house prices – highest in the UK at over £700,000. Homelessness – upward trend in the numbers of homeless since 2000/2001
Health - Shortage of Doctors Surgeries and GPs
RBKC Inception Meeting (10 – 02 – 05)
Education – Monitoring of education performance in the borough proposed Need for secondary school in the SW of the borough.
RBKC Inception Meeting (10 – 02 – 05) % of pupils achieving one or more GCSEs at grade G or equivalent – at national
average in 2003/2004 but showed significant decline from 2001/2002 No. of pupils per 1,000 permanently excluded from primary schools – increased by
nearly 200% from 2001/2002 levels in 2003/2004
Community Facilities – lack of elderly person homes (Care Homes).
RBKC Inception Meeting (10 – 02 – 05)
Crime RBKC Inception Meeting (10 – 02 – 05) Total notifiable offences are declining, however, there have been increases in sexual
offences, burglary, fear of crime is higher than England and Wales averages and drug offences are on the increase.
24 RBKC (2004) Local Biodiversity Action Plan 2004 – 2006. RBKC


SEA / SA of the Royal Borough of Kensington and Chelsea LDF Scoping Report
5 TASK A4 – DEVELOPING THE SA FRAMEWORK
Stage A Stage B Stage C Stage D Stage E
A1 – Context A2 – Baseline A3 – Sustainability issues A4 – SA Framework A5 – Consult on scope
5.1 Introduction 5.1.1 SA is fundamentally based on an objectives-led approach whereby the potential impacts of
a plan are gauged in relation to a series of aspirational objectives for sustainable development. In other words, the objectives provide a methodological yardstick against which to assess the effects of the plan. The SA Framework – as the Guidance refers to it – consists of objectives and associated targets (where these exist) as well as indicators (see Section 3).
5.1.2 It should be noted that the SA objectives are distinct from the LDF objectives though they
may in some cases overlap with them. SA objectives should focus on outcomes (or ends), not on how the outcomes will be achieved (inputs or means), as LDF objectives will often tend to do.
5.1.3 Each region has now adopted a Sustainable Development Framework (SDF). Government
guidance on the preparation of RSDFs states, “Regional sustainable development objectives set out in the framework will provide common and agreed starting points for revisions to, and sustainable development appraisals of, other regional strategies and policies” 25. In the case of the Council’s Objectives, these are derived from the Sustainable Development Framework for London (SDFL), developed by the London Sustainable Development Commission as well as from objectives already adopted by the Council. The Framework sets out a Vision for the capital and a set of 14 objectives to guide decision-making. The Framework should be used to:
• Provide the context for policy development and decision-making;
• Undertake sustainability appraisals of projects, plans and strategies; and
• Monitor progress towards a more sustainable city. 5.1.4 In addition to SDFL objectives, SA objectives should also take into account the messages
emerging from stages A1, A2 and A3 in the SA process (see Figure 7).
©Scott Wilson Business Consultancy September 2005 47
25 DETR (2000). Guidance on Preparing Regional Sustainable Development Frameworks (available at: http://www.defra.gov.uk/environment/sustainable/rsdf/guidance2000/)

SEA / SA of the Royal Borough of Kensington and Chelsea LDF Scoping Report
Figure 7. Establishing the SA objectives 5.2 Methodology 5.2.1 In light of the above, the Consultants proposed a draft set of 15 SA objectives for
discussion based primarily on the objectives of the SDFL. However, in drafting these objectives, the Consultants also considered the objectives of the Council’s current UDP. In order to render the SA process more manageable, several of the SDFL objectives were amalgamated in order to reduce the overall number.
5.2.2 The 15 draft objectives were discussed at the Sustainability and Baseline Workshop.
Participants suggested a series of amendments and, in light of these, a revised set of 16 objectives are proposed – see Table 8. These revisions took into account the messages emerging from stages A1, A2 and A3. Note that the objectives are numbered for convenience only and no indication of relatively priority should be inferred.
5.2.3 In order to accommodate the various issues raised and the amendments deemed
necessary, the Consultants will, for certain objectives, also develop several sub-objectives. These sub-objectives will be developed in light of scoping report responses and will be submitted with the Interim SA Report for Consultation. They will provide useful prompts when undertaking the appraisal and help to ensure that all the key issues are considered.
5.2.4 The 15 originally proposed objectives are set out in Appendix III and the changes made to
these in light of the Baseline and Sustainability Issues Workshop are documented in Appendix IV.
©Scott Wilson Business Consultancy September 2005 48

SEA / SA of the Royal Borough of Kensington and Chelsea LDF Scoping Report
©Scott Wilson Business Consultancy September 2005 49
Table 8: SA Framework and Objectives
SDFL Objective Reference
SEA Topic Policy Reference Sustainability Issue
Proposed SA Objectives and Sub-Objectives
1, 2, 3, 4, 9, Biodiversity, flora, fauna, soils
Convention on Biodiversity, PPS 9, The Mayor’s Biodiversity Strategy The Local Biodiversity Action Plan, adopted by the Council in 2004 has the following objectives: • Habitat protection – to protect the open spaces and SNCI in
Kensington and Chelsea; • Habitat creation and improvement – to create new habitats
and increase biodiversity in the Borough; and • Practical management – to manage the Council’s own land
to increase its value for biodiversity and to encourage and assist other landowners to do likewise.
The UDP contains a number of sustainable development objectives. These include an objective to “conserve and enhance the natural environment and biodiversity.”
Whole borough is ‘brownfield’ in terms of the land may be derelict or previously used. There may, in some cases be contamination of these sites due to previous uses.
1. To conserve and enhance the natural environment and biodiversity.
1, 2,3 , 4, 5, 7 Human Health
Securing the Future – delivering UK sustainable development strategy, PPS – 6 The RBKC Community Safety Strategy 2005-08 has a number of aims which are relevant. These include an aim which states: • Residents are and feel more secure in their homes and daily
lives. To achieve this aims objectives include: • Reduce the core crimes of street crime, domestic burglary
and motor-vehicle crime and • Reduce disorder and antisocial behaviour.
Crime – drugs and ‘Crackhouses’
2. Reduce crime, anti-social behaviour and the fear of crime.

SEA / SA of the Royal Borough of Kensington and Chelsea LDF Scoping Report
©Scott Wilson Business Consultancy September 2005 50
SDFL Objective Reference
SEA Topic Policy Reference Sustainability Issue
Proposed SA Objectives and Sub-Objectives
Deprivation – some wards amongst the most economically deprived in the country in particular, north of the Westway and SW Chelsea.
1, 2, 3, 4, 5, 6, 11, 13,
Population Securing our Future, PPG – 3, PPG – 6, The Mayor’s Economic Development Strategy Strategic Policy STRAT 20 of the Royal Borough’s UDP states that the Council will “support and maintain the existing diverse and vibrant local economy and to foster sustainable economic growth whilst protecting the residential environment inappropriate to the residential environment by its nature and scale of activities generated.” The title of the Council’s corporate equality policy, July 2004 is ‘Promoting equality and respecting diversity’.
Shortage of small office units, <300m2 and particularly <100m2.
3. To support a diverse and vibrant local economy to foster sustainable economic growth. 4. Encourage social inclusion, equity, the promotion of equality and a respect for diversity.
1, 2, 3, 4, 10, 12.
Climatic Factors
Securing the Future, PPS – 22, The Mayor’s Energy Strategy The Corporate Energy Policy endorsed by Management Board in June 2003. It sets out the corporate commitment to reduce consumption, use of fossil fuels and emissions of CO2 and all the environmental impacts arising from our consumption of energy. It also sets out commitment to increasing our energy efficiency and our use of renewable energy.
The Environmental Policy Statement 2003-06 also sets out the Council’s commitment to energy efficiency and, reducing use of fossil fuels and to limiting the damaging effects on the local and global environment.
5. Minimise effects on climate change through reduction in emissions, energy efficiency and use of renewables.
1, 2, 3, 4, 7, 9. 10, 12
Climatic Factors, Water, Human Health, Biodiversity
PPG – 25 Policy PU10 of the Royal Borough’s UDP states that the Council will “encourage the use of sustainable urban drainage techniques in appropriate development.”
6. Reduce the risk of flooding to current and future residents

SEA / SA of the Royal Borough of Kensington and Chelsea LDF Scoping Report
©Scott Wilson Business Consultancy September 2005 51
SDFL Objective Reference
SEA Topic Policy Reference Sustainability Issue
Proposed SA Objectives and Sub-Objectives
Para12.6.5 of the UDP states that “Unattenuated run-off from redeveloped land can increase the risk of flooding from receiving watercourses, can lead to pollution problems and can damage river habitat. Sustainable drainage techniques are effective for reducing these impacts and resulting benefits for water quality, ecology and flood risk.”
1, 2, 3, 4, 9. 10.
Air PPS – 23, The Mayor’s Air Quality Strategy The Council's Environmental Policy Statement 2003-2008 contains an objective to “improve air quality in the Royal Borough”
Air quality – the whole borough is a declared AQMA for both PM10 and NO2
7. Improve air quality in the Royal Borough.
1, 2, 3, 4, Biodiversity, Human Health, Material Assets
PPG – 17 The Council's Environmental Policy Statement 2003-2008 contains an objective to ”protect and enhance our trees, parks and open spaces”
Open Space – there is a shortage of open space in the borough, and a shortage of areas in which to create additional open space.
8. Protect and enhance the Royal Borough’s parks and open spaces.
1, 2, 3, 4, 7, 10.
Human Health, Air
PPS – 23, PPG – 24 The UDP contains a number of sustainable development objectives. These include an objective, “to reduce pollution or air, water and land.”
Noise and Vibration – 10,000 noise complaints last year (2004)
9. Reduce pollution of air, water and land.
1, 2, 3, 4, 9, 10, 7, 8, 9.
Human Health, Population
PPG – 4, PPG – 13 The Council has adopted objectives within the UDP for transport in the Borough which include: • to reduce the need to travel and, in particular, the number
and length of motor vehicle trips by ensuring that development is located appropriately;
Traffic – two thirds more parking permits issued than parking spaces.
10. To promote traffic reduction and encourage more sustainable alternative forms of transport to reduce energy consumption and emissions from vehicular traffic.
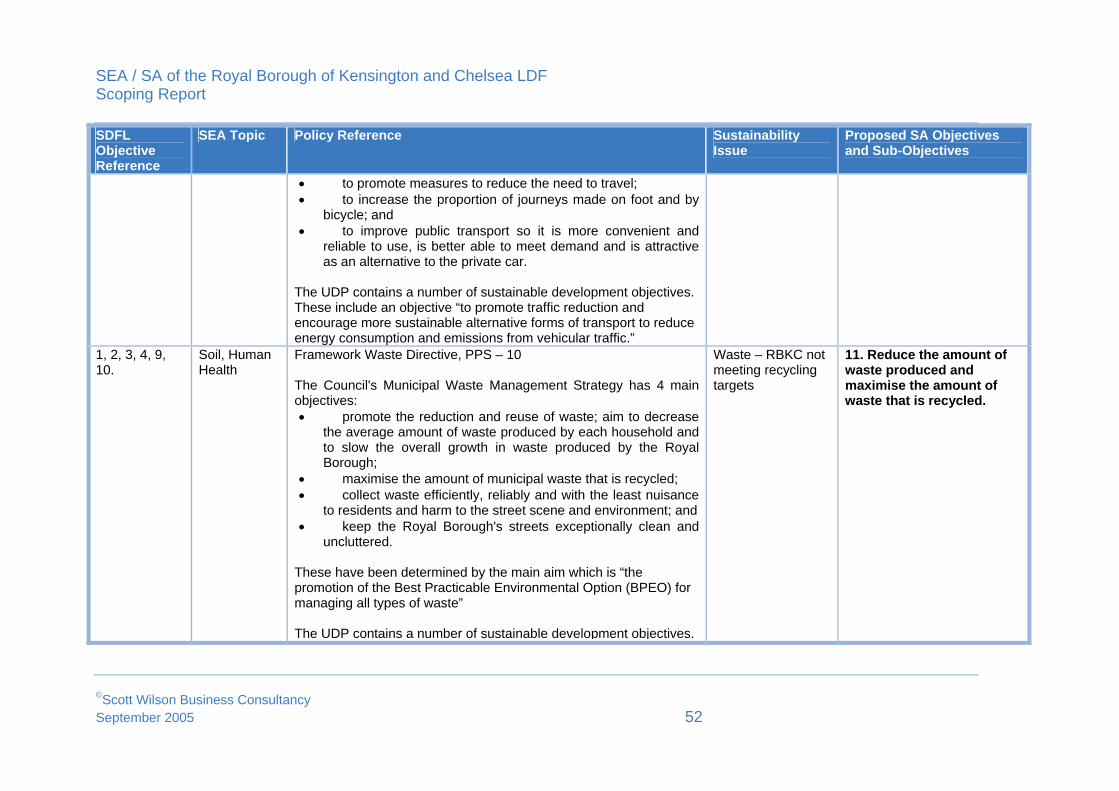
SEA / SA of the Royal Borough of Kensington and Chelsea LDF Scoping Report
©Scott Wilson Business Consultancy September 2005 52
SDFL Objective Reference
SEA Topic Policy Reference Sustainability Issue
Proposed SA Objectives and Sub-Objectives
• to promote measures to reduce the need to travel; • to increase the proportion of journeys made on foot and by
bicycle; and • to improve public transport so it is more convenient and
reliable to use, is better able to meet demand and is attractive as an alternative to the private car.
The UDP contains a number of sustainable development objectives. These include an objective “to promote traffic reduction and encourage more sustainable alternative forms of transport to reduce energy consumption and emissions from vehicular traffic.”
1, 2, 3, 4, 9, 10.
Soil, Human Health
Framework Waste Directive, PPS – 10 The Council's Municipal Waste Management Strategy has 4 main objectives: • promote the reduction and reuse of waste; aim to decrease
the average amount of waste produced by each household and to slow the overall growth in waste produced by the Royal Borough;
• maximise the amount of municipal waste that is recycled; • collect waste efficiently, reliably and with the least nuisance
to residents and harm to the street scene and environment; and • keep the Royal Borough's streets exceptionally clean and
uncluttered.
These have been determined by the main aim which is “the promotion of the Best Practicable Environmental Option (BPEO) for managing all types of waste” The UDP contains a number of sustainable development objectives.
Waste – RBKC not meeting recycling targets
11. Reduce the amount of waste produced and maximise the amount of waste that is recycled.

SEA / SA of the Royal Borough of Kensington and Chelsea LDF Scoping Report
©Scott Wilson Business Consultancy September 2005 53
SDFL Objective Reference
SEA Topic Policy Reference Sustainability Issue
Proposed SA Objectives and Sub-Objectives
This includes an objective “to support the ‘proximity principle’, waste reduction, the maximisation of recycling and the best practicable environmental option for non-recyclable residual waste.”
Education – Gap in knowledge on the state of education in the borough. Need for secondary school in the SW of the borough.
1, 2, 3, 4, 12 Population Human Health
PPS – 3, PPG – 17, PPS – 22 The objectives of the Social and Community Uses chapter of the Royal Borough’s UDP are: • to protect existing social and community uses and facilities
in the Borough where an established local need exists, and • to encourage the provision of new social and community
uses and facilities in appropriate locations and according to the needs of the Borough’s population.
The central ‘Part 1 policy’ notes that London’s role as a capital city depends on the maintenance of an established and stable residential population which in turn requires the support of social and community services.
Community Facilities – lack of elderly person homes (Care Homes).
12. Ensure that social and community uses and facilities which serve a local need are enhanced, protected, and to encourage the provision of new community facilities.
1, 2, 3, 4, 14 Human Health
PPG – 3, PPS – 22, The London Plan Two of the strategic aims of the Royal Boroughs Housing Strategy 2003-2008 are to: • Develop options to meet housing needs – to meet housing
need by promoting the supply of affordable housing in all tenures and
• Better asset management – to improve the physical
Housing – the availability of low cost, affordable housing
13. To aim that the housing needs of the Royal Borough’s residents are met 14. Encourage energy efficiency through buildings and the recycling of building materials

SEA / SA of the Royal Borough of Kensington and Chelsea LDF Scoping Report
©Scott Wilson Business Consultancy September 2005 54
SDFL Objective Reference
SEA Topic Policy Reference Sustainability Issue
Proposed SA Objectives and Sub-Objectives
condition of the housing stock and surrounds, and promote greater energy efficiency, to enhance the
Action 24 of the Borough’s Air Quality Action Plan is “the Council will continue to promote energy-efficiency measures in homes in the Royal Borough, under its HECA and specifically its Affordable Warmth work. It will also consider and require efficient local energy generating schemes where practicable.”
The UDP contains a number of sustainable development objectives. This includes an objective “to promote energy conservation through building design to maximise the re-use of building’s and the recycling of building materials.”
1, 2, 3, 4, 14 Human Health
The London Plan, PPS – 3 Para 9.6.16 of the UDP states that the Council will seek to protect health service facilities in order to ensure the provision of accessible health care for all Borough residents.
Health - Shortage of Doctors Surgeries and GPs
15. Ensure the provision of accessible health care for all Borough residents.
1, 2, 3, 4, 9 Landscape, Cultural Heritage
PPG – 15, PPS – 21, The Mayor’s Cultural Strategy The Council's Environmental Policy Statement 2003-2008 includes objectives to:
Conservation Areas and Listed buildings – the borough is over
16. To reinforce local distinctiveness, local environmental quality and amenity through the

SEA / SA of the Royal Borough of Kensington and Chelsea LDF Scoping Report
©Scott Wilson Business Consultancy September 2005 55
SDFL Objective Reference
SEA Topic Policy Reference Sustainability Issue
Proposed SA Objectives and Sub-Objectives
• improve the Royal Borough’s townscape though good design and
• sustain the Royal Borough’s unique character by maintaining and enhancing conservation areas and listed building.
The UDP contains a number of sustainable development objectives. These include an objective to ”to reinforce local distinctiveness, local environmental quality and amenity through the conservation and enhancement of cultural heritage and natural resources (open spaces)”
70% Conservation Area and has over 4200 listed buildings (II, II* and I)
conservation and enhancement of cultural heritage.


SEA / SA of the Royal Borough of Kensington and Chelsea LDF Scoping Report
6 TASK A5 – CONSULTING ON THE SCOPE OF THE SA
Stage A Stage B Stage C Stage D Stage E
A1 – Context A2 – Baseline A3 – Sustainability issues A4 – SA Framework A5 – Consulting on scope
6.1 Introduction 6.1.1 Under the regulations implementing the SEA Directive, RBKC has a statutory duty to
consult the four SEA Consultation Bodies – the Countryside Agency, English Heritage, English Nature and the Environment Agency – on the scope of the assessment.
(Article 5(4))
“The [Environmental] authorities [designated for the purposes of the SEADirective in each EU Member State]…shall be consulted when deciding onthe scope and level of detail of the information which must be included inthe environmental report”
6.1.2 The ODPM Guidance considers stakeholder consultation at Stage A particularly important:
“Consultation at this stage helps to ensure that the SA will be comprehensive and robust enough to support the DPD during the later stages of full public consultation and examination”. In particular, the Guidance suggests, “Sustainability objectives and indicators and targets should be developed with input from key stakeholders and ideally should be open to wider comment and discussion”.
6.1.3 Copies of this Scoping Report and supporting documents will be distributed to the
Consultation Bodies specified by the SEA Directive26 for the 5 week consultation period required by as specified by Regulation 12 (6)27 and guidance. Additionally, as advises by the latest guidance28, the same reports will be made available to other relevant bodies with social and economic responsibilities, these are listed in Appendix V.
©Scott Wilson Business Consultancy September 2005 57
26 Environment Agency, Countryside Agency, English Nature and English Heritage. 27 Environmental Assessment of Plans and Programmes Regulations 2004 28 ODPM (2005) Sustainability Appraisal of Regional Spatial Strategies and Local Development Frameworks: Interim advice note on frequently asked questions. ODPM (available at: http://www.odpm.gov.uk/stellent/groups/odpm_planning/documents/page/odpm_plan_037013.pdf)
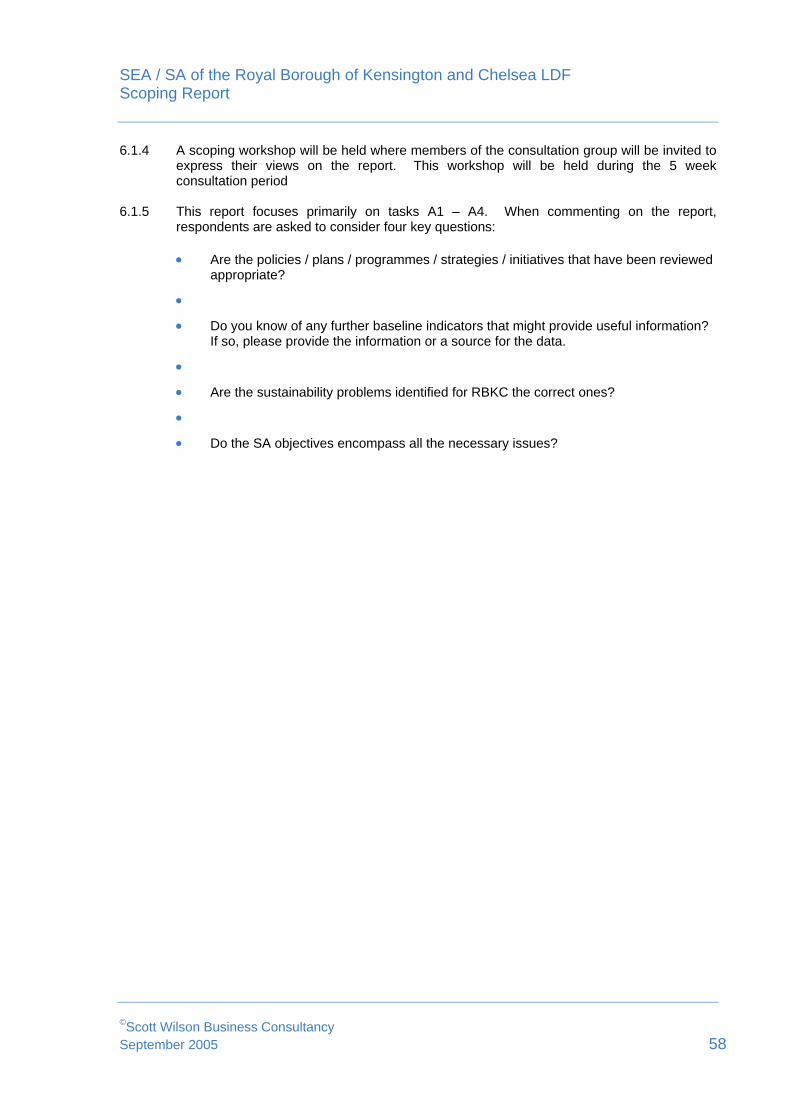
SEA / SA of the Royal Borough of Kensington and Chelsea LDF Scoping Report
©Scott Wilson Business Consultancy September 2005 58
6.1.4 A scoping workshop will be held where members of the consultation group will be invited to express their views on the report. This workshop will be held during the 5 week consultation period
6.1.5 This report focuses primarily on tasks A1 – A4. When commenting on the report,
respondents are asked to consider four key questions: • Are the policies / plans / programmes / strategies / initiatives that have been reviewed
appropriate?
•
• Do you know of any further baseline indicators that might provide useful information? If so, please provide the information or a source for the data.
•
• Are the sustainability problems identified for RBKC the correct ones?
•
• Do the SA objectives encompass all the necessary issues?

SEA / SA of the Royal Borough of Kensington and Chelsea LDF Scoping Report
©Scott Wilson Business Consultancy September 2005 59
7 NEXT STEPS 7.1.1 Various spatial options for the RBKC LDF will be generated over the next few months.
Stage B in the SA process involves assessing the various options put forward against the SA objectives, in addition, new interim guidance29 indicates that Stage B will include:
• Testing the plan objectives against the SA Framework;
• Developing and refining options;
• Predicting and assessing effects;
• Identification of mitigation measures; and
• Developing monitoring proposals 7.1.2 This assessment will be undertaken on the basis of professional judgement and will be
informed by evidence obtained from the context review, the collection of baseline information and the identification of sustainability problems. Additionally, the use of Geographical Information Systems (GIS) will be used in the assessment process. The methodology for this will be included in the Interim Sustainability Appraisal Report.
7.1.3 Each reasonable plan option, including the ‘do nothing’ option or the ‘business as usual’
option will be subject to SA where appropriate. Planners will initially undertake the options appraisal internally as the various options emerge. However, the Consultants will also undertake a formal appraisal of the options using tables based on those found in Appendix VIII. The findings of the options appraisal will be documented in an ‘Interim SA Report’. This report will be published for consultation alongside the RBKC LDF issues and options report in Summer / Autumn 2005 and will be available on the Council’s website.
7.1.4 Following the options appraisal, the draft LDDs themselves (i.e. the preferred options) will
also be subject to SA. The findings from these appraisals will be documented in the SA Report.
29 ODPM (2005) Sustainability Appraisal of Regional Spatial Strategies and Local Development Frameworks: Interim advice note on frequently asked questions.

SEA / SA of the Royal Borough of Kensington and Chelsea LDF Scoping Report
8 FURTHER INFORMATION 8.1 RBKC LDF 8.1.1 Further information on the LDF preparation process can be obtained from:
Chris Turner The Royal Borough of Kensington and Chelsea The Town Hall Hornton Street LONDON W8 7NX Email: [email protected]: 02073613236 Fax: 020 7938 1445 http://www.rbkc.gov.uk/Planning/localdevelopmentframework/default.asp
8.2 SA 8.2.1 Further information on the SA process can be obtained from:
Alex White Environmental Planner Scott Wilson Greencoat House 15 Francis Street London SW1P 1DH Telephone: 0207 798 5121 Email: [email protected]
8.2.2 The following websites provide more general information on SEA and SA:
Office of the Deputy Prime Minister (ODPM) – Introduction to SEA, SEA regulations, SEA guidance http://www.odpm.gov.uk (‘Home’ > ‘Planning’ > ‘Environmental Assessment’ > ‘Strategic Environmental Assessment’) Strategic Environmental Assessment Information Service – gateway to the latest information on SEA and SA http://www.sea-info.net
©Scott Wilson Business Consultancy September 2005 60

SEA / SA of the Royal Borough of Kensington and Chelsea LDF Scoping Report
©Scott Wilson Business Consultancy September 2005 61
GLOSSARY Area Action Plan (AAP) A type of Development Plan Document focusing on
implementation, providing an important mechanism for ensuring development of an appropriate scale, mix and quality for key areas of opportunity, change or conservation.
Annual Monitoring Report (AMR) Assesses the implementation of the Local
Development Scheme and the extent to which policies in Local Development Documents are being achieved.
Consultation Body An authority which because of its environmental
responsibilities is likely to be concerned by the effects of implementing plans and programmes and must be consulted under the SEA Directive. The Consultation Bodies in England are the Countryside Agency, English Heritage, English Nature and the Environment Agency.
Core Strategy Should set out the key elements of the planning
framework for the area. It should comprise: a spatial vision and strategic objectives for the area; a spatial strategy; core policies; and a monitoring and implementation framework with clear objectives for achieving delivery.
Development Plan Documents (DPD) A type of Local Development Document. DPDs
include the Core Strategy, site specific allocations of land and Area Action Plans (where needed).
Local Development Document (LDD) There are two types of Local Development
Document: Development Plan Documents and Supplementary Planning Documents.
Local Development Framework (LDF) Sets out, in the form of a ‘portfolio’, the Local
Development Documents which collectively deliver the spatial planning strategy for the area in question. The LDF also includes the Statement of Community Involvement, the Local Development Scheme and the Annual Monitoring Report.
Local Development Scheme (LDS) Sets out the local authority’s programme for
preparing the Local Development Documents.
SEA Directive European Directive 2001/42/EC on the assessment of the effects of certain plans and programmes on the environment
Statement of Community Involvement (SCI) Document explaining to stakeholders and the
community how and when they will be involved in the preparation of the Local Development
SEA / SA of the Royal Borough of Kensington and Chelsea LDF Scoping Report
©Scott Wilson Business Consultancy September 2005 62
Framework, and the steps that will be taken to facilitate this involvement.
Strategic Environmental Assessment (SEA) Generic term used internationally to describe
environmental assessment as applied to policies, plans and programmes. In the UK, SEA is increasingly used to refer to an environmental assessment in compliance with the ‘SEA Directive’.
Supplementary Planning Document (SPD) A type of Local Development Document.
Supplementary Planning Documents are intended to elaborate on DPD policies and proposals but do not have their statutory status.
Sustainability Appraisal (SA) Generic term used to describe a form of assessment
which considers the economic, social and environmental effects of an initiative. SA, as applied to Local Development Documents, incorporates the requirements of the SEA Directive.

SEA / SA of the Royal Borough of Kensington and Chelsea LDF Scoping Report
©Scott Wilson Business Consultancy September 2005 63
APPENDIX I – QUALITY ASSURANCE CHECKLIST 8.2.3 Quality assurance is an important element of the appraisal exercise. The quality
assurance checklist below has been adapted from the Government Guidance30 to ensure that work carried out to this point is in accordance with its requests.
Guidance checklist Section Carried out by When Objectives and context The appraisal is conducted as an integral part of the plan-making process
Throughout Alex White (Scott Wilson)
Ongoing
The plan/strategy’s purpose and objectives are made clear.
1 Alex White (Scott Wilson)
February 2005
Sustainability issues and constraints, including international and EC environmental protection objectives, are considered in developing objectives and targets.
2 and 5 Alex White (Scott Wilson)
March 2005
SA objectives, where used, are clearly set out and linked to indicators and targets where appropriate.
5 Alex White (Scott Wilson)
May2005
Links with other related plans, programmes and policies are identified and explained.
2 Alex White (Scott Wilson)
March 2005
Relates the requirements of the SEA Directive to the wider SA.
1 Alex White (Scott Wilson)
February 2005
Scoping Authorities and other key stakeholders with a range of interests that are relevant to the plan and SA are consulted in appropriate ways and at appropriate times on the content and scope of the SA Report.
Ongoing Alex White (Scott Wilson) RBKC
Ongoing
The assessment focuses on the significant issues To follow in Interim SA Report and Final SA Report
Technical, procedural and other difficulties encountered are discussed; assumptions and uncertainties are made explicit.
To follow in Interim SA Report and Final SA Report
Reasons are given for eliminating issues from further consideration.
To follow in Interim SA Report and Final SA Report
Options •Realistic options are considered for key issues, and the reasons for choosing them are documented.
To follow in SA Report
Options include ‘do nothing’ scenario wherever relevant.
To follow in SA Report
The sustainability effects (both adverse and beneficial) of each option are identified and compared.
To follow in SA Report
30 OPDM (2004). Sustainability Appraisal of Regional Spatial Strategies and Local Development Frameworks (Consultation Paper).

SEA / SA of the Royal Borough of Kensington and Chelsea LDF Scoping Report
©Scott Wilson Business Consultancy September 2005 64
Inconsistencies between the options and other relevant plans, programmes or policies are identified and explained.
To follow in SA Report
Reasons are given for selection or elimination of options.
To follow in SA Report
Baseline information Relevant aspects of the current state of the plan area (including social, environmental, and economic characteristics) and their likely evolution without the plan are described.
3 Alex White (Scott Wilson)
April 2005
Characteristics of areas likely to be significantly affected are described.
3 Alex White (Scott Wilson)
April 2005
Difficulties such as deficiencies in data or methods are explained.
Throughout Alex White (Scott Wilson)
Ongoing
SEA / SA of the Royal Borough of Kensington and Chelsea LDF Scoping Report
©Scott Wilson Business Consultancy September 2005 65
APPENDIX II – BASELINE AND SUSTAINABILITY ISSUES WORKSHOP REPORT
SCOTT WILSON BUSINESS CONSULTANCY Strategic Environmental Assessment (SEA) / Sustainability Appraisal (SA) of Royal Borough of Kensington and Chelsea Local Development Framework B A S E L I N E A N D I S S U E S W O R K S H O P - P A R T I C I P A N T F E E D B A C K
June 2005

Strategic Environmental Assessment (SEA) / Sustainability Appraisal (SA) of the Royal Borough of Kensington and Chelsea Local Development Framework June 2005 Collated and edited by:
Alex White Environmental Specialist
Reviewed by: Steven Smith
Senior Consultant
Approved by: Andrew McNab
Director
Scott Wilson Business Consultancy
Greencoat House15 Francis Street
LondonSW1P 1DH
Tel: +44 (0)20 7798 5200Fax: +44 (0)20 7798 5201
Email: [email protected]

SEA / SA of Royal Borough of Kensington and Chelsea LDF Baseline and Sustainability Issues Workshop – Participant Feedback
TABLE OF CONTENTS 1 Introduction .....................................................................2
2 Workshop Feedback.......................................................5
3 Next Steps......................................................................11
4 Further Information.......................................................12
Appendix 1 – Workshop Participants..................................13
Appendix 2 – Proposed Policies, Plans etc. for the Context Review....................................................................................14
Appendix 3 – Key Messages from the Context Review.....16
Appendix 4 – Originally Proposed SA / SEA Objectives ...19
Appendix 5 – Originally Proposed Baseline Indicators.....20
©Scott Wilson Business Consultancy June 2005 1

SEA / SA of Royal Borough of Kensington and Chelsea LDF Baseline and Sustainability Issues Workshop – Participant Feedback
1 INTRODUCTION 1.1 SEA / SA 1.1.1 Scott Wilson have been commissioned by the Royal Borough of Kensington and
Chelsea (‘the Council’) to undertake the Strategic Environmental Assessment (SEA) / Sustainability Appraisal (SA) of their Local Development Framework (LDF). The scope of this work is to complete a full SA of the following component parts of the Council’s LDF, the Development Plan Documents for:
• The Core Strategy; • Development Control policies (Generic); and • The Site Specific Allocations.
1.1.2 Additional appraisal of a number of Supplementary Planning Documents (SPDs)
will also be carried out at a later stage by Scott Wilson on behalf of the Council. These include the SPD Designing Out Crime, Access Design Guide, Brompton Hospital Planning Brief and Princes Louise Hospital Planning Brief.
1.1.3 SEA involves the systematic identification and evaluation of the environmental
impacts of a strategic action (e.g. a plan or programme). In 2001, the EU legislated for SEA with the adoption of Directive 2001/42/EC on the assessment of the effects of certain plans and programmes on the environment (the ‘SEA Directive’). The Directive entered into force in the UK on 21 July 2004 and applies to a range of English plans and programmes including Local Development Frameworks (LDFs).
1.1.4 SA extends the concept of SEA to fully encompass economic and social concerns.
Under the Planning and Compulsory Purchase Act 2004 (PCPA), Local Authorities must undertake SA for each of their Development Plan Documents (DPDs) and Supplementary Planning Documents (SPDs) – the constituent parts of the LDF. SA is therefore a statutory requirement for LDFs along with SEA.
1.1.5 The Government’s approach is to combine SEA and SA into a single, unified
assessment process and, in September 2004, published draft guidance on undertaking combined SEA / SA of LDFs1. This has been supplemented by an interim advice note issued in April 20052, this report integrates these recommendations.
1.2 Stakeholder consultation 1.2.1 The new guidance sets out a five-stage approach to SEA / SA (see Figure 1).
Stage A involves establishing:
• the context in which the LDF is being prepared – the influence of other plans and programmes on the LDF and vice-versa;
©Scott Wilson Business Consultancy June 2005 2
1 ODPM (2004). Sustainability Appraisal of Regional Spatial Strategies and Local Development Frameworks – Consultation Paper.
2 ODPM (2005) Sustainability Appraisal of Regional Spatial Strategies and Local Development Frameworks – Interim Advice on Frequently asked questions. ODPM

SEA / SA of Royal Borough of Kensington and Chelsea LDF Baseline and Sustainability Issues Workshop – Participant Feedback
• a series of objectives for sustainable development – these provide the
‘benchmark’ against which LDF components are assessed; • the economic, social and environmental baseline for the local authority area
in question – this provides an evidence base to inform the SEA / SA; and • the economic, social and environmental problems facing the area in question
– the identification of sustainability problems helps to determine the issues on which the LDF should concentrate and for which options should be developed.
Figure 1. Five stage approach to SEA / SA
Stage A: Setting the context and objectives, establishing the baseline and deciding on the scope
Stage B: Testing the LDF Objectives against the SA Framework, developing and refining options, predicting and assessing effects, identifying
mitigation measures and developing proposals for monitoring
Stage E: Monitoring implementation of the plan
Stage C: Documenting the appraisal process
Stage D: Consulting on the plan and SA Report
1.2.2 The guidance considers stakeholder consultation at Stage A particularly important:
“Consultation at this stage helps to ensure that the SA will be comprehensive and robust enough to support the DPD during the later stages of full public consultation and examination”. In particular, the guidance suggests, “Sustainability objectives and indicators and targets should be developed with input from key stakeholders and ideally should be open to wider comment and discussion”.
1.2.3 In addition, under the SEA Directive and the associated regulations, RBKC have a
statutory duty to consult the four SEA Consultation Bodies – the Countryside Agency, English Heritage, English Nature and the Environment Agency – on the scope of the assessment.
©Scott Wilson Business Consultancy June 2005 3

SEA / SA of Royal Borough of Kensington and Chelsea LDF Baseline and Sustainability Issues Workshop – Participant Feedback
1.2.4 In light of the above, RBKC held a Baseline and Sustainability Workshop on 23rd March 2005 for internal stakeholders from RBKC. The workshop was facilitated by Scott Wilson and had three key aims:
• to raise awareness of the SEA / SA for RBKC LDF; • to invite proposals from the participants on their future involvement in the
SEA / SA process; and • to ask the participants their opinion on various aspects of the work carried out
to date (on context, objectives, baseline indicators and sustainability problems).
1.2.5 The workshop was attended by a wide variety of stakeholders representing
economic, social and environmental interests (see Appendix 1). The workshop involved an introductory presentation followed by 12 group sessions – one each on the SEA Directive topics. Each participant was given a workbook in which to record his or her views and these provided the basis for this report.
1.2.6 This report provides feedback on the group sessions together with an indication of
what happens next and details of who to contact for further information.
©Scott Wilson Business Consultancy June 2005 4

SEA / SA of Royal Borough of Kensington and Chelsea LDF Baseline and Sustainability Issues Workshop – Participant Feedback
2 WORKSHOP FEEDBACK 2.1 Context review 2.1.1 LDFs may be influenced in various ways by other plans or programmes and by
external sustainability objectives, such as those laid down in Government policies or legislation. According to Government guidance, these relationships should be identified to enable potential synergies to be exploited and any inconsistencies and constraints to be addressed.
2.1.2 In discussion with RBKC, Scott Wilson prepared a list of relevant policies, plans,
programmes, strategies and initiatives for review (see Appendix 2). During the group sessions, participants were asked to consider the list and record any further policies, plans etc. that they thought should be candidates for review.
2.1.3 Table 1 lists the additional policies, plans etc. identified by the participants. This list
will be discussed with RBKC and the consultants will undertake any further review work considered necessary.
Table 1. Additional policies / plans / programmes / strategies / initiatives identified as candidates for review
Policy / plan / programme / strategy / initiative
Waste Management Strategy and Action Plan
Remove – Cultural Strategy (to be included in the forthcoming Community Strategy)
Mayor’s Play Strategy Tree and Woodland Framework for London Park Strategy
Play Strategy Sports Strategy Streetscape Guide
2.1.4 Following the review of those policies, plans etc. listed in Appendix 2, the
consultants identified a series of messages emerging from the review (see Appendix 3).
2.1.5 The participants were asked to review the messages emerging from the context
and record any additional messages they considered important.
©Scott Wilson Business Consultancy June 2005 5

SEA / SA of Royal Borough of Kensington and Chelsea LDF Baseline and Sustainability Issues Workshop – Participant Feedback
2.2 SEA / SA objectives 2.2.1 SEA / SA is based on an ‘objectives-led’ approach whereby the potential impacts of
a plan are gauged in relation to a series of aspirational objectives for sustainable development. These objectives are distinct from the LDF objectives although they may overlap with them in some cases.
2.2.2 Scott Wilson proposed a set of 15 draft SEA / SA objectives. These were based
primarily on the Sustainable Development Framework for London (SDFL)3. The SDFL provides the high-level policy framework for the region and sets out 14 sustainable development objectives for the South East. However, the SDFL “is the start of an on-going process aimed at positioning sustainable development at the heart of policy development and decision-making in London.”. With this in mind, the consultants also considered the existing RBKC UDP and Context Review in the creation of the SEA / SA objectives. In order to render the SEA / SA process more manageable, several of the SDFL objectives were amalgamated in order to reduce the overall number.
2.2.3 Workshop participants were asked to consider the proposed objectives and discuss
two questions:
• Are there any gaps in terms of the issues that should be addressed? • Is the balance between economic, social and environmental concerns broadly
correct? 2.2.4 Proposed changes in objectives were recorded in the workbooks and these are
summarised in Table 3. The Councils and the consultants will discuss these and make any necessary additions amendments will be made.
Table 3. Comments on the objectives (number in brackets refers to number of participants making the same or a very similar comment)
Proposed additional objectives How dealt with (NB refers to old
objective numbers)
• Proposed split of Objective 13 into two separate objectives, in line with the Council’s plans and objectives
• Objective 13 changed to: “To ensure that the housing needs of the Royal Borough’s residents are met.”
• Objective 14 added: Encourage energy efficiency through building design to maximise the re-use of building’s and the recycling of building materials.
Objective 1:
3 See: http://www.london.gov.uk/mayor/sustainable-development/susdevcomm_framework.jsp
©Scott Wilson Business Consultancy June 2005 6

SEA / SA of Royal Borough of Kensington and Chelsea LDF Baseline and Sustainability Issues Workshop – Participant Feedback
• Add:‘and to ensure there is no further loss of area or diversity of habitats for wildlife.’
• Change to: To conserve and enhance the natural environment and biodiversity.
Integrated into Objective 1, now: “To conserve and enhance the natural environment and biodiversity.”
Objective 2:
• Re-phrase including ’anti-social behaviour’.
Integrated into Objective 1, now ‘Reduce crime and anti-social behaviour and the fear of crime’.
Objective 3:
• Rephrase to include Strategic Policy STRAT 20 of the Boroughs UDP
Integrated into Objective : To support a diverse and vibrant local economy to foster sustainable economic growth.
Objective 4:
• Rephrase to include objectives from the corporate equality policy
Rephrased to: Encourage social inclusion, equity, the promotion of equality and a respect for diversity.
Objective 5:
• Add: “and where possible plan for mitigating the effects of climate change on biodiversity and green space or on the environment in general.
• Integrate the corporate energy policy and Environmental Policy Statement
Objective 5 unchanged
Objective 6:
• Integrate PU10 of the UDP and para 12.6.5.
New Objective: Reduce the risk of flooding to current and future residents
Objective 7 •
• Revise in light of the Environmental policy Statement
Changed to: Improve air quality in the Royal Borough.
Objective 8:
• Revise in light of the Environmental policy Statement
Changed to: Protect and enhance the Royal Borough’s parks and open spaces.
Objective 9:
• Amend in light of UDP sustainability objectives
Amended to: Reduce pollution of air, water and land.
Objective 10
©Scott Wilson Business Consultancy June 2005 7

SEA / SA of Royal Borough of Kensington and Chelsea LDF Baseline and Sustainability Issues Workshop – Participant Feedback
• Amended in light of the UDP sustainability and transport polices
New objective: To promote traffic reduction and encourage more sustainable alternative forms of transport to reduce energy consumption and emissions from vehicular traffic.
Objective 11:
• Revised integrating the Municipal Waste Management Strategy
Reduce the amount of waste produced and maximise the amount of waste that is recycled.
Objective 12:
• add parks to “community facilities”
• Updated in line with UDP policies
Amended Objective now reads: Ensure that social and community uses and facilities which serve a local need are enhanced, protected, and to encourage the provision of new community facilities.
Objective 13:
• Split to two objectives and integrate the housing strategy objectives
Objective now: To aim that the housing needs of the Royal Borough’s residents are met.
Objective 14:
• None Suggested None Suggested
Objective 15 •
• New objective covering sustainability in building design in line with the UDP.
New objective: Encourage energy efficiency through building design to maximise the re-use of building’s and the recycling of building materials.
Objective 16 •
• Revised to include the Environmental policy Statement
Objective now: To reinforce local distinctiveness, local environmental quality and amenity through the conservation and enhancement of cultural heritage.
©Scott Wilson Business Consultancy June 2005 8

SEA / SA of Royal Borough of Kensington and Chelsea LDF Baseline and Sustainability Issues Workshop – Participant Feedback
2.3 Baseline indicators 2.3.1 In relation to the baseline, the aim is to assemble sufficient data on the current and
likely future state of the area to enable the plan’s effects to be adequately predicted. In doing so, ‘gaps’ in data coverage will inevitably be identified. Ideally, each SEA / SA objective (see section 2.2) should be ‘underwritten’ with comprehensive and up-to-date baseline information.
2.3.2 The collection of baseline information is generally organised around a set of
indicators. For each indicator selected, enough data should be collected to answer a series of questions including:
• How good or bad is the current situation? Do trends show that it is getting
better or worse? • How far is the current situation from any established thresholds or targets?
2.3.3 Scott Wilson proposed a series of indicators to underpin the SEA / SA of RBKC
LDF (see Appendix 5). Workshop participants were asked to consider the list of draft indicators and discuss the following questions:
• Are there any major gaps in the range of issues covered by the indicators? • What should be the priorities for indicator development / data collection?
2.3.4 Table 4 sets out the comments and recommendations put forward. In light of the
workshop there is a clear need to investigate indicators for biodiversity, energy, health and open space in particular.
Table 4. Suggested Indicators
Indicator Reason used / not-used
Noise Mapping Not under the influence of LDF, should be used in the Local Implementation Plan however.
Log complaints for night flights Currently Unavailable
Area of habitat developed on Currently Unavailable
No of Energy grants Currently Unavailable
No. of insulation grants Currently Unavailable
Houses at risk of flooding Used in Baseline
Aquifer locations Used in Baseline
Water consumption Currently Unavailable
Buildings at risk register Used in Baseline
Nightime PTAL Currently Unavailable
©Scott Wilson Business Consultancy June 2005 9

SEA / SA of Royal Borough of Kensington and Chelsea LDF Baseline and Sustainability Issues Workshop – Participant Feedback
2.4 Sustainability problems 2.4.1 The SEA Directive requires the identification of“any existing environmental
problems which are relevant to the plan or programme including, in particular, those relating to any areas of a particular environmental importance, such as areas designated pursuant to Directives 79/409/EEC and 92/43/EEC [Natura 2000 sites]”.
2.4.2 Since SA focuses on economic and social as well as environmental impacts, the
focus in the Government’s guidance is on the identification of sustainability problems.
2.4.3 The identification of sustainability problems provides an opportunity to define key
issues for the LDF and develop sustainable plan objectives and options for resolving these.
2.4.4 During the sessions, workshop participants were simply asked to brainstorm the
sustainability problems facing both RBKC. Tables 5 provides a summary of the problems identified for RBKC.
Table 5. Sustainability issues facing RBKC identified by the participants
Sustainability Problems facing RBKC
Usage pressure on greenspace is an issue - 84 % of residents have no private gardens (?), and a need for investment.
Lack of indoor sports facilities in the south
Adequate waste and recycling storage in new builds / housing conversions / office space (also to include community composting?)
Waste minimisation and recycling plans for businesses (and for construction projects?)
Waste transfer stations/ EfW plant – identification of possible sites should Belvedere application be rejected
Identification of site for possible composting of kitchen and garden waste
Identification of site for possible Civic Amenity site
©Scott Wilson Business Consultancy June 2005 10

SEA / SA of Royal Borough of Kensington and Chelsea LDF Baseline and Sustainability Issues Workshop – Participant Feedback
3 NEXT STEPS 3.1 Scoping Report 3.1.1 The workshop provided a useful means to engage stakeholders from a variety of
backgrounds and professions and was invaluable in identifying:
• Potential policies / plans / programmes / strategies / initiatives for review; • Issues surrounding the proposed SEA / SA objectives;
• Additional baseline indicators and sources of baseline information; and
• Sustainability problems facing RBKC.
3.1.2 The next step in the SEA / SA process involves completing the context review;
revisiting the SEA / SA objectives; adding to the baseline indicators and collecting data for these; and comprehensively describing the sustainability problems facing RBKC. The Councils and the consultants will ensure that the findings of the workshop are taken into account in completing these tasks.
3.1.3 Once these tasks are completed, the work done so far will be brought together in
the form of a Scoping Report, as required by the Government’s draft guidance on SEA / SA for LDFs. The draft guidance states that consultation on Stage A “should be based on a preliminary scoping report that summarises Stage A and the outputs of it”. The Scoping Report should be available by the end of April 2005 and will be distributed to key stakeholders including the workshop participants and the four SEA Consultation Bodies.
3.2 Issues and options 3.2.1 Stage B in the SEA / SA involves assessing the broad issues and options put
forward by RBKC against the agreed SEA / SA objectives and supported by the context review, the baseline information and knowledge of the sustainability problems.
3.2.2 Various policy options will be developed to achieve the objectives of the RBKC
LDF. Each reasonable plan option, including the ‘do nothing’ or the ‘business as usual’ option will be subject to SEA / SA.
©Scott Wilson Business Consultancy June 2005 11

SEA / SA of Royal Borough of Kensington and Chelsea LDF Baseline and Sustainability Issues Workshop – Participant Feedback
4 FURTHER INFORMATION 4.1.1 Further information on the LDF preparation process and the SEA / SA process can
be obtained from:
Chris Turner The Royal Borough of Kensington and Chelsea The Town Hall Hornton Street LONDON W8 7NX Email: [email protected]: 02073613236 Fax: 020 7938 1445 http://www.rbkc.gov.uk/Planning/localdevelopmentframework/default.asp#4
Alex White Environmental Planner Scott Wilson Greencoat House 15 Francis Street London SW1P 1DH Telephone: 0207 798 5121 Email: [email protected]
©Scott Wilson Business Consultancy June 2005 12

SEA / SA of Royal Borough of Kensington and Chelsea LDF Baseline and Sustainability Issues Workshop – Participant Feedback
APPENDIX 1 – WORKSHOP PARTICIPANTS Name Organisation
Chris Turner RBKC
Joan McGarvey RBKC
Emma Gittus RBKC
Amanda Smethurst RBKC
Rachel York RBKC
Jennifer O’Riley RBKC
Nathan Miller RBKC
Tony Heavey RBKC
Jay Amies RBKC
Steven Smith Scott Wilson
Alexander White Scott Wilson
Charlotte Brooks Scott Wilson
©Scott Wilson Business Consultancy June 2005 13

SEA / SA of Royal Borough of Kensington and Chelsea LDF Baseline and Sustainability Issues Workshop – Participant Feedback
APPENDIX 2 – PROPOSED POLICIES, PLANS ETC. FOR THE CONTEXT REVIEW International
The Johannesburg Declaration on Sustainable Development
European Spatial Development Perspective
Air Quality Framework Directive (96/62/EC) and daughter Directives
Framework Waste Directive (Directive 75/442/EEC, as amended)
Habitats Directive (92/43/EEC)
Birds Directive (79/409/EEC)
Landfill Directive (1999/31/EC)
Water Framework Directive (2000/60/EC)
Convention on Biological Diversity
National
National sustainable development strategy
PPS1: Delivering Sustainable Development
PPS3: Housing
PPG4: Industrial, commercial development and small firms
PPS6: Planning for town centres
PPG8: Telecommunications
PPS9: Biodiversity and Geological Conservation
PPS10: Planning and waste management
PPS12: Local Development Frameworks
PPG13: Transport
PPG14: Development on unstable land
PPG15: Planning and the historic environment
PPG16: Archaeology and planning
PPG17: Planning for open space, sport and recreation
PPG19: Outdoor advertisement control
PPG21: Tourism
PPS22: Renewable energy
PPG23: Planning and pollution control
PPG24: Planning and noise
PPG25: Development and flood risk
London
The Mayor’s Air Quality Strategy
The Mayor’s Biodiversity Strategy
©Scott Wilson Business Consultancy June 2005 14

SEA / SA of Royal Borough of Kensington and Chelsea LDF Baseline and Sustainability Issues Workshop – Participant Feedback
The Mayor’s Cultural Strategy
The Mayor’s Economic Development Strategy
The Mayor’s Ambient Noise Strategy
The Mayor’s Transport Strategy
The London Plan – Spatial Development Strategy
The Mayor’s Municipal Waste Management Strategy
The Mayor’s Energy Strategy
Local
Air Quality Action Plan
Borough Spending Plan
Environmental Policy Statement
Contaminated Land Strategy – Remediation Strategy
Contaminated Land Inspection Strategy
Housing Strategy
Local Development Scheme 2005
Unitary Development Plan 2002
The Tree Strategy
The Community Strategy: progress Report
The Future of our Community
Cabinet Business Plan
Renewing our Neighbourhoods – Strategy Statement and Action Plan
Community Safety Action Plans
Community Safety Strategy
Homelessness Strategy
Building Communities – A housing strategy for West London
Arts Strategy for Kensington and Chelsea
Interim Local Implementation Plan
Local Biodiversity Action Plan
Municipal Waste Management and Action Plan
Park Strategy
Play Strategy
Sports Strategy
Streetscape Guide
©Scott Wilson Business Consultancy June 2005 15

SEA / SA of Royal Borough of Kensington and Chelsea LDF Baseline and Sustainability Issues Workshop – Participant Feedback
APPENDIX 3 – KEY MESSAGES FROM THE CONTEXT REVIEW PPPSI Key Message
International
Convention on Biodiversity Conserve and enhance biodiversity. In particular, the LDF should seek to protect all statutory nature conservation sites as well as focusing on biodiversity in the wider environment, connectivity and the provision of new habitats.
The WSSD on Sustainable Development, Johannesburg Declaration on Sustainable Development – Plan of Implementation
The LDF and SA should include a robust and realistic monitoring framework, carrying out adequate consultation with consultation bodies and stakeholders
Framework Waste Directive, Options will need to be identified for the disposal, minimisation and treatment of waste.
National
Where possible, promote ‘win-win-win solutions’ that advance economic, social and environmental concerns. In some instances trade-offs between competing objectives may be necessary
Securing the Future – delivering UK sustainable development strategy
Where appropriate, invoke the ‘precautionary principle’ in relation to potentially polluting development Include the 5 principles in policy assessment
Create mixed communities
Reuse urban land and buildings
PPS – 3: Housing
Avoid developments with <30 dwellings per hectare.
PPG – 4: Industrial, commercial development and small firms
Businesses should be located in appropriate areas to service their transport needs and away form areas sensitive to any types of pollution impact
Concentrate major trip generators where there is a choice of means of transport other than the car.
Enhance consumer choice
Regenerate deprived areas
Promote social inclusion
PPS – 6: Planning for Town Centres
Promote good design
Promote the conservation of biodiversity and the enhancement of biodiversity conservation.
PPS – 9: Biodiversity and Geology Conservation
Conserve and enhance biodiversity. In particular, the protection of all statutory nature conservation sites as well as focusing on biodiversity in the wider environment, connectivity and the provision of new habitats.
©Scott Wilson Business Consultancy June 2005 16

SEA / SA of Royal Borough of Kensington and Chelsea LDF Baseline and Sustainability Issues Workshop – Participant Feedback
PPG – 13: Transport Reduce car dependence by facilitating more walking and cycling and improving public transport linkages
PPG – 15: Planning and the Historic Environment, PPG – 16: Archaeology and Planning
Preserving and enhancing the Royal Borough’s unique and rich cultural heritage including Conservation Areas, Listed Buildings and sites of Archaeological value.
PPG – 17: Planning for Open Space, sport and recreation
Protect open space and sports and recreational facilities of high quality / value to the local community
Upgrade tourism facilities, promote diversity and reduce seasonality, and ensure that tourist activity is not detrimental to residential amenity
PPS – 21: Tourism
Use existing cultural and historical attributes to encourage sustainable forms of tourism.
The Council may include polices which require a percentage of energy used in new developments to come from on-site, renewable energy developments.
PPS – 22: Renewable Energy
Endeavour to reduce greenhouse gas emissions and adapt to climate changes already underway
PPS – 23: Planning and Pollution Control
Reduce pollutant emissions and enhance air, land and water quality
PPG – 24: Planning and noise Developments that are potentially noise generating should be permitted provided that they are in appropriate areas to limit impacts on sensitive receptors
Promote more sustainable drainage systems where appropriate PPG – 25: Development and flood risk Development should not be provided in areas at high risk from
flooding
London
The Mayor’s Energy Strategy Develop renewable energy sources and where possible, incorporate renewable energy projects in new developments.
The London Plan Policy 6A.4 indicates that boroughs should reflect the policies of the (London) Plan and include appropriate strategic as well as local needs in their policies. "Affordable housing and public transport improvements should generally be given the highest importance" with priority also given to other areas such as "learning and skills and health facilities and services and childcare provisions".
Include policies and objectives with the aim of improving air quality and allocating development according to its effect on air quality.
The Mayor’s Air Quality Strategy
Endeavour to reduce greenhouse gas emissions and adapt to climate changes already underway
Conserve and enhance biodiversity. In particular, protect all statutory nature conservation sites as well as focussing on biodiversity in the wider environment, connectivity and the provision of new habitats.
The Mayor’s Biodiversity Strategy
Promote the conservation of biodiversity and the enhancement of biodiversity conservation.
©Scott Wilson Business Consultancy June 2005 17

SEA / SA of Royal Borough of Kensington and Chelsea LDF Baseline and Sustainability Issues Workshop – Participant Feedback
The Mayor’s Cultural Strategy Preserve and enhance the unique and rich cultural heritage including Conservation Areas, Listed Buildings and sites of Archaeological value.
The Mayor’s Economic Development Strategy
Policies should reflect the economic characteristics of the borough.
Local
Air Quality Action Plan The LDF should acknowledge the targets that need to be met as part of the AQMP and the national targets. Policies should reflect the sources of Air Pollution of Air Pollution (motor vehicles, commercial and residential energy uses) and make attempts to address these in future developments and any existing areas within the borough
Environmental Policy Statement A series of Objectives have been produced through consultation with stakeholders within the borough. The LDF should consider the EPS Objectives
Housing Strategy The Housing Strategy lays out 8 key aims for housing in the borough and a series of key performance indicators. Should use the key principles in creating policy.
The Tree Strategy LDF should reflect the 7 strategic objectives in the strategy
The Future of our Community The LDF should aim to fulfill residents “wants” in each sector covered by the document and also, commitments within this document will need to be addressed.
Community Safety Strategy The LDF should concentrate on crime sectors that are highlighted as priorities, and should aim to reduce anti-social behaviour as well as other form s of crime. Despite the high house prices within the borough, the needs of the borough in terms of affordable housing will need to be accommodated
Homelessness Strategy
Building Communities – A housing strategy for West London
The LDF should ensure that the underlying causes of housing problems are address and suggest suitable mitigation where needed being mindful of the character of the area. Additionally, the bigger picture of housing in West London should be included.
Biodiversity Action Plan The limited areas of nature conservation interest in the borough should be protected, enhanced, and where possible new habitat should be created.
Waste Management Strategy and Action Plan
Despite constraints, waste management and disposal is a key area where the Borough can improve.
©Scott Wilson Business Consultancy June 2005 18

SEA / SA of Royal Borough of Kensington and Chelsea LDF Baseline and Sustainability Issues Workshop – Participant Feedback
APPENDIX 4 – ORIGINALLY PROPOSED SA / SEA OBJECTIVES Objective Eco Env Soc
1. Ensure that opportunities for enhancement and protection of biodiversity and geology (soils) are integrated into the design
2. Reduce crime and the fear of crime.
3. Encourage vital centres in terms of retail, small businesses.
4. Encourage social inclusion and equity.
5. Minimise effects on climate change through reduction in emissions, energy efficiency and use of renewables
6. To reduce the risk of flooding and the resulting detriment to public well-being, the economy and the environment
7. To reduce air pollution and ensure air quality continues to improve.
8. Maximise available open space through enhancement and seek to create open space where possible.
9. Reduce average emissions of pollutants (noise, air, water, etc) per capita
10. Reduce the dependency on the private car, and encourage the use of alternative transport modes.
11. To reduce waste arising and increase the amount of waste recycled and composted.
12. To ensure that all current and future residents have access to high quality community facilities (including recreation, sports centres, schools etc)
13. To ensure that everyone has the opportunity to live in a decent, sustainably constructed and affordable home
14. Ensure that current and future residents have access to affordable health care.
15. Ensure the protection, and where possible, the enhancement of the cultural heritage and unique character of the borough.
©Scott Wilson Business Consultancy June 2005 19

SEA / SA of Royal Borough of Kensington and Chelsea LDF Baseline and Sustainability Issues Workshop – Participant Feedback
APPENDIX 5 – ORIGINALLY PROPOSED BASELINE INDICATORS Baseline indicators Objective 1: Ensure that opportunities for enhancement and protection of biodiversity and geology (soils) are integrated into the design and to ensure there is no further loss of area or diversity of habitats for wildlife. Land Recycling a) New dwellings built on previously developed land; b) all new development on previously used land Area of contaminated land Number of waste recycling facilities Levels of damage to designated sites Achievement of BAP objectives and targets for Key Species Achievement of BAP objectives for key habitats Area of sites of conservation value Bird Populations a) Farmland b) Woodland c) Coasts and estuaries d) Wintering wetland e) Urban? Biodiversity Conservation priority species status, priority habitat status Agricultural sector fertilser input, farmland bird population, and ammonia and methane emissions and output Farming and Environmental Stewardship Fish Stocks fish stocks around the UK within sustainable limits Number of Tree preservation orders Local environmental quality Habitat Diversity Species Diversity Land Use area used for agriculture, woodland, water or river, urban (contextural indicator) 2. Reduce crime, anti-social behaviour and the fear of crime. Crime crime survey and recorded crime for a) Vehicles b) domestic burglary c) violence Violence Against the person Sexual Offences Burglary Burglary from Dwelling Theft of a motor vehicle Theft from a motor vehicle Fear of Crime a) Car theft b) burglary c) violence Crime and Disorder Calls to police regarding antisocial behaviour Drug offences Indices of Deprivation - Crime No. of pupils per 1,000 permanently excluded from primary schools 3. Encourage vital town centres in terms of retail, small businesses.
©Scott Wilson Business Consultancy June 2005 20

SEA / SA of Royal Borough of Kensington and Chelsea LDF Baseline and Sustainability Issues Workshop – Participant Feedback
Unemployment rate Average claimant count rate Proportion of people of working age in employment Proportion of lone parents, long-term ill and disabled people who are economically active Ethnic minority employment and unemployment Low pay Average gross weekly earnings Job Density Change in total VAT registered business stock GVA per capita Proportion of people, in the most deprived areas, of working age in employment Proportion of people, in the most deprived areas, claiming unemployment benefit who have been out of work for more than a year Proportion of young people (18-24 year olds), in the most deprived areas, in full-time education or employment Percentage increase or decrease in work-place based employment in the most deprived areas Average annual increase in GVA per worker for manufacturing and the knowledge sectors Value of manufacturing exports per head Investment a) Total investment b) social investment relative to GDP. Employment people of working age in employment Workless households population living in workless households a) Children b) Working age Economically inactive people of working age who are economically inactive 4. Encourage social inclusion and equity. Index of multiple deprivation Proportion of children under 16 who live in low income households Benefit recipients Percentage of households in fuel poverty Number of households with no central heating Water affordability Demography population and population of working age Income Deprivation Employment Deprivation Health Deprivation Education , Skills and Training Deprivation Barriers to housing and Services Active community participation informal and formal volunteering at least once a month Childhood poverty children in relative low income households a) before housing costs b) after housing costs Young adults 16-19 year olds not in employment, education or training Pensioner poverty pensioners in relative low income households a) before housing costs b) after housing costs % of pupils achieving Level 4 or above in Key Stage 2 English % of pupils achieving 5 or more GCSEs at grades A* - C or equivalent % of pupils achieving Level 4 or above in Key Stage 2 Maths % of pupils achieving one or more GCSEs at grade G or equivalent % of secondary schools with 25% or more of their places unfilled % of primary schools with 25% or more of their places unfilled Sustainable Development education
©Scott Wilson Business Consultancy June 2005 21

SEA / SA of Royal Borough of Kensington and Chelsea LDF Baseline and Sustainability Issues Workshop – Participant Feedback
5. Minimise effects on climate change through reduction in emissions, energy efficiency and use of renewables and where possible plan for mitigating the effects of climate change on biodiversity and green space. Energy use (gas and electricity) Energy use per household CO2 emissions Embodied energy in new buildings Average energy efficiency of buildings SAP Ratings of council's housing stock % Developments with sustainable urban drainage systems Total vehicle kilometres No / % homes in flood plain no / % roads in floodplain No. heat / cold deaths no. cases of subsidence river flows and river quality cost of flooding Greenhouse Gas Emissions Kyoto target and CO2 emissions CO2 Emissions by end user industry, domestic, transport (excluding international aviation Aviation and shipping emissions green house gases from UK-based international aviation and shipping fuel bunkers Renewable electricity renewable energy generated as a percentage of total energy Electricity generation electricity generated, CO2, Nox, and SO2 emissions by electricity generators and GDP Household energy use domestic CO2 emissions and household final consumption expenditure Energy Supply UK Primary energy supply and gross inland energy consumption 6. To reduce the risk of flooding and the resulting detriment to public well-being, the economy and the environment % of people protected from flooding Proportion of dwellings within indicative floodplain 7. To reduce air pollution and ensure air quality continues to improve. Ecological impacts of air pollution area of UK habitat sensitive to acidification and eutrophication with critical load exceedences Manufacturing sector CO2, NOx, SO2 PM10 Emissions and GVA Service Sector CO, NOx Emissions and GVA Public sector CO2, NOx, Emissions and GVA Resource use Domestic Material Consumption and GDP Road Transport CO2, NOx and PM10 Emissions and GDP. Private Vehicles CO2, emissions and car-km and household final consumption Road Freight CO2 Emissions and GVA Days when Air Pollution is Moderate or Higher (PM10) Days when concentrations of PM10 exceed 50 µg/m3 Annual mean PM10 concentrations Annual mean NO2 concentrations No of times 1-hour concentration of NO2 exceed 200 µg/m3 Designated Air Quality Management Area/s and Air Quality Action Plan 8. Maximise available open space through enhancement and seek to create open space where possible.
Open space per resident ha / resident
9. Reduce average emissions of pollutants (noise, air, water, etc) per capita Water Resource use total abstractions from non-tidal surface and ground water sources and GDP Domestic water consumption per head
©Scott Wilson Business Consultancy June 2005 22

SEA / SA of Royal Borough of Kensington and Chelsea LDF Baseline and Sustainability Issues Workshop – Participant Feedback
Water stress River quality rivers of good Biological and Chemical quality Noise complaints 10. Reduce the dependency on the private car, and encourage the use of alternative transport modes. Mobility a) Number of trips per person by mode b) distance travelled per person per year by broad trip purpose. Travel to work by car Travel to work by public transport Households without car/van Households with 1 car or more Households with 2 or more cars/vans Getting to school how children get to school Road Accidents number of people and children killed or seriously injured Traffic congestion Heavy goods vehicles Leisure trips by mode of transport Monetary investment in public transport, walking and cycling 11. To reduce waste arising and increase the amount of waste recycled and composted. BV82a Household waste - percentage recycled BV82b Household waste - percentage composted BV82c Household waste - percentage of heat BV82d Household waste - percentage landfilled BV84 Kg of household waste collected per head BV86 Cost of waste collection per household BV87 Cost of waste disposal per tonne for municipal waste BV91 % of pop. served by kerbside collection or within 1km of recycling centre 12. To ensure that all current and future residents have access to high quality community facilities (including recreation, sports centres, schools, parks etc) Social investment as per cent of GDP Real changes in the cost of transport Distance travelled relative to income % of local authority buildings suitable for and accessible by disabled people Sports centres Streetscape in need of repair 13. To ensure that everyone has the opportunity to live in a decent, sustainably constructed and affordable home Average house prices House price to income ratio Number of unfit dwellings Percentage of new build and retrofit homes meeting Ecohomes Very Good standard Percentage of commercial buildings meeting BREEAM Very Good standard Numbers of derelict buildings Dwelling Density Households and dwellings households, single person households and dwelling stock (contextural indicator) Housing conditions a) social sector homes below the decent homes standard b) vulnerable households in the private sector in homes below the decent homes standard
©Scott Wilson Business Consultancy June 2005 23

SEA / SA of Royal Borough of Kensington and Chelsea LDF Baseline and Sustainability Issues Workshop – Participant Feedback
Households living in fuel poverty a) pensioners b) households with children c) disabled / long-term sick. Homelessness a) rough sleepers b) households in temporary accommodation i) total ii) households with children Change in proportion on non-decent homes 14. Ensure that current and future residents have access to affordable health care. Long-term illness, health problem or disability which limits people's daily activities or the work they could do Access to a GP Health inequality a) infant mortality(by (socio-economic group) b) life expectancy (by area) for men and women General Health: Good, Fairly Good, Not good Population per GP Mortality rates death rates from a) Circulatory disease b) Cancer, below 75 years and for areas with the worst health and deprivation indicators; c) suicides Smoking prevalence of smoking a) All adults b) 'Routine and manual' socio-economic groups. Childhood obesity prevalence of obesity in 2-10 year-olds. 15. Ensure the protection, and where possible, the enhancement of the cultural heritage and unique character of the borough. Conservation areas number and % of borough Number and of listed buildings on BAR register Number of conservation areas and those that do not have Conservation Area Proposals Statements Number and condition of SAMs Number and condition of archaeological priority areas.
NB not all data available for RBKC
©Scott Wilson Business Consultancy June 2005 24


SEA / SA of Royal Borough of Kensington and Chelsea LDF Baseline and Sustainability Issues Workshop – Participant Feedback
APPENDIX III – ORIGINALLY PROPOSED SA OBJECTIVES Objective Eco Env Soc
1. Ensure that opportunities for enhancement and protection of biodiversity and geology (soils) are integrated into the design
2. Reduce crime and the fear of crime.
3. Encourage vital centres in terms of retail, small businesses.
4. Encourage social inclusion and equity.
5. Minimise effects on climate change through reduction in emissions, energy efficiency and use of renewables
6. To reduce the risk of flooding and the resulting detriment to public well-being, the economy and the environment
7. To reduce air pollution and ensure air quality continues to improve.
8. Maximise available open space through enhancement and seek to create open space where possible.
9. Reduce average emissions of pollutants (noise, air, water, etc) per capita
10. Reduce the dependency on the private car, and encourage the use of alternative transport modes.
11. To reduce waste arising and increase the amount of waste recycled and composted.
12. To ensure that all current and future residents have access to high quality community facilities (including recreation, sports centres, schools etc)
13. To ensure that everyone has the opportunity to live in a decent, sustainably constructed and affordable home
14. Ensure that current and future residents have access to affordable health care.
15. Ensure the protection, and where possible, the enhancement of the cultural heritage and unique character of the borough.
©Scott Wilson Business Consultancy June 2005 63


SEA / SA of Royal Borough of Kensington and Chelsea LDF Baseline and Sustainability Issues Workshop – Participant Feedback
APPENDIX IV – CHANGES MADE TO THE ORIGINAL OBJECTIVES. Changes made to the originally proposed SA objectives in light of comments made at the Scoping Workshop (number in brackets refers to the number of participants making the same or a very similar comment).
Proposed additional objectives How dealt with (NB refers to old objective numbers)
• Proposed split of Objective 13 into two separate objectives, in line with the Council’s plans and objectives
• Objective 13 changed to: “To ensure that the housing needs of the Royal Borough’s residents are met.”
• Objective 14 added: Encourage energy efficiency through building design to maximise the re-use of building’s and the recycling of building materials.
Objective 1:
• Add:‘and to ensure there is no further loss of area or diversity of habitats for wildlife.’
• Change to: To conserve and enhance the natural environment and biodiversity.
• Integrated into Objective 1, now: “To conserve and enhance the natural environment and biodiversity.”
Objective 2:
• Re-phrase including ’anti-social behaviour’. • Integrated into Objective 1, now ‘Reduce crime and anti-social behaviour and the fear of crime’.
Objective 3:
• Rephrase to include Strategic Policy STRAT 20 of the Boroughs UDP
Integrated into Objective : To support a diverse and vibrant local economy to foster sustainable economic growth.
Objective 4:
• Rephrase to include objectives from the corporate equality policy
Rephrased to: Encourage social inclusion, equity, the promotion of equality and a respect for diversity.
Objective 5:
• Add: “and where possible plan for mitigating the effects of climate change on biodiversity and green space or on the environment in general.
• Integrate the corporate energy policy and Environmental Policy Statement
• Objective 5 unchanged
Objective 6:
• Integrate PU10 of the UDP and para 12.6.5. • New Objective: Reduce the risk of flooding to current and future residents
Objective 7 •
• Revise in light of the Environmental policy Statement • Changed to: Improve air quality in the Royal Borough.
Objective 8:
©Scott Wilson Business Consultancy June 2005 65

SEA / SA of Royal Borough of Kensington and Chelsea LDF Baseline and Sustainability Issues Workshop – Participant Feedback
• Revise in light of the Environmental policy Statement
• Changed to: Protect and enhance the Royal Borough’s parks and open spaces.
Objective 9:
• Amend in light of UDP sustainability objectives
• Amended to: Reduce pollution of air, water and land.
Objective 10
• Amended in light of the UDP sustainability and transport polices
• New objective: To promote traffic reduction and encourage more sustainable alternative forms of transport to reduce energy consumption and emissions from vehicular traffic.
Objective 11:
• Revised integrating the Municipal Waste Management Strategy
• Reduce the amount of waste produced and maximise the amount of waste that is recycled.
Objective 12:
• add parks to “community facilities” • Updated in line with UDP policies
• Amended Objective now reads: Ensure that social and community uses and facilities which serve a local need are enhanced, protected, and to encourage the provision of new community facilities.
Objective 13:
• Split to two objectives and integrate the housing strategy objectives
• Objective now: To aim that the housing needs of the Royal Borough’s residents are met.
Objective 14:
• None Suggested • None Suggested
Objective 15 •
• New objective covering sustainability in building design in line with the UDP.
• New objective: Encourage energy efficiency through building design to maximise the re-use of building’s and the recycling of building materials.
Objective 16 •
• Revised to include the Environmental policy Statement
• Objective now: To reinforce local distinctiveness, local environmental quality and amenity through the conservation and enhancement of cultural heritage.
©Scott Wilson Business Consultancy June 2005 66


SEA / SA of Royal Borough of Kensington and Chelsea LDF Baseline and Sustainability Issues Workshop – Participant Feedback
APPENDIX III – ORIGINALLY PROPOSED SA OBJECTIVES Objective Eco Env Soc
1. Ensure that opportunities for enhancement and protection of biodiversity and geology (soils) are integrated into the design
2. Reduce crime and the fear of crime.
3. Encourage vital centres in terms of retail, small businesses.
4. Encourage social inclusion and equity.
5. Minimise effects on climate change through reduction in emissions, energy efficiency and use of renewables
6. To reduce the risk of flooding and the resulting detriment to public well-being, the economy and the environment
7. To reduce air pollution and ensure air quality continues to improve.
8. Maximise available open space through enhancement and seek to create open space where possible.
9. Reduce average emissions of pollutants (noise, air, water, etc) per capita • 9a prioritize development on previously developed land
10. Reduce the dependency on the private car, and encourage the use of alternative transport modes.
11. To reduce waste arising and increase the amount of waste recycled and composted.
12. To ensure that all current and future residents have access to high quality community facilities (including recreation, sports centres, shops schools etc)
13. To ensure that everyone has the opportunity to live in a decent, sustainably constructed and affordable home
14. Ensure that current and future residents have access to affordable health care.
15. Ensure the protection, and where possible, the enhancement of the cultural heritage and unique character of the borough.
©Scott Wilson Business Consultancy June 2005 67


SEA / SA of Royal Borough of Kensington and Chelsea LDF Baseline and Sustainability Issues Workshop – Participant Feedback
APPENDIX IV – CHANGES MADE TO THE ORIGINAL OBJECTIVES. Changes made to the originally proposed SA objectives in light of comments made at the Scoping Workshop (number in brackets refers to the number of participants making the same or a very similar comment).
Proposed additional objectives How dealt with (NB refers to old objective numbers)
Proposed split of Objective 13 into two separate objectives, in line with the Council’s plans and objectives
ged to: “To ensure that the housing needs of the Royal Borough’s residents are met.”
ed: Encourage energy efficiency through building design to maximise the re-use of building’s and the recycling of building materials.
Objective 1:
Add:‘and to ensure there is no further loss of area or diversity of habitats for wildlife.’ Change to: To conserve and enhance the natural environment and biodiversity.
Integrated into Objective 1, now: “To conserve and enhance the natural environment and biodiversity.”
Objective 2:
Re-phrase including ’anti-social behaviour’. Integrated into Objective 1, now ‘Reduce crime and anti-social behaviour and the fear of crime’.
Objective 3:
• Rephrase to include Strategic Policy STRAT 20 of the Boroughs UDP
Integrated into Objective : To support a diverse and vibrant local economy to foster sustainable economic growth.
Objective 4:
• Rephrase to include objectives from the corporate equality policy
Rephrased to: Encourage social inclusion, equity, the promotion of equality and a respect for diversity.
Objective 5:
Add: “and where possible plan for mitigating the effects of climate change on biodiversity and green space or on the environment in general. Integrate the corporate energy policy and Environmental Policy Statement
Objective 5 unchanged
Objective 6:
Integrate PU10 of the UDP and para 12.6.5. New Objective: Reduce the risk of flooding to current and future residents
Objective 7
Revise in light of the Environmental policy Statement Changed to: Improve air quality in the Royal Borough.
Objective 8:
Revise in light of the Environmental policy Statement Changed to: Protect and enhance the Royal Borough’s parks and open spaces.
Objective 9:
©Scott Wilson Business Consultancy June 2005 69

SEA / SA of Royal Borough of Kensington and Chelsea LDF Baseline and Sustainability Issues Workshop – Participant Feedback
Amend in light of UDP sustainability objectives Amended to: Reduce pollution of air, water and land.
Objective 10
Amended in light of the UDP sustainability and transport polices
New objective: To promote traffic reduction and encourage more sustainable alternative forms of transport to reduce energy consumption and emissions from vehicular traffic.
Objective 11:
Revised integrating the Municipal Waste Management Strategy
Reduce the amount of waste produced and maximise the amount of waste that is recycled.
Objective 12:
add parks to “community facilities” Updated in line with UDP policies
Amended Objective now reads: Ensure that social and community uses and facilities which serve a local need are enhanced, protected, and to encourage the provision of new community facilities.
Objective 13:
Split to two objectives and integrate the housing strategy objectives
Objective now: To aim that the housing needs of the Royal Borough’s residents are met.
Objective 14:
None Suggested None Suggested
Objective 15
New objective covering sustainability in building design in line with the UDP.
New objective: Encourage energy efficiency through building design to maximise the re-use of building’s and the recycling of building materials.
Objective 16
Revised to include the Environmental policy Statement Objective now: To reinforce local distinctiveness, local environmental quality and amenity through the conservation and enhancement of cultural heritage.
©Scott Wilson Business Consultancy June 2005 70

SEA / SA of Royal Borough of Kensington and Chelsea LDF Baseline and Sustainability Issues Workshop – Participant Feedback
APPENDIX V – CONSULTATION RESPONSES Consultee Principal comments Response
• Concern over the use of ‘indicators’ to measure baseline data when there may be other data that is not suitable to be represented by indicators but is valuable nonetheless.
• Suggested alternative text for para 3.2.1 “Generally speaking, baseline information is collected using indicators” - to be replaced by – “Generally speaking baseline information can be collated from
o Indicators o Stakeholder consultationo Context review o Studies and reports (e.g.
the forthcoming open spaces strategy)
• It is helpful within an SEA to present much of the baseline information in the form of indicators. This assists in the process of prioritising the SEA issues and contributes to the comparison of the evidence base for the SEA with data from other areas or within a time series. Comparing data is important when determining the significance of impacts during stage B of the SEA.”
Countryside Agency
• Lack data for open space indicator, specifically, characterisation of the open spaces and their condition.
• Open Space audit currently being carried out.
RBKC Economic Regeneration
• Adjust figures under Objective 3 - There has been a growth in the number of people of working age in the Royal Borough of Kensington and Chelsea from 114,710 in 2001 to 123,500 in 2003 (a 7% increase from 2001). The unemployment rate, as measured by claimants of job seekers allowance, compares well with London, being below the average, and claimants have been on a downward trend between 2000 and 2005 experiencing a 34% drop.
• Text and baseline matrix amended accordingly.
©Scott Wilson Business Consultancy June 2005 71

SEA / SA of Royal Borough of Kensington and Chelsea LDF Baseline and Sustainability Issues Workshop – Participant Feedback
©Scott Wilson Business Consultancy June 2005 72
Consultee Principal comments Response
• Evidence gathered as part of the review which lead to the 2002 UDP17 indicated that there is a shortage of small office units, <300m2 and particularly <100m2. Additionally, some areas are amongst the most economically deprived in the country in particular, north of the Westway and SW Chelsea. This is illustrated in Figure OBJ 3.1. Indices of Deprivation - Employment. There is a clear disparity between the north of the borough, particularly, the war
• ds of Golbourne, St Charles and Norland, all of which have super output areas in the 10 percent most deprived in England and Wales.
• Adjust figures under Objective 4 - Within the Royal Borough of Kensington and Chelsea, there is a clear north south delineation in regard to equity and social inclusion. Figure OBJ 4.1. Indices of Multiple Deprivation, clearly shows that the northern areas of the borough are relatively more deprived than those in the south. Despite perceptions to the contrary, not all of the borough is affluent, indeed there are 3 SOAs in the north of the borough that are in the worst 10% for multiple deprivation in the England. This contrasts with the south of the borough where some of the SOAs are in the top 5%, showing the Royal Borough to be an area of extremes.
• Text and baseline matrix amended accordingly.
RBKC Waste Department
• Para. 3.7.33 could be misinterpreted, problem could be better highlighted as the population density, nature of the built environment and the transient nature of the population.
• Para 3.7.33 amended to include further points but still include the issue of facilities.
RBKC Environmental Health
• P12, Table 3, include Air Quality strategy for England, Scotland, Wales and Northern Ireland, Environment Act 1995
• Added to table and Report in general.
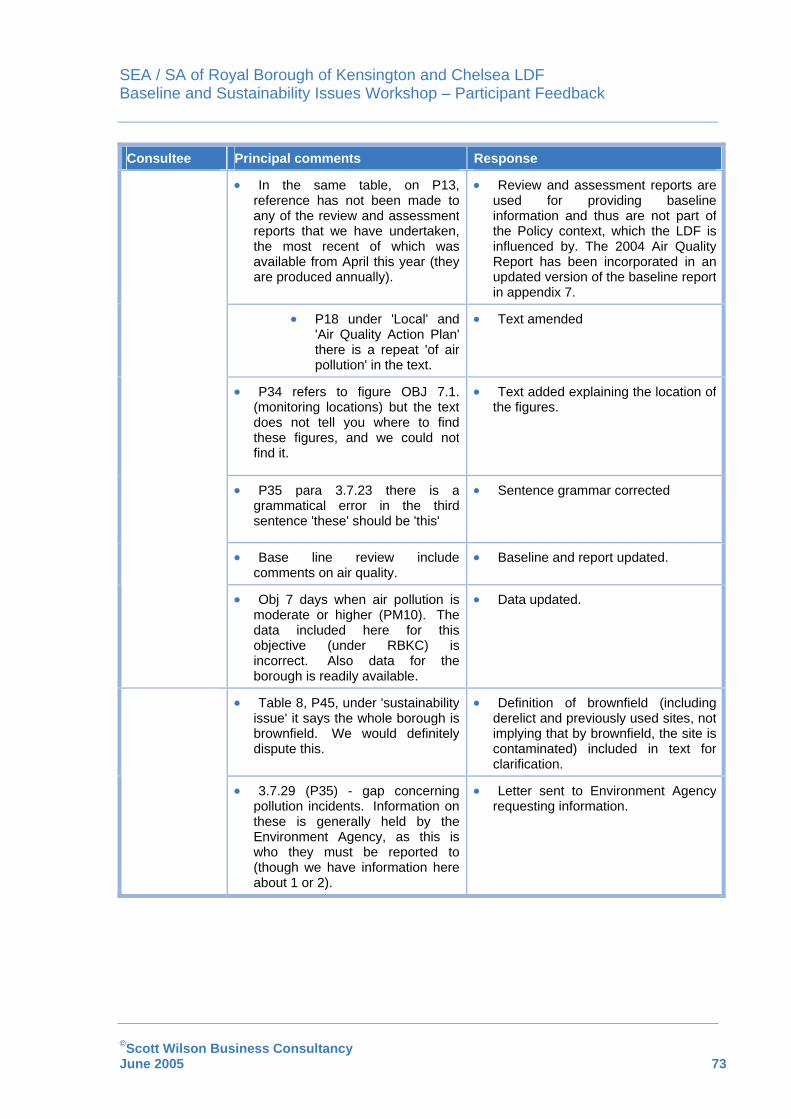
SEA / SA of Royal Borough of Kensington and Chelsea LDF Baseline and Sustainability Issues Workshop – Participant Feedback
©Scott Wilson Business Consultancy June 2005 73
Consultee Principal comments Response
• In the same table, on P13, reference has not been made to any of the review and assessment reports that we have undertaken, the most recent of which was available from April this year (they are produced annually).
• Review and assessment reports are used for providing baseline information and thus are not part of the Policy context, which the LDF is influenced by. The 2004 Air Quality Report has been incorporated in an updated version of the baseline report in appendix 7.
• P18 under 'Local' and 'Air Quality Action Plan' there is a repeat 'of air pollution' in the text.
• Text amended
• P34 refers to figure OBJ 7.1. (monitoring locations) but the text does not tell you where to find these figures, and we could not find it.
• Text added explaining the location of the figures.
• P35 para 3.7.23 there is a grammatical error in the third sentence 'these' should be 'this'
• Sentence grammar corrected
• Base line review include comments on air quality.
• Baseline and report updated.
• Obj 7 days when air pollution is moderate or higher (PM10). The data included here for this objective (under RBKC) is incorrect. Also data for the borough is readily available.
• Data updated.
• Table 8, P45, under 'sustainability issue' it says the whole borough is brownfield. We would definitely dispute this.
• Definition of brownfield (including derelict and previously used sites, not implying that by brownfield, the site is contaminated) included in text for clarification.
• 3.7.29 (P35) - gap concerning pollution incidents. Information on these is generally held by the Environment Agency, as this is who they must be reported to (though we have information here about 1 or 2).
• Letter sent to Environment Agency requesting information.

SEA / SA of Royal Borough of Kensington and Chelsea LDF Baseline and Sustainability Issues Workshop – Participant Feedback
©Scott Wilson Business Consultancy June 2005 74
Consultee Principal comments Response
• Objective 5 has just been put forward as an 'environmental' objective but it is more than that (certainly social at least).
• Climate change is an environmental variable that has social and economic impacts. Consequently, we have amended Table 2 to reflect this fact. However, The Objective remains the same; RBKC should propose other indicators of performance relating to this area in terms of social and economic impacts of the change in climate (such as flood damage costs to business / residential areas).
• We've had a think about more meaningful indicators relating to the air quality objective, as the ones previous suggested don't really relate to the Council's performance. In addition, we have also slightly reworded the objective itself. Proposed Indicators: *
• Emissions reduction from Borough Fleet vehicles;
• Adoption of Green Travel Plans in Schools
• Number of permit free developments in the borough.
• Indicators added
• Proposed Objective 7: To continue to monitor levels of pollution within the borough and work towards improving air quality.
• We recommend that the objective remains unchanged as it would be difficult to assess how “working towards” would be measured and significance determined objectively. Furthermore it is a statutory obligation that the Borough must continue monitoring levels of pollution and work towards its improvement rather than a matter of choice in terms of good practice. The objective as it stands is better able to assess objective environmental improvements. The extra indicators proposed above by RBKC should help reflect both the successes as well as the challenges facing the borough.
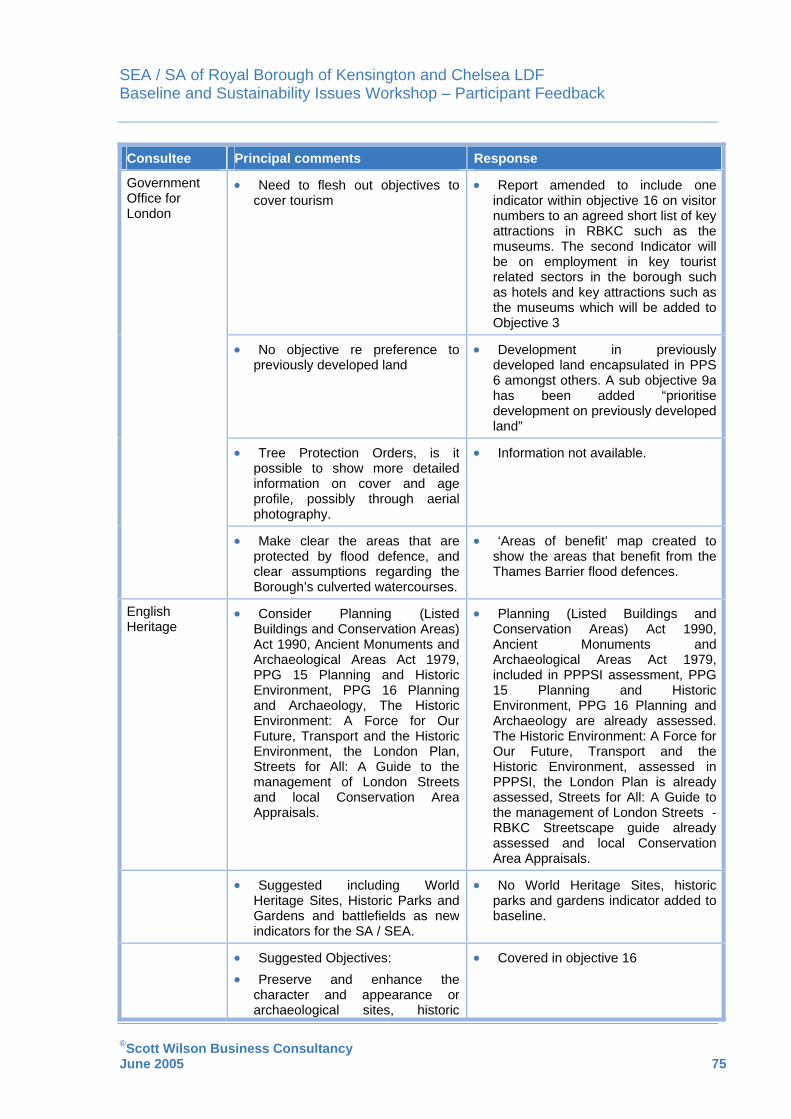
SEA / SA of Royal Borough of Kensington and Chelsea LDF Baseline and Sustainability Issues Workshop – Participant Feedback
©Scott Wilson Business Consultancy June 2005 75
Consultee Principal comments Response
• Need to flesh out objectives to cover tourism
• Report amended to include one indicator within objective 16 on visitor numbers to an agreed short list of key attractions in RBKC such as the museums. The second Indicator will be on employment in key tourist related sectors in the borough such as hotels and key attractions such as the museums which will be added to Objective 3
• No objective re preference to previously developed land
• Development in previously developed land encapsulated in PPS 6 amongst others. A sub objective 9a has been added “prioritise development on previously developed land”
• Tree Protection Orders, is it possible to show more detailed information on cover and age profile, possibly through aerial photography.
• Information not available.
Government Office for London
• Make clear the areas that are protected by flood defence, and clear assumptions regarding the Borough’s culverted watercourses.
• ‘Areas of benefit’ map created to show the areas that benefit from the Thames Barrier flood defences.
English Heritage
• Consider Planning (Listed Buildings and Conservation Areas) Act 1990, Ancient Monuments and Archaeological Areas Act 1979, PPG 15 Planning and Historic Environment, PPG 16 Planning and Archaeology, The Historic Environment: A Force for Our Future, Transport and the Historic Environment, the London Plan, Streets for All: A Guide to the management of London Streets and local Conservation Area Appraisals.
• Planning (Listed Buildings and Conservation Areas) Act 1990, Ancient Monuments and Archaeological Areas Act 1979, included in PPPSI assessment, PPG 15 Planning and Historic Environment, PPG 16 Planning and Archaeology are already assessed. The Historic Environment: A Force for Our Future, Transport and the Historic Environment, assessed in PPPSI, the London Plan is already assessed, Streets for All: A Guide to the management of London Streets - RBKC Streetscape guide already assessed and local Conservation Area Appraisals.
• Suggested including World Heritage Sites, Historic Parks and Gardens and battlefields as new indicators for the SA / SEA.
• No World Heritage Sites, historic parks and gardens indicator added to baseline.
• Suggested Objectives: • Preserve and enhance the
character and appearance or archaeological sites, historic
• Covered in objective 16

SEA / SA of Royal Borough of Kensington and Chelsea LDF Baseline and Sustainability Issues Workshop – Participant Feedback
©Scott Wilson Business Consultancy June 2005 76
Consultee Principal comments Response buildings, conservation areas, historic parks and gardens, and other culturally important features and areas, and their settings;
• Protect and enhance the character and appearance of townscape / countryside;
• Maintain and strengthen local distinctiveness and sense of place;
• Improve the quality of the public realm, creating places that work well, wear well and look well
Suggested Indicators: 1. Number of Listed Buildings
under each grade; 2. Number and percentage of listed
buildings at risk; 3. Number of Scheduled ancient
monuments; 4. Number and percentage of
archaeological sites at risk; 5. Number of registered historic
parks and gardens; 6. Number of registered historic
parks and gardens at risk; 7. Number of conservation areas; 8. Number and percentage of
Conservation Areas with appraisals;
9. Impact of change on the character or appearance of conservation areas;
10. Percentage of areas of historic buildings, sites and areas, including locally listed assets, affected, whether in an adverse or beneficial way;
11. Street / public realm audits, improvement works, de-cluttering works;
12. Percentage of residents content with character and appearance of local area;
13. The rate of loss of historic landscape features; and
14. Erosion of quality character and distinctiveness.
• Many indicators are already included (1,2,3,4, 5, 7 & 8). Others are useful and will be included as data is available from existing 32 Conservation Area Appraisals (6,7,9). Not all these indicators are suitable for the spatial plan some would be better placed in the transport Plan SEA for the Borough, as they are too specific for the spatial plan to influence in a meaningful way (e.g. 12). Indicators 10,11,14 and 15 have been combined into one indicator “historic buildings, sites and conservation areas, including locally listed assets, affected, whether in an adverse or beneficial way”. There is insufficient data to address indicator 13. Also not strictly necessary to carry out for an SEA.
Kensington Society –
• Scoping Report requires an • Integration of the SEA Directive aims into the beginning of the Scoping

SEA / SA of Royal Borough of Kensington and Chelsea LDF Baseline and Sustainability Issues Workshop – Participant Feedback
©Scott Wilson Business Consultancy June 2005 77
Consultee Principal comments Response Represented by Mr. M Bach
overarching ‘guiding principle’ • pment in Locating new develo
highly accessible areas • Providing affordable housing • local Maintain the borough
character • Loss of petrol filling stations • Encourage mixed use proposals
Report. • Other issues are picked up through
existing objectives (10, 4,15, 12 and 3)
Environmental Round Table – Mr. Tim Nodder
• Highlights the lack of illustration of the transport disparities between the north and south of the borough and proposes a new indicator for energy use: How many users, in addition to the Council for street lighting, are buying their electricity form renewable source tariffs
• It is access to goods and services which is a sustainability issue not north-south transport links. This is picked up objectives 4 and 12. In an addition an indicator has been added to Objective 4 on PTAL scores. In terms of Energy this is probably not something the spatial plan can influence. It is more likely to be an issue for the Mayors Energy Strategy or the Councils EMS
• e, giving Vol. III is out of balanctoo much weight to the pressure of “guidance” from on high.
• Reports of consultation events will provide useful baseline information, which will be used in stage B of the SEA this should help redress the issue raised here.
• The addressing (or lack of ) is of concern, as is the perceived ambiguity of the remit of the LDF in terms of spatial planning
• The Local Implementation Plan concerning transport issues in the Borough will undergo it’s own SA / SEA.
• s Gloomily expressed constrainttowards sustainability objectives and discounted pre-emptive.
• SA Objectives have not yet been adopted so there is no progress towards them. Statement about likely success on energy efficiency has been removed as Judgement on this issue is better placed in stage B.
• The sports and leisure activities across the borough are not addressed adequately, in addition to the competing use of spaces for fairs and events.
• Objective 12 includes sport centres, an additional indicator is proposed which seeks to assess the provision of other recreation facilities and spaces
• ets environmental The strecondition is not covered adequately
• Will be covered in the LIP and LIP SA
• The deficiencies in the N to S bus services and the Council’s long term hope for a cross Chelsea metro link (Cross Rail Two) are not accounted for.
• The sustainability issue is access to goods and services rather than north south linkages. If this access can be obtained by, for example east west movements, this should be sufficient Access is picked up in objective 12.

SEA / SA of Royal Borough of Kensington and Chelsea LDF Baseline and Sustainability Issues Workshop – Participant Feedback
©Scott Wilson Business Consultancy June 2005 78
Consultee Principal comments Response In an addition an indicator has been added to Objective 4 on PTAL scores.
• Issues to be tackled in respect of each of the broad environmental objectives are not yet sufficiently pulled together. The report identifies some synergies, but there is surely potential for more useful and positive work on these lines.
• The pulling together of issues is an ongoing process as the baseline is updated. There is a discreet stage in the SEA method, which is the identification of key sustainability issues (see table 7) and seeks to address the synergies & cumulative impacts. Further integration will occur in stage B (see appendix VIII)
Environment Agency
• Vol I – 2.2.1, would like some reference to PPG 23 with CLR Model procedures for the management of contaminated land.
• PPG 23 included, CLR Model added in Proforma but not key messages
• inclusion of Would like to see the the Emerging National Tidal Encroachment Policy.
• ment Current Thames encroachPolicy included, as is the “Emerging” National Encroachment Policy.
• Vol I – Table 5. Suggest new indicators / data sources:
• Length of Thames Riverside development where the defences have not been proven to have at least the same life expectancy as the development and where a significant set back for access is not achieved / Kensington and Chelsea Planning Dept – the length of tidal defences where their life expectancy has been demonstrated to be no less than that of new development and a significant set back between the development and the defences obtained.
• Percentage of developments accepted without an acceptable Flood Risk Assessment (FRA) / Kensington and Chelsea Planning Dept –. All developments should provide as FRA and so it follows that the target is 100%
• The Thames Barrier protects all of London. It is recognised that the current design life of the barrier is valid until 2030 and that some additional works may extend its life by a “few years”. The following indicators have been added to objective 6 to address EA concerns and also reflect the issues in a borough, which already has a long and heavily developed riverside.
• “Length of proposed new Thames Riverside development in the site allocation DPD, where the defences have not been proven to have at least the same life expectancy as the development and where a significant set back for access is not achieved.
• Additional indicator added “percentage of developments that provide a FRA, and provide flood mitigation methods where appropriate.”
• Inclusion of new objective – To enhance the natural amenity value of the River Corridor of the River Thames / indicators – Length of Thames Riverside development where the river corridor is not
• Subject covered under Objective 1, 8 and 16.

SEA / SA of Royal Borough of Kensington and Chelsea LDF Baseline and Sustainability Issues Workshop – Participant Feedback
©Scott Wilson Business Consultancy June 2005 79
Consultee Principal comments Response enhanced for the benefit of wildlife and to improve amenity value of where non-river dependant development is permitted within the Thames Tideway / Data source - Kensington and Chelsea Planning Dept – percentage of riparian development where public access is improved and the river corridor enhanced and the percentage of development where non-river development is permitted within the tideway.
• Vol. III – The PPG – 25 entry has had text from previous PPG – 24 entry inserted by mistake.
• Delete irrelevant text.


SEA / SA of Royal Borough of Kensington and Chelsea LDF Baseline and Sustainability Issues Workshop – Participant Feedback
APPENDIX VI – STAKEHOLDERS CONSULTED ON SCOPING REPORT
• The Countryside Agency;
• English Heritage;
• English Nature;
• Environment Agency;
• The Environment Round Table;
• Kensington and Chelsea Chamber of Commerce;
• Metropolitan Police Service;
• Kensington and Chelsea PCT;
©Scott Wilson Business Consultancy June 2005 81
•
ocial Council;
y;
and Fulham;
nster; and
• London Borough of Brent.
The Chelsea Society;
• The Kensington Society;
• Commission for Racial Equality;
• Kensington and Chelsea S
• London Rivers Authorit
• London Wildlife Trust;
• Government Office London;
• North Kensington Environmental Forum;
• London Borough of Hammersmith
• London Borough of Wandsworth;
• London Borough of Westmi


SEA / SA of Royal Borough of Kensington and Chelsea LDF Baseline and Sustainability Issues Workshop – Participant Feedback
APPENDIX VII – BASELINE SPREADSHEET
©Scott Wilson Business Consultancy June 2005 83

Royal Borough of Kensington and Chelsea LDF SEA / SA Baseline Review
No action Indicator is performing well relative to past performance / London / South East / UK / targetNeeds action Indicator is under performing relative to past performance / London / South East / UK / target
Priority Indicator is performing poorly relative to past performance / London / South East / UK / target
Unclear Indicator status cannot be assessed due to lack of data or is considered unclassifiable
DATA QUALITY
1 Good quality local data - recent measurement and historical trend2 Local data for recent period only (ie. no trend)3 Data for other geographical areas
The collection of baseline information is a key component of the SA process and a legal requirement under the SEA Directive. Baseline information helps to provide a basis for predicting and monitoring effects and assembling baseline data helps to identify sustainability problems. When collecting baseline data, the aim is to assemble sufficient data on the current and likely future state of the area to enable the LDF’s effects to be adequately predicted. A key aim is to ensure that, where possible, each of the SA objectives is ‘underwritten’ with comprehensive and up-to-date baseline information.
In collecting baseline data, ‘gaps’ in data coverage are inevitably encountered. Government guidance suggests that where baseline information is unavailable or unsatisfactory, planning authorities should consider how they could improve it for use in assessments of future plans.
Generally speaking, baseline information is collected using indicators. Examples of indicators include the percentage of people in an area describing their health as not good or the number of unfit dwellings in a district or borough. Indicators can be derived from a range of sources (e.g. The London Sustianabilty Framework).
If indicators are monitored over time, the resulting data can reveal trends in performance (i.e. whether something is getting better or worse). Indicator performance can also be gauged in relation to wider geographical areas (e.g. counties or regions) if comparable data is available. Indicator performance can also be assessed in relation to targets where these exist.
A series of baseline indicators for RBKC are identified in the second sheet. These are organised broadly according to Objectives. Data is provided, where available, for RBKC (local), London (sub-regional) and UK (national). Where possible, an indication of RBKC's performance relative to larger geographical areas, targets or previous performance is given. Note that national indicators are variously specified for England only, England and Wales, Great Britain or the UK. Indicator status is also classified (see below). The spreadsheet is accompanied by a commentary and information on data quality (see below) and data sources.
INDICATOR STATUS

Ref Indicator RBKC London UK Target Local trend Indicator status Commentary Data
quality Data sources
OBJ 1 Area of contaminated land
227 LA designations of Contaminated Land in 2005 in England under Part IIA of EPA 1990.
3 http://www.defra.gov.uk/
OBJ 1Number of waste recycling facilities
24 mini recycling centres and 1 civic amenity site. No data available No data available None Insufficient data to
identify local trend
Community recycling groups make additional services available.
3 www.rbkc.gov.uk www.london.gov.uk
OBJ 1 Levels of damage to designated sites
OBJ 1Achievement of BAP objectives and targets for Key Species
Birds - Finches and the House SparrowMammals - Pipistrelle BatPlant - MistletoeAmphibians - Common FrogTrees - Ash TreeInsect - Peacock Butterfly and other butterflies
LBAP is a recent publication therefore there is no monitoring data to assess trends etc.
1 RBKC LBAP
OBJ 1 Achievement of BAP objectives for key habitats
Woodland and HedgerowGrasslandWater.
LBAP is a recent publication therefore there is no monitoring data to assess trends etc.
1 RBKC LBAP
OBJ 1Area of sites of conservation value
4 Sites of Metropolitan Importance, 5 Sites of Borough Importance: Grade 1, 8 Sites of Borough Importance: Grade 2 and 6 Sites of Local Importance. These designations cover an area of approx 110 hectares.
SMI - 136SBI Grade I - 315SBI Grade II - 490SLI - 484
There are 608 designated Special Areas of Conservation in the UK, covering an area of 2622729 ha.
Data not readily available - likely data gap
Loss of Kensal Green Gasworks, Kings College Chelsea and British Rail Western Region Land
1
Kensal Green Gasworks was proposed to be de-designated due to development.The loss of any habitat of value in an area so limited in valued habitat is a concern
1London Conservation Services Habitat Survey Kensington and Chelsea May 2003
OBJ 1
Bird Populations a) Farmlandb) Woodlandc) Coasts and estuariesd) Wintering wetlande) Urban?
Finches and House Sparrows have been in decline in the borough over recent years
reversing the long-term decline in the number of ... birds by 2020, as measured annually against underlying trends.bringing into favourable condition, by 2010, 95% of all nationally important wildlife sites
House Sparrow - 70+ in 1995, 97 and 98,35+ and in 2001 only 2-4 birds where recorded. The most recent count indicated that no breeding birds where recorded at the breeding sites.Greenfinch - 10+ on 1995, 3-5 in 2002.
2
Feeders in Holland Park may have helped to halt the decline in Greenfinch numbers.Suggest using the 15 species in the 2004 Borough Breeding Survey as supplementary indicators
1
London Conservation Services Habitat Survey Kensington and Chelsea May 2003.Borough Breeding Survey (2004)
OBJ 1Biodiversity Conservation priority species status, priority habitat status
30 thousand hectares of biosphere reserves in the UK in 2002. 17 threatened species in 1990-1999. 855 thousand hectares of wetlands of importance.
2 www.nationmaster.com
Data not readily available - likely data gap
Data not readily available - likely data gap
Species in decline
RBKC LDF SEA / SA Baseline Review
Data not readily available - likely data gap
Data not readily available - likely data gap
Objective 1. To conserve and enhance the natural environment and biodiversity.
Data not readily available - likely data gap
No data available None

Ref Indicator RBKC London UK Target Local trend Indicator status Commentary Data
quality Data sources
OBJ 1
Agricultural sector fertiliser input, farmland bird population, and ammonia and methane emissions and output
OBJ 1Farming and Environmental Stewardship
OBJ 1 Fish Stocks fish stocks around the UK within sustainable limits
OBJ 1Number of Tree preservation orders 100+ TPO's in the borough No data available No data available None Insufficient data to
identify local trend 2 www.rbkc.gov.uk
OBJ 1 Local environmental quality No data available
Local environmental quality in London behind national standards by 42%, although has improved since the former years report
The 2002/3 Local Environment Quality Survey of England reported 27% decrease in dog fouling, 12% increase in fast food litter and an increase in the amount of chewing gum litter.
Cleaner, safer and greener public spaces and improvement of the quality of the built environment in deprived areas and across the country with measurable improvement by 2008.
Insufficient data to identify local trend To be developed 2 www.encams.org
OBJ 1 Habitat Diversity 24 Habitat Types To increase to diversity of habitat in the borough over the plan period
Insufficient data to identify local trend
Proposed by Jennifer O'Riley of RBKC at the Baseline and Sustainability Workshop on the 23rd March 2005 - To be developed
? Possible data sources: RBKC Habitat Surveys, LBAP
OBJ 1 Species Diversity To increase to diversity of species in the borough over the plan period
Insufficient data to identify local trend
Proposed by Jennifer O'Riley of RBKC at the Baseline and Sustainability Workshop on the 23rd March 2005 - To be developed
? Possible data sources: RBKC Habitat Surveys, LBAP
OBJ 1
Land Use area used for agriculture, woodland, water or river, urban (contextural indicator)
No data available7.9% of land use in London is agricultural in 2001.
67.8% of land use in UK is agricultural in 2001. 3 Source
OBJ 2
Crime crime survey and recorded crime for a) Vehiclesb) domestic burglaryc) violence
Total notifiable offences decreased from 30779 to 30714 (0.2%) between 1999/2000 - 2000/2001. Burglaries/1000 households in 2001/2 - 30.5, 2002/3 - 19.6, 2003/4 -20.8. Vehicle crimes/1000 population in 2001/2 - 29.8, 2002/3 - 22.5, 2003/4 - 23.6
Decrease by 1.5% in crimes between 2003/4 - 2004/5.
Notifiable offences in England and Wales rose from 10,007 to 11,327 per 100,000 population between 1991 - 2002/3
Slight decrease in total notifiable offences in recent years. Overall decrease in number of burglaries (32% decrease) and vehicle crimes (21% decrease) between 2001 /2 - 2003/4.
3
Reduction in burglaries and violent crimes have decreased at a rate greater than the target value.
2
http://www.statistics.gov.uk/downloads/theme_compendia/region_in_figures_winter03/South_East.pdf http://www.rbkc.gov.uk/YourCouncil/communitysafety/findings.asp http:www.bvpi.gov.uk
OBJ 2 Violence Against the person 3314 (18.5 per 1000 pop) in 2000/1.3378 in 03/04
21.9 per 1000 pop in 2001/2.
E&W: 11.4 per 1000 population in 2000/1. 12.3 per 1000 pop in 2001/2.
Trend has fluctuated, increasing in 02-03 by 13.3%, followed by a decrease in 03-04 by 2.6%, overall increase
2
2000/1 data for RBKC lower than 2001/2 data for London but higher than 2000/1 for England and Wales.
2
www.statistics.gov.ukwww.neighbourhoodstatistics.gov.ukhttp://www.rbkc.gov.uk/YourCouncil/CommunitySafety/cs_audit2001_2004maps.pdf
Data not readily available - likely data gap
Data not readily available - likely data gap
Data not readily available - likely data gap
Data not readily available - likely data gap
Objective 2. Reduce crime, anti-social behaviour and the fear of crime.
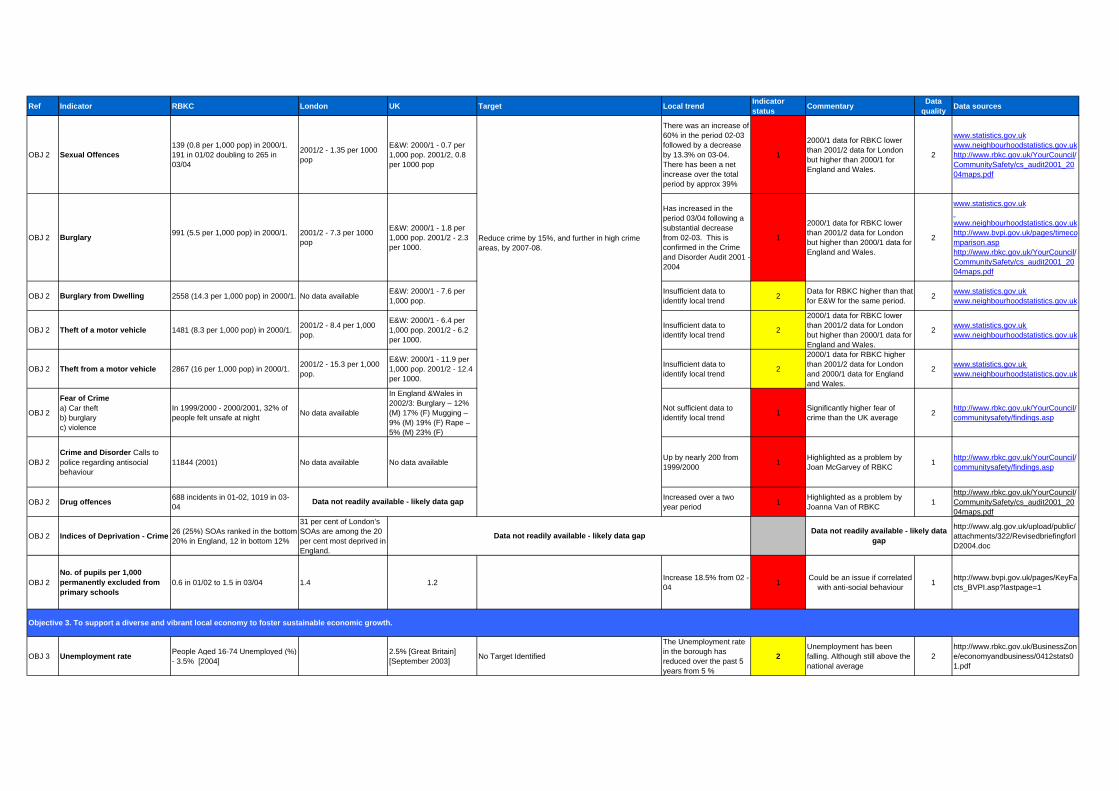
Ref Indicator RBKC London UK Target Local trend Indicator status Commentary Data
quality Data sources
OBJ 2 Sexual Offences139 (0.8 per 1,000 pop) in 2000/1.191 in 01/02 doubling to 265 in 03/04
2001/2 - 1.35 per 1000 pop
E&W: 2000/1 - 0.7 per 1,000 pop. 2001/2, 0.8 per 1000 pop
There was an increase of 60% in the period 02-03 followed by a decrease by 13.3% on 03-04. There has been a net increase over the total period by approx 39%
1
2000/1 data for RBKC lower than 2001/2 data for London but higher than 2000/1 for England and Wales.
2
www.statistics.gov.ukwww.neighbourhoodstatistics.gov.ukhttp://www.rbkc.gov.uk/YourCouncil/CommunitySafety/cs_audit2001_2004maps.pdf
OBJ 2 Burglary 991 (5.5 per 1,000 pop) in 2000/1. 2001/2 - 7.3 per 1000 pop
E&W: 2000/1 - 1.8 per 1,000 pop. 2001/2 - 2.3 per 1000.
Has increased in the period 03/04 following a substantial decrease from 02-03. This is confirmed in the Crime and Disorder Audit 2001 -2004
1
2000/1 data for RBKC lower than 2001/2 data for London but higher than 2000/1 data for England and Wales.
2
www.statistics.gov.uk www.neighbourhoodstatistics.gov.ukhttp://www.bvpi.gov.uk/pages/timecomparison.asphttp://www.rbkc.gov.uk/YourCouncil/CommunitySafety/cs_audit2001_2004maps.pdf
OBJ 2 Burglary from Dwelling 2558 (14.3 per 1,000 pop) in 2000/1. No data available E&W: 2000/1 - 7.6 per 1,000 pop.
Insufficient data to identify local trend 2 Data for RBKC higher than that
for E&W for the same period. 2 www.statistics.gov.uk www.neighbourhoodstatistics.gov.uk
OBJ 2 Theft of a motor vehicle 1481 (8.3 per 1,000 pop) in 2000/1. 2001/2 - 8.4 per 1,000 pop.
E&W: 2000/1 - 6.4 per 1,000 pop. 2001/2 - 6.2 per 1000.
Insufficient data to identify local trend 2
2000/1 data for RBKC lower than 2001/2 data for London but higher than 2000/1 data for England and Wales.
2 www.statistics.gov.uk www.neighbourhoodstatistics.gov.uk
OBJ 2 Theft from a motor vehicle 2867 (16 per 1,000 pop) in 2000/1. 2001/2 - 15.3 per 1,000 pop.
E&W: 2000/1 - 11.9 per 1,000 pop. 2001/2 - 12.4 per 1000.
Insufficient data to identify local trend 2
2000/1 data for RBKC higher than 2001/2 data for London and 2000/1 data for England and Wales.
2 www.statistics.gov.uk www.neighbourhoodstatistics.gov.uk
OBJ 2
Fear of Crimea) Car theftb) burglaryc) violence
In 1999/2000 - 2000/2001, 32% of people felt unsafe at night No data available
In England &Wales in 2002/3: Burglary – 12% (M) 17% (F) Mugging – 9% (M) 19% (F) Rape – 5% (M) 23% (F)
Not sufficient data to identify local trend 1 Significantly higher fear of
crime than the UK average 2 http://www.rbkc.gov.uk/YourCouncil/communitysafety/findings.asp
OBJ 2Crime and Disorder Calls to police regarding antisocial behaviour
11844 (2001) No data available No data available Up by nearly 200 from 1999/2000 1 Highlighted as a problem by
Joan McGarvey of RBKC 1 http://www.rbkc.gov.uk/YourCouncil/communitysafety/findings.asp
OBJ 2 Drug offences 688 incidents in 01-02, 1019 in 03-04
Increased over a two year period 1 Highlighted as a problem by
Joanna Van of RBKC 1http://www.rbkc.gov.uk/YourCouncil/CommunitySafety/cs_audit2001_2004maps.pdf
OBJ 2 Indices of Deprivation - Crime 26 (25%) SOAs ranked in the bottom 20% in England, 12 in bottom 12%
31 per cent of London’s SOAs are among the 20 per cent most deprived in England.
http://www.alg.gov.uk/upload/public/attachments/322/RevisedbriefingforID2004.doc
OBJ 2No. of pupils per 1,000 permanently excluded from primary schools
0.6 in 01/02 to 1.5 in 03/04 1.4 1.2 Increase 18.5% from 02 - 04 1 Could be an issue if correlated
with anti-social behaviour 1 http://www.bvpi.gov.uk/pages/KeyFacts_BVPI.asp?lastpage=1
OBJ 3 Unemployment rate People Aged 16-74 Unemployed (%) - 3.5% [2004]
2.5% [Great Britain] [September 2003] No Target Identified
The Unemployment rate in the borough has reduced over the past 5 years from 5 %
2Unemployment has been falling. Although still above the national average
2http://www.rbkc.gov.uk/BusinessZone/economyandbusiness/0412stats01.pdf
Data not readily available - likely data gapData not readily available - likely data gap
Reduce crime by 15%, and further in high crime areas, by 2007-08.
Objective 3. To support a diverse and vibrant local economy to foster sustainable economic growth.
Data not readily available - likely data gap
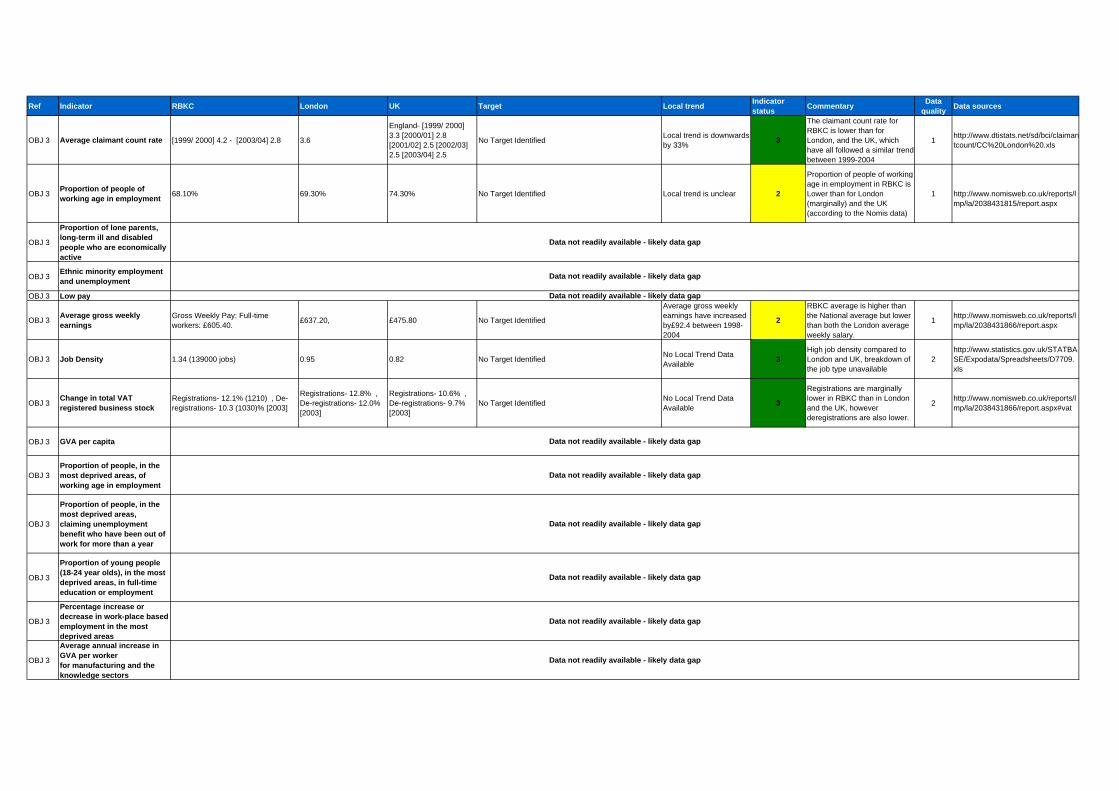
Ref Indicator RBKC London UK Target Local trend Indicator status Commentary Data
quality Data sources
OBJ 3 Average claimant count rate [1999/ 2000] 4.2 - [2003/04] 2.8 3.6
England- [1999/ 2000] 3.3 [2000/01] 2.8 [2001/02] 2.5 [2002/03] 2.5 [2003/04] 2.5
No Target Identified Local trend is downwards by 33% 3
The claimant count rate for RBKC is lower than for London, and the UK, which have all followed a similar trend between 1999-2004
1 http://www.dtistats.net/sd/bci/claimantcount/CC%20London%20.xls
OBJ 3 Proportion of people of working age in employment 68.10% 69.30% 74.30% No Target Identified Local trend is unclear 2
Proportion of people of working age in employment in RBKC is Lower than for London (marginally) and the UK (according to the Nomis data)
1 http://www.nomisweb.co.uk/reports/lmp/la/2038431815/report.aspx
OBJ 3
Proportion of lone parents, long-term ill and disabled people who are economically active
OBJ 3Ethnic minority employment and unemployment
OBJ 3 Low pay
OBJ 3 Average gross weekly earnings
Gross Weekly Pay: Full-time workers: £605.40. £637.20, £475.80 No Target Identified
Average gross weekly earnings have increased by£92.4 between 1998-2004
2
RBKC average is higher than the National average but lower than both the London average weekly salary.
1 http://www.nomisweb.co.uk/reports/lmp/la/2038431866/report.aspx
OBJ 3 Job Density 1.34 (139000 jobs) 0.95 0.82 No Target Identified No Local Trend Data Available 3
High job density compared to London and UK, breakdown of the job type unavailable
2http://www.statistics.gov.uk/STATBASE/Expodata/Spreadsheets/D7709.xls
OBJ 3Change in total VAT registered business stock
Registrations- 12.1% (1210) , De-registrations- 10.3 (1030)% [2003]
Registrations- 12.8% , De-registrations- 12.0% [2003]
Registrations- 10.6% , De-registrations- 9.7% [2003]
No Target Identified No Local Trend Data Available 3
Registrations are marginally lower in RBKC than in London and the UK, however deregistrations are also lower.
2 http://www.nomisweb.co.uk/reports/lmp/la/2038431866/report.aspx#vat
OBJ 3 GVA per capita
OBJ 3Proportion of people, in the most deprived areas, of working age in employment
OBJ 3
Proportion of people, in the most deprived areas, claiming unemployment benefit who have been out of work for more than a year
OBJ 3
Proportion of young people (18-24 year olds), in the most deprived areas, in full-time education or employment
OBJ 3
Percentage increase or decrease in work-place based employment in the most deprived areas
OBJ 3
Average annual increase in GVA per workerfor manufacturing and the knowledge sectors
Data not readily available - likely data gap
Data not readily available - likely data gap
Data not readily available - likely data gap
Data not readily available - likely data gap
Data not readily available - likely data gap
Data not readily available - likely data gap
Data not readily available - likely data gap
Data not readily available - likely data gap
Data not readily available - likely data gap

Ref Indicator RBKC London UK Target Local trend Indicator status Commentary Data
quality Data sources
OBJ 3 Value of manufacturing exports per head
OBJ 3
Investment a) Total investmentb) social investment relative to GDP.
UK Total investment as % of GDP at current prices decreased from 19.5 in 1970 - 17.0 in 2001. UK Social investment as % of GDP at current prices decreased from 2.7 in 1970 - 1.9 in 1998
Budget 2004 Insufficient data to identify local trend 3 www.statistics.gov.uk
OBJ 3 Employment people of working age in employment
Increase in people of working age in employment from 76,000 in 1999 - 89284 in 2004
Increase in people of working age in employment from 3.3 million in 1999 - 3.4 million in 2001.
Increase in people of working age in employment from 26.1 million in 1999 - 26.7 million in 2001.
Increase in employment rate of persons of working age by 29% between 1999 - 2001
3 1
http://neighbourhood.statistics.gov.uk www.statistics.gov.ukRBKC Comminity Strategy 'Fact File' Work and Business
OBJ 3
Workless households population living in workless householdsa) Childrenb) Working age
No data available
Decrease in % of working age people in workless households from 17.1% in 1996 - 14.6% in 2003
Decrease in % of working age people in workless households from 13.3% in 1996 - 11.2% in 2003
Insufficient data to identify local trend 3 www.sustainable-
development.gov.uk
OBJ 3Economically inactive people of working age who are economically inactive
5.7% of working age economically inactive in 2001. Data not comparable
3.1% of working age economically inactive in 2001.
Insufficient data to identify local trend 2 2 http://neighbourhood.statistics.gov.u
k www.statistics.gov.uk
OBJ 3 Emplyment in key tourist sectors
OBJ 3 Working age population 131300Upwaards since 2001 (increase of 14.5%)
figures 1147101 RBKC Comminity Strategy 'Fact File'
Work and Business
OBJ 4 Index of multiple deprivation
21.49 [2004] (where 1 is the least deprived)- Ranked 116/354 local authorities. 21 of 103 in bottom 20% (20%), 3 in bottom 10 (3%).
1260 SOAs in London in bottom 20% most deprived
6496 of 32492 SOA in bottom 20% most deprived (20%)
[Data not readily available - likely data gap] No Local Trend Data Available 2
Local and county data is not directly comparable with regional data.
2
http://www.odpm.gov.uk/odpm/SOA/LASummaries2004.xls http://www.odpm.gov.uk/odpm/SOA/CountyCouncilSummaries2004.xlshttp://www.primary-care-db.org.uk/dbmenus/dep_indices2004.html
OBJ 4Proportion of children under 16 who live in low income households
Children - risk of living in households with less than 60 per cent of contemporarymedian household income: 32% [1999/00], 31% [2000/01], 30% [2001/02]
[Data not readily available - likely data gap] No local Trend Data Available Unclear 2
http://www.statistics.gov.uk/StatBase/Expodata/Spreadsheets/D7449.xls http://www.casa.ucl.ac.uk/2003/wealthofthenation.pdf - wealth of the nation 2004
OBJ 4 Benefit recipients
The number of Housing Benefit (HB) recipients increased during the quarter to May 2004 by just over 63 thousand (1.6%), a rise of 83 thousand (2.1%) in the year to stand at 3 9
[Data not readily available - likely data gap]
Levels of council tax benefit recipients dropped between 2002-2004. Trends for housing benefit recipients are not clear.
Unclear Local and Regional datasets are not directly comparable. 1 http://www.dwp.gov.uk/asd/hbctb.as
p
Objective 4. Encourage social inclusion, equity, the promotion of equality and a respect for diversity.
Data not readily available - likely data gap
Data not readily available - likely data gap
Increase in employment rate, increase employment rates of disadvantaged groups, and significantly reduce the difference between the employment rates of the disadvantaged groups and the overall rate
Under investigation
Data not readily available - likely data gap
Data not readily available - likely data gap
Data not readily available

Ref Indicator RBKC London UK Target Local trend Indicator status Commentary Data
quality Data sources
OBJ 4 Percentage of households in fuel poverty
31% of houses in council stock and 13% or private sector households are fuel poor
Data not readily available - likely data gap
21.8% [1996] 16.4% [2002]
Improving awareness of energy efficiency and tackling fuel poverty
No Local Trend Data Available 2
RBKC is currently over the % of council stock rated fuel poor (nearly double the UK level)
2 http://www.rbkc.gov.uk/Housing/General/0208housingstrategy.pdf
OBJ 4Number of households with no central heating
8863 (11.2%) [2001]63 / 376 E & W, 2/33 London 88% with, 12% without 88% with, 12% without No Target Identified No Local Trend Data
Available 1
data is unreliable (out of date) however, RBKC would appear to have similar levels as London and the UK as a whole
2
http://www.statistics.gov.uk/downloads/theme_compendia/FOL2003/04Housing.pdfhttp://www.statistics.gov.uk/census2001/profiles/29UP-A.asp
OBJ 4 Water affordability
OBJ 4 Demography population and population of working age
2001 - 158,922. 2004 - 174,400Working population in 2001 - 114,200
2001 - 7172036. Working population in 2001 - 1,978,600.
1996 - 57.8 million 2003 - 59.6 million Working population in 2001 in England - 30.5 million
NonePopulation increase of 10% over the past 3 years
No target 1 www.statistics.gov.uk
OBJ 4 Employment Deprivation 22 SOA in bottom 20% (21%), 6 in bottom 10% (6%) 1
http://www.alg.gov.uk/upload/public/attachments/322/RevisedbriefingforID2004.dochttp://www.odpm.gov.uk/stellent/groups/odpm_control/documents/contentservertemplate/odpm_index.hcst?n=4610&l=0
OBJ 4 Health Deprivation 7 SOA in bottom 20% (7%), 1 in bottom 10% (1%)
15 per cent of London SOAs fall within the 20 per cent most deprived nationally
Data not readily available - likely data
gap1
http://www.alg.gov.uk/upload/public/attachments/322/RevisedbriefingforID2004.dochttp://www.odpm.gov.uk/stellent/groups/odpm_control/documents/contentservertemplate/odpm_index.hcst?n=4610&l=1
OBJ 4Education , Skills and Training Deprivation 0 in bottom 20 or 10% 3 1
http://www.alg.gov.uk/upload/public/attachments/322/RevisedbriefingforID2004.dochttp://www.odpm.gov.uk/stellent/groups/odpm_control/documents/contentservertemplate/odpm_index.hcst?n=4610&l=2
OBJ 4Barriers to housing and Services
22 SOA in bottom 20% (21%), 1 in bottom 10% (1%)
52 per cent) are among the 20 per cent most deprived
1
http://www.alg.gov.uk/upload/public/attachments/322/RevisedbriefingforID2004.dochttp://www.odpm.gov.uk/stellent/groups/odpm_control/documents/contentservertemplate/odpm_index.hcst?n=4610&l=3
OBJ 4
Active community participation informal and formal volunteering at least once a month
No data available No data available
GB - 2001: 19% F and 12% M raising/collecting money, 11% F and 10% M organising/helping club/group, 9% F and 8% M serving on committees
Increase voluntary and community engagement, reduce race inequalities and build community cohesion
2 www.statistics.gov.uk
Data not readily available - likely data gap
Data not readily available - likely data gap
Data not readily available - likely data gap
Data not readily available - likely data gap

Ref Indicator RBKC London UK Target Local trend Indicator status Commentary Data
quality Data sources
OBJ 4
Childhood poverty children in relative low income householdsa) before housing costsb) after housing costs
% Children living in households whose gross income is below 60% of the median: 8%
25% of children living in low income households in 2002-3 before housing costs, 38% after housing costs
20% of children living in low income households in 2002-3 before housing costs, 29% after housing costs
Halve the number of children in relatively low-income households between 1998-99 and 2010-11, on the way to eradication of child poverty by 2020.
1
www.sustainable-development.gov.uk http://www.casa.ucl.ac.uk/2003/wealthofthenation.pdf
OBJ 4Young adults 16-19 year olds not in employment, education or training
No data available15.5% 16-24 year olds unemployed in London in 2002/3
12.1% under 19 year olds unemployed in the UK in January 2004. 12.2% 16-24 year olds unemployed in London in 2002/3
Reduce the proportion of young people not in education, employment or training by 2 percentage points by 2010
2 www.rbkc.gov.uk www.statistics.gov.uk
OBJ 4
Pensioner poverty pensioners in relative low income householdsa) before housing costsb) after housing costs
OBJ 4% of pupils achieving Level 4 or above in Key Stage 2 English
83.8 in 01/02 increased to 84.0 in 03/04 76.7 74.6 Marginal increase in the
3 years from 2001 - 2004 3 1 http://www.bvpi.gov.uk/pages/timecomparison.asp
OBJ 4% of pupils achieving 5 or more GCSEs at grades A* - C or equivalent
50.1 in 01/02 to 56.0 in 03/04 50 50.2 Increase of 5.9 in the 3 year period (12%) 2 1 http://www.bvpi.gov.uk/pages/timeco
mparison.asp
OBJ 4% of pupils achieving Level 4 or above in Key Stage 2 Maths
80.7 in 01/02 to 79.0 in 03/04 72 72.1
Slight decrease (1.7) in the three year period, although still above national and regional average
3 1 http://www.bvpi.gov.uk/pages/timecomparison.asp
OBJ 4% of pupils achieving one or more GCSEs at grade G or equivalent
93.3 in 01/02 to 87.0 in 2003/2004 87.3 87.6Shows a significant decrease in the three year period
2
Now at national average but shows a alarming trend downwards form 93.3% on 01/02
1 http://www.bvpi.gov.uk/pages/timecomparison.asp
OBJ 4% of secondary schools with 25% or more of their places unfilled
1 http://www.bvpi.gov.uk/pages/timecomparison.asp
OBJ 4
% of primary schools with 25% or more of their places unfilled 15.4 in 01/02 to 4.0 in 03/04 8.1 12.9
Significant drop in the three year period meaning less vacant places at schools
3 1 http://www.bvpi.gov.uk/pages/timecomparison.asp
OBJ 4 Sustainable Development education
OBJ 5Energy use (gas and electricity)
OBJ 5 Energy use per household
Data not readily available - likely data gap
Data not readily available - likely data gap
Data not readily available - likely data gap
Objective 5. Minimise effects on climate change through reduction in emissions, energy efficiency and use of renewables.
No data
Data not readily available - likely data gap

Ref Indicator RBKC London UK Target Local trend Indicator status Commentary Data
quality Data sources
OBJ 5 CO2 emissions Data not readily available - likely data gap
London - 8m tonnes of carbon, 1100kg carbon /
head
England- Total emissions (million tonnes carbon)- 114 [2001] Emissions per head (kg carbon)-2300[2001]
Improve the environment and the sustainable use of natural resources, including reducing greenhouse gas emissions by 12.5 per cent from 1990 levels by 2008-12 and moving towards a 20 per cent reduction in CO2 emissions by 2010.
No local trend although generally the emissions
of substances that cause climate change have
been decreasing since 1990
2
http://www.naei.org.uk/ http://www.sustainable-development.gov.uk/indicators/regional/2003/index.htm
OBJ 5 Embodied energy in new buildings
OBJ 5Average energy efficiency of buildings
OBJ 5% Developments with sustainable urban drainage systems
OBJ 5 Total vehicle kilometresOBJ 5 no / % roads in floodplainOBJ 5 No. heat / cold deathsOBJ 5 no. cases of subsidence
OBJ 5 river flows and river quality
OBJ 5 cost of flooding
OBJ 5Greenhouse Gas Emissions Kyoto target and CO2 emissions
No data available No data available
Between 1990 and 2002, total UK greenhouse gas emissions declined 10 per cent.
3 http://www.statistics.gov.uk/
OBJ 5CO2 Emissions by end user industry, domestic, transport (excluding international aviation
No data available No data availableBetween 1990 and 2002, total UK CO2 emissions declined 3 per cent.
3 http://www.statistics.gov.uk/
OBJ 5
Aviation and shipping emissions green house gases from UK-based international aviation and shipping fuel bunkers
In 1999, aircraft released 600million tonnes CO2 into the atmosphere. Between 1990 - 2002, emissions of GHG emissions arising from air and water transport rose by 65%
http://www.statistics.gov.uk/
OBJ 5Renewable electricity renewable energy generated as a percentage of total energy
No data available
Between 1989 - 1999, London's energy consumption rose from 140-155 TWh. Between 1990 - 2000, electricity generated by hydro & other increased from 3-4% of total electricity generation in London
3% of the UK’s electricity was generated from renewable sources at the beginning of 2004
No data available 3http://www.statistics.gov.uk/, Mayor of London's Energy Strategy Feb 2004
OBJ 5
Electricity generation electricity generated, CO2, NOx, and SO2 emissions by electricity generators and GDP
No data available No data available
Between 1990 and 2002, total UK greenhouse gas emissions from electricity, gas and water supply declined by 17 per cent.
No data available 3 http://www.statistics.gov.uk/
Data not readily available - likely data gap
Data not readily available - likely data gap
Data not readily available - likely data gap
Data not readily available - likely data gap
Data not readily available - likely data gap
Data not readily available - likely data gap
Data not readily available - likely data gap
Data not readily available - likely data gap Data not readily available - likely data gap
To reduce greenhouse gas emissions to 12.5% below 1990 levels in line with our Kyoto commitment and move towards a 20% reduction in carbon dioxide emissions below 1990 levels by 2010, through measures including energy efficiency and renewables. In order for the UK to play its part in reducing carbon dioxide emissions, the Government has set an aspirational target of reducing these emissions, compared with 1990 levels, by 60% by 2050. London’s renewable energy targets aim to generate at least 665GWh of electricity and 280GWh of heat, from up to 40,000 renewable energy schemes by 2010. London Plan requires 10 of energy in new developments to be sourced from on site renewable energy sources.
To reduce greenhouse gas emissions to 12.5% below1990 levels in line with our Kyoto commitment and move towards a 20% reduction in carbon dioxide emissions below 1990 levels by 2010, through measures including energy efficiency and renewables
Data not readily available - likely data gap
Data not readily available - likely data gap

Ref Indicator RBKC London UK Target Local trend Indicator status Commentary Data
quality Data sources
OBJ 5
Household energy use domestic CO2 emissions and household final consumption expenditure
No data available
Between 1991 - 1999, emissions of CO2 arising from domestic energy consumption increased from 38-44% of the total CO2 emissions in London.
Between 1990-2000, emissions of CO2 arising from the domestic energy consumption sector in the UK increased by 9%, with an increase in domestic energy consumption in the same period by 14.5%
3http://www.statistics.gov.uk/, Mayor of London's Energy Strategy Feb 2004 www.dti.gov.uk
OBJ 5Energy Supply UK Primary energy supply and gross inland energy consumption
OBJ 6 % of people protected from flooding 2586 'Buildings' in floodplain
Likely to be on the increase due to pressure from Climatic Factors
1 Environemnt Agency indicative Floodplians 2005 and RBKC
OBJ 6 Number of dwellings within indicative floodplain 2586 'Buildings' in floodplain
Likely to be on the increase due to pressure from Climatic Factors
1 Environemnt Agency indicative Floodplians 2005 and RBKC
Riverside development in the site allocation DPD, where the defences have not been proven to have at least the same life expectancy as the development and where a significant set back for access is not achieved.
Percentage of developments that provide a FRA, and provide flood mitigation methods where appropriate
OBJ 7
Ecological impacts of air pollution area of UK habitat sensitive to acidification and eutrophication with critical load exceedences
OBJ 7Manufacturing sector CO2, NOx, SO2 PM10 Emissions and GVA
Between 1990-2002, GHG emissions arising from the manufacturing sector decreased by 30%
http://www.statistics.gov.uk/
OBJ 7 Service Sector CO, NOx Emissions and GVA
OBJ 7 Public sector CO2, NOx, Emissions and GVA
Data not readily available - likely data gap Data not readily available - likely data gapData not readily available - likely data gap
Data not readily available - likely data gap
Data not readily availabale - likely data gap
Data not readily available - likely data gap
Objective 7. Improve air quality in the Royal Borough.
Objective 6. Reduce the risk of flooding to current and future residents
Under investigation
Under investigation
Data not readily availabale - likely data gap
Data not readily available - likely data gap
Data not readily available - likely data gap
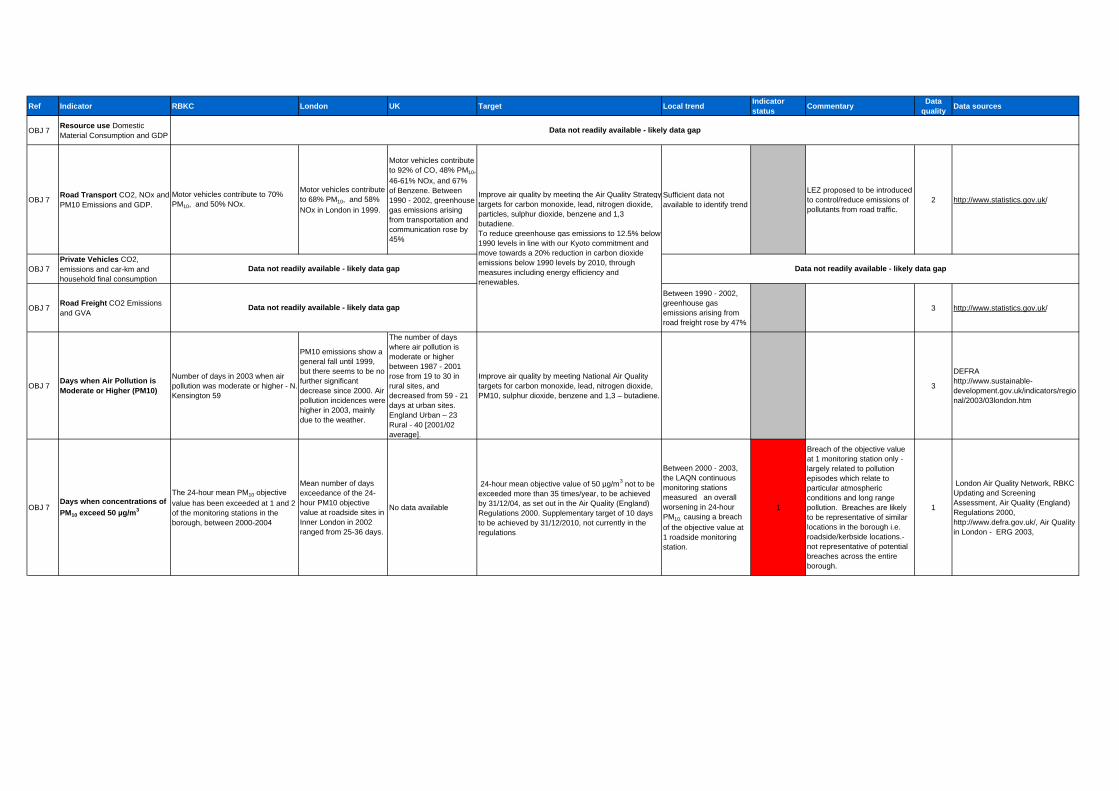
Ref Indicator RBKC London UK Target Local trend Indicator status Commentary Data
quality Data sources
OBJ 7 Resource use Domestic Material Consumption and GDP
OBJ 7 Road Transport CO2, NOx and PM10 Emissions and GDP.
Motor vehicles contribute to 70% PM10, and 50% NOx.
Motor vehicles contribute to 68% PM10, and 58% NOx in London in 1999.
Motor vehicles contribute to 92% of CO, 48% PM10, 46-61% NOx, and 67% of Benzene. Between 1990 - 2002, greenhouse gas emissions arising from transportation and communication rose by 45%
Sufficient data not available to identify trend
LEZ proposed to be introduced to control/reduce emissions of pollutants from road traffic.
2 http://www.statistics.gov.uk/
OBJ 7Private Vehicles CO2, emissions and car-km and household final consumption
OBJ 7 Road Freight CO2 Emissions and GVA
Between 1990 - 2002, greenhouse gas emissions arising from road freight rose by 47%
3 http://www.statistics.gov.uk/
OBJ 7Days when Air Pollution is Moderate or Higher (PM10)
Number of days in 2003 when air pollution was moderate or higher - N. Kensington 59
PM10 emissions show a general fall until 1999, but there seems to be no further significant decrease since 2000. Air pollution incidences were higher in 2003, mainly due to the weather.
The number of days where air pollution is moderate or higher between 1987 - 2001 rose from 19 to 30 in rural sites, and decreased from 59 - 21 days at urban sites. England Urban – 23 Rural - 40 [2001/02 average].
Improve air quality by meeting National Air Quality targets for carbon monoxide, lead, nitrogen dioxide, PM10, sulphur dioxide, benzene and 1,3 – butadiene.
3
DEFRA http://www.sustainable-development.gov.uk/indicators/regional/2003/03london.htm
OBJ 7Days when concentrations of PM10 exceed 50 µg/m3
The 24-hour mean PM10 objective value has been exceeded at 1 and 2 of the monitoring stations in the borough, between 2000-2004
Mean number of days exceedance of the 24-hour PM10 objective value at roadside sites in Inner London in 2002 ranged from 25-36 days.
No data available
24-hour mean objective value of 50 µg/m3 not to be exceeded more than 35 times/year, to be achieved by 31/12/04, as set out in the Air Quality (England) Regulations 2000. Supplementary target of 10 days to be achieved by 31/12/2010, not currently in the regulations
Between 2000 - 2003, the LAQN continuous monitoring stations measured an overall worsening in 24-hour PM10, causing a breach of the objective value at 1 roadside monitoring station.
1
Breach of the objective value at 1 monitoring station only - largely related to pollution episodes which relate to particular atmospheric conditions and long range pollution. Breaches are likely to be representative of similar locations in the borough i.e. roadside/kerbside locations.- not representative of potential breaches across the entire borough.
1
London Air Quality Network, RBKC Updating and Screening Assessment, Air Quality (England) Regulations 2000, http://www.defra.gov.uk/, Air Quality in London - ERG 2003,
Data not readily available - likely data gap
Improve air quality by meeting the Air Quality Strategy targets for carbon monoxide, lead, nitrogen dioxide, particles, sulphur dioxide, benzene and 1,3 butadiene.To reduce greenhouse gas emissions to 12.5% below 1990 levels in line with our Kyoto commitment and move towards a 20% reduction in carbon dioxide emissions below 1990 levels by 2010, through measures including energy efficiency and renewables.
Data not readily available - likely data gap
Data not readily available - likely data gap Data not readily available - likely data gap

Ref Indicator RBKC London UK Target Local trend Indicator status Commentary Data
quality Data sources
OBJ 7Annual mean PM10
concentrations
One (kerbside) of the borough's three particulate monitoring sites exceeded the 2004 objective in 2003.
The annual mean PM10 objective level at kerbside and roadside sites in London in 2002 ranged from 32 - 42 µg/m3
No data available
Annual mean objective value of 40 µg/m3, to be achieved by 31/12/04, as set out in the Air Quality (England) Regulations 2001. Supplementary target of 23 µg/m3 to be achieved by 31/12/2010, not currently in the regulations.
Between 2000 - 2003, the LAQN continuous monitoring stations measured an overall worsening in annual mean PM10.
1
Annual mean levels at background stations show that levels have declined overall in 10 years and remain below the 2004 objective. Levels at the borough's roadside location have fluctuated just below the objective level since 1998. All areas are potentially at risk of exceeding the 2010 objective.
1
London Air Quality Network, RBKC Updating and Screening Assessment, Air Quality (England) Regulations 2000 (H.M. Government, 2000), http://www.defra.gov.uk/, Air Quality in London - ERG 2003, RBKC Local Air Quality Management Progress Report 2005
OBJ 7Annual mean NO2
concentrations
The annual mean NO2 objective value has been exceeded at a number of continuous monitoring stations around the borough, between 2000-2003
Annual mean NO2
objective value at Inner London Roadside sites in 2002 was between 65 - 70 µg/m3. 56 out of 77 (73%) London based monitoring stations (R, K & B) breached the objective value in 2001.
Outside of London, 110 out of 347 (32%) monitoring stations (R,K & B) breached the objective value in 2001.
Annual mean objective value of 40 µg/m3, to be achieved by 31/12/05, as set out in the Air Quality (England) Regulations 2002.
Between 2000 - 2003, three out of the four LAQN continuous monitoring stations measured an overall worsening in annual mean NO2.
1
Annual mean levels of NO2 remain above the objective level across the majority of the borough. Though reductions have been seen at background locations, trends at roadside locations are more variable. Levels are likely to remain above the objective level at many locations for some time.
1
London Air Quality Network, RBKC Updating and Screening Assessment, Air Quality (England) Regulations 2000 (H.M. Government, 2000), http://www.defra.gov.uk/, Air Quality in London - ERG 2003, Nitrogen Dioxide in the UK - Air Quality Expert Group 2004.RBKC Local Air Quality Management Progress Report 2005
OBJ 7No of times 1-hour concentration of NO2 exceed 200 µg/m3
The 1-hour mean NO2 objective value has been exceeded at a number of continuous monitoring stations around the borough, between 2000-2003
6 out of the 14 LAQN road/kerb side sites in London monitoring 1-hour mean NO2
concentrations breached the objective value. 6 out of 77 (8%) London based monitoring stations (R, K & B) breached the objective value in 2001.
Outside of London, 20 out of 347 (6%) monitoring stations (R, K & B) breached the objective value in 2001.
1-hour mean objective value of 200 µg/m3 not to be exceeded more than 18 times a year to be achieved by 31/12/05, as set out in the Air Quality (England) Regulations 2002.
Between 2000 - 2003, two roadside stations measured an overall worsening in the 1-hour mean NO2 objective value, with another roadside station and a background station recording an overall improvement.
2 1
London Air Quality Network, RBKC Updating and Screening Assessment, Air Quality (England) Regulations 2000 (H.M. Government, 2000), http://www.defra.gov.uk/, Air Quality in London - ERG 2003, Nitrogen Dioxide in the UK - Air Quality Expert Group 2004.RBKC Local Air Quality Management Progress Report 2005
OBJ 7Designated Air Quality Management Area/s and Air Quality Action Plan
Whole borough designated as AQMA for PM10 and NO2
The majority of London Boroughs (30) have declared an AQMA.
122 local authorities across the UK have declared AQMAs. None declared in the northeast.
Where the UK National Air Quality Strategy objective values are predicted not to be met, the Local Authority must declare an Air Quality Management Area and produce an Air Quality Action Plan to improve the air quality in these areas.
N/A 3 AQAP produced. 1
RBKC Updating and Screening Assessment, UK National Air Quality Strategy (DETR, 2000), http://www.uwe.ac.uk/aqm/centre/aqmas/mstats.htmlRBKC Local Air Quality Management Progress Report 2005
OBJ 7 Emissions reduction from Bourgh fleets
OBJ 7 Adoption of Green travel plans in schools
OBJ 7Number of (car park) permit free developments in the borough
OBJ 8Open space per resident ha / resident
RBKC as the second lowest proportion of open space to total land area in London (2.8%). 0.26 ha / 1000 population, lowest in London
11.10% Not Applicable None
The development at Kensal Gas Works and others have eliminated open space. Additionally, much open space is in private ownership.
1
There is a need to create robust policy and establish creative methods of promoting existing open space, enhancing existing open space and creating new open space.
1
UDPThe Royal Borough of Kensington and Chelsea Local Biodiversity Action Plan (2004)
Under investigation
Objective 8. Protect and enhance the Royal Borough’s parks and open spaces.
Under investigation
Under investigation

Ref Indicator RBKC London UK Target Local trend Indicator status Commentary Data
quality Data sources
OBJ 9
Water Resource use total abstractions from non-tidal surface and ground water sources and GDP
No data available - groundwater protection zones No data available
Increase from 42700 megalitres/day in 1971 - 43100 megalitres/day in 2001, in England and Wales.
Water Framework Directive No data available
Direct abstraction from groundwater and non-tidal waters amounted to nearly 9.6 billion cubic metres in the UK in 1997/98.
3 www.statistics.gov.uk
OBJ 9 Domestic water consumption per head No data available
Increase in domestic water consumption from 310 litres per head per day in 98/99 - 321 litres per head per day in 00/01.
3.3 billion cubic metres (20% of total UK consumption) were used by households in 1997/98.
No data available 2 Awaiting data 3 http://www.statistics.gov.uk/
OBJ 9 Water stress No data available Awaiting Data
21% of the UK (1961-1990 (avg.)) under severe water stress. No data available 2
To be developed. Leakage rate of almost 40% makes up more than a quarter of all water lost in England and Wales.
3 www.themovechannel.com www.nationmaster.com
OBJ 9 River quality rivers of good Biological and Chemical quality No data available
From 1995 - 2003, Thames increase from 90.3-94.3% river quality compliance
E&W: From 1995 - 2003, increase from 86.1-89.4% river quality compliance
Improved river quality, as measured by compliance with River Quality Objectives
Improvement in River Water Quality over an 8 year period
3 1 Environment Agency
OBJ 9 Public concern over noise [ No Data Found ] [ No Data Found ]
Noise complaints received by Environmental Health Officers1, rates per million population- 3644 [1990/91] , 7142 [2000/01], 7670 [2001/02]
Directive 97/24/EC (PDF, 345kb) which limits noise from two and three wheeled vehicles. Directive 2000/14/EC (PDF, 751kb) sets out provisions on noise from 57 types of outdoor equipment.
No local trend data available 1 1 RBKC
OBJ 9a
Land Recycling a) New dwellings built on previously developed land;b) all new development on previously used land
100% 98.00% 70% 60% National Headline Target
The level has been at 100% for the last 4 years and looks likely to continue
3 2 http://www.bvpi.gov.uk/pages/timecomparison.asp
OBJ 10
Mobility a) Number of trips per person by modeb) distance travelled per person per year by broad trip purpose.
Car 79.4% Cycle 0.9% M/C 1.1% Bus 1.1% HGV 5.8% LGV 11.7%
No local trend data available
OBJ 10 Travel to work by car 18.3% Ranked 371 / 376 in E&W, 28 out of 33 in London
Data not readily available - likely data gap 61.50% No local trend data
available 3
RBKC compares favourably with E & W and with other London boroughs in terms of rank.
1 http://www.statistics.gov.uk/census2001/profiles/00AW-A.asp
Objective 9a. Prioritse development on previosul developed land
Objective 10. To promote traffic reduction and encourage more sustainable alternative forms of transport to reduce energy consumption and emissions from vehicular traffic.
Objective 9. Reduce pollution of air, water and land.
Data not readily available - likely data gap

Ref Indicator RBKC London UK Target Local trend Indicator status Commentary Data
quality Data sources
OBJ 10 Travel to work by public transport
48.1% Ranked 12 / 376 in E&W, 12 / 33 in London
Data not readily available - likely data gap 14.50% No local trend data
available 3
RBKC compares favourably with E & W and with other London boroughs in terms of rank.
1 http://www.statistics.gov.uk/census2001/profiles/00AW-A.asp
OBJ 10 Households without car/van 50.4% Ranked 9 / 376 in E&W, 9/33 in London
Data not readily available - likely data gap 26.80% No local trend data
available 3
RBKC compares favourably with E & W and with other London boroughs in terms of rank.
1 http://www.statistics.gov.uk/census2001/profiles/00AW-A.asp
OBJ 10 Households with 1 car or more
39.2% Ranked 354 / 376 in E&W, 25/33 in London
Data not readily available - likely data gap 43.80% No local trend data
available 3
RBKC compares favourably with E & W and with other London boroughs in terms of rank.
1 http://www.statistics.gov.uk/census2001/profiles/00AW-A.asp
OBJ 10 Households with 2 or more cars/vans
10.4% Ranked 367 / 376 in E&W, 24/33 in London
Data not readily available - likely data gap 29.40% No local trend data
available 3
RBKC compares favourably with E & W and with other London boroughs in terms of rank.
1 http://www.statistics.gov.uk/census2001/profiles/00AW-A.asp
OBJ 10 Getting to school how children get to school No data available
1999-2001: 50% walk, 22% car, 20% bus and 8% other
England - 1999-2001: 48% walk, 30% car, 18% bus and 5% other
Not sufficient data to identify local trend 3
RBKC compares favourably with E & W and with other London boroughs in terms of rank.
2 www.statictics.gov.uk
OBJ 10Road Accidents number of people and children killed or seriously injured
1991 - 1240 road traffic accident casualties, decreasing to 1160 in 1999.
In 2002, 71 fatal and serious accidents on roads per 100,000 population
In 2002, 59 fatal and serious accidents on roads per 100,000 population
Reduce the number of people killed or seriously injured in Great Britain in road accidents by 40% and the number of children killed or seriously injured by 50%,by 2010 compared with the average for 1994-98,tackling the significantly higher incidence in disadvantaged communities
Decrease in road traffic accident casualties by 6.5% between 1991-1999.
3 1 www.rbkc.gov.uk www.statistics.gov.uk
OBJ 10 Traffic congestion
OBJ 10 Heavy goods vehicles
OBJ 10Leisure trips by mode of transport
OBJ 10Monetary investment in public transport, walking and cycling
OBJ 11 BV82a Household waste - percentage recycled 16.13 11.70 13.20
Enable at least 25% of household waste to be recycled or composted by 2005-06, with further improvements by 2008
The % recycled has doubled since 2001-2002 (8% to 16.1% in 2003 - 2004)
2 1 http://www.bvpi.gov.uk/pages/keyFacts_BVPI.asp?lastpage=1&aid=9
Data not readily available - likely data gap
Objective 11. Reduce the amount of waste produced and maximise the amount of waste that is recycled.
By 2010, increase the use of public transport (bus and light rail) by more than 12% in England compared with2000 levels, with growth in every region
Data not readily available - likely data gap
Data not readily available - likely data gap
Data not readily available - likely data gap

Ref Indicator RBKC London UK Target Local trend Indicator status Commentary Data
quality Data sources
OBJ 11BV82b Household waste - percentage composted 0.34 2.1 4 N / A
The % has increased from 0.1 to 0.3 although does not compare favourably with the figures for London (Avg by Auth Type). Additionally, the % dropped in the last year by 0.1%
2 2 http://www.bvpi.gov.uk/pages/keyFacts_BVPI.asp?lastpage=1&aid=9
OBJ 11 BV82c Household waste - percentage of heat
OBJ 11 BV82d Household waste - percentage landfilled
OBJ 11 BV84 Kg of household waste collected per head 358.5 454.2 438.7 N / A
The net amount is still higher than the 2001 -/ 2002 base year although there was a 17.7% reduction in the kg waste per person produced in 2003 / 2004
2 2 http://www.bvpi.gov.uk/pages/keyFacts_BVPI.asp?lastpage=1&aid=9
OBJ 11BV86 Cost of waste collection per household £47.02 £46.50 £38.90 N / A
The cost of the disposal of waste has increased by £1.70 since 2001 / 2002 to £47.00 in 2003-2004.
1 2 http://www.bvpi.gov.uk/pages/keyFacts_BVPI.asp?lastpage=1&aid=9
OBJ 11BV87 Cost of waste disposal per tonne for municipal waste
OBJ 11BV91 % of pop. served by kerbside collection or within 1km of recycling centre
99.7 81.10% 86.2 N / A
% has increased since 2002 / 2003, previously there was a drop in 2001 -2002
3 2 http://www.bvpi.gov.uk/pages/keyFacts_BVPI.asp?lastpage=1&aid=9
OBJ 12Social investment as per cent of GDP
OBJ 12Real changes in the cost of transport
OBJ 12Distance travelled relative to income
OBJ 12% of local authority buildings suitable for and accessible by disabled people
17.2, 03/04 up from 14.0 in 02/03 [ No Data Found ] [ No Data Found ] [ No Data Found ]
% of local authority buildings suitable for and accessible by disabled people, increased between 2002-2004
3 1 http://www.bvpi.gov.uk/pages/timecomparison.asp
OBJ 12 Sports centres 5 sports centres 219 sports halls in London in 2003. No data available [ No Data Found ] Insufficient data to
identify local trend 2 www.rbkc.gov.uk
Data not readily available - likely data gap
Objective 12. Ensure that social and community uses and facilities which serve a local need are enhanced, protected, and to encourage the provision of new community facilities.
Data not readily available - likely data gap
Data not readily available - likely data gap
Data not readily available - likely data gap
Data not readily available - likely data gap
Data not readily available - likely data gap
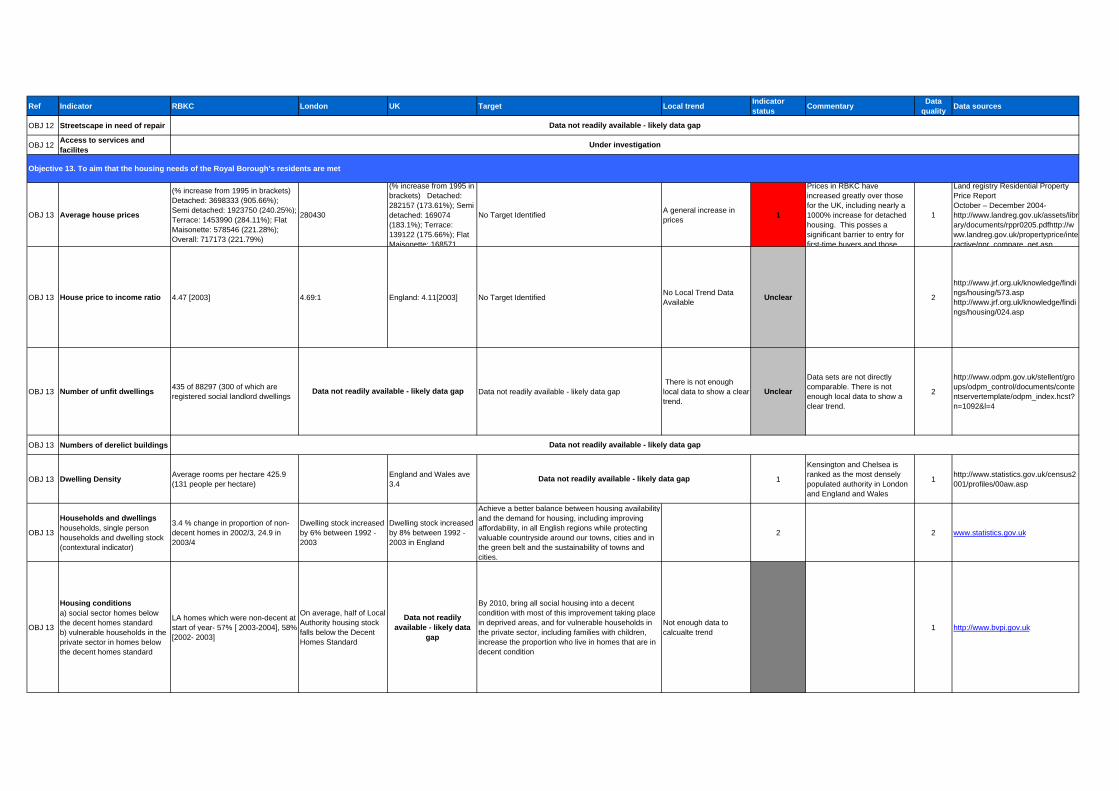
Ref Indicator RBKC London UK Target Local trend Indicator status Commentary Data
quality Data sources
OBJ 12 Streetscape in need of repair
OBJ 12 Access to services and facilites
OBJ 13 Average house prices
(% increase from 1995 in brackets) Detached: 3698333 (905.66%); Semi detached: 1923750 (240.25%); Terrace: 1453990 (284.11%); Flat Maisonette: 578546 (221.28%); Overall: 717173 (221.79%)
280430
(% increase from 1995 in brackets) Detached: 282157 (173.61%); Semi detached: 169074 (183.1%); Terrace: 139122 (175.66%); Flat Maisonette: 168571
No Target Identified A general increase in prices 1
Prices in RBKC have increased greatly over those for the UK, including nearly a 1000% increase for detached housing. This posses a significant barrier to entry for first-time buyers and those
1
Land registry Residential Property Price ReportOctober – December 2004- http://www.landreg.gov.uk/assets/library/documents/rppr0205.pdfhttp://www.landreg.gov.uk/propertyprice/interactive/ppr compare get.asp.
OBJ 13 House price to income ratio 4.47 [2003] 4.69:1 England: 4.11[2003] No Target Identified No Local Trend Data Available Unclear 2
http://www.jrf.org.uk/knowledge/findings/housing/573.asp http://www.jrf.org.uk/knowledge/findings/housing/024.asp
OBJ 13 Number of unfit dwellings 435 of 88297 (300 of which are registered social landlord dwellings Data not readily available - likely data gap
There is not enough local data to show a clear trend.
Unclear
Data sets are not directly comparable. There is not enough local data to show a clear trend.
2
http://www.odpm.gov.uk/stellent/groups/odpm_control/documents/contentservertemplate/odpm_index.hcst?n=1092&l=4
OBJ 13 Numbers of derelict buildings
OBJ 13 Dwelling Density Average rooms per hectare 425.9 (131 people per hectare)
England and Wales ave 3.4 1
Kensington and Chelsea is ranked as the most densely populated authority in London and England and Wales
1 http://www.statistics.gov.uk/census2001/profiles/00aw.asp
OBJ 13
Households and dwellings households, single person households and dwelling stock (contextural indicator)
3.4 % change in proportion of non-decent homes in 2002/3, 24.9 in 2003/4
Dwelling stock increased by 6% between 1992 - 2003
Dwelling stock increased by 8% between 1992 - 2003 in England
Achieve a better balance between housing availability and the demand for housing, including improving affordability, in all English regions while protecting valuable countryside around our towns, cities and in the green belt and the sustainability of towns and cities.
2 2 www.statistics.gov.uk
OBJ 13
Housing conditionsa) social sector homes below the decent homes standardb) vulnerable households in the private sector in homes below the decent homes standard
LA homes which were non-decent at start of year- 57% [ 2003-2004], 58% [2002- 2003]
On average, half of Local Authority housing stock falls below the Decent Homes Standard
Data not readily available - likely data
gap
By 2010, bring all social housing into a decent condition with most of this improvement taking place in deprived areas, and for vulnerable households in the private sector, including families with children, increase the proportion who live in homes that are in decent condition
Not enough data to calcualte trend 1 http://www.bvpi.gov.uk
Under investigation
Data not readily available - likely data gap
Data not readily available - likely data gap
Data not readily available - likely data gap
Objective 13. To aim that the housing needs of the Royal Borough’s residents are met
Data not readily available - likely data gap

Ref Indicator RBKC London UK Target Local trend Indicator status Commentary Data
quality Data sources
OBJ 13
Households living in fuel poverty a) pensionersb) households with childrenc) disabled / long-term sick.
31 % of the Council's Housing Stock and 13% of private sector households are fuel poor.
Eliminate fuel poverty in vulnerable households in England by 2010 in line with the Government’s Fuel Poverty Strategy objective
2
The nature of the housing stock in Kensington and Chelsea provides a challenge to meeting energy efficiency targets. Many properties lack cavity walls or loft space for insulation and many have unsuitable heating systems. Also 70% of dwellings fall within designated conservation areas and some have listed building status.
1
Housing Strategy 2003-2008http://www.rbkc.gov.uk/Housing/General/0208housingstrategy.pdf
OBJ 13
Homelessness a) rough sleepersb) households in temporary accommodationi) totalii) households with children
a) 10 b) I) 916 in 2000/2001, 965 in 2003/2004 ii) 457 in 2000/20001, 629 in 2003/2004 Total number ofunits of accommodation for the homeless- 3788 [2002]
There has been an upward trend in the
amount of homeless in the borough from
2000/2001
1 2
http://www.rbkc.gov.uk/Housing/general/homelessness_strategy0307.pdf http://www.odpm.gov.uk/stellent/groups/odpm_control/documents/contentservertemplate/odpm_index.hcst?n=1092&l=4
OBJ 13 Change in proportion on non-decent homes 24.9 03/04 up from 3.4 in 02/03 Increased 86.3%
between 02 -04 1 1 http://www.bvpi.gov.uk/pages/timecomparison.asp
OBJ 14
Percentage of new build and retrofit homes meeting EcoHomes Very Good standard
OBJ 14Percentage of commercial buildings meeting BREEAM Very Good standard
OBJ 14SAP Ratings of council's housing stock 61 No data available 43 120 is the highest rating of efficiency. Target for
2005/2006 is 66.
This indicator has been rising to meet targets since 1999-2000.
3 1 http://www.rbkc.gov.uk/howweperform/bestvalue/bvpp.asp#audit
OBJ 15
Long-term illness, health problem or disability which limits people's daily activities or the work they could do
13.6% [2001] Data not readily available - likely data gap 18.20% No Target Identified No Local Trend Data
Available 3 Compares well with England and Wales 2 http://www.statistics.gov.uk/census2
001/profiles/29.asp#housing
OBJ 15 Access to a GP 1013 Pop / GP 63.94 56.42 No Target Identified No Local Trend Data Available 3 Data may not show current
position. 3
PROFILE OF UK GENERAL PRACTITIONERSJUNE 2004 at http://www.rcgp.org.uk/information/publications/information/PDFInfo/01JUN04.pdf The Guardian 02/02/05 http://neighbourhood.statistics.gov.u
Objective 15. Ensure the provision of accessible health care for all Borough residents.
Data not readily available - likely data gap
Data not readily available - likely data gap
Data not readily available - likely data gap
Data not readily available - likely data gap
Objective 14. Encourage energy efficiency through building’s and the recycling of building materials

Ref Indicator RBKC London UK Target Local trend Indicator status Commentary Data
quality Data sources
OBJ 15
Health inequality a) infant mortality by (socio-economic group)b) life expectancy (by area) for men and women
Male Life expectancy at birth: 76.6 [1997-1999], 77.3 [1998-2000], 78.1[1999-2001], 79.0[2000-2002], 79.8 [2001-2003] female Life expectancy at birth: 81.6 [1997-1999], 82.3 [1998-2000], 82.9 [1999-2001], 84.1 [2000-2002], 84.80 [2001-2003]
Males- 73.37 [1991-93],75.89 [2001-03] , Female- 78.86 [1991-93], 80.47 [2001-03]
Reduce health inequalities by 10% by 2010 as measured by infant mortality and life expectancy at birth
Both lifer expectancy for men and women has been increasing since 1999. Also, in comparison to the UK, life expectancy for men and women compares favourably, being almost 5 years more than the average.
3 1
http://www.statistics.gov.uk/downloads/theme_population/LEResultsE&W24Feb2005.xls"Office of National Statistics 2004- http://www.statistics.gov.uk/statbase/Product.asp?vlnk=8841http://www.sustainable-development.gov.uk/indicators/regional/download/rqolc2003.pdf"
OBJ 15 General Health Good, Family Good, Not good
75.2% Good17.3% Fairly Good7.5% Not good
68% Good22.2% Fairly good9.2% Not Good
No trend data 3
Compares favourably with the UK as a whole. For a central London Borough this performance could be seen as good
2
http://neighbourhood.statistics.gov.uk/areaprofileframes.asp?T=A&AID=175500&TID=13&AREA=kensington%20and%20chelsea
OBJ 15 Population per GP 1013 3 The Guardian 02/02/05 Page 7
OBJ 15
Mortality rates death rates froma) Circulatory diseaseb) Cancer, below 75 years and for areas with the worst health and deprivation indicators;c) suicides
Directly Standardised Rate- Cancer- 170.06 , Circulatory- 204.86 [1999 AND 2001 POOLED]
Directly Standardised Rate: Cancer-190.73, Circulatory- 255.13 [1999 AND 2001 POOLED]
Death Rate Per 1000 [2000] - 10.2 Standardised Mortality Ratio [2000] - 100 Standardised Mortality Rates per 100,000 [2002]: Circulatory diseases- 335(m), 383(F) Respiratory diseases-103(M),133(F)Cancer 247(M), 239(F)Injury and poisoning 40(M), 22(F)Other causes-138(M),210(F)
Reduce mortality rates by 2010:from heart disease and stroke and related diseases by at least 40% in people under 75, with at least a 40%reduction in the inequalities gap between the fifth of areas with the worst health and deprivation indicators and the population as a whole;from cancer by at least 20% in people under 75, with reduction in the inequalities gap of at least 6%between the fifth of areas with the worst health and deprivation indicators and the population as a whole; andfrom suicide and undetermined injury by at least 20%
No trend data as pooled results. 1
www.statistics.gov.uk http://www.lho.org.uk/DataAndMethods/Attachments/Excel_Files/Compendium02/IA11_All_cancers/11A_Mortality_from_all_cancers/11A_075drp1_02_London.xls http://www.lho.org.uk/DataAndMethods/Attachments/Excel_Files/Compendium02/JA06_All_circulatory_diseases/06A_Mortality_from_all_circulatory_diseases/06A_076drp1_02_London.xls
OBJ 15
Smoking prevalence of smokinga) All adultsb) 'Routine and manual' socio-economic groups.
17% of deaths smoking related in 2001. 30% of people in the borough smokers in 2004.
29% men and 26% women smoke. 18% of deaths smoking related in 2001.
27% adults smoking between 1998-2001
Reducing adult smoking rates to 21% or less by 2010,with a reduction in prevalence among routine and manual groups to 26% or less
No trend data. 3
Compares well with London and UK comparison, being lower than both. Although there is a higher percentage that actually smoke.
2 www.rbkc.gov.uk
OBJ 15 Childhood obesity prevalence of obesity in 2-10 year-olds. No data available No data available
Estimated that 15% of children are obese in the UK
Halting the year-on-year rise in obesity among children under 11 by 2010 in the context of a broader strategy to tackle obesity in the population as a whole.
No trend data. 2 www.bupa.co.uk
OBJ 16 Conservation Areas number and percentage of borough.
Townscape conservation areas lie within the 35 designated conservation areas which cover 70% of the borough.
Insufficient data to identify local trend
RBKC compares well with the rest of London and 2 www.rbkc.gov.uk
OBJ 16 Number and condition of listed buildings
26 Grade I296 Grade II*3875 Grade II6 Unknown4203 TotalBAR Register: 7
Total Number of Listed Buildings- 18,059 [2002], 588 buildings on the BAR register [2005] (approximate percentage - 3%)
1830 buildings on the BAR register
Remove 40% of the entries on the 1999 'at risk' list [2006] (Target: South East Integrated Regional Framework (2004))
Not sufficient data to identify local trend 2 3
RBKC UDP 2002http://www.english-heritage.org.uk/default.asp?wci=mainframe&URL1=default.asp%3FWCI%3DNode%26WCE%3D6744
OBJ 16
Number of conservation areas and those that do not have Conservation Area Proposals Statements
Currently 36 Conservation Areas covering approx 70% of the Borough. 4 do not have CAPs
3 RBKC UDP 2002
Data not readily available - likely data gap
The location of conservation and other items of cultural heritage are not in the control of the LPA therefore monitoring
Objective 16. To reinforce local distinctiveness, local environmental quality and amenity through the conservation and enhancement of cultural heritage.
No data available

Ref Indicator RBKC London UK Target Local trend Indicator status Commentary Data
quality Data sources
OBJ 16 Number and condition of SAMs
2 - the Brick Kiln in Walmer Road and Kensington PalaceBAR Register: 0
150 scheduled monuments 7 scheduled monuments on the BAR register
456 scheduled monuments on the BAR register
3
RBKC UDP 2002http://www.english-heritage.org.uk/default.asp?wci=mainframe&URL1=default.asp%3FWCI%3DNode%26WCE%3D6744
OBJ 16 Number and condition of archaeological priority areas.
Thames Archaeological Priority Area;3 Sites of Archaeological Importance
3 RBKC UDP 2002
OBJ 16Visitors / year to key attractions in the borough
OBJ 16
Historic Buidongs, sites and conservation areas including locally listed assets, affected, whether in a adverse or benefitial way
OBJ 16Number and condition of histrci parks and gardens
16 registers parks and gardens, of these none are at risk. These are:The Boltons, Brompton Cemetery, Cadogan Place,Chelsea Physic Garden, 100 Cheyne Walk, Edwardes Square, HansPlace, Holland Park, Kensal Green Cemetery, Kensington Gardens,Ladbroke Square Gardens, Royal Hospital, Chelsea and RanelaghGardens, St. Luke’s Gardens, the Commonwealth Institute Gardensand The Roof Gardens at 99 Kensington High Street
+ 1 RBKC UDPData not availabel - possible data gap
of the LPA therefore monitoring them and trying to assess any comparators (I.e. other boroughs) is meaningless.
Under investigation
Under investigation

SEA / SA of Royal Borough of Kensington and Chelsea LDF Baseline and Sustainability Issues Workshop – Participant Feedback
©Scott Wilson Business Consultancy June 2005 84

SEA / SA of Royal Borough of Kensington and Chelsea LDF Baseline and Sustainability Issues Workshop – Participant Feedback
APPENDIX VIII – ASSESSMENT TABLE PROFORMA Significance It is ultimately the responsibility of the body conducting the SA to determine whether the effects of the LDD are likely to be significant. Annex II of the SEA Directive provides criteria for assessing the significance of environmental effects (see Para1.7 below).
When determining the significance of the effect of a policy, RPBs and LPAs may need to consider the probability, duration, frequency and reversibility of the effects, including cumulative, secondary and synergistic effects. The magnitude and spatial extent of the effects (geographical area and size of the population likely to be affected) need to be considered. The value and vulnerability of certain areas and populations may also influence the assessment, particularly where thresholds or standards, may be exceeded. The following points31 sets out some principles of significance that are valid for all types of effect at the strategic level:
• Significance has to be determined individually in each case. Effects which are significant in one situation are not necessarily significant in another;
• Analysis of significance needs to be proportionate. It should be able to be carried out with reasonable time and effort and the effort expended to assess significance should be proportionate to the expected severity of the effect;
• Flexibility is important so that individual cases can be assessed. Criteria should be considered as guidelines, not rules; and
• Mathematical models are difficult to use to determine significance. Many aspects can be covered by verbal descriptions. The use of numeric models could give rise to fictitious precision. An attempt at quantifying qualitative and semi-quantitative aspects will not lead to an increase in objectivity.
The nature, impact and potential significance of the impacts will be assessed using a standard scoping approach which is summarised in the tables below.
Appraisal scoring symbols.
Symbol Likely effect against the SA Objective +++ Strong and significant beneficial impact ++ Potentially significant beneficial impact + Policy supports this objective although it may have only a minor beneficial impact X 1. Policy has no impact
2. Effect is neutral insofar as the benefits and drawbacks appear equal and neither is considered significant
? Uncertain or insufficient information on which to determine base the assessment at this stage
− Policy appears to conflict with the objective and may result in adverse impacts − − Potentially significant adverse impact
− − − Strong and significant adverse impact
31 ODPM (2005) ODPM (2005) Sustainability Appraisal of Regional Spatial Strategies and Local Development Frameworks: Interim advice note on frequently asked questions. ODPM (available at: http://www.odpm.gov.uk/stellent/groups/odpm_planning/documents/page/odpm_plan_037013.pdf)
©Scott Wilson Business Consultancy June 2005 85

SEA / SA of Royal Borough of Kensington and Chelsea LDF Baseline and Sustainability Issues Workshop – Participant Feedback
©Scott Wilson Business Consultancy June 2005 86
Assessment proforma
Option: [Insert Abbreviated title here] Brief Description of option: [Insert detail here]
SA Framework Objective Significance of Effect
Temporal Effects
(S /M / L)
Cumulative Effects
(Yes / No)
Commentary (including mitigation proposals, assumptions, limitations etc.)
1. To conserve and enhance the natural environment and biodiversity.
2. Reduce crime and anti-social behaviour and the fear of crime.
3. To support a diverse and vibrant local economy to foster sustainable economic growth.
4. Encourage social inclusion, equity, the promotion of equality and a respect for diversity.
5. Minimise effects on climate change through reduction in emissions, energy efficiency and use of renewables.
6. Reduce the risk of flooding to current and future residents
7. Improve air quality in the Royal Borough.
8. Protect and enhance the Royal Borough’s parks and open spaces.
9. Reduce pollution of air, water and land.
10. To promote traffic reduction and encourage more sustainable alternative forms of transport to reduce energy consumption and emissions

SEA / SA of Royal Borough of Kensington and Chelsea LDF Baseline and Sustainability Issues Workshop – Participant Feedback
©Scott Wilson Business Consultancy June 2005 87
from vehicular traffic.
11. Reduce the amount of waste produced and maximise the amount of waste that is recycled.
12. Ensure that social and community uses and facilities which serve a local need are enhanced, protected, and to encourage the provision of new community facilities.
13. To aim that the housing needs of the Royal Borough’s residents are m
14. Encourage energy efficiency through building design to maximise the re-use of building’s and the recycling of building materials.
15. Ensure the provision of accessible health care for all Borough residents.
16. To reinforce local distinctiveness, local environmental quality and amenity through the conservation and enhancement of cultural heritage.
Summary of Assessment: [Summary of assessment findings]
Summary of Mitigation: [Summary of mitigation proposals]