vol. 5, issue 6, june 2016 a survey on implementation … survey.pdf · a poka-yoke device is any...
TRANSCRIPT

ISSN(Online): 2319-8753 ISSN (Print) : 2347-6710
International Journal of Innovative Research in Science, Engineering and Technology
(An ISO 3297: 2007 Certified Organization)
Vol. 5, Issue 6, June 2016
Copyright to IJIRSET DOI:10.15680/IJIRSET.2015.0506277 11652
A Survey on Implementation of Poka-Yoke in Industries of Some Indian States
Rajat Tomar 1, Pradeep Kumar Soni 2
M.Tech Student, Department of Mechanical Engineering, Maulana Azad National Institute of Technology, Bhopal,
Madhya Pradesh, India1
Associate Professor, Department of Mechanical Engineering, Maulana Azad National Institute of Technology, Bhopal,
Madhya Pradesh, India 2
ABSTRACT: In current global competitive environment, every company is striving hard by putting continuous efforts for survival. To improve productivity and reliability and to eliminate/reduce defects, they implement new and efficient techniques in manufacturing and maintenance process. Lean manufacturing is one of such established tools and its realization is increasing every day. But Lean manufacturing itself is a vast collection of various techniques. One of such technique is Poka-yoke, also known as Mistake-proofing, is still a new concept in Indian industries. A questionnaire has been designed and validated to find out the status of implementation of poka-yoke. The data collected from various types of industries through online survey have been analyzed and results are presented. The survey shows that the implementation of poka-yoke is still in infant stage. The barriers in implementation have been identified and suitable suggestions have been given to address the situation. This will further assist the industries to gauge their level of implementation and will serve as foundation for future research. KEYWORDS: ANOVA Test, Contrast Test, Lean Manufacturing, Poka-Yoke, SPSS
I. INTRODUCTION The business cycle in every industry closely follows the general economic cycle and has therefore been subjected to cyclic fluctuations. Businesses need to work efficiently and respond quickly to market forces to be competitive. Lean manufacturing is one of such tool which assists the business to compete. Lean manufacturing or lean production, simply known as lean, is a production practice, which regards the use of resources for any work other than the creation of value for the end customer, is waste, and thus a target for elimination [1]. Poka-yoke is one of lean tool which is a Japanese word for mistake-proofing and the approach is based around the removal of the causes of defects. Poka-yoke is a mechanism that either prevents a mistake or defect occurring or makes any mistake or defect obvious at a glance. Poka-yoke eliminates human caused errors efficiently [2]. Even though the roots of poka-yoke concepts were evolved from mass production, its implementation in low discrete volume production of engineering product has so far received less attention in the scholarly literature. With this background, an objective is set to evaluate the status of awareness and implementation of poka-yoke and to identify the benefits expected out of it along with the barriers. A questionnaire-based online survey was carried out in 7 states namely Andhra Pradesh, Delhi, Haryana, Gujarat, Madhya Pradesh, Maharashtra, and Uttar Pradesh, and the results were analysed. The survey findings such as existing level of lean practices, reasons for less priority to lean concepts, common difficulties encountered by the industries are discussed in this paper.
II. LITERATURE REVIEW A poka-yoke device is any mechanism that either prevents a mistake or defect occurring or makes any mistake or
defect obvious at a glance. It is the concentration on removing the causes of defects that is important. The inspection process is a backdrop [4]. Shingo made a clear distinction between a defect and a mistake. Mistakes are inevitable as
ISSN(Online): 2319-8753 ISSN (Print) : 2347-6710
International Journal of Innovative Research in Science, Engineering and Technology
(An ISO 3297: 2007 Certified Organization)
Vol. 5, Issue 6, June 2016
Copyright to IJIRSET DOI:10.15680/IJIRSET.2015.0506277 11653
workers are human and cannot be expected to be attentive all the time or always understand instructions given completely [3]. The characteristics and impacts brought by poka-yoke have been presented in number of works [5-9]. It was originated in Japanese automotive industry, Toyota as element of Toyota Production System (TPS) [10]. TPS allows the continuous improvement of a business through the relentless elimination of waste, or non-value-added activities. Waste, in TPS, is defined as anything that does not add any value to the product or service from a customer’s perspective [11].
The successful application of poka-yoke had a significant impact in a variety of industries, such as electrical and electronics manufacturing, forging, automotive, process, etc and as a matter of fact, some industries may already be using poka-yoke without actually knowing it. A study of literature indicates that survey-based lean assessment has been done in Australian manufacturing industry [12], electronics manufacturing [13], Spanish ceramic tile industry [14], Malaysian electrical and electronics industry [15] and Indian machine tool industry [16]. In light of all findings, the present study explores the degree of use of poka-yoke in Indian industries and provides directions for future research.
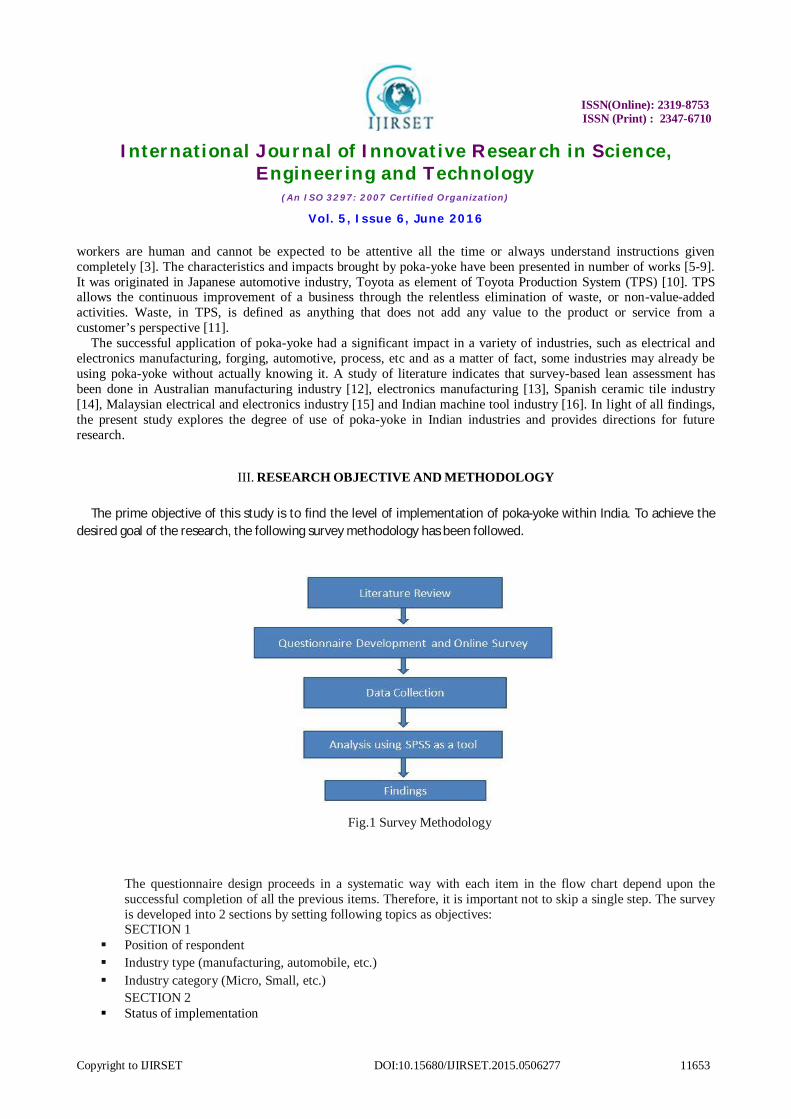
III. RESEARCH OBJECTIVE AND METHODOLOGY The prime objective of this study is to find the level of implementation of poka-yoke within India. To achieve the
desired goal of the research, the following survey methodology has been followed.
Fig.1 Survey Methodology
The questionnaire design proceeds in a systematic way with each item in the flow chart depend upon the successful completion of all the previous items. Therefore, it is important not to skip a single step. The survey is developed into 2 sections by setting following topics as objectives: SECTION 1
Position of respondent Industry type (manufacturing, automobile, etc.) Industry category (Micro, Small, etc.)
SECTION 2 Status of implementation

ISSN(Online): 2319-8753 ISSN (Print) : 2347-6710
International Journal of Innovative Research in Science, Engineering and Technology
(An ISO 3297: 2007 Certified Organization)
Vol. 5, Issue 6, June 2016
Copyright to IJIRSET DOI:10.15680/IJIRSET.2015.0506277 11654
Period of implementation Motivation for poka-yoke implementation Methodology of implementation Reasons why poka-yoke implementation is difficult Reasons of giving low priority Five point Likert scale is used with minimum rating of 1 and maximum rating of 5 with equal interval of 1 [16]. The survey was mailed online to various diverse industries to cover the broad spectrum of industries all over the India. The content and face validity of the questionnaire was determined the experts of industries who are familiar with poka-yoke [25]. SPSS Statistics is used as a tool for analysis. SPSS Statistics is a software package used for statistical analysis. It is used to perform data entry and analysis and to create tables and graphs. SPSS is capable of handling large amount of data and can perform all of the analysis covered in the test and much more. There are some Pre-requisites for SPSS viz., Variables, Data, Measurement Scale, Code book and Steps involved in hypothesis testing. Various statistics included in base software:
i. Descriptive statistics: Cross tabulation, Frequencies, Explore, Descriptive Ratio Statistics
ii. Bivariate statistics: Means, t-test, ANOVA, Correlation (bivariate, partial, distances), Non-parametric tests.
iii. Reliability,Prediction for identifying groups: Factor analysis, Cluster analysis(two step, K-mean, hierarchical), Discriminant
IV. RESULT & DISCUSSIONS
As the influences are derived from collected data, it is required to check the reliability of the data. The questionnaire was analyzed for its reliability using Cronbach’s alpha coefficient. Cronbach’s alpha was calculated for three groups of questions and the same is listed in Table 1.
Table 1 Cronbach’s alpha value for related questions Question nos. Cronbach’s alpha, α 3 (a), (b), (c) 0.709 5 (a) – (e) 0.714 6 (a) – (h) 0.787 Cronbach’s alpha coefficient reflects the good internal consistency of the data gathered. It is in the range of 0.709 to 0.787 and a value greater than 0.7. Hence, it may be concluded that the data collected from the online survey are reliable and can be used for further analysis [17].
Company Demographics Out of 120 questionnaire mail sent, 36 responses were received at a 30% response rate. The above response rate is considered reasonably good based on the recent survey-based research in operations management (7.47% [18], 13.5% [19]) and supply chain management (6.3% [32]). The frequency in this section of questionnaire shows the information about the respondents and their distribution. Figure 2 will show the positions of respondents in their respective organizations.
ISSN(Online): 2319-8753 ISSN (Print) : 2347-6710
International Journal of Innovative Research in Science, Engineering and Technology
(An ISO 3297: 2007 Certified Organization)
Vol. 5, Issue 6, June 2016
Copyright to IJIRSET DOI:10.15680/IJIRSET.2015.0506277 11655
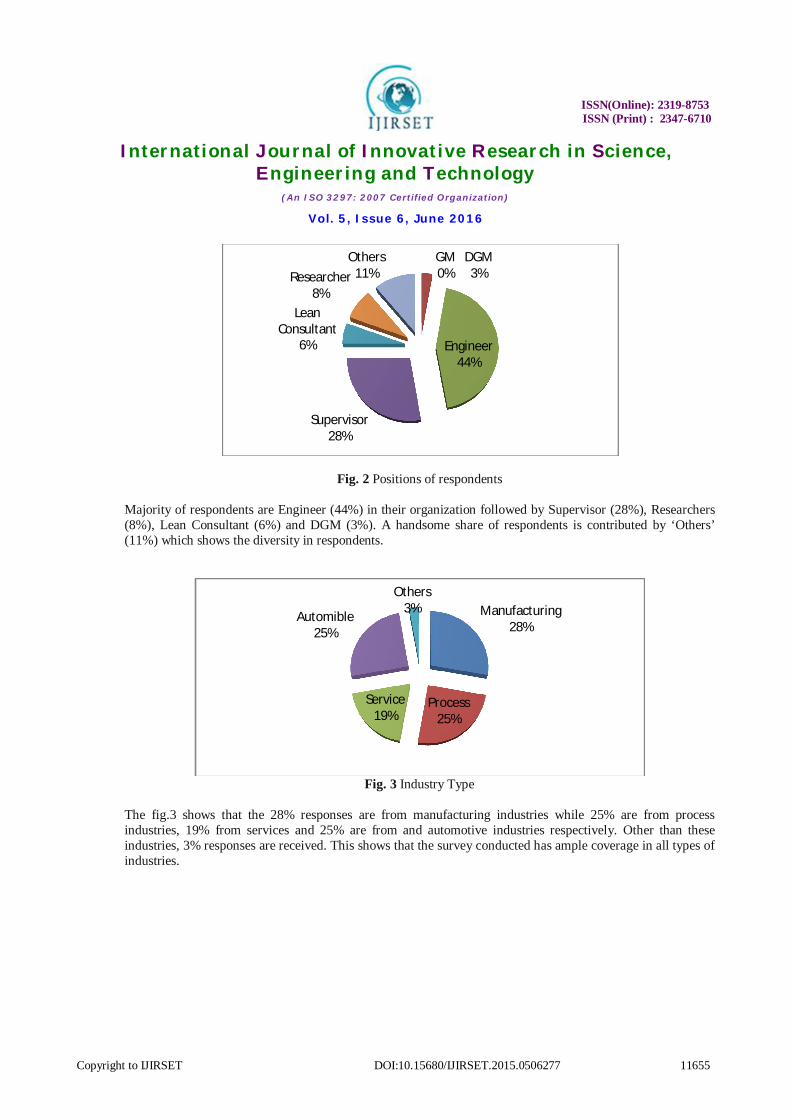
Fig. 2 Positions of respondents Majority of respondents are Engineer (44%) in their organization followed by Supervisor (28%), Researchers (8%), Lean Consultant (6%) and DGM (3%). A handsome share of respondents is contributed by ‘Others’ (11%) which shows the diversity in respondents.
Fig. 3 Industry Type
The fig.3 shows that the 28% responses are from manufacturing industries while 25% are from process industries, 19% from services and 25% are from and automotive industries respectively. Other than these industries, 3% responses are received. This shows that the survey conducted has ample coverage in all types of industries.
GM0%
DGM3%
Engineer44%
Supervisor28%
Lean Consultant
6%
Researcher8%
Others11%
Manufacturing28%
Process25%
Service19%
Automible25%
Others3%
ISSN(Online): 2319-8753 ISSN (Print) : 2347-6710
International Journal of Innovative Research in Science, Engineering and Technology
(An ISO 3297: 2007 Certified Organization)
Vol. 5, Issue 6, June 2016
Copyright to IJIRSET DOI:10.15680/IJIRSET.2015.0506277 11656
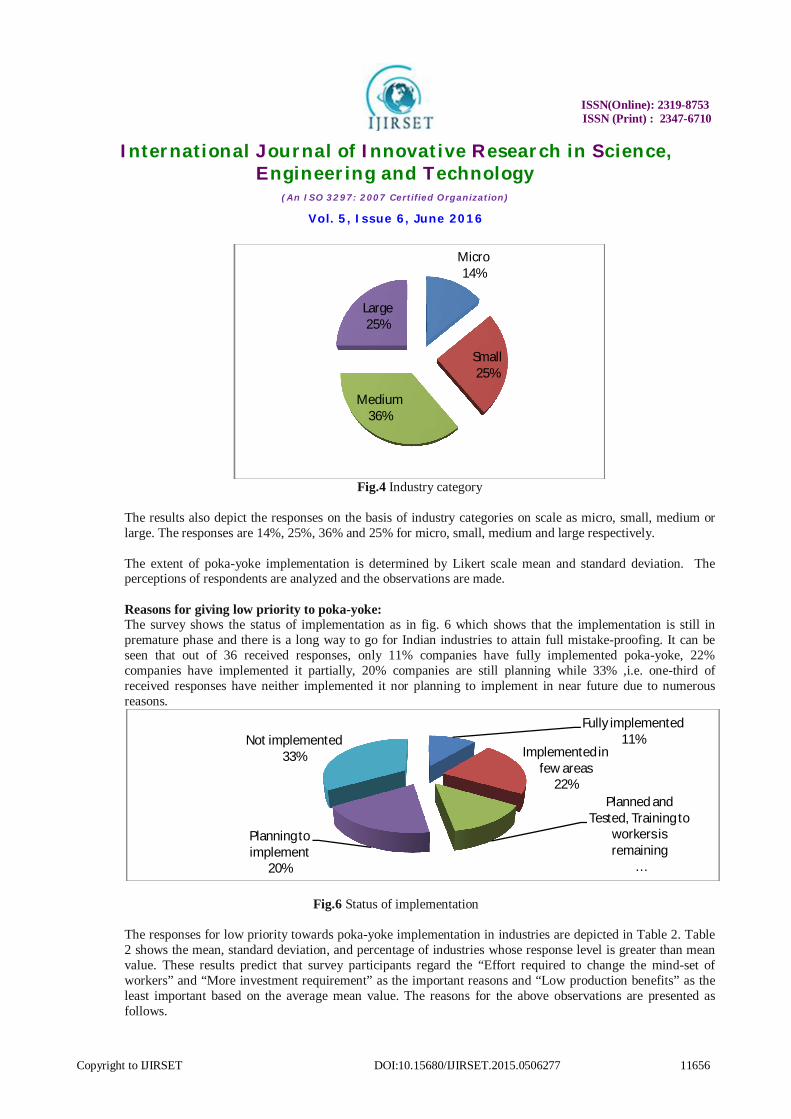
Fig.4 Industry category
The results also depict the responses on the basis of industry categories on scale as micro, small, medium or large. The responses are 14%, 25%, 36% and 25% for micro, small, medium and large respectively. The extent of poka-yoke implementation is determined by Likert scale mean and standard deviation. The perceptions of respondents are analyzed and the observations are made. Reasons for giving low priority to poka-yoke: The survey shows the status of implementation as in fig. 6 which shows that the implementation is still in premature phase and there is a long way to go for Indian industries to attain full mistake-proofing. It can be seen that out of 36 received responses, only 11% companies have fully implemented poka-yoke, 22% companies have implemented it partially, 20% companies are still planning while 33% ,i.e. one-third of received responses have neither implemented it nor planning to implement in near future due to numerous reasons.
Fig.6 Status of implementation
The responses for low priority towards poka-yoke implementation in industries are depicted in Table 2. Table 2 shows the mean, standard deviation, and percentage of industries whose response level is greater than mean value. These results predict that survey participants regard the “Effort required to change the mind-set of workers” and “More investment requirement” as the important reasons and “Low production benefits” as the least important based on the average mean value. The reasons for the above observations are presented as follows.
Micro 14%
Small25%
Medium 36%
Large25%
Fully implemented11%
Implemented in few areas
22%Planned and
Tested, Training to workers is remaining
…
Planning to implement
20%
Not implemented33%

ISSN(Online): 2319-8753 ISSN (Print) : 2347-6710
International Journal of Innovative Research in Science, Engineering and Technology
(An ISO 3297: 2007 Certified Organization)
Vol. 5, Issue 6, June 2016
Copyright to IJIRSET DOI:10.15680/IJIRSET.2015.0506277 11657
Table 2 Reasons for low priority towards poka-yoke implementation
S.No. Reasons for low priority towards poka-yoke implementation
Mean SD % of industry response>mean
1 Lack of Poka-Yoke awareness 3.6 0.9 64 2 Poka-Yoke awareness program in our country are less 3.7 0.95 58 3 Non-availability of training opportunity 3.5 0.8 58 4 Too much time and efforts required for implementation 3.5 0.8 47 5 Efforts involving in changing mind-set of workers 3.7 0.9 58 6 Implementation needs more investment 3.7 0.9 63 7 The cost of consultant for training is high 3.6 0.9 19 8 Low production benefits 2.3 1.3 39
SD – Standard Deviation The major reason for the low priority to lean practices is related to the human behavior (mean=3.7). The difficulty of changing the mind—set of the people was strongly supported by the literature [15, 21-22]. The resistance to change may be because of perception of additional workloads, fear of losing jobs and reduction of existing process time due to elimination of non-value-added activities. It might be possible to change the mind-set of employees if we could make them more aware of the lean benefits, consequences of waste, and survival of industry in the emerging competition scenario. In the same way, more time required to implement poka-yoke concepts, inadequate lean training opportunities, less lean awareness programs in India, are few more significant factors leading to low priority in lean implementation. The poka-yoke tools must be tailored to the realities of specific environments. In addition to the above reasons, high consultancy fee and initial investment are perceived to be the obstacles to successful implementation of lean practices. These are related to “cost factor.” Therefore, to get the ample support of management, it needs a detailed cost– benefit analysis. But, the benefits could be achieved only by transforming the employees as lean thinkers. To transform them as lean thinkers, suitable training and practices are the appropriate solutions. Further, the reasons like lower production benefits are the choice of respondents for poor poka-yoke implementation. Also, formulating poka-yoke is not as easy as it seems, and misapplication may result in additional wastage of resources and money [23]. Barriers in poka-yoke implementation: The analysis of the results summarized in Table 3 indicates the difficulties experienced by the industries in poka-yoke implementation. Table 3 indicates that the “Errors occurred even after implementation in an studied facility” is the biggest hurdle (mean = 3.5). In the same way, other reasons are indicated as hurdle in poka-yoke implementation
High Cost of implementation Frequent design change of products Most items are bought out items It does not address the requirement
Hypothesis formation : The following hypothesis has been developed to test the level of difference between the two groups on the motivational aspects of industries towards poka–yoke. Group 1 – industries that have fully implemented poka- yoke Group 2 – industries that have not implemented poka-yoke

ISSN(Online): 2319-8753 ISSN (Print) : 2347-6710
International Journal of Innovative Research in Science, Engineering and Technology
(An ISO 3297: 2007 Certified Organization)
Vol. 5, Issue 6, June 2016
Copyright to IJIRSET DOI:10.15680/IJIRSET.2015.0506277 11658
Table 3 Barriers in Poka-yoke implementation
S.No. Barriers Mean SD % of industry response>mean
1 It does not address the need of industry 2 0.85 69
2 Most of the items are bought out items 2.3 1.1 39 3 High cost to implement this technique 3.5 1.1 72 4 Frequent design changes 2.75 1.00 58 5 Errors occur even after implementation of Poka-
Yoke in a studied facility 2.7 0.80 55
SD – Standard Deviation
Null Hypothesis, H0 – There is no significant difference between the two groups. Alternative Hypothesis, H1 – There is significant difference between the two groups.
In order to test the hypothesis, One-way ANOVA test is conducted. The factors which act as the motivation to poka-yoke implementation are the dependent variables while the level of implementation (divided in only two groups) is the factor in ANOVA test (Table 4). Along with ANOVA, a Comparison test is also applied to depict the impact of level of implementation over the motivational variables (Table 5).
Table 4 ANOVA for motivational aspects
Variables Sum of
squares df Means of
squares f value P
value Difference
Customer satisfaction 17.157 4 4.289 4.853 0.004 Significant Company’s brand name 2.010 4 0.503 0.641 0.637 Competitiveness 1.726 4 0.432 0.694 0.603 Production effectiveness 11.033 4 2.758 4.337 0.007 Significant Production quality 1.732 4 0.433 0.844 0.508 Production cost 9.780 4 2.445 1.884 0.138 Human related error 0.948 4 0.237 1.372 0.003 Significant Reliability of product 4.094 4 1.023 0.939 0.455 The ANOVA test shows that there is significant difference between the two groups for variables like
i. customer satisfaction ii. production effectiveness
iii. human related errors Thus the hypothesis H1 is accepted for these 3 variables and for other, hypothesis H0 is accepted.
To check the statistical impact of level of implementation over the various motivational aspects, Contrast tests have been performed. For that coefficient = 1 is given to Full implementation and coefficient = -1 to Not implemented.

ISSN(Online): 2319-8753 ISSN (Print) : 2347-6710
International Journal of Innovative Research in Science, Engineering and Technology
(An ISO 3297: 2007 Certified Organization)
Vol. 5, Issue 6, June 2016
Copyright to IJIRSET DOI:10.15680/IJIRSET.2015.0506277 11659
Table 5 Contrast test
Variables Contrast Value of Contrast
Standard Error
df Sig.(2 tailed)
Customer satisfaction 1 1.333 0.542 31 0.02 Company’s brand name 1 0.6667 0.511 31 0.202 Competitiveness 1 0.4167 0.455 31 0.367 Production effectiveness 1 0.4167 0.460 31 0.037 Production quality 1 0.7500 0.413 31 0.079 Production cost 1 0.9167 0.657 31 0.173 Human related error 1 -0.500 0.240 31 0.046 Reliability of product 1 0.6667 0.602 31 0.277
In table 5, our focus is on the “Value of Contrast” column, which depicts the change in variable on changing the factor. By this we can conclude that there would be increment of 1.333 in customer satisfaction, 0.6667 in company’s brand name, 0.4167 in competitiveness, 0.4167 in production effectiveness, 0.750 in production quality, 0.9167 in production cost and 0.6667 in reliability of product for one successful full implementation of poka-yoke. We can see there is a negative value of contrast in ‘Human related errors’ which depicts that there is reduction of 0.50 for one successful full implementation of poka-yoke which is the intended function of poka-yoke and the responses obtained also signifies that.
V. CONCLUSION
This paper presented an insight into the current status of poka-yoke implementation in Indian industries. Firstly, the work has attempted to formulate a simple questionnaire-based tool to identify the existing level of poka-yoke practices, reasons for inadequate priority to poka-yoke, and the common difficulties encountered by the Indian industries. The tool was validated through face, content, and reliability tests, and then the involvement in various activities is studied and discussed. The survey result revealed that 33% of the companies have implemented poka-yoke fully or in selected areas. The remaining 67% of the companies have not yet taken up the initiative to implement. The progress is also snail-paced, and it has a further scope to develop. It is concluded that the major reasons for low level of poka-yoke implementation are anxiety in changing the mind-set of workers, lack of awareness and training about the poka-yoke, and cost and time involved in its implementation. Appropriate lean education and research set up in association with industries has to be fostered and encouraged to stimulate the lean awareness and higher technological standards in manufacturing. The role of lean thinking is immense towards achieving this objective.
VI. LIMITATIONS AND FUTURE RESEARCH
The response to the questionnaire may be limited by respondent’s knowledge about poka-yoke. The person who has extensive knowledge about poka-yoke could only provide correct response to the questionnaire; else, the outcome will be unreliable input data/poor response rate. Despite these limitations, this study will provide a foundation to trigger furthering poka-yoke research. Further research in this area is needed to develop suitable training programs to teach poka-yoke concepts, train the employees, and transform them as lean thinkers. This would help to foresee the firm’s operations, learn to recognize the value-added and non-value-added activities. This new proposal has to be effectively implemented, not only to industries, but also to reach the minds of young engineers.
REFERENCES 1. Womack, J. P., D. T. Jones, and D. Ross. "The Machine that changes the world. Rawson. New York. Elsinore, Denmark." (1990). 2. Shigeo Shingo, The Sayings of Shigeo Shingo: Key Strategies for Plant Improvement. Productivity Press, page 145 3. Shingo, Shigeo. Zero quality control: Source inspection and the poka-yoke system. CRC Press, 1986. 4. Fisher, M., 1999. Process improvement by poka-yoke. Work Study, 48(7), pp.264-266. 5. Dave,Y., & Sohani,N. (2015) Implementation of Poka-Yoke Technique in a Gear Industry – A Case Study. International Journal of Latest
Research in Science and Technology. 6. Tak, P. D., & Wagh, S. S. Poka Yoke Implementation on Punching Machine : A Case Study.

ISSN(Online): 2319-8753 ISSN (Print) : 2347-6710
International Journal of Innovative Research in Science, Engineering and Technology
(An ISO 3297: 2007 Certified Organization)
Vol. 5, Issue 6, June 2016
Copyright to IJIRSET DOI:10.15680/IJIRSET.2015.0506277 11660
7. Schmidt, S. (2013). Preventive methods in logistics poka-yoke and failure mode and effect analysis (FMEA). Acta Technica Corviniensis-Bulletin of Engineering, 6(1), 27.
8. Sarah Fathiah, A. (2013). Design & development of poka-yoke system for nut identification to defect prevention. 9. Robinson, H. (1997). Using Poka-Yoke techniques for early defect detection. In Sixth International Conference on Software Testing Analysis
and Review (pp. 134-145). 10. Monden Y (1983) Toyota Production System. Industrial Engineering and Management Press, Norcross 11. Ohno T (1988) Toyota Production System: beyond large scale production. Productivity, Portland 12. Sohal, A.S., & Egglestone, A. (1994). Lean production: experience among Australian organizations. International Journal of Operations &
Production Management, 14 (11), 35–51 13. Doolen,T.L., & Hacker, M.E. (2005). A review of lean assessment in organizations: an exploratory study of lean practices by electronics
manufacturers. Journal of Manufacturing Systems, 24(1),55 14. Bonavia, T., & Marin, J.A.(2006). An empirical study of lean production in the ceramic tile industry in Spain. International Journal of
Operations & Production Management, 26(5), 505–531 15. Wong, Y.C., Wong, K.Y., & Ali, A. (2009). A study on lean manufacturing implementation in the Malaysian electrical and electronics industry.
European Journal of Scientific Research, 38(4), 521–535 16. Ramchander P (2004) Research design and Methodology. University of Pretoria, pp. 104–129. 17. Gliem, R. R., & Gliem, J. A. (2003). Calculating, interpreting, and reporting Cronbach’s alpha reliability coefficient for Likert-type scales.
Midwest Research-to-Practice Conference in Adult, Continuing, and Community Education. 18. Nahm, A.Y., Vonderembse, M.A., & Koufteros, X.A. (2003). The impact of organizational structure on time-based manufacturing and plant
performance. Journal of Operation Management, 21(3),281–306 19. Shah, R., & Ward, P.T. (2007). Defining and developing measures of lean production. Journal of Operation Management, 25,785–805 20. Li, S., Ragu-Nathan, B., Ragu-Nathan, T.S., & Subba Rao, S. (2005). Development and validation of a measurement instrument for studying
supply chain management practices. Journal of Operation Management 23(6), 618–641 21. Sun, H., Yam, R., & Wai-Keung, N. (2003). The implementation and evaluation of Total Productive Maintenance (TPM)—an action case study
in a Hong Kong manufacturing company. International Journal of Advance Manufacturing Technology, 22,224–228 22. Ahuja, I.P.S., & Khamba, J.S. (2008). Strategies and success factors for overcoming challenges in TPM implementation in Indian
manufacturing industry. Journal of Quality in Maintenance Engineering 14(2),123–147 23. Pavaskar, S.J., Gershenson, J.K., & Jambekar, A.B. (2003). Classification scheme for lean manufacturing tools. International Journal of
Production Research, 41(13),3075–3090 24. Eswaramoorthi, M., Kathiresan, G. R., Prasad, P. S. S., & Mohanram, P. V. (2011). A survey on lean practices in Indian machine tool
industries. The International Journal of Advanced Manufacturing Technology, 52(9-12), 1091-1101