vol. 5, issue 5, may 2016 battery driven multiple ... · issn(online) : 2319-8753 issn (print) :...
TRANSCRIPT
ISSN(Online) : 2319-8753
ISSN (Print) : 2347-6710
International Journal of Innovative Research in Science, Engineering and Technology
(An ISO 3297: 2007 Certified Organization)
Vol. 5, Issue 5, May 2016
Copyright to IJIRSET DOI:10.15680/IJIRSET.2016.0505186 7719
Battery Driven Multiple Parameter Monitoring Device
Chaithra B K
1, Shruthi K
2, Balu Vasista3, Rajani Katiyar
4 , Deepak V Ingale5 P.G. Student, Department of Electronics and Communication Engineering, RVCE, Bangalore, Karnataka, India1
P.G. Student, Department of Digital Signal Processing, CET, Jain University, Bangalore, Karnataka, India2
System Engineer, Applied Cognition Systems Pvt. Ltd, Bangalore, Karnataka, India 3
Associate Professor, Department of Electronics and Communication Engineering, RVCE, Karnataka,
India4
Assistant Professor, Department of Electronics and Communication Engineering, CET, Karnataka, India5
ABSTRACT: This paper presents the wearable battery driven multiple parameters monitoring device that is capable of remotely acquiring, processing and relay the data to suitable person who can understand and react in risky circumstances on behalf of patient which is actually required in real time situation. The parameters acquired using acquisition modules are ECG, blood pressure, stetho, spo2. The output of module is transferred to cloud server through IoT device. Post processing is carried out in cloud server. The features extracted are heart rate variability, systolic pressure, diastolic pressure, mean atrial pressure, oxygen saturation level, pulserate.
KEYWORDS: Acquisition, Processing, Feature extraction, Relay data, Heart rate, oxygen level, systolic pressure, diastolic pressure, battery driven.
I. INTRODUCTION
This device is built for geriatric, chronic, diabetic and especially for follow up program after medical intervention
in hospital i.e. during post discharge recovery. There are many devices available in the market which monitors various parameters, but many challenges are yet to be addressed such as wearability, portability, battery life, affordability, illiteracy, mobility, reliability, availability, simplicity, flexibility and interoperability. The challenges addressed in this device are, Affordability: Hospital can afford ICU quality but individual from developing country like India cannot afford ICU quality for remote monitoring. Hence there is a need to develop the device which monitors the patient with cost that is affordable by individual. Illiteracy: we cannot expect the patient to be literate to understand biomedical instruments. Mobility: monitoring while working and along with day today activities are very important to find out anomaly related to situations and situational habitual disorder which cannot be assessed in a controlled environment like hospital but this seriously affects the patient health. Reliability: Device should be immune to variation of battery voltage, interference from muscle noise, electrical noise and noise induced in ecosystem. Simplicity: user must not be expected to configure device. User should only have to switch on the device. Flexibility: device should be capable to announce its capability and user must be allowed to select the required parameters. Interoperability: Device designed is capable to operate with gateway, android phone, DSL, web services to deposit data and retrieve command through any HTTP hosted platform. Wearability: device should be mechanically flexible. It should not cause any allergy and it should be clipped to existing garment.
ISSN(Online) : 2319-8753
ISSN (Print) : 2347-6710
International Journal of Innovative Research in Science, Engineering and Technology
(An ISO 3297: 2007 Certified Organization)
Vol. 5, Issue 5, May 2016
Copyright to IJIRSET DOI:10.15680/IJIRSET.2016.0505186 7720
II. SYSTEMOVERVIEW
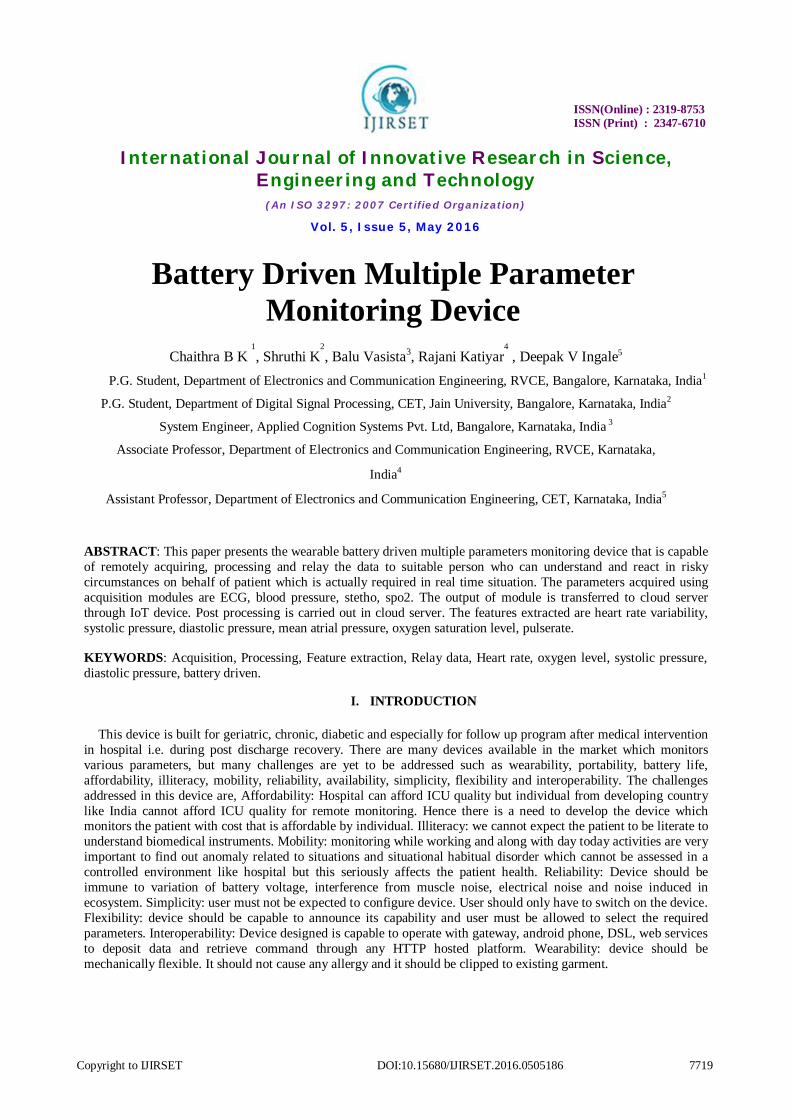
The outputs of sensors that are used to acquire different parameters are connected to MPM APCOG device where signals are acquired, filtered and amplified. The output of the acquisition module is transferred to cloud server through router. In cloud server various parameter are computed and they are displayed in doctor’s and/or nurse’s laptop. On the detection of any anomaly, patient is alerted and suggested to take necessary first aid actions. A. Analog front end The analog front end includes acquisition module. The module is capable of capturing ECG, spo2, stetho and blood pressure signal.
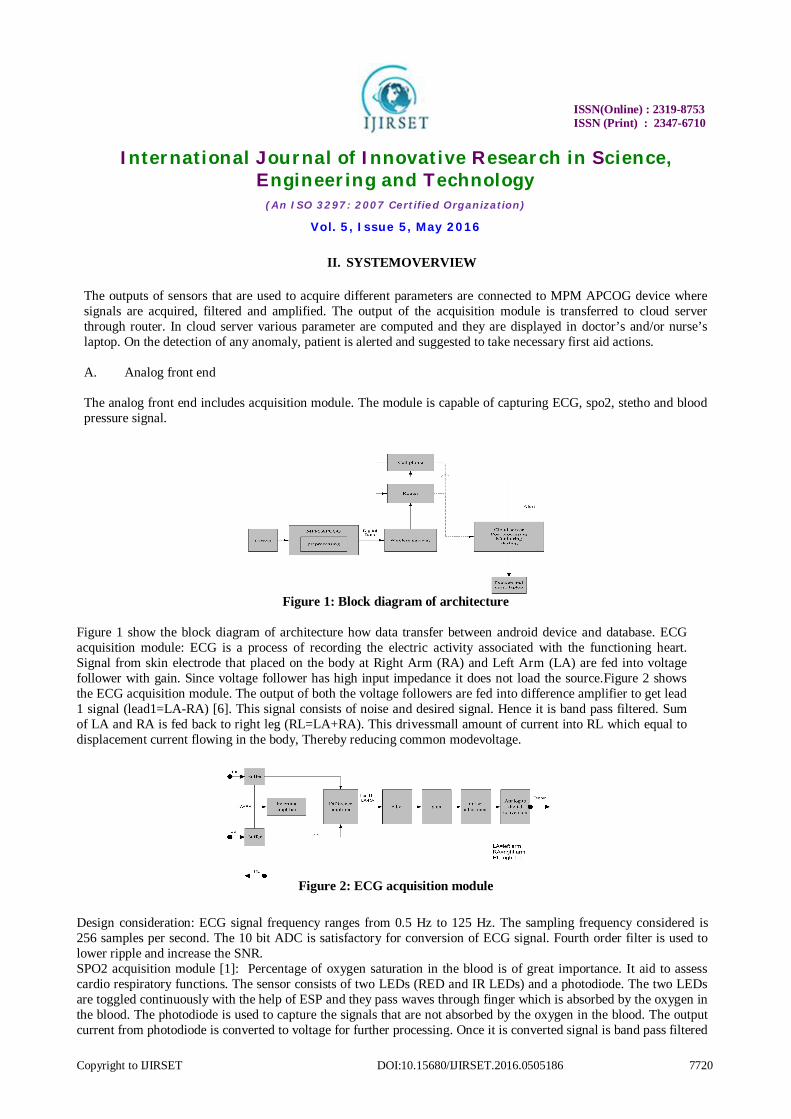
Figure 1 show the block diagram of architecture how data transfer between android device and database. ECG acquisition module: ECG is a process of recording the electric activity associated with the functioning heart. Signal from skin electrode that placed on the body at Right Arm (RA) and Left Arm (LA) are fed into voltage follower with gain. Since voltage follower has high input impedance it does not load the source.Figure 2 shows the ECG acquisition module. The output of both the voltage followers are fed into difference amplifier to get lead 1 signal (lead1=LA-RA) [6]. This signal consists of noise and desired signal. Hence it is band pass filtered. Sum of LA and RA is fed back to right leg (RL=LA+RA). This drivessmall amount of current into RL which equal to displacement current flowing in the body, Thereby reducing common modevoltage.
Design consideration: ECG signal frequency ranges from 0.5 Hz to 125 Hz. The sampling frequency considered is 256 samples per second. The 10 bit ADC is satisfactory for conversion of ECG signal. Fourth order filter is used to lower ripple and increase the SNR. SPO2 acquisition module [1]: Percentage of oxygen saturation in the blood is of great importance. It aid to assess cardio respiratory functions. The sensor consists of two LEDs (RED and IR LEDs) and a photodiode. The two LEDs are toggled continuously with the help of ESP and they pass waves through finger which is absorbed by the oxygen in the blood. The photodiode is used to capture the signals that are not absorbed by the oxygen in the blood. The output current from photodiode is converted to voltage for further processing. Once it is converted signal is band pass filtered
Figure 1: Block diagram of architecture
Figure 2: ECG acquisition module
ISSN(Online) : 2319-8753
ISSN (Print) : 2347-6710
International Journal of Innovative Research in Science, Engineering and Technology
(An ISO 3297: 2007 Certified Organization)
Vol. 5, Issue 5, May 2016
Copyright to IJIRSET DOI:10.15680/IJIRSET.2016.0505186 7721
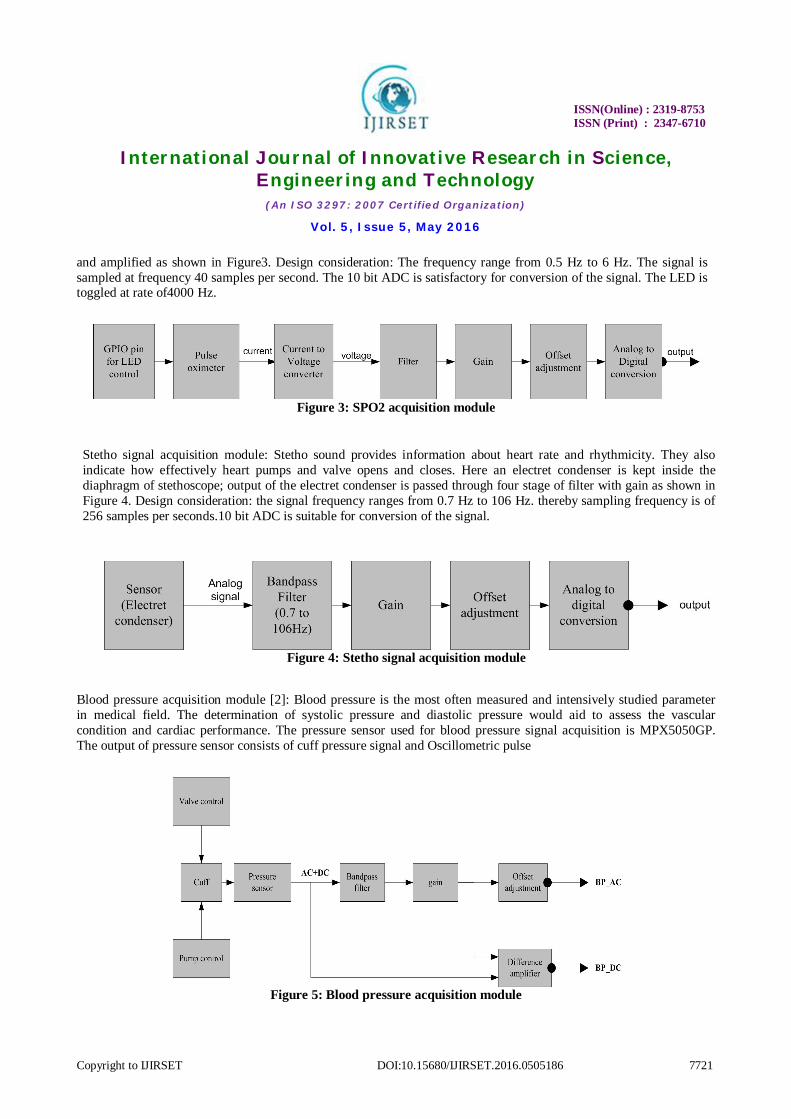
and amplified as shown in Figure3. Design consideration: The frequency range from 0.5 Hz to 6 Hz. The signal is sampled at frequency 40 samples per second. The 10 bit ADC is satisfactory for conversion of the signal. The LED is toggled at rate of4000 Hz. Stetho signal acquisition module: Stetho sound provides information about heart rate and rhythmicity. They also indicate how effectively heart pumps and valve opens and closes. Here an electret condenser is kept inside the diaphragm of stethoscope; output of the electret condenser is passed through four stage of filter with gain as shown in Figure 4. Design consideration: the signal frequency ranges from 0.7 Hz to 106 Hz. thereby sampling frequency is of 256 samples per seconds.10 bit ADC is suitable for conversion of the signal.
Blood pressure acquisition module [2]: Blood pressure is the most often measured and intensively studied parameter in medical field. The determination of systolic pressure and diastolic pressure would aid to assess the vascular condition and cardiac performance. The pressure sensor used for blood pressure signal acquisition is MPX5050GP. The output of pressure sensor consists of cuff pressure signal and Oscillometric pulse
Figure 3: SPO2 acquisition module
Figure 4: Stetho signal acquisition module
Figure 5: Blood pressure acquisition module
ISSN(Online) : 2319-8753
ISSN (Print) : 2347-6710
International Journal of Innovative Research in Science, Engineering and Technology
(An ISO 3297: 2007 Certified Organization)
Vol. 5, Issue 5, May 2016
Copyright to IJIRSET DOI:10.15680/IJIRSET.2016.0505186 7722
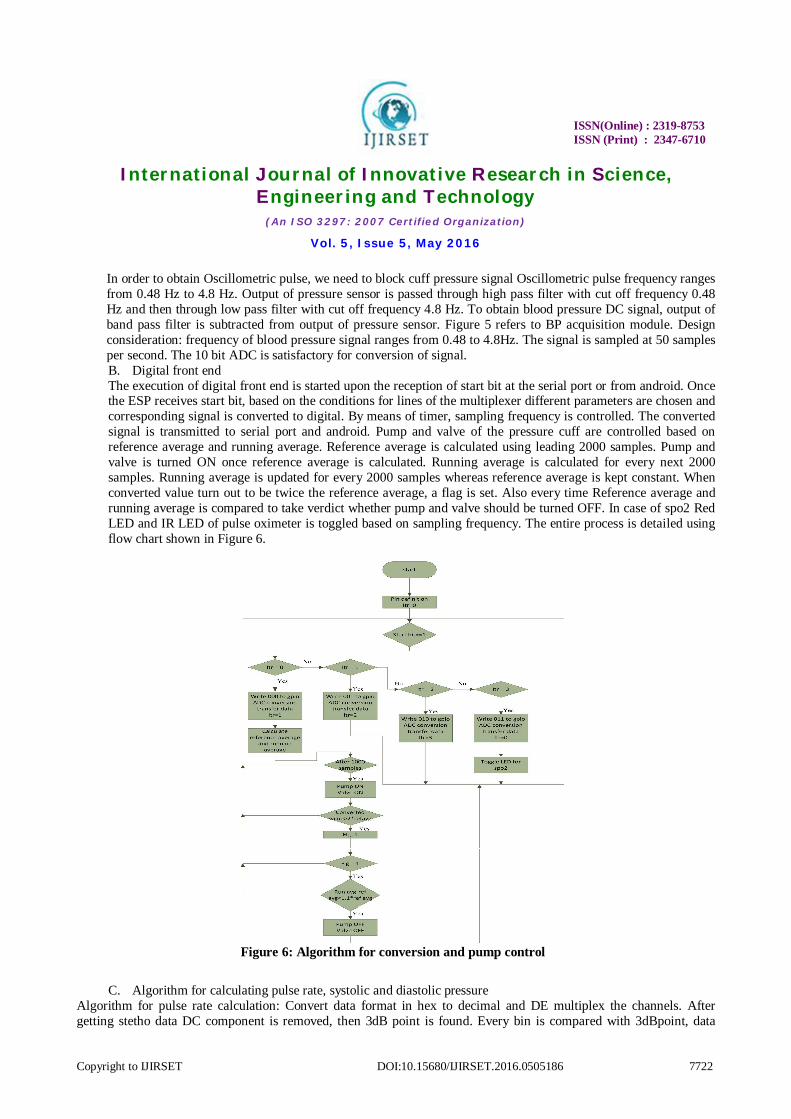
In order to obtain Oscillometric pulse, we need to block cuff pressure signal Oscillometric pulse frequency ranges from 0.48 Hz to 4.8 Hz. Output of pressure sensor is passed through high pass filter with cut off frequency 0.48 Hz and then through low pass filter with cut off frequency 4.8 Hz. To obtain blood pressure DC signal, output of band pass filter is subtracted from output of pressure sensor. Figure 5 refers to BP acquisition module. Design consideration: frequency of blood pressure signal ranges from 0.48 to 4.8Hz. The signal is sampled at 50 samples per second. The 10 bit ADC is satisfactory for conversion of signal. B. Digital front end The execution of digital front end is started upon the reception of start bit at the serial port or from android. Once the ESP receives start bit, based on the conditions for lines of the multiplexer different parameters are chosen and corresponding signal is converted to digital. By means of timer, sampling frequency is controlled. The converted signal is transmitted to serial port and android. Pump and valve of the pressure cuff are controlled based on reference average and running average. Reference average is calculated using leading 2000 samples. Pump and valve is turned ON once reference average is calculated. Running average is calculated for every next 2000 samples. Running average is updated for every 2000 samples whereas reference average is kept constant. When converted value turn out to be twice the reference average, a flag is set. Also every time Reference average and running average is compared to take verdict whether pump and valve should be turned OFF. In case of spo2 Red LED and IR LED of pulse oximeter is toggled based on sampling frequency. The entire process is detailed using flow chart shown in Figure 6.
C. Algorithm for calculating pulse rate, systolic and diastolic pressure Algorithm for pulse rate calculation: Convert data format in hex to decimal and DE multiplex the channels. After getting stetho data DC component is removed, then 3dB point is found. Every bin is compared with 3dBpoint, data
Figure 6: Algorithm for conversion and pump control
ISSN(Online) : 2319-8753
ISSN (Print) : 2347-6710
International Journal of Innovative Research in Science, Engineering and Technology
(An ISO 3297: 2007 Certified Organization)
Vol. 5, Issue 5, May 2016
Copyright to IJIRSET DOI:10.15680/IJIRSET.2016.0505186 7723
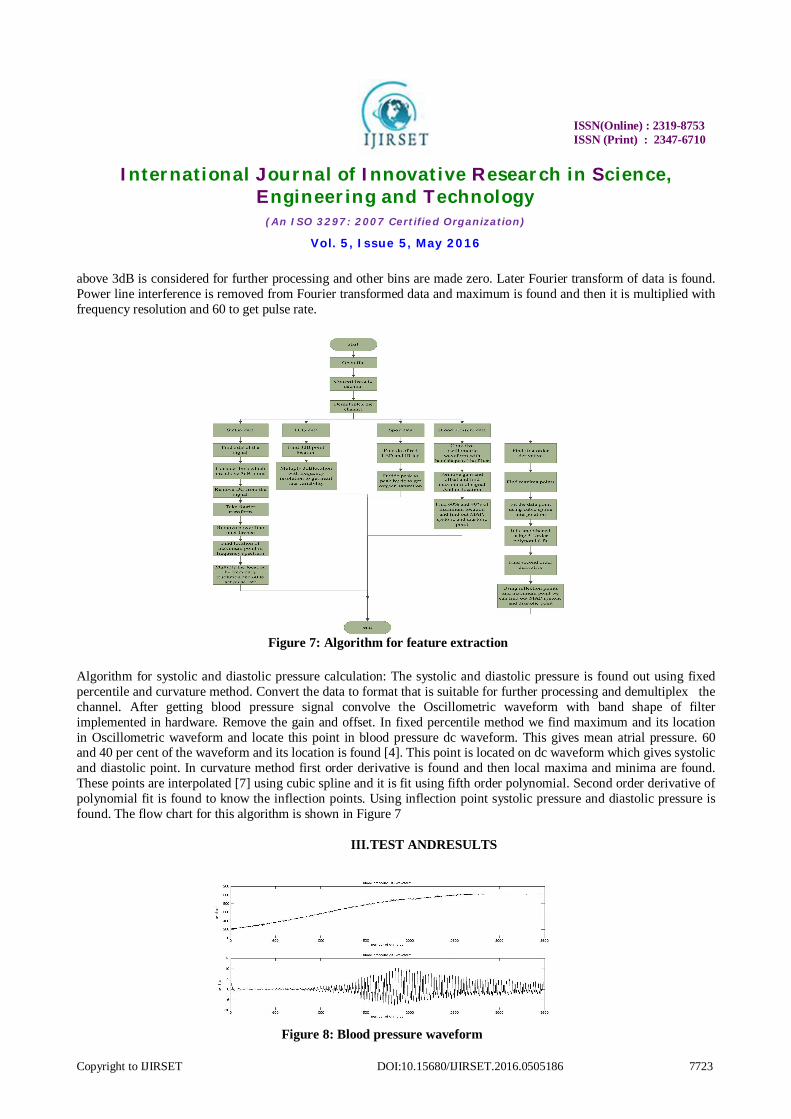
above 3dB is considered for further processing and other bins are made zero. Later Fourier transform of data is found. Power line interference is removed from Fourier transformed data and maximum is found and then it is multiplied with frequency resolution and 60 to get pulse rate.
Algorithm for systolic and diastolic pressure calculation: The systolic and diastolic pressure is found out using fixed percentile and curvature method. Convert the data to format that is suitable for further processing and demultiplex the channel. After getting blood pressure signal convolve the Oscillometric waveform with band shape of filter implemented in hardware. Remove the gain and offset. In fixed percentile method we find maximum and its location in Oscillometric waveform and locate this point in blood pressure dc waveform. This gives mean atrial pressure. 60 and 40 per cent of the waveform and its location is found [4]. This point is located on dc waveform which gives systolic and diastolic point. In curvature method first order derivative is found and then local maxima and minima are found. These points are interpolated [7] using cubic spline and it is fit using fifth order polynomial. Second order derivative of polynomial fit is found to know the inflection points. Using inflection point systolic pressure and diastolic pressure is found. The flow chart for this algorithm is shown in Figure 7
III. TEST ANDRESULTS
Figure 7: Algorithm for feature extraction
Figure 8: Blood pressure waveform
ISSN(Online) : 2319-8753
ISSN (Print) : 2347-6710
International Journal of Innovative Research in Science, Engineering and Technology
(An ISO 3297: 2007 Certified Organization)
Vol. 5, Issue 5, May 2016
Copyright to IJIRSET DOI:10.15680/IJIRSET.2016.0505186 7724
The figure 8 above shows the blood pressure waveform plotted in matlab after acquiring remotely, converting to digital and transmitting to android phone.
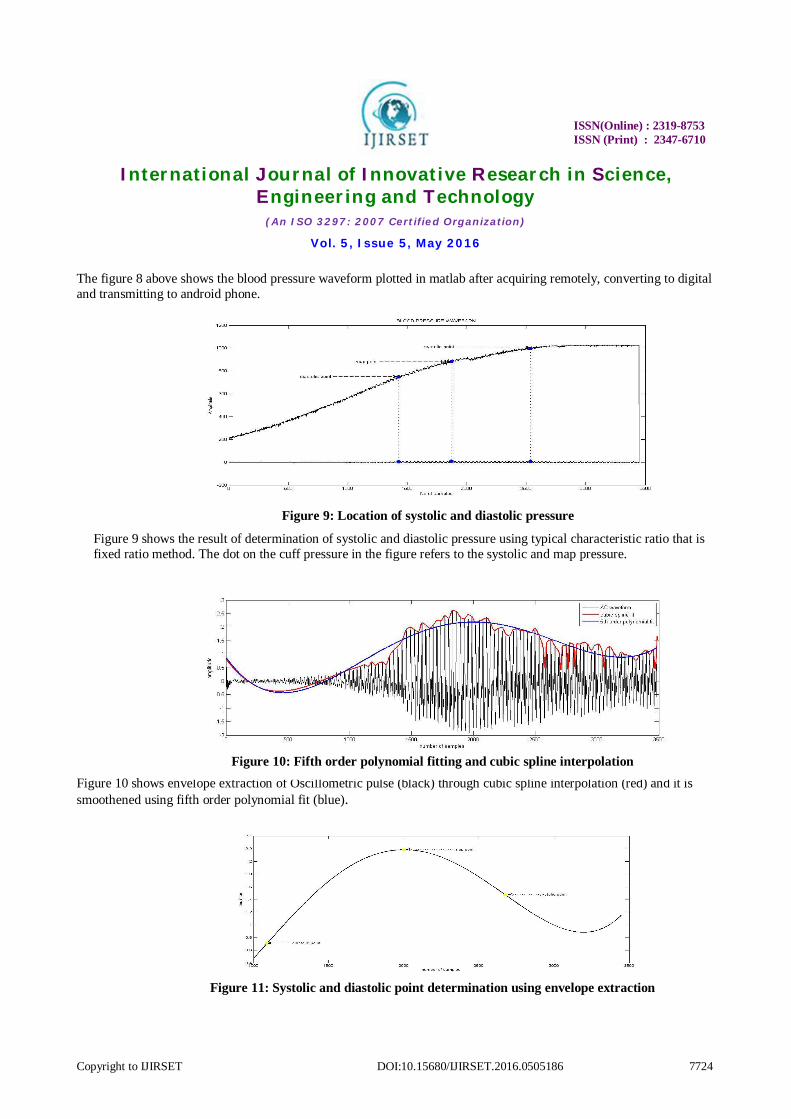
Figure 9 shows the result of determination of systolic and diastolic pressure using typical characteristic ratio that is fixed ratio method. The dot on the cuff pressure in the figure refers to the systolic and map pressure.
Figure 10 shows envelope extraction of Oscillometric pulse (black) through cubic spline interpolation (red) and it is smoothened using fifth order polynomial fit (blue).
Figure 9: Location of systolic and diastolic pressure
Figure 10: Fifth order polynomial fitting and cubic spline interpolation
Figure 11: Systolic and diastolic point determination using envelope extraction
ISSN(Online) : 2319-8753
ISSN (Print) : 2347-6710
International Journal of Innovative Research in Science, Engineering and Technology
(An ISO 3297: 2007 Certified Organization)
Vol. 5, Issue 5, May 2016
Copyright to IJIRSET DOI:10.15680/IJIRSET.2016.0505186 7725
Figure 11 shows systolic and diastolic point determination based on inflection point after converting it to digital and transmitting to android phone on request from user.
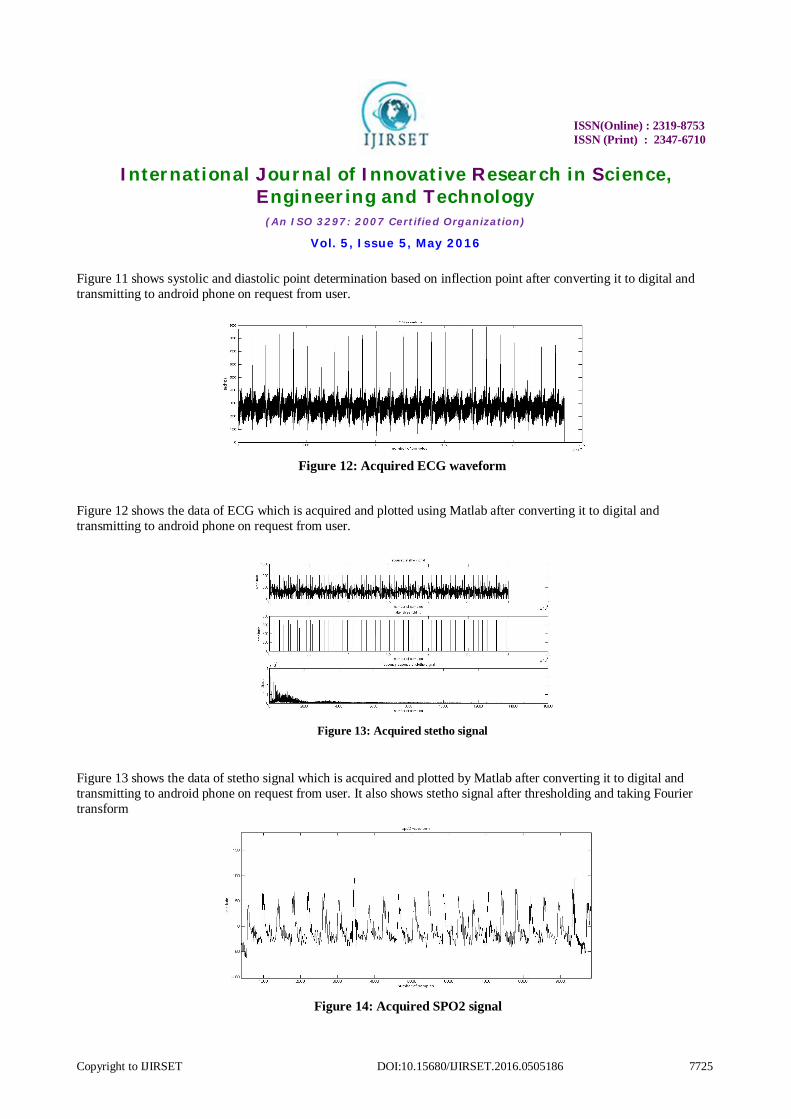
Figure 12 shows the data of ECG which is acquired and plotted using Matlab after converting it to digital and transmitting to android phone on request from user.
Figure 13 shows the data of stetho signal which is acquired and plotted by Matlab after converting it to digital and transmitting to android phone on request from user. It also shows stetho signal after thresholding and taking Fourier transform
Figure 12: Acquired ECG waveform
Figure 13: Acquired stetho signal
Figure 14: Acquired SPO2 signal
ISSN(Online) : 2319-8753
ISSN (Print) : 2347-6710
International Journal of Innovative Research in Science, Engineering and Technology
(An ISO 3297: 2007 Certified Organization)
Vol. 5, Issue 5, May 2016
Copyright to IJIRSET DOI:10.15680/IJIRSET.2016.0505186 7726
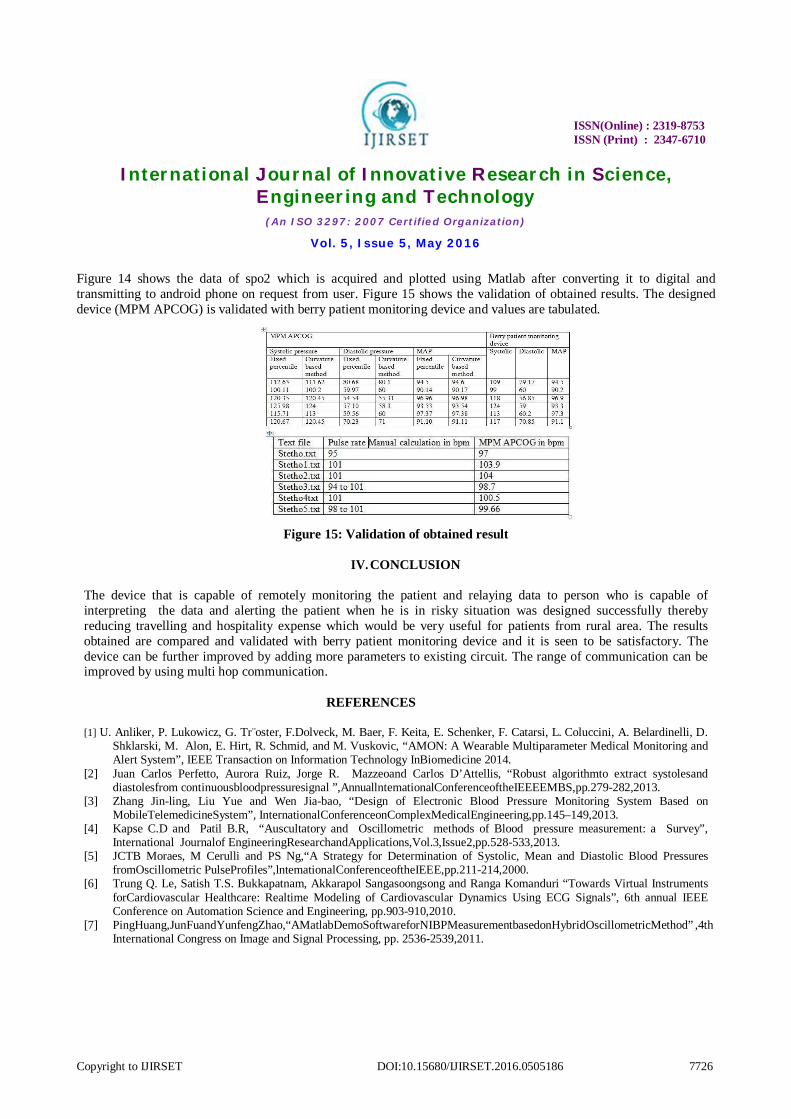
Figure 14 shows the data of spo2 which is acquired and plotted using Matlab after converting it to digital and transmitting to android phone on request from user. Figure 15 shows the validation of obtained results. The designed device (MPM APCOG) is validated with berry patient monitoring device and values are tabulated.
Figure 15: Validation of obtained result
IV. CONCLUSION
The device that is capable of remotely monitoring the patient and relaying data to person who is capable of interpreting the data and alerting the patient when he is in risky situation was designed successfully thereby reducing travelling and hospitality expense which would be very useful for patients from rural area. The results obtained are compared and validated with berry patient monitoring device and it is seen to be satisfactory. The device can be further improved by adding more parameters to existing circuit. The range of communication can be improved by using multi hop communication.
REFERENCES
[1] U. Anliker, P. Lukowicz, G. Tr¨oster, F.Dolveck, M. Baer, F. Keita, E. Schenker, F. Catarsi, L. Coluccini, A. Belardinelli, D. Shklarski, M. Alon, E. Hirt, R. Schmid, and M. Vuskovic, “AMON: A Wearable Multiparameter Medical Monitoring and Alert System”, IEEE Transaction on Information Technology InBiomedicine 2014.
[2] Juan Carlos Perfetto, Aurora Ruiz, Jorge R. Mazzeoand Carlos D’Attellis, “Robust algorithmto extract systolesand diastolesfrom continuousbloodpressuresignal ”,AnnuallntemationalConferenceoftheIEEEEMBS,pp.279-282,2013.
[3] Zhang Jin-ling, Liu Yue and Wen Jia-bao, “Design of Electronic Blood Pressure Monitoring System Based on MobileTelemedicineSystem”, InternationalConferenceonComplexMedicalEngineering,pp.145–149,2013.
[4] Kapse C.D and Patil B.R, “Auscultatory and Oscillometric methods of Blood pressure measurement: a Survey”, International Journalof EngineeringResearchandApplications,Vol.3,Issue2,pp.528-533,2013.
[5] JCTB Moraes, M Cerulli and PS Ng,“A Strategy for Determination of Systolic, Mean and Diastolic Blood Pressures fromOscillometric PulseProfiles”,lntemationalConferenceoftheIEEE,pp.211-214,2000.
[6] Trung Q. Le, Satish T.S. Bukkapatnam, Akkarapol Sangasoongsong and Ranga Komanduri “Towards Virtual Instruments forCardiovascular Healthcare: Realtime Modeling of Cardiovascular Dynamics Using ECG Signals”, 6th annual IEEE Conference on Automation Science and Engineering, pp.903-910,2010.
[7] PingHuang,JunFuandYunfengZhao,“AMatlabDemoSoftwareforNIBPMeasurementbasedonHybridOscillometricMethod” ,4th International Congress on Image and Signal Processing, pp. 2536-2539,2011.