vol. 3, issue 8, august 2014 experimental study of … study of transient forced convection heat...
TRANSCRIPT

International Journal of Innovative Research in Science,
Engineering and Technology
(An ISO 3297: 2007 Certified Organization)
Vol. 3, Issue 8, August 2014
DOI: 10.15680/IJIRSET.2014.0308085
15703
ISSN: 2319-8753
Experimental Study of Transient Forced
Convection Heat Transfer Nanofluid in
Triangular Duct
Ahmed H. Ali1, Tahseen A.Al-Hattab
2
Department of Automotive, Technical College of Najaf, Najaf, Iraq1
Department of Electrochemical Engineering, University of Babylon, Babylon, Iraq2
ABSTRACT: The transient 3-D fully developed forced convection laminar flow of Cuo/water and Al2O3with constant
property in horizontal triangular duct has been thoroughly investigated experimentally. Four different values of
Reynolds number(500,1000,1500 and 2000) , volume fraction(0.025, 0.05, 0.1 and 0.25)% were used, and constant
Heat Flux boundary condition was applied. Results are compared with theoretical data available in the literature in
steady state condition, good agreements are showed. The results appeared that heat transfer rate become more
remarkable when employing nanofluid than that of pure water. Also, Heat transfer enhancement increases with the
particle volume concentration increase for a given other parameters, and considerable reduction in time consuming for
steady state condition. Temperature difference distribution are presented for various void fractions and Reynolds
numbers. in addition, friction factor, local and average Nusselt number are introduced for various Reynolds numbers
and volume fraction of nanoparticles.
KEY WORDS: Triangular duct, Transient state, Forced Convection, nanofluid, Constant Heat Flux,
I. INTRODUCTION
The increase of heat transfer coefficient is one of the most important technical aims for industry and researches. The
low thermal conductivity of conventional liquids such as water, oil, ethylene glycol etc. was major restriction for using
it. The heat transfer rate can passively be improved by changing flow geometry, boundary conditions or by enhancing
fluid thermo- physical properties.
consequently in recent years, add suspended nanoparticles(less than 100nm) sized will improve heat transfer ability
because these nanoparticles have a better thermal performance compared to pure liquids. The metallic nanoparticles
classify primary into two types, pure substance and oxides. Also, addition of these nanoparticles have no effect on
friction factor due to a tiny scale compared to millimeters or microns which alter flow profile causing considerable
increasing in pressure drop. So, nanofluids are more suitable for applications in which fluid flows through small
passages as nanoparticles are small enough to behave likewise to liquid molecules.
II. RELATED WORKS
some studies revealed that nanofluids heat transfer coefficient could be increased by more than 20% also in the case of
very low nanoparticles concentrations [1,2].actually, the reasons of such heat transfer improvement because the
thickness reduction of the thermal boundary layer due to the adding of the nanoparticles and the arbitrary movement
within the base fluid[3,4].
By increasing the nanofluid concentration, the heat transfer rate increases, because intensification of random motion
will attached by increasing of interface and collision ratio. Also diffusion and relative movement of particles near the

International Journal of Innovative Research in Science,
Engineering and Technology
(An ISO 3297: 2007 Certified Organization)
Vol. 3, Issue 8, August 2014
DOI: 10.15680/IJIRSET.2014.0308085
15704
ISSN: 2319-8753
wall leads to rapid heat transfer from wall to nanofluid. Use of nanofluids to augment the heat convection has some
profit such as [5]:
- At the same system efficiency , decreasing of apparatus size.
- Augmentation of heat transfer rate
- Reduction of time consuming
- Decreasing of thermal apparatus cost and size
- Enhancement of cooling efficiency for very small equipments such as microprocessor, heat pipes, Microchannels and
so on.
There are some articles available associated to investigation of convective heat transfer of nanofluids, most of them are
based on experimental works. Li and Xuan [6,7]. offered an experimental investigation to study the friction factor and
heat transfer coefficient of Cu/Water nanofluid up to 2%volume fraction An increasing in Nusselt number ratio (Nu
when using nanofluid to that of pure fluid) up to 60% appeared at using nanofluid at 2% volume fraction of Cu
according to their experimental results. Yang et al. [8]investigated experimentally effect of nanofluid on convective
heat transfer in a horizontal tube heat exchanger. Some of particular parameters such as volume concentration Re,
temperature and nanoparticles source on heat transfer have been studied. The results showed that direct increasing in
heat transfer coefficient accompanied with the Re and particle void ratio.
An experimental investigation of oxide nanofluid laminar flow convective heat transfer, in circular tube were studied
by Zeinali et al.[9,10] under constant heat flux. Results showed that Nusselt number increase when volume fraction
increase for all Reynolds number. Nassan et. Al.[11] investigated heat transfer characteristics through a noncircular
(square) cross-section duct in laminar flow experimentally. An effective augmentation of convective heat transfer
coefficient for both nanofluids has been used.
Many numerical studies were achieved by investigators. Xuan and Roetzel [12] investigated heat transfer rate
enhancement by adding nanoparticles. Results found that the nanofluid behaves more like a single-phase fluid because
the discontinuous phase consists of ultrafine particles.
Also, zeinali et al. [13] were studied laminar flow-forced convective heat transfer of Al2O3/water nanofluid in a
triangular duct under constant wall temperature condition numerically. Results showed that Nusselt number increases
with either increasing volume fraction or decreasing size of nanoparticles at the same concentration. Akbari et al. [14],
presented a fully developed laminar mixed convection in 3-D elliptic coordinate Numerically. single-phase model in
horizontal and inclined tubes with constant heat conducted. indicate that nanoparticles concentration have little effect
on the secondary flow and axial velocity profile heat transfer enhancement has been achieved by nanofluids compared
with base fluid.
ZeinaliHeris et al.[15] are presented numerical investigation on laminar forced convection in three different nanofluids,
flowing in a square cross-sectioned duct. Results proved that increase values of particle concentration is the main cause
of increasing in average heat transfer coefficient and Nusselt number. Moghari et al[16]estimated Heat transfer of a
mixed convection laminar nanofluid flow in an annulus. The calculated results show that at a given Re and Gr,
increasing nanoparticles volume fraction increases the Nusselt number at the inner and outer walls.
The main aim of this study is investigation of the transient behavior of fully, laminar flow forced convection with
various concentrations of nanoparticles and given Reynolds number on the heat transfer enhancement experimentally.
III. EXPERMENTAL SETUP
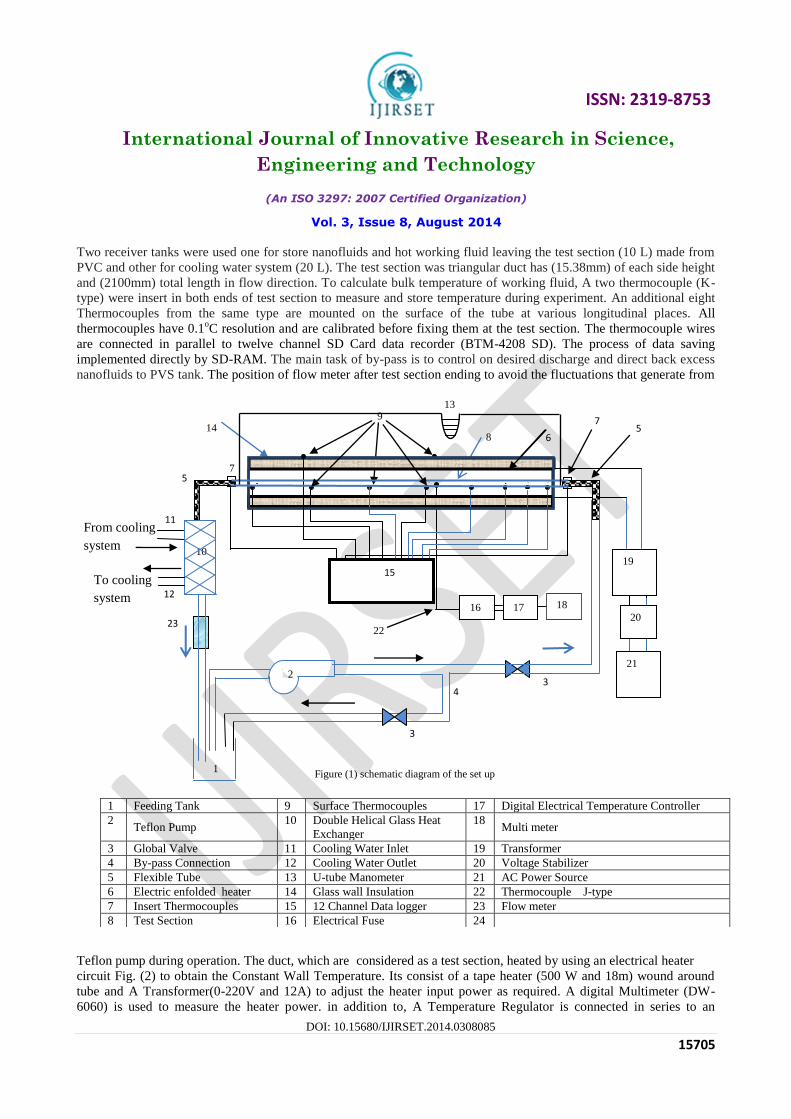
Fig.(1)shows the schematic of experimental setup configuration under consideration. The apparatus used in
this experiment consists of a reservoir tanks, Teflon pump, By-pass line, test section, flow meter, cold water circuit and
electrical heating circuit. The aim of using Teflon pump to prevent stick on nanoparticles with interior walls of pump.
International Journal of Innovative Research in Science,
Engineering and Technology
(An ISO 3297: 2007 Certified Organization)
Vol. 3, Issue 8, August 2014
DOI: 10.15680/IJIRSET.2014.0308085
15705
ISSN: 2319-8753
Two receiver tanks were used one for store nanofluids and hot working fluid leaving the test section (10 L) made from
PVC and other for cooling water system (20 L). The test section was triangular duct has (15.38mm) of each side height
and (2100mm) total length in flow direction. To calculate bulk temperature of working fluid, A two thermocouple (K-
type) were insert in both ends of test section to measure and store temperature during experiment. An additional eight
Thermocouples from the same type are mounted on the surface of the tube at various longitudinal places. All
thermocouples have 0.1oC resolution and are calibrated before fixing them at the test section. The thermocouple wires
are connected in parallel to twelve channel SD Card data recorder (BTM-4208 SD). The process of data saving
implemented directly by SD-RAM. The main task of by-pass is to control on desired discharge and direct back excess
nanofluids to PVS tank. The position of flow meter after test section ending to avoid the fluctuations that generate from
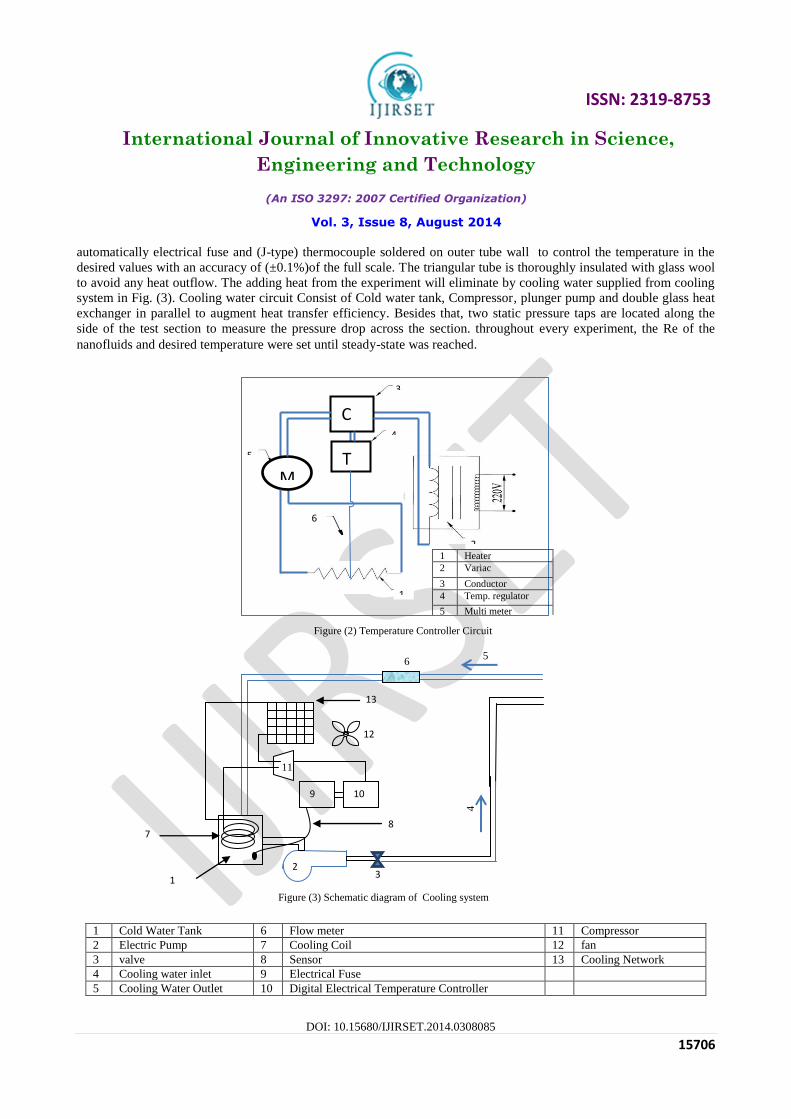
Teflon pump during operation. The duct, which are considered as a test section, heated by using an electrical heater
circuit Fig. (2) to obtain the Constant Wall Temperature. Its consist of a tape heater (500 W and 18m) wound around
tube and A Transformer(0-220V and 12A) to adjust the heater input power as required. A digital Multimeter (DW-
6060) is used to measure the heater power. in addition to, A Temperature Regulator is connected in series to an
1 Feeding Tank 9 Surface Thermocouples 17 Digital Electrical Temperature Controller
2 Teflon Pump
10 Double Helical Glass Heat
Exchanger
18 Multi meter
3 Global Valve 11 Cooling Water Inlet 19 Transformer
4 By-pass Connection 12 Cooling Water Outlet 20 Voltage Stabilizer
5 Flexible Tube 13 U-tube Manometer 21 AC Power Source
6 Electric enfolded heater 14 Glass wall Insulation 22 Thermocouple J-type
7 Insert Thermocouples 15 12 Channel Data logger 23 Flow meter
8 Test Section 16 Electrical Fuse 24
12
7
7
22
21
19
4
3
3
8 14
6
9
1
10
23
18 16 17
. . . . . .
15
2
13
5
5
11
20
To cooling
system
From cooling
system
Figure (1) schematic diagram of the set up
International Journal of Innovative Research in Science,
Engineering and Technology
(An ISO 3297: 2007 Certified Organization)
Vol. 3, Issue 8, August 2014
DOI: 10.15680/IJIRSET.2014.0308085
15706
ISSN: 2319-8753
automatically electrical fuse and (J-type) thermocouple soldered on outer tube wall to control the temperature in the
desired values with an accuracy of (±0.1%)of the full scale. The triangular tube is thoroughly insulated with glass wool
to avoid any heat outflow. The adding heat from the experiment will eliminate by cooling water supplied from cooling
system in Fig. (3). Cooling water circuit Consist of Cold water tank, Compressor, plunger pump and double glass heat
exchanger in parallel to augment heat transfer efficiency. Besides that, two static pressure taps are located along the
side of the test section to measure the pressure drop across the section. throughout every experiment, the Re of the
nanofluids and desired temperature were set until steady-state was reached.
6
3
4
5
1
7
2
9 10
11
8
13
12
1 Cold Water Tank 6 Flow meter 11 Compressor
2 Electric Pump 7 Cooling Coil 12 fan
3 valve 8 Sensor 13 Cooling Network
4 Cooling water inlet 9 Electrical Fuse
5 Cooling Water Outlet 10 Digital Electrical Temperature Controller
Figure (3) Schematic diagram of Cooling system
Figure (2) Temperature Controller Circuit
5 T
C
M
3
2
1
4
6
1 Heater
2 Variac
3 Conductor
4 Temp. regulator
5 Multi meter
6 Sensor
International Journal of Innovative Research in Science,
Engineering and Technology
(An ISO 3297: 2007 Certified Organization)
Vol. 3, Issue 8, August 2014
DOI: 10.15680/IJIRSET.2014.0308085
15707
ISSN: 2319-8753
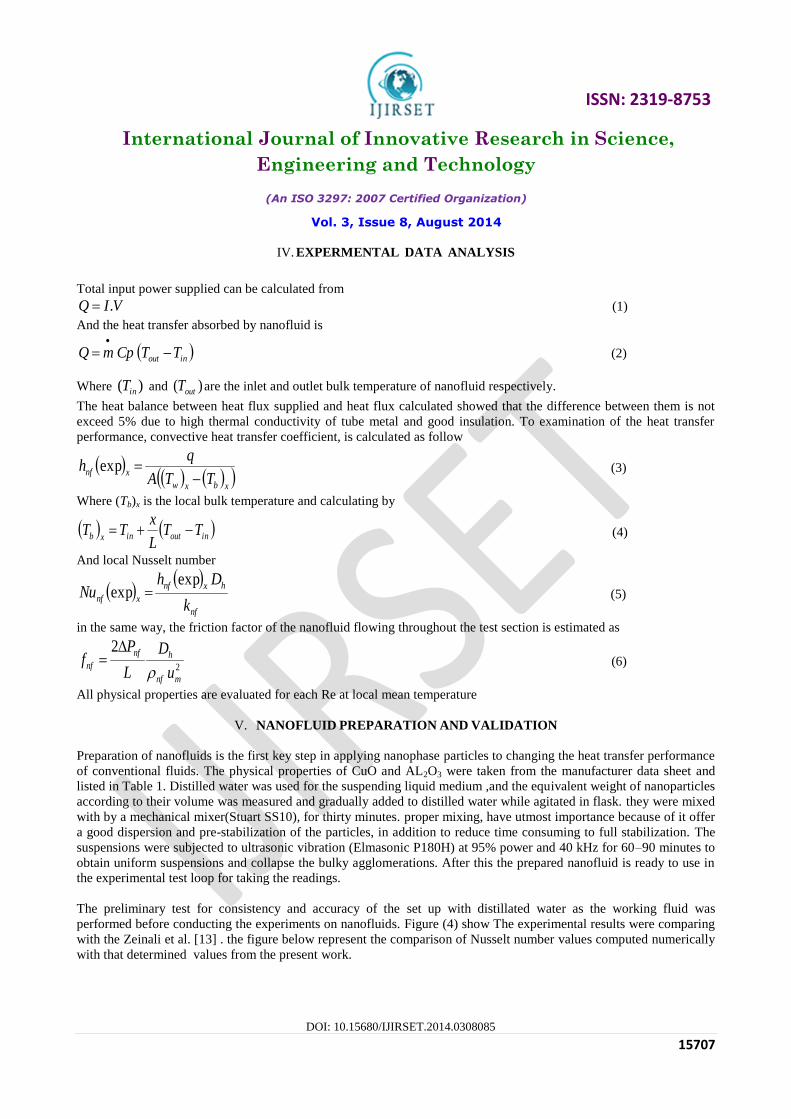
IV. EXPERMENTAL DATA ANALYSIS
Total input power supplied can be calculated from
VIQ . (1)
And the heat transfer absorbed by nanofluid is
inout TTCpmQ
(2)
Where )( inT and )( outT are the inlet and outlet bulk temperature of nanofluid respectively.
The heat balance between heat flux supplied and heat flux calculated showed that the difference between them is not
exceed 5% due to high thermal conductivity of tube metal and good insulation. To examination of the heat transfer
performance, convective heat transfer coefficient, is calculated as follow
xbxw
xnfTTA
qh
exp (3)
Where (Tb)x is the local bulk temperature and calculating by
inoutinxb TTL
xTT (4)
And local Nusselt number
nf
hxnf
xnfk
DhNu
expexp (5)
in the same way, the friction factor of the nanofluid flowing throughout the test section is estimated as
2
2
mnf
hnf
nfu
D
L
Pf
(6)
All physical properties are evaluated for each Re at local mean temperature
V. NANOFLUID PREPARATION AND VALIDATION
Preparation of nanofluids is the first key step in applying nanophase particles to changing the heat transfer performance
of conventional fluids. The physical properties of CuO and AL2O3 were taken from the manufacturer data sheet and
listed in Table 1. Distilled water was used for the suspending liquid medium ,and the equivalent weight of nanoparticles
according to their volume was measured and gradually added to distilled water while agitated in flask. they were mixed
with by a mechanical mixer(Stuart SS10), for thirty minutes. proper mixing, have utmost importance because of it offer
a good dispersion and pre-stabilization of the particles, in addition to reduce time consuming to full stabilization. The
suspensions were subjected to ultrasonic vibration (Elmasonic P180H) at 95% power and 40 kHz for 60–90 minutes to
obtain uniform suspensions and collapse the bulky agglomerations. After this the prepared nanofluid is ready to use in
the experimental test loop for taking the readings.
The preliminary test for consistency and accuracy of the set up with distillated water as the working fluid was
performed before conducting the experiments on nanofluids. Figure (4) show The experimental results were comparing
with the Zeinali et al. [13] . the figure below represent the comparison of Nusselt number values computed numerically
with that determined values from the present work.

International Journal of Innovative Research in Science,
Engineering and Technology
(An ISO 3297: 2007 Certified Organization)
Vol. 3, Issue 8, August 2014
DOI: 10.15680/IJIRSET.2014.0308085
15708
ISSN: 2319-8753
VI. PROPERTIES OF NANOFLUID
To calculate the flow field, the physical and thermal properties of nanofluids such as the density, specific heat, thermal
conductivity and viscosity should be determined first based on the single phase model. All necessary properties of
water and nanoparticles are listed in table(1).
-density pfnf 1 (7)
-heat capacity pfnf CpCpCp 1 (8)
-thermal conductivity pffp
pffp
f
nf
kkkk
kkkk
k
k
2
22 (9)
-viscosity 5.21
f
nf (10)
The volume fraction of the nanofluid can be formulate as:
ffpp
pp
mm
m
nanofluidofvolume
particalesofvolume
(11)
Properties water Al2O3 CuO
Density (Kg/m3) 998.2 3880 6500
Thermal Conductivity (W/m.k) 0.597 36 400
Heat Capacity (J/Kg.k) 4182 773 383
Viscosity () 993E-6 ــــــــــــــــ ــــــــــــــــ
2
2.5
3
3.5
4
4.5
5
0 500 1000 1500 2000 2500
Zeinali et al.
present work
Nu
Fig.(4) Comparison between estimated results and results defined by model predictions of zeinali [13]
defined by Shah and London [31].
Re
Table (1). Thermal physical properties of water and nanofluid at T=2980K
International Journal of Innovative Research in Science,
Engineering and Technology
(An ISO 3297: 2007 Certified Organization)
Vol. 3, Issue 8, August 2014
DOI: 10.15680/IJIRSET.2014.0308085
15709
ISSN: 2319-8753
TT=298oK
VII. RESULTS AND DISCUSSION
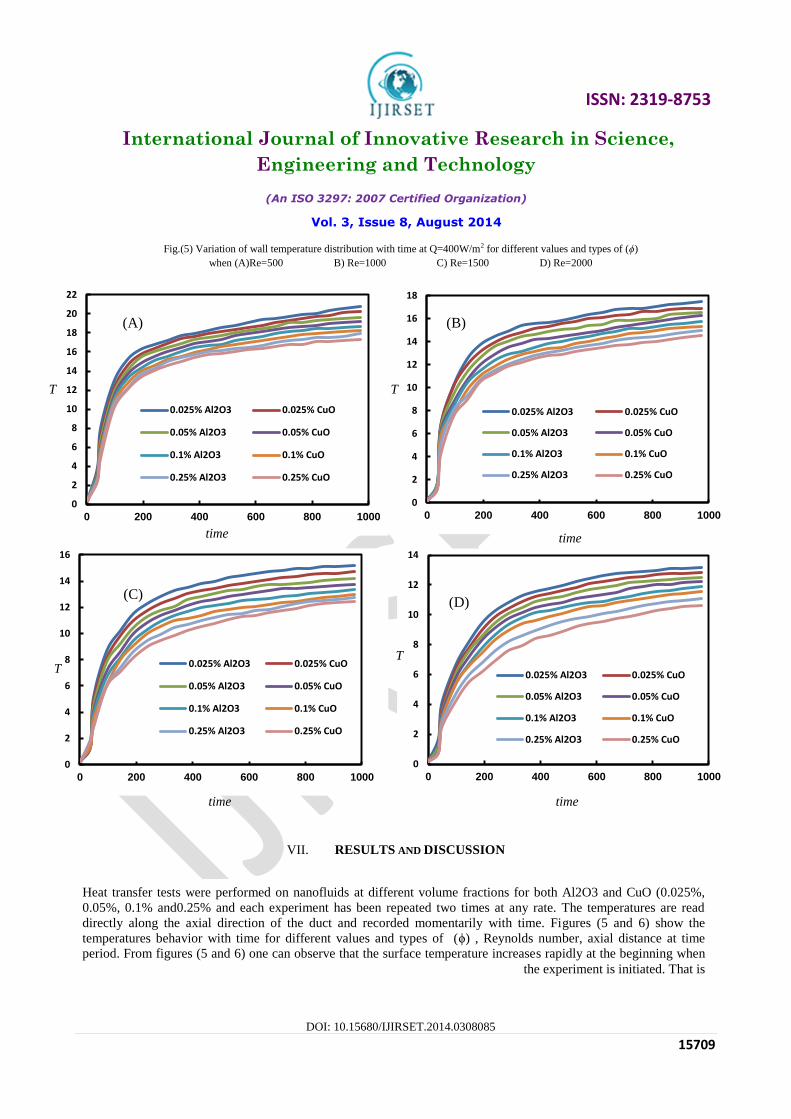
Fig.(5) Variation of wall temperature distribution with time at Q=400W/m2 for different values and types of (ϕ)
when (A)Re=500 B) Re=1000 C) Re=1500 D) Re=2000
0
2
4
6
8
10
12
14
16
18
0 200 400 600 800 1000
0.025% Al2O3 0.025% CuO
0.05% Al2O3 0.05% CuO
0.1% Al2O3 0.1% CuO
0.25% Al2O3 0.25% CuO
0
2
4
6
8
10
12
14
16
18
20
22
0 200 400 600 800 1000
0.025% Al2O3 0.025% CuO
0.05% Al2O3 0.05% CuO
0.1% Al2O3 0.1% CuO
0.25% Al2O3 0.25% CuO
0
2
4
6
8
10
12
14
0 200 400 600 800 1000
0.025% Al2O3 0.025% CuO
0.05% Al2O3 0.05% CuO
0.1% Al2O3 0.1% CuO
0.25% Al2O3 0.25% CuO
0
2
4
6
8
10
12
14
16
0 200 400 600 800 1000
0.025% Al2O3 0.025% CuO
0.05% Al2O3 0.05% CuO
0.1% Al2O3 0.1% CuO
0.25% Al2O3 0.25% CuO
(A) (B)
(C) (D)
time time
time time
T
T T
T
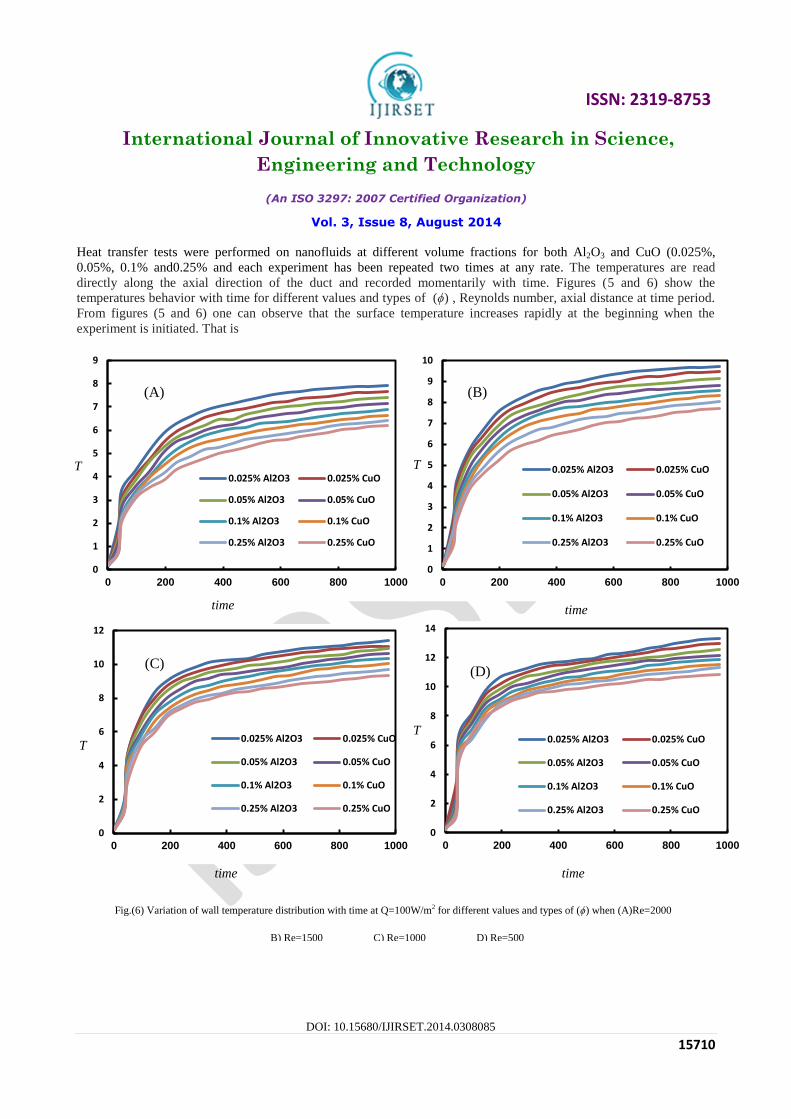
Heat transfer tests were performed on nanofluids at different volume fractions for both Al2O3 and CuO (0.025%,
0.05%, 0.1% and0.25% and each experiment has been repeated two times at any rate. The temperatures are read
directly along the axial direction of the duct and recorded momentarily with time. Figures (5 and 6) show the
temperatures behavior with time for different values and types of (ϕ) , Reynolds number, axial distance at time
period. From figures (5 and 6) one can observe that the surface temperature increases rapidly at the beginning when
the experiment is initiated. That is
International Journal of Innovative Research in Science,
Engineering and Technology
(An ISO 3297: 2007 Certified Organization)
Vol. 3, Issue 8, August 2014
DOI: 10.15680/IJIRSET.2014.0308085
15710
ISSN: 2319-8753
Heat transfer tests were performed on nanofluids at different volume fractions for both Al2O3 and CuO (0.025%,
0.05%, 0.1% and0.25% and each experiment has been repeated two times at any rate. The temperatures are read
directly along the axial direction of the duct and recorded momentarily with time. Figures (5 and 6) show the
temperatures behavior with time for different values and types of (ϕ) , Reynolds number, axial distance at time period. From figures (5 and 6) one can observe that the surface temperature increases rapidly at the beginning when the
experiment is initiated. That is
0
1
2
3
4
5
6
7
8
9
0 200 400 600 800 1000
0.025% Al2O3 0.025% CuO
0.05% Al2O3 0.05% CuO
0.1% Al2O3 0.1% CuO
0.25% Al2O3 0.25% CuO
0
1
2
3
4
5
6
7
8
9
10
0 200 400 600 800 1000
0.025% Al2O3 0.025% CuO
0.05% Al2O3 0.05% CuO
0.1% Al2O3 0.1% CuO
0.25% Al2O3 0.25% CuO
0
2
4
6
8
10
12
0 200 400 600 800 1000
0.025% Al2O3 0.025% CuO
0.05% Al2O3 0.05% CuO
0.1% Al2O3 0.1% CuO
0.25% Al2O3 0.25% CuO
0
2
4
6
8
10
12
14
0 200 400 600 800 1000
0.025% Al2O3 0.025% CuO
0.05% Al2O3 0.05% CuO
0.1% Al2O3 0.1% CuO
0.25% Al2O3 0.25% CuO
time time
time time
(A) (B)
(C) (D)
Fig.(6) Variation of wall temperature distribution with time at Q=100W/m2 for different values and types of (ϕ) when (A)Re=2000
B) Re=1500 C) Re=1000 D) Re=500
T
T
T
T
International Journal of Innovative Research in Science,
Engineering and Technology
(An ISO 3297: 2007 Certified Organization)
Vol. 3, Issue 8, August 2014
DOI: 10.15680/IJIRSET.2014.0308085
15711
ISSN: 2319-8753
because of the high difference between initial wall temperature and that generated by applying heat flux and the direct
contact between the heat source and the outer surface of the duct. The temperature profiles in figures (5) and (6) show
gradual decreasing of temperatures distribution with time. Moreover, the temperatures distribution is disproportional to
the value of (ϕ). This fact can be seen clearly with low Reynolds numbers due to low fluid velocity.
The considerable augmentation of heat reduction on walls can be explained due to continued impact and reflection of
particles with the wall during motion. The particle itself conveys small amount of heat from the all and takes it back to
the bulk. This semi-repeated process causes continued heat transfer from duct-wall to the fluid. It is worthy to mention
that adding small amount of nanoparticles to the fluid would significantly increase the heat transfer in general.
35
40
45
50
55
60
65
0 0.2 0.4 0.6 0.8 1
(ϕ)=0 (ϕ)=0.025% AL2O3 (ϕ)=0.025% CuO (ϕ)=0.05% AL2O3 (ϕ)=0.05% CuO (ϕ)=0.1% AL2O3 (ϕ)=0.1% CuO
15
20
25
30
35
40
45
50
0 0.2 0.4 0.6 0.8 1 1.2
(ϕ)=0 (ϕ)=0.025% AL2O3 (ϕ)=0.025% CuO (ϕ)=0.05% AL2O3 (ϕ)=0.05% CuO (ϕ)=0.1% AL2O3 (ϕ)=0.1% CuO
10
15
20
25
30
35
40
0 0.2 0.4 0.6 0.8 1
(ϕ)=0 (ϕ)=0.025% AL2O3 (ϕ)=0.025% CuO (ϕ)=0.05% AL2O3 (ϕ)=0.05% CuO (ϕ)=0.1% AL2O3 (ϕ)=0.1% CuO
0
5
10
15
20
25
30
35
0 0.2 0.4 0.6 0.8 1
(ϕ)=0 (ϕ)=0.025% AL2O3 (ϕ)=0.025% CuO (ϕ)=0.05% AL2O3 (ϕ)=0.05% CuO (ϕ)=0.1% AL2O3
X X
X X
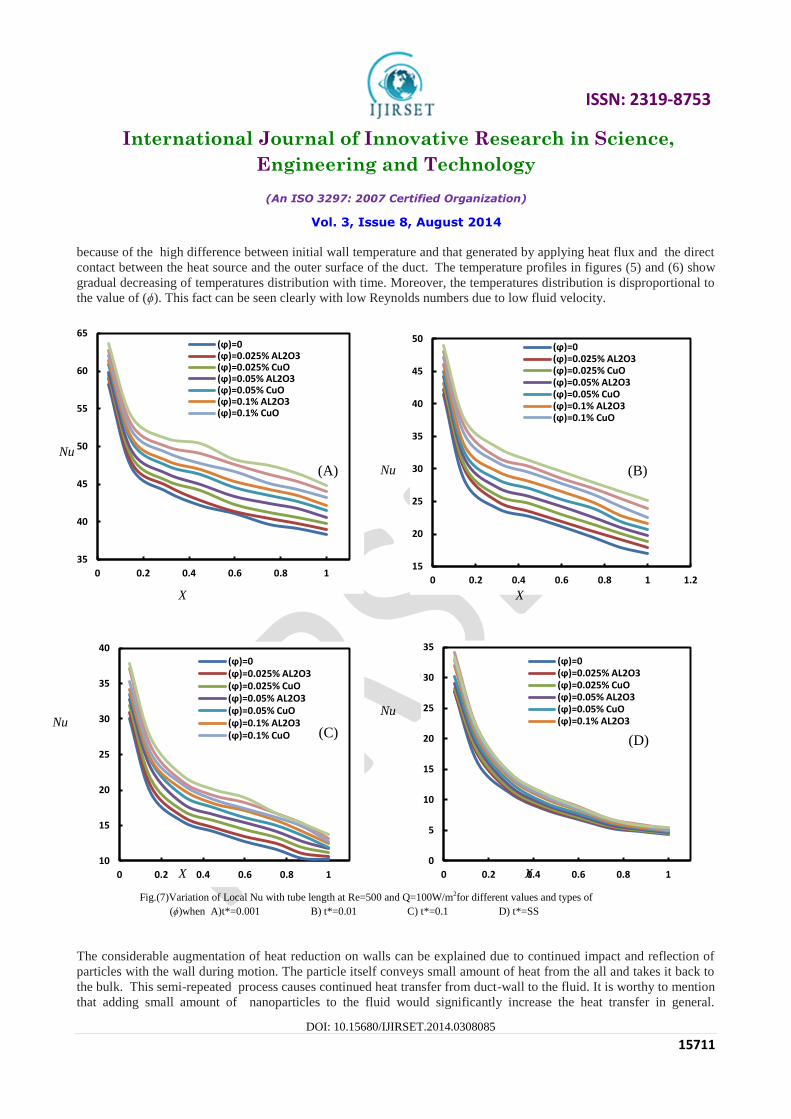
Fig.(7)Variation of Local Nu with tube length at Re=500 and Q=100W/m2for different values and types of
(ϕ)when A)t*=0.001 B) t*=0.01 C) t*=0.1 D) t*=SS
(A) (B)
(C) (D)
Nu
Nu
Nu
Nu

International Journal of Innovative Research in Science,
Engineering and Technology
(An ISO 3297: 2007 Certified Organization)
Vol. 3, Issue 8, August 2014
DOI: 10.15680/IJIRSET.2014.0308085
15712
ISSN: 2319-8753
Moreover, the figures (5) and (6) provide a proof that increasing heat flux only with fixing the rest of the parameters
causes increasing of (Tw).
Figures (7) and (8) show the experimental results for the variation of local Nusselt number against the length
of channel at constant Re. When the flow starts, the difference between the wall and nanofluid temperatures is
maximum and hence, the Nu is maximum. Thereafter, the temperature differences becomes smaller continuously till
the temperature difference comes to fixed value which represents the steady state condition. In general, for both
nanofluids types Nu increases proportionally to the amount of loaded particles with comparison to base fluid. This fact
is due to the following . Firstly, the nanofluid with suspended nanoparticles increases the thermal conductivity of the
mixture.
Fig.(8)Variation of Local Nu with tube length at Re=2000 and Q=100W/m2for different values and types of (ϕ)when
A)t*=0.001 B) t*=0.01 C) t*=0.1 D) t*=SS
International Journal of Innovative Research in Science,
Engineering and Technology
(An ISO 3297: 2007 Certified Organization)
Vol. 3, Issue 8, August 2014
DOI: 10.15680/IJIRSET.2014.0308085
15713
ISSN: 2319-8753
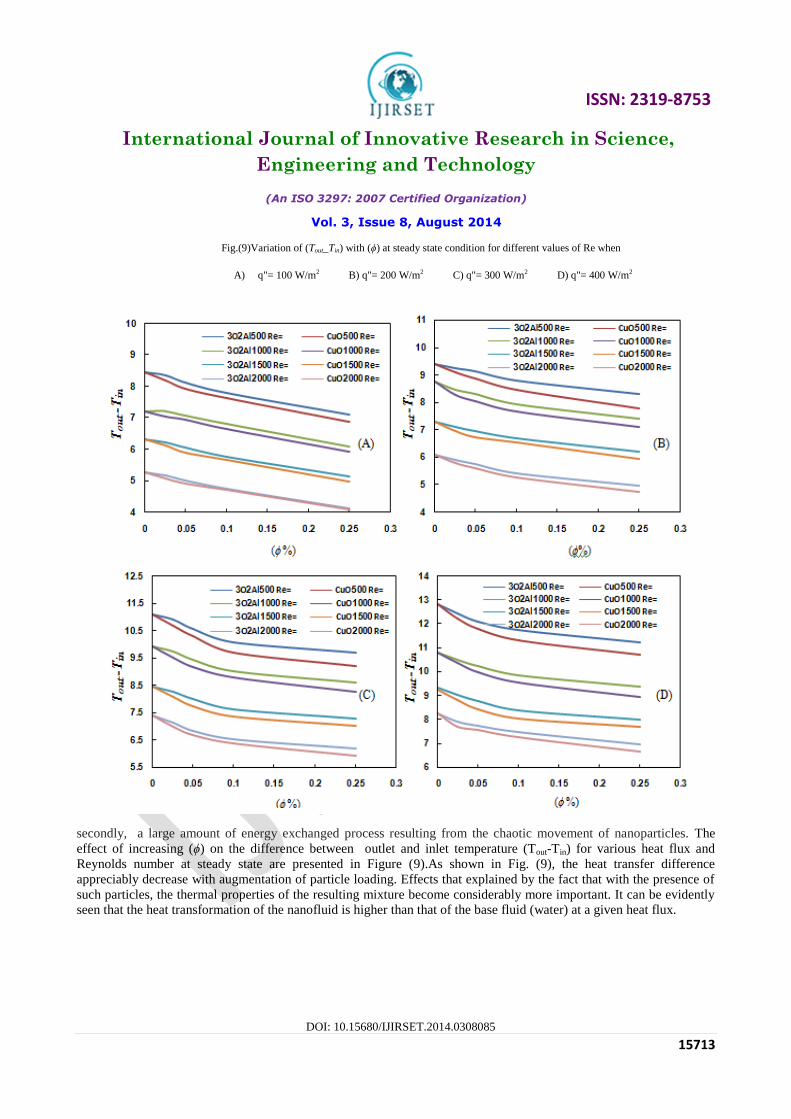
secondly, a large amount of energy exchanged process resulting from the chaotic movement of nanoparticles. The
effect of increasing (ϕ) on the difference between outlet and inlet temperature (Tout-Tin) for various heat flux and
Reynolds number at steady state are presented in Figure (9).As shown in Fig. (9), the heat transfer difference
appreciably decrease with augmentation of particle loading. Effects that explained by the fact that with the presence of
such particles, the thermal properties of the resulting mixture become considerably more important. It can be evidently
seen that the heat transformation of the nanofluid is higher than that of the base fluid (water) at a given heat flux.
Fig.(9)Variation of (Tout_Tin) with (ϕ) at steady state condition for different values of Re when
A) q"= 100 W/m2 B) q"= 200 W/m2 C) q"= 300 W/m2 D) q"= 400 W/m2
International Journal of Innovative Research in Science,
Engineering and Technology
(An ISO 3297: 2007 Certified Organization)
Vol. 3, Issue 8, August 2014
DOI: 10.15680/IJIRSET.2014.0308085
15714
ISSN: 2319-8753
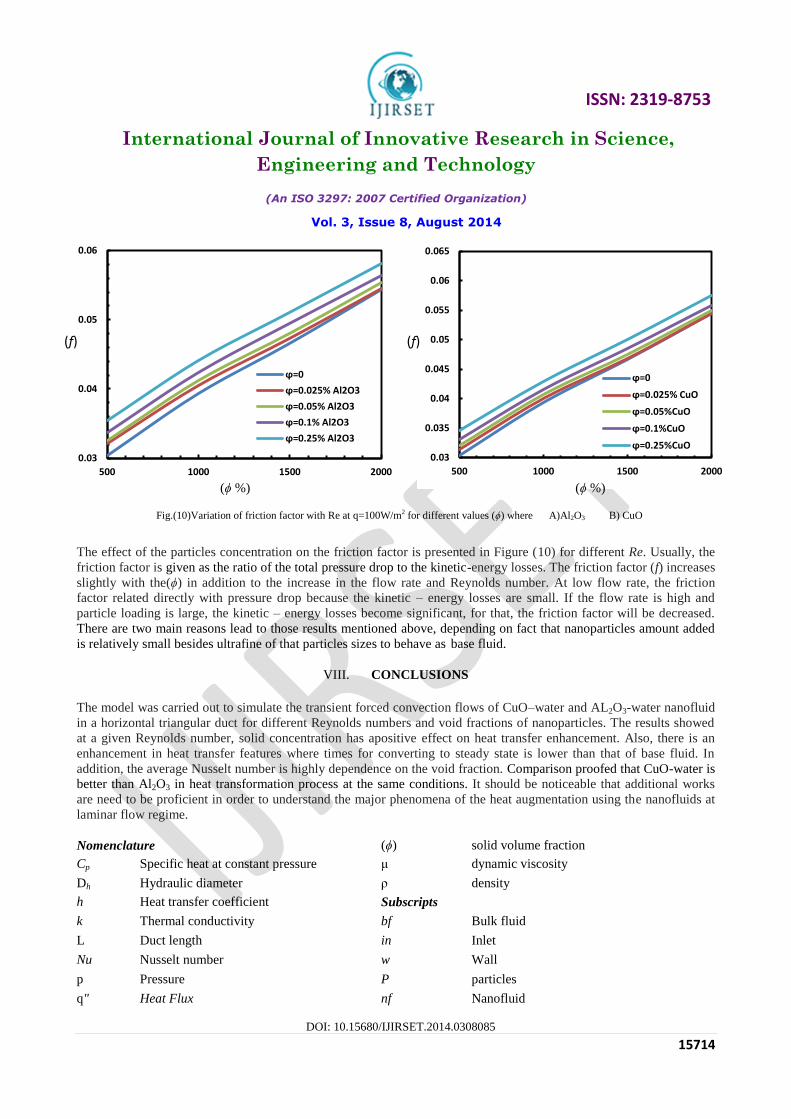
The effect of the particles concentration on the friction factor is presented in Figure (10) for different Re. Usually, the
friction factor is given as the ratio of the total pressure drop to the kinetic-energy losses. The friction factor (f) increases
slightly with the(ϕ) in addition to the increase in the flow rate and Reynolds number. At low flow rate, the friction
factor related directly with pressure drop because the kinetic – energy losses are small. If the flow rate is high and
particle loading is large, the kinetic – energy losses become significant, for that, the friction factor will be decreased.
There are two main reasons lead to those results mentioned above, depending on fact that nanoparticles amount added
is relatively small besides ultrafine of that particles sizes to behave as base fluid.
VIII. CONCLUSIONS
The model was carried out to simulate the transient forced convection flows of CuO–water and AL2O3-water nanofluid
in a horizontal triangular duct for different Reynolds numbers and void fractions of nanoparticles. The results showed
at a given Reynolds number, solid concentration has apositive effect on heat transfer enhancement. Also, there is an
enhancement in heat transfer features where times for converting to steady state is lower than that of base fluid. In
addition, the average Nusselt number is highly dependence on the void fraction. Comparison proofed that CuO-water is
better than Al2O3 in heat transformation process at the same conditions. It should be noticeable that additional works
are need to be proficient in order to understand the major phenomena of the heat augmentation using the nanofluids at
laminar flow regime.
Nomenclature (ϕ)
solid volume fraction
Cp Specific heat at constant pressure μ dynamic viscosity
Dh Hydraulic diameter ρ density
h Heat transfer coefficient Subscripts
k Thermal conductivity bf Bulk fluid
L Duct length in Inlet
Nu Nusselt number w Wall
p Pressure P particles
q" Heat Flux nf Nanofluid
0.03
0.04
0.05
0.06
500 1000 1500 2000
ϕ=0
ϕ=0.025% Al2O3
ϕ=0.05% Al2O3
ϕ=0.1% Al2O3
ϕ=0.25% Al2O3
0.03
0.035
0.04
0.045
0.05
0.055
0.06
0.065
500 1000 1500 2000
ϕ=0
ϕ=0.025% CuO
ϕ=0.05%CuO
ϕ=0.1%CuO
ϕ=0.25%CuO
(f) (f)
Fig.(10)Variation of friction factor with Re at q=100W/m2 for different values (ϕ) where A)Al2O3 B) CuO
(ϕ %) (ϕ %)

International Journal of Innovative Research in Science,
Engineering and Technology
(An ISO 3297: 2007 Certified Organization)
Vol. 3, Issue 8, August 2014
DOI: 10.15680/IJIRSET.2014.0308085
15715
ISSN: 2319-8753
Re Reynolds number x Local position
T Temperature o Outlet
t Time Abbreviations
Greek symbols CHF Constant Heat Flux
α thermal diffusivity SS Steady State
REFRENCES
[1] Li, Q., and Xuan, Y. “Heat transfer enhancement of nanofluids”, International Journal of Heat and Fluid Flow, Vol.21, pp.58–64, 2000. [2] Kang, H.U., Kim, S.H., and Oh, J.M., “Estimation of thermal conductivity of nanofluid using experimental effective particle volume”,
Experimental Heat Transfer Vol.9, pp.181–191, 2006
[3] Trisakasri, V., and Wongwises, S., “Critical review of heat transfer characteristic of nanofluids”, Renewable and sustainable energy reviews, Vol.11, pp.512–523, 2007.
[4] Daungthongsuk, W., and Wongwises, S., “A critical review of convective heat transfer of nanofluids”, Renewable and sustainable energy
reviews, Vol.11, pp.797–817, 2007. [5] Jung, J.Y., Oh, H.S., and Kwak, H.Y., “Forced convective heat transfer of nanofluids in microchannels,” International Journal of Heat and Mass
Transfer, Vol.52, pp.466–472, 2009.
[6] Li, Q., and Xuan, Y., “Convective heat transfer and flow characteristic of Cu–Water nanofluid”, Science in China, Series E, Vol.45, pp.408–416, 2004.
[7] Xuan, Y., and Li, Q., “Investigation on convective heat transfer and flow features of nanofluids”, ASME Journal of Heat Transfer, Vol.125,
pp.151–155, 2003. [8] Yang, Y., Zhang, Z.G., Grulke, E.A., Anderson, W.B., and Wu, G. “Heat transfer properties of nanoparticle in fluid dispersions in laminar flow”,
International Journal of Heat and Mass Transfer Vol.48, pp.1107–1116, 2005.
[9] ZeinaliHeris, S., Etemad, SGh., Nasr Esfahany, M. “Experimental investigation of oxide nanofluid laminar flow convective heat transfer in
circular tube”, International Communication in Heat and Mass Transfer, Vol.33, pp. 529–533, 2006.
[10] ZeinaliHeris, S., Nasr Esfahany, M., Etemad, SGh., “Experimental investigation of convective heat transfer of Al2O3/Water nanofluid in
circular tube”, International Journal of Heat and Fluid Flow, Vol.28, pp.203–210, 2007 [11] Nassan, T.H., Zeinali Heris, S., and Noie, S.H., “A comparison of experimental heat transfer characteristics for Al2O3/water and CuO/water
nanofluids in square cross-section duct”, International Communications in Heat and Mass Transfer Vol.37, pp.924-928, 2010. [12] Yimin Xuana, and Wilfried Roetzel, “Conceptions for heat transfer correlation of nanofluids”, International Journal of Heat and Mass Transfer,
Vol.43, pp.3701-3707, 2000.
[13] Saeed Zeinali Heris, Seyyed Hossein Noie, Elham Talaii, and Javad Sargolzaei, “Numerical investigation of Al2O3/water nanofluid laminar convective heat transfer through triangular ducts”, Nanoscale Research Letters,Vol.6, pp.179-188, 2011.
[14] ] Akbari, M., Galanis N., and Behzadmehr, A., “Comparative analysis of single and two-phase models for CFD studies of nanofluid heat
transfer”, International Journal of Thermal Sciences, Vol.50, pp.1343-1354, 2011.