vocational education in kenya - a randomized evaluation · · 2016-06-09vocational education in...
TRANSCRIPT

Vocational Education in Kenya - A Randomized Evaluation
Joan Hamory Hicks, University of California, Berkeley CEGA
Michael Kremer, Harvard University
Isaac Mbiti, University of Virginia
Edward Miguel*, University of California, Berkeley
Grantee Final Report
Accepted by 3ie: May 2015

2
Note to readers
This impact evaluation has been submitted in partial fulfilment of the requirements of
grant OW1.64 issued under open window 1.This version is being published online as it
was received. A copy-edited and formatted version will be produced in the near future.
All content is the sole responsibility of the authors and does not represent the opinions
of 3ie, its donors or its board of commissioners. Any errors and omissions are the sole
responsibility of the authors. All affiliations of the authors listed in the title page are
those that were in effect at the time the report was accepted.
Suggested citation: Hamory, J, Kremer, M, Mbiti, I and Miguel, E 2015. Vocational
Education in Kenya - A Randomized Evaluation, 3ie Grantee Final Report. New Delhi:
International Initiative for Impact Evaluation (3ie)
Funding for this impact evaluation was provided by 3ie’s donors, which include UKaid,
the Bill & Melinda Gates Foundation, Hewlett Foundation and 12 other 3ie members
that provide institutional support. A complete listing is provided on the 3ie website.

3
Abstract
This report describes a vocational training program among Kenyan youth and provides results from
the intervention. Implementation began in 2008 with the recruitment of 2,163 out-of-school youths
(ranging in age from roughly 17 to 28). A random half of these individuals were awarded a voucher
for vocational training, while the other half served as the control group. Of the voucher winners, a
random half were awarded a voucher that could only be used in public (government) institutions,
while the other half received a voucher that could be used in either private or public institutions.
The program also included a crosscutting information intervention, which exposed a randomly
selected half of all treatment and control individuals to information about the actual returns to
vocational education. We find that voucher winners were substantially more likely to enroll in
vocational education institutions and were able to acquire an additional 0.55 years of education.
The information treatment encouraged women to prefer and ultimately enroll in traditionally male-
dominated trades but did not affect overall educational attainment for either gender. We find
limited evidence that the program increased earnings, although the program led to a significant
increase in hourly wage earnings among wage earners. Furthermore, there is some evidence that
the program increased the likelihood of working in wage employment among those who have been
out of school longer.
*Hicks: University of California, Berkeley CEGA; Kremer: Harvard University and NBER; Mbiti: University of
Virginia; Miguel: University of California, Berkeley and NBER. We gratefully acknowledge financial support from
the Berkeley Population Center, the International Growth Centre (IGC), the International Initiative for Impact
Evaluation (3IE) / Global Development Network, the National Institutes of Health (award #R03HD064888 and
#2R01HD044475 from the Eunice Kennedy Shriver National Institute of Child Health & Human Development), the
National Science Foundation (award #SES-0962614), and the World Bank Bank-Netherlands Partnership Program
(BNPP), Spanish Impact Evaluation Fund (SIEF) and Gender Action Plan (GAP). We are grateful to Shobhana Sosale
for her encouragement, support, and useful comments and suggestions throughout this project. We are also grateful to
David Evans, Markus Goldstein, Hiroyuki Hino, Arianna Legovini, and Michael Mills for their support. Vedika Ahuja,
Kevin Audi, Pierre Bachas, Elisa Cascardi, Lisa Chen, Evan DeFilippis, Lauren Falcao, Felipe Gonzalez, Jonas Hjort,
Gerald Ipapa, Maryam Janani, Anne Karing, Jennifer Kwok, Gregory Lane, Andrew Fischer Lees, Joseph Liss, Leah
Luben, Jamie McCasland, Ian McDonough, Owen Ozier, Kristianna Post, Adina Rom, Jonathan Schellenberg,
Sebastian Stumpner, Paula Vinchery, Zachary Wagner, and Michael Walker provided exceptional research,
managerial, organizational, and/or implementation assistance. The project was implemented and managed in
collaboration with Innovations for Poverty Action-Kenya (IPAK). We are grateful for the superb effort of the field
staff led by Blastus Bwire, Charles Asoka, Benard Onyango, and Esther Isokat, and the management and support staff
at IPAK. The content is solely the responsibility of the authors, and does not necessarily represent the official views
of the Berkeley Population Center, Innovations for Poverty Action, the International Growth Centre, the International
Initiative for Impact Evaluation / Global Development Network, the Eunice Kennedy Shriver National Institute of
Health & Human Development, the National Institutes of Health, the National Science Foundation, or the World Bank.

4
1. Introduction
Youth unemployment is one of the most critical social and economic problems facing less
developed countries in recent years (World Bank, 2007). Kenya, like many African countries,
suffers from high youth unemployment. According to the 2005 Kenya Integrated Household
Budget Survey, approximately 21% of youths aged 15-29 are unemployed, and a further 25% are
neither in school nor working (Republic of Kenya, 2007). This is a critical problem given that
individuals in this age group compose 30% of the country’s population. Furthermore, high
unemployment can have adverse social and economic consequences: it has been suggested that the
majority of violent acts during the 2007 post-election crisis in Kenya were perpetrated by
underemployed youth (World Bank, 2008).
Despite the importance of youth unemployment, little is known about how best to facilitate
the transition of youth from school to the labor market in less developed countries, or how to
provide marketable skills for youth not on the academic schooling track. Vocational education
provides a promising opportunity for addressing the problem. The 2007 World Development
Report emphasizes that “second-chance” schooling programs are crucial for countries like Kenya,
given high drop-out rates from primary school and limited primary to secondary school transition
rates (World Bank, 2007). Proponents of vocational education argue that such training can deliver
more readily-marketable skills to these youth, and therefore offer an attractive alternative to
traditional schooling that could smooth the school-to-work transition for those leaving the
academic schooling track. However, there is limited rigorous empirical evidence on the
effectiveness of vocational training in developing countries.
This report describes a vocational training intervention among Kenyan youth and details
results of the intervention. This program aims to understand the mechanisms through which
vocational education can address the widespread problem of youth underemployment in Kenya,
using a multi-faceted randomized evaluation design together with an innovative panel dataset. In
particular, through randomized provision of vocational training vouchers to program applicants,
the program permits an evaluation of the effects of vocational education on formal sector
employment and labor market earnings, participation in the informal and agricultural sectors,
entrepreneurship decisions, and a range of other life outcomes in a sample of nearly 2,200 Kenyan
youth. The design of the program further allows for an estimation of how these effects vary by type
(e.g., public versus private) of institution attended, as well as across individuals with different

5
baseline characteristics. In addition, the use of a novel randomized information intervention
permits estimation of the role that information on labor market returns to vocational training plays
in the demand for vocational education in Kenya.
While there is some existing evidence of the benefits of vocational education in Kenya
(e.g., Nishimura and Orodho, 1999), the majority of rigorous evaluation in less developed countries
has focused in Latin America. In a pair of papers, Angrist et al. (2002, 2006) examine Colombia’s
lottery program of providing vouchers to allow students to attend private secondary schools
(including vocational training institutions and other schools with vocational training curricula),
and find that it was very cost effective. Bettinger, Kremer, and Saavedra (2010) find that the
greatest impact of this program was in the private vocational sector, and suggest that this may be
due to private vocational schools being more successful than public schools at producing
employable graduates, especially for jobs in Colombia’s rapidly growing service sector. However,
it is not possible to attribute the effect of the program solely to private versus public vocational
education since different sets of people apply to (or are accepted to) different types of institutions.
The Kenyan program we study explicitly permits study of the impact of public and private
vocational education courses using randomized evaluation methods.
Card et al. (2011) show that a randomized Dominican Republic job-training program had
a significant positive impact on individuals’ hourly wages and on the probability of health
insurance coverage (conditional on employment), although overall effects were moderate. The
authors uncover heterogeneous returns to vocational training for those with different levels of
educational achievement, across urban and rural areas, and age. Attanasio, Kugler, and Meghir
(2012) evaluate the benefits of a randomized vocational training intervention in Colombia, and
find returns on the order of 8–18% in earnings, with especially high returns for girls.
More recent work has focused in and around Asia. Maitra and Mani (2012) report
significant improvements in the labor market outcomes for women who participated in a NGO
implemented tailoring course in the slums of New Delhi, India. Bandiera et al. (2013) study a large
scale randomized control trial in Bangladesh that pairs the transfer of assets (in the form of
livestock) with an NGO-run training program on livestock management for women. Results
suggest that the combination of interventions increases total labor supply of women, while shifting
their effort out of wage employment and into self-employment, with accompanying increases in
earnings and per capita household consumption. In contrast, Hirshleifer et al. (2014) use

6
randomized methods to study a national vocational training program in Turkey, and find near-zero,
statistically insignificant impacts on employment and earnings.
Few rigorous impact evaluation studies of vocational education have been conducted in
Africa, the world’s poorest region and one where the youth unemployment problem is particularly
severe. In fact, we are aware of only two other vocational training RCTs conducted in Africa – one
focusing on providing training for Ugandan women to run small businesses (Bandiera et al., 2014),
and one to provide apprenticeships to youth in Malawi (Cho et al., 2013). A recent RCT by
Blattman, Fiala, and Martinez (2013) in Uganda finds that a program that provides cash grants to
youth groups to fund businesses and/or training had large economic returns. However, it is difficult
to isolate the returns of training from the returns to capital in their program. A key difference with
these related papers studying training in Africa and Asia is that the training is generally provided
by specially sourced trainers who are often specifically trained by the implementing organization
to deliver a particular curriculum (except in the case of Hirshleifer et al., 2014). In contrast, the
Kenyan program we study works with existing formalized vocational training institutions.
Additional evidence on what works in vocational education delivery will be critical for
good public policy in the education sector, and will inform the decisions of governments and NGOs
throughout the region, including in our study country of Kenya, as they consider expanding
programs to improve youth labor market skills. In addition to exploring the impacts of vocational
training, this study seeks to illuminate the factors that drive the demand for (public and private)
vocational education in Kenya using an innovative randomized voucher delivery mechanism and
information campaign. With several less developed countries currently expanding and investing in
their vocational education sectors, the results of this intervention will provide timely and
comprehensive evidence to policymakers seeking to increase the demand for vocational education.
The present analysis focuses on program take up, the demand for vocational education and
the impact of the information intervention, voucher recipient institution and course selection,
participant attendance, and medium-term labor market and other life impacts. Together, the results
of this research will enable the Government of Kenya, the World Bank and other policymakers in
the region to more effectively design youth skills training and employment programs in order to
promote economic development via human capital formation.

7
2. Vocational Education in Kenya
A formal youth polytechnic system was established in Kenya in the 1960s (King and Martin, 2002).
These public training institutions range from relatively basic village polytechnics offering
traditional trades such as skilled construction (e.g., masonry, carpentry, plumbing), automotive
mechanics and tailoring, to larger polytechnics in towns offering a wider array of courses and
complementary skills training in entrepreneurship education (e.g., accounting). Parallel to the
youth polytechnic system, the Ministry of Education, Science and Technology (MOEST) also
operates a system of Technical Training Institutes, prestigious institutions offering both industrial
education and commercial courses in business, computers and secretarial skills. These public
institutions typically provide two-year training courses, with total course tuition ranging from
US$300-500 (with a mean of approximately US$350 among institutions in our primary study area
in rural western Kenya) at the time of program launch.
An alternative to the public model is present in the dynamic but understudied private
vocational training sector, which could also play an important role in building youth skills in Kenya
(as well as in other low income countries). Kenya’s private vocational education sector has grown
markedly in recent years. Ministry of Education statistics show that the number of private
institutions grew by 16% between 2004 and 2007 (while public institutions grew by 6%). Under
the umbrella of private institutions are a wide variety of institutional structures, including private
technical colleges, small centers specializing in a single skill (e.g. hairdressing), and small
businesses in which training resembles apprenticeships. Within the primary region of focus for the
present study (western Kenya), private institutions offer courses ranging from a few months to two
years. Course offerings at these institutions are usually narrower in scope than their public-sector
counterparts, but allow students to specialize in specific skills – for example, a particular computer
software package. The price of a course varies significantly, but typically ranged between
US$150500 (with a mean of less than US$300 among institutions in our study area) at the time of
program launch. Thus, private institutions offer a substantially different training experience than
public training centers. Allowing individuals the opportunity to select the course that best fits their
needs, whether public or private, may further boost the effectiveness of vocational training by
leading to more efficient student-course matches – a possibility we will continue to study in future
research.

8
3. Description of the Intervention
3.1 Intervention Design
The program we study is an NGO-administered randomized youth vocational education
intervention in (primarily western) Kenya. 2,163 out-of-school Kenyan youths ranging in age from
roughly 17 or 28 years old applied for vocational education tuition vouchers, and a randomly
selected half were awarded a voucher. The vouchers were worth approximately 35,000 Kenyan
Shillings (about US$460), an amount sufficient to fully (or almost fully) cover the tuition costs for
most private vocational education programs and government-run rural village polytechnics or
technical training institutes.
These youth were drawn from a pool of individuals participating in a unique and
highquality longitudinal (panel) dataset that the authors have been collecting in this region since
1998, known as the Kenyan Life Panel Survey (KLPS). The KLPS sample was chosen as a
representative subset of individuals who attended primary school in the former Busia District, a
rural area in western Kenya, nearly ten years earlier. Primary schools in this district participated in
one of two earlier NGO-run development programs – either a deworming program launched in
1998 (the Primary School Deworming Program or PSDP; Miguel and Kremer, 2004), or a merit
scholarship program for girls that began in 2001 (the Girls’ Scholarship Program or GSP; Kremer,
Miguel, and Thornton, 2009). The KLPS data contains detailed educational, health, nutritional,
labor market, demographic and cognitive information for thousands of Kenyan adolescents from
1998 to 2009. The existence of detailed information on these and other life outcomes (such as
cognitive ability and orphan status) in the KLPS data strengthens the evaluation of this vocational
training program and enhances the external value of the evidence generated by permitting
estimation of heterogeneous program impacts for different types of individuals.
The entire KLPS sample of 10,758 individuals was invited to an informational session on
this vocational training program in late 2008.1 Participants were recruited from the KLPS sample
through local leaders. A total of 2,705 youth attended one of the 70 introductory meetings held in
sub-locations where the original deworming and scholarship programs took place as well as in the
1 We cannot confirm whether a particular individual received our invitation, but an attempt was made to invite the
entire KLPS sample.

9
cities of Nairobi, Mombasa, and Kisumu where many of them had since moved.2 During this
introductory meeting, short surveys were administered to all participants to collect information on
their beliefs about expected earnings with and without vocational education, for both the
respondent individually and for “other people in his/her community”. Participants were then given
more details on the program, and those meetings selected for the information treatment received a
special presentation (see below for more details). Finally, participants were given a list (compiled
by program staff) of local vocational training centers and selected participating vocational training
centers in urban areas outside of western Kenya, including in large cities such as Nairobi, Mombasa
and Kisumu.3 Each training center description detailed the location, contact information of the
manager or principal, courses offered, academic requirements (if any), and course duration.
Meeting participants were also informed that they could apply to a training center not found on
this list, as long as the center met program participation requirements.4
Individuals were instructed to return to a second program meeting at the same location two
weeks later with a letter of support5 from a local authority (e.g., chief) or training center, and be
prepared to state their preferred schools and courses should they be awarded an unrestricted (public
or private institution) voucher or a public-only voucher (these interventions are described below).
Students who attended the second meeting, brought a letter of support and had valid preferences
for both unrestricted and public-only voucher types were included in the final sample of 2,163
individuals.6 This application procedure was designed to ensure a genuine interest in vocational
2 Sub-locations are local administrative units that vary in size, but generally contain a handful of primary schools
and can usually be traversed on foot in a few hours (thus, meetings were within walking distance of most
participants). 3 This list was compiled in two parts. First, names of public institutions were sought from local government offices.
We included all public institutions (affiliated with either the Ministry of Youth and Sports - which at the time ran the
polytechnics - or the Ministry of Education – which at the time managed the Technical Traininng Institutes) located
in the heart of our study area (what is currently known as Busia County). In addition, we included many public
institutions in the nearby districts of Bungoma East, Bungoma South, Kakamega North, Mumias, and Siaya, as well
as a handful of institutions in the cities of Kisumu, Mombasa and Nairobi. Second, we utilized data from the (then)
most recent round of the KLPS in addition to surveys at local market centers to identify a range of private vocational
training institutions. 4 See Section 3.2 for more information on eligibility requirements. 5 The letter of support was meant to introduce a small level of effort for the applicant during the application process,
but was not meant to be prohibitive. Applicants could provide a letter of support from a training institution or local
leader (such as a village elder). 6 Individuals who missed the first informational meeting but wanted to participate in the program were allowed to do
so by attending the second meeting, or by visiting the implementing agency’s offices in Busia Town. Project staff
attempted to retain the information intervention (described below) treatment assignment of individuals by giving a

10
education among applicants, making them a highly policy relevant sample: those Kenyan youth
likely to enroll in vocational education should further training subsidies become available.
Voucher winners were then randomly selected from this final pool of applicants using a
computer random number generator (in STATA). The allocation of vouchers was made among
those preferring to apply to the same institution; in other words, if 20 sample individuals preferred
to apply to a certain vocational training center, five were randomly chosen to receive the public
voucher, five were randomly chosen to receive the unrestricted voucher, and the remaining ten
were allocated to the control group. This research design permits study of which precise
institutional characteristics have the greatest impact on future labor market returns. Randomization
for the voucher treatment assignment was also stratified by individual gender, assignment to the
information intervention (described below), participation in one of the two original NGO primary
school programs from which the sample is drawn (PSDP versus GDP), and preferred course (which
was aggregated into broad occupation groups by course type), thereby ensuring balance across the
treatment and control groups along those categories as well. The randomization process is
summarized in Figure 1.
Among voucher winners, a random half received vouchers that can be used only in
government supported public vocational training institutes, while the other half received
unrestricted vouchers that could be used in either public centers or in the growing private training
sector. Of the final sample of 2,163, 526 individuals were assigned unrestricted vouchers and 529
were randomly assigned vouchers only for use at government institutions. The remaining 1,108
serve as the control group. Voucher winners were informed which type of voucher they had won
by January 2009, and were subsequently provided the opportunity to apply to the vocational
education institution of their choosing.
Table 1 summarizes the voucher design. Vouchers covered tuition, materials, uniforms, and
trade test fees (if applicable). They did not support board, lunch, or transport costs. According to
administrative data collected during the program, the mean (median) voucher amount paid for
restricted voucher winners was Ksh 21,507 (Ksh 21,300), and for unrestricted voucher winners
was Ksh 19.858 (18,000). Information collected from a small subset of voucher winners in
mid2010 (nearing the end of the program) suggests that the mean (median) fraction of total training
short individual information presentation to those individuals who were originally assigned to a treatment
sublocation.

11
costs covered by the voucher was 72% (96%) for restricted voucher winners, and 74% (95%) for
urestricted voucher winners.
The vocational training program additionally included an information intervention,
implemented with a cross-cutting factorial design, such that a random subset of both the voucher
treatment and control groups received the intervention. This intervention permits estimation of the
role that information on labor market returns plays in demand for vocational schooling in Kenya.
In particular, a randomly selected half of all first program introductory meetings held at the
sublocation level were exposed to information about the estimated Mincerian returns to vocational
education, using (cross-sectional) information from existing KLPS data.7 The information was
presented and explained in detail by project staff. Figure 2 presents the posters used in these
information sessions. Posters displayed the higher average earnings of individuals who attended
vocational training versus individuals who did not (for both men and women), and also broke down
earnings by trade. 8 One noteworthy component of the intervention highlighted the large
discrepancy between expected earnings for graduates of traditionally male-dominated trades (e.g.,
mechanic) versus traditionally female-dominated trades (e.g., seamstress) and used this
information, as well as more subjective methods – including presentation of a video about
successful female car mechanics in Kenya – to encourage young women to enroll in more lucrative
male-dominated trades.
The randomized design in both voucher allocation and the information intervention
addresses leading concerns about selection bias in estimating the demand for, and the returns to,
schooling. For instance, the classic concern in estimating returns to schooling is that higher ability
individuals are more likely to obtain additional schooling, leading researchers to overstate returns
to schooling. Randomizing voucher offers across individuals, and randomizing information across
7 For program enrollment meetings in the original KLPS sub-locations of Busia and surrounding districts,
information treatment group assignment was performed at the sub-location level after first stratifying by division (an
administrative unit containing 5-15 sub-locations). Out of 70 meetings, 35 were randomly selected to receive the
information treatment. This information was most economically presented at a meeting-level (as opposed to
thousands of one-on-one explanations of the information); so, the sub-location meeting was the relevant unit in the
randomization. For the meetings held in Nairobi and Mombasa, randomization into information treatment and
control groups was done at the individual level (and no information intervention was performed for the meetings
held in Kisumu). The analysis presented below focusing on the information intervention clusters regression
disturbance terms at the sub-location level. 8 Presenters attempted to describe the issue of possible selection bias in this cross-sectional analysis with the
following phrase: “You should be aware that the information displayed is from people who were able to pay for their
own vocational schooling. In that sense these people may be different from you and they may have benefitted more
(or less) from their training program than you would.”

12
project recruitment meetings, eliminates most relevant selection bias concerns. In the analysis that
follows, we can thus more confidently attribute statistically significant differences in demand for
education and labor market gains to the project interventions.
3.2 Training Center Eligibility
One remarkable facet of the program studied here is the variety of course and institution types
available to program participants. The project targeted all the major government Village
Polytechnics and Technical Training Institutes in the home study area of Busia County, as well as
a large cross-section of available private institutions in the area. While the inclusion of government
institutions was straightforward, private institutions were vetted before inclusion in the program.
In general, private institutions were eligible to be included in the program if they had one
or more trainees at the time of program recruitment or had offered courses in the prior year, and if
their fee structure feel within the program voucher limits. Due to the large number and wide range
of institutional types in the private vocational schooling sector, the list of potential participating
vocational training centers was necessarily far from exhaustive. The most comprehensive list of
potential participating institutions was in the primary target area and original home of all of our
participants (Busia County; former Busia, Bunyala, and Samia Districts). In these areas all
formalized private vocational training centers were included. These include for-profit computer
training schools and church or NGO-run training centers. Further a variety of privately run forprofit
businesses that regularly take students for six month to two year “apprentice-style” training
programs were included. These were vetted for legitimacy and formality – shops where space,
tools, work and theoretical training were clearly available and where students had been taken many
times before were included while those less equipped to handle a semi-formal training program
were excluded. In the rest of western Kenya as well as the cities of Kisumu, Nairobi, and Mombasa
where some of the KLPS sample resided, the program focused primarily on institutions of
relatively greater sophistication that more closely resembled public institutions. Finally, all private
institutions were vetted for fit with the project. Institutions with costs, program lengths and course
types that were largely outside the program plans or far different from similar public options were
excluded. In some cases students inquired about the possibility of enrolling in a particular
institution. If the institution met the program’s criteria then it was included. In a few cases,
institutions were not willing to work with the program, and so were excluded.

13
As evidence of the diversity and versatility of the private vocational training sector in Kenya, the
type, length and structure of the private institutions and courses in included in the program vary
widely. Some institutions run by private entrepreneurs, NGOs or church groups mirror the
industrial training structure of the government-run polytechnic system. Others offer short training
courses in a particular skill-set like computers or driving. Still others function as businesses and
training centers in one, teaching hairdressing, tailoring or some other trade through something akin
to an apprenticeship. The private vocational training sector is arguably more adept at
accommodating the needs of a larger variety of students, with courses as short as one month well-
suited to those already in the work force or supporting their families, to the longer servicebased
courses desirable to recent secondary school leavers.
Like the institution and course types, fees vary widely across the courses available to program
participants. For courses included in the original list distributed at recruitment meetings, the
program covers all mandatory fees including uniform and registration fees. To accommodate the
training needs of secondary school leavers and at the request of some voucher winners, the program
also allowed students to enroll in more academic technical training diploma courses (e.g., in
computer training) and to cover fees up to the level of the average two year industrial course, or
35,000 Kenyan Shillings (about US$460).
3.3 Characteristics of Vocational Institutions, by Type
Surveys were administered to vocational training institution administrators and teachers during
2009 and 2010 to collect detailed information on potentially important institution-level
characteristics. In particular, these surveys gathered information on school equipment and
facilities, classrooms, and teacher characteristics, as well as course curricula.
We find important differences in infrastructure and instructional equipment across different types
of institutions (results available upon request). Overall, we find that private institutions were more
likely to have flush toilets than public schools. We also find that public and private schools were
equally likely to have electricity.
We note a few key differences in the educational and labor market characteristics of teachers in
public and private institutions. In particular, we find that 92% of teachers at public institutions had
taken the secondary school exit examination compared to only 68% in private schools. In addition
64% of teachers at public schools had completed college compared to 42% in private schools. Both

14
these differences in teacher education were statistically significant. Public school instructors had
close to 4 more years of teaching experience than private school instructors (approximately a 50%
increase and a statistically significant difference). However, we do not observe any significant
differences in the practical work experience of teachers in public versus private schools.9 We also
explore differences in pedagogy between different institutions, and find that teachers in public
schools devote a greater share of classroom time to practical work, while teachers in private schools
focus relatively more on theory.
The data suggests that most, but not all, schools offer (mandatory) entrepreneurship programs,
others offer mandatory remedial subjects such as Mathematics and English, and others encourage
their trainees to sit in on some training in closely related fields (e.g., encouraging plumbers to learn
basic welding skills). Practical experience is extremely important in enabling students to acquire
relevant and employable skills. Overall we do not find any differences in the propensity of
vocational training institutions to organize attachments (or internships) - both private and public
schools were equally likely to organize attachments. However, we do see that public institution
courses are more likely to require an internship or attachment as part of the coursework compared
to private schools. This finding probably reflects the differences in course offerings across the
different types of institutions, rather than a systematic difference in policy across them. However,
we do find that private schools were significantly more likely to assist students with job placement
compared to their public counterparts. This placement assistance could have significant
implications for successful employment outcomes, however the efficacy of such programs is
currently unknown.
4. Data and Background
4.1 Data Sources
Five sources of data were utilized in the analysis presented in this report. First, we use short
baseline surveys that were administered during the 2008 recruitment meetings, prior to the voucher
9 It should be noted, though, that a potential weakness of this is survey data is that it does not capture differences in
the timing of the teacher experience in great detail. With rapid technological change, recent practical experience in
industry may be a particularly salient dimension of teacher quality, and one which may enhance the labor market
relevance of the training program.

15
and information treatments. This baseline data is supplemented by data from Round 2 of the Kenya
Life Panel Survey (KLPS), collected between August 2007 and December 2009.10 We also utilize
monitoring data that was collected during 2009-2010 from training institutions where voucher
winners enrolled. Additionally, we collected a short follow-up survey to capture information on
take-up of vocational education within the treatment and comparison groups, and to update contact
information of comparison group individuals in our sample.11 Finally, we obtain our medium-term
outcome measures from Round 3 of the KLPS (KLPS-3) – this latest round of the survey was
administered between August 2011 and August 2014, and contains follow-up information for 88%
of the vocational training sample.12
4.2 Characteristics of Participating Individuals
Table 2 presents demographic and program participation data for the full KLPS sample, as well as
for the 2,163 individuals who became participants of this vocational training program. The KLPS
sample is generally representative of youth in western Kenya: both programs from which it was
drawn (the PSDP and GSP) included youth enrolled in primary school in 1998/2001, and the 1998
Kenya Demographic and Health Survey suggests that 85% of 8 to 18 year olds in western Kenya
were enrolled in school at that time (Republic of Kenya, 1999).13
The last column of Table 2 compares individuals who applied to the vocational training voucher
program to individuals in the KLPS sample who did not apply. In general, program applicants are
three percentage points more likely to be male than non-applicants, 0.15 years older, and slightly
higher in baseline primary school grade. There are no statistically significant differences in prior
program participation (PSDP or GSP) across program applicants and and nonapplicants, and no
difference in the likelihood that a participant was assigned to the PSDP treatment group. Results
10 See Section 3.1 for a thorough description of the KLPS project. 11 For voucher winners who enrolled in training, these follow-ups were during monitoring visits to training
institutions. For voucher winners who dropped out or did not enroll, and for comparison group individuals, these
follow-ups were conducted by phone. By mid-2010, we were able to obtain this basic follow-up information for
91% of the control (non-voucher winner) sample. 12 The full KLPS sample was randomly divided into two halves, each designed to be representative of the whole,
to be tracked in two separate “waves” of data collection during the round. Data collection was designed in this way
in order to allow for improvements to the survey and tracking methodologies between waves. Wave 1 data
collection ended in December 2012, and Wave 2 data collection ended in August 2014. The tracking rate among
program individuals was 88%, an extremely high rate for a longitudinal survey endeavor in rural sub-Saharan
Africa. 13 The KLPS sample has a higher fraction of females than is representative of the youth population simply
because only female participants from GSP schools were included in the KLPS tracking sample.

16
do suggest that program applicants were slightly more likely to be assigned to the GSP treatment
group (2 p.p., p-value ≤0.05). In our primary analysis of mediumterm program impacts, we control
for all of these characteristics.
Table 3 summarizes the descriptive statistics of the vocational training program sample
prior to any program intervention. The first thing to note from this table is that the voucher
randomization procedure was successful at creating similar treatment and control groups. The
treatment and control groups were well balanced along most observable dimensions (among all
observables presented, only one shows a statistically significant difference, and only with a
pvalue<=0.10). This allows us to confidently interpret the differences between treatment and
control outcomes as the causal effect of the vocational training voucher program.
Column (1) of Table 3 provides a description of the overall sample – a valuable depiction
of individuals interested in receiving vocational training. Of the 2,163 individuals included in the
program, 63% are female. The sample consists of more girls than boys mainly because one of the
two school-based NGO programs from which the KLPS sample was originally drawn (the GSP)
targeted only girls.13 Because of the relative size difference between these two different programs,
70% of program applicants were previously involved in the PSDP, while only 30% were previously
involved in the GSP. The mean age at recruitment in 2008 was 22 years and sampled students
ranged in age from roughly 17 to 28.
At the time of project recruitment meetings, most participants lived in Busia County (the
main study area of the PSDP and GSP projects in rural western Kenya), with roughly 4% living
just outside of the district and 6% in large cities. This distribution makes sense, especially given
that invitations to recruitment meetings were spread with the assistance of local area leaders
throughout Busia County.
Average academic schooling attainment of individuals in the sample prior to the start of the
program was 8.8 years, but there is a wide range in attainment: 26% of the sample dropped out
before attaining grade 8, 38% terminated schooling upon graduating from primary school, 11% of
individuals attended some secondary school, and 24% completed secondary school. Nearly
13 As noted previously, the KLPS sample was drawn from the pupil samples for the Primary School Deworming
Project (PSDP), a school-based deworming program carried out from 1998-2002 and the Girls Scholarship Program
(GSP), a merit-based cash award program for the top performing female grade 6 students carried out in 2001-2002.
The programs did not have overlapping samples, as the PSDP was carried out in Budalangi and Funyula divisions of
the former Busia District and GSP was carried out in Township, Matayos, Butula and Nambale divisions.

17
twothirds of individuals seeking vocational training had received only up to a primary school
education. Fewer than 3% of program applicants were still attending school at the time of program
launch, and on average, program participants had been out of school for nearly 4 years by that time.
Approximately 14% of the sample had previously been employed. Of these, fewer than a quarter
were already working in a field in which the project affiliate training centers offer skills training,
such as tailoring, hairdressing, skilled construction or computer services. Other common jobs
include fishing and informal hawking/sales.
The vocational training voucher program was designed to be open to students who had
already received some vocational training but wanted to further their skills. Nearly 22% of the
sample had already received some training, primarily through apprenticeships and other informal
training at small private enterprises rather than at the larger public centers.14
4.3 The Labor Market in Western Kenya
The region of rural western Kenya where this vocational training program was undertaken is
primarily agrarian. Individuals farm for subsistence, and participation rates in wage and self
employment are low. There are also important differences in the types of work performed by
gender.
Table 4 uses the KLPS-2 data, collected in mid-2007 through 2009, to provide some
information on the local labor market participation of youth in western Kenya, prior to the launch
of the vocational training program. Nearly three quarters of youth work in agriculture, primarily
for household subsistence. Just over 15% work in wage employment, primarily in business and
retail (i.e., hawking food and clothing, 20% of wage earners), skilled construction (12%),
professional work (i.e., teacher, salaried professional, 10%), and other low-skill work (i.e.,
domestic work, watchman, 10%). Approximately 11% work in self-employment, primarily in
food/travel/tourism (i.e., butcheries, restaurants/cafes, distilling alcohol, 34%), business and retail
(17%), and tailoring and textiles (12%). There are also important differences across gender. Men
are much more likely to have wage employment than women. Within wage employment, men tend
to work in business and retail, skilled construction, and unskilled construction, while women focus
14 Our data shows that the baseline proportion of individuals with some previous training was balanced across the
voucher and control groups. Participation in the program enables these youth to gain official certificates from
recognized examination bodies in Kenya (whereas they might not already have had these certificates, which are
expensive to obtain), and thus could plausibly have labor market returns above and beyond the training itself.

18
in low skill work, business and retail, professional work, tailoring, and food/travel/tourism. Among
the self-employed, business/retail and food/travel/tourism are the largest employers for both
genders. On the whole, most youth in western Kenya spend their time in low skill work –
suggesting that a program enhancing their skills may allow them to move into potentially more
lucrative endeavors. More than one-quarter of youth are unemployed (not employed in wage labor
or self-employment, and currently seeking work).
5. Hypotheses and Empirical Strategy for Medium-Term Impacts
5.1 Theory of Change and Hypotheses
There are a number of ways through which vocational education (and this voucher program in
particular) can improve youth labor market outcomes. Lack of skills is a potential barrier that could
hinder the employability of youth. However, since training programs are costly, youth facing credit
constraints may be unable to invest in these programs. Thus by providing vouchers (scholarships)
for youth, the program would result in increases in educational attainment among youth who were
awarded the voucher (relative to those who were not chosen to receive the voucher). By alleviating
the financial barriers to accessing training, the program could improve the skills of youth. If
training improves worker skills and productivity, economic theory postulates that this would
increase the demand for labor. Training could also serve as a signal to employers. If the skills that
youth invest in are not in sufficient demand, either because the skills provided by training programs
are not what is required by employers or due to insufficient labor demand, then training programs
may not improve the employability of youth. Potentially private training providers are better able
to respond to the needs of the market. If private providers provide skills that are better aligned with
the labor market, then we may observe that youth that train in private schools may have better
employment prospects.
While data collection was still underway, and before any analysis of medium-term program
outcomes using the KLPS-3 had been completed, we registered a pre-analysis plan with the Abdul
Latif Jameel Poverty Action Lab (J-PAL) in December 2012. Pre-analysis plans are popular in
medical trials, but are just beginning to catch on in the evaluation of randomized trials in
development economics (Casey et al., 2012). The goal of creating these plans is to reduce data

19
mining and tendentious reporting by pre‐specifying main research hypotheses, outcome variables,
and regression specifications. We note any departures from that plan in what follows.
We specified three main hypotheses (outcomes for which we would expect to see an effect
of increased vocational education) and a set of exploratory hypotheses in our pre-analysis plan.
We present a range of these outcomes here, including:15
• (H1) Increased earnings, including both wage earnings and self-employed profits
• (H2) Improvements in other labor market outcomes, such as work hours and sectorial
shifts out of agriculture
• (H3) Improvements to living standards, including asset ownership
• (H4) Impacts on attitudes, human capital, and marriage and fertility
5.2 Empirical Strategy
In our empirical analysis, we follow our pre-analysis plan by presenting both the treatment effect
on the treated (TOT) results and the intention to treat (ITT) results. To estimate the TOT, we use
an instrumental variable two‐stage least squares (IV‐2SLS) approach. Specifically, we use
assignment to a voucher treatment, assignment to the information treatment, and an interaction of
the two as instruments for years of vocational training attained. We deviate from our original
preanalysis plan (which was published prior to the launch of Wave 2 data collection) by
incorporating interactions of all of these measures with an indicator for the individual being
surveyed in the survey Wave 2, in order to explore the dynamics of labor market outcomes
following training (each wave of data collection is representative of the whole, and individuals in
Wave 2 were surveyed on average 21 months after those in Wave 1). We further deviate from our
plan in this report for simplicity of presentation, by omitting the additional unrestricted voucher
assignment term and its interactions.
We can specify the first stage of our instrumental variable approach in two equations, as
follows:
𝑉𝑉𝑉𝑉𝑉𝑉𝑉𝑉𝑑𝑑𝑖𝑖 = 𝛼𝛼0 + 𝛼𝛼1 ∗ 𝐴𝐴𝐴𝐴𝐴𝐴𝑉𝑉𝑉𝑉𝐴𝐴𝑉𝑉ℎ𝑒𝑒𝑟𝑟𝑖𝑖 + 𝛼𝛼2 ∗
(𝐴𝐴𝐴𝐴𝐴𝐴𝑉𝑉𝑉𝑉𝐴𝐴𝑉𝑉ℎ𝑒𝑒𝑟𝑟𝑖𝑖 × 𝑊𝑊𝑊𝑊𝑊𝑊𝑒𝑒2𝑖𝑖) + 𝛼𝛼3 ∗
15 The full set of results on all pre-specified outcomes are available from the authors upon request.

20
𝐼𝐼𝐴𝐴𝐼𝐼𝑉𝑉𝐼𝐼𝑟𝑟𝑒𝑒𝑊𝑊𝑟𝑟𝑖𝑖 + 𝛼𝛼4 ∗ (𝐼𝐼𝐴𝐴𝐼𝐼𝑉𝑉𝐼𝐼𝑟𝑟𝑒𝑒𝑊𝑊𝑟𝑟𝑖𝑖 × 𝑊𝑊𝑊𝑊𝑊𝑊𝑒𝑒2𝑖𝑖) + 𝛼𝛼5
∗ (𝐴𝐴𝐴𝐴𝐴𝐴𝑉𝑉𝑉𝑉𝐴𝐴𝑉𝑉ℎ𝑒𝑒𝑟𝑟𝑖𝑖 × 𝐼𝐼𝐴𝐴𝐼𝐼𝑉𝑉𝐼𝐼𝑟𝑟𝑒𝑒𝑊𝑊𝑟𝑟𝑖𝑖) +
𝛼𝛼6 ∗ (𝐴𝐴𝐴𝐴𝐴𝐴𝑉𝑉𝑉𝑉𝐴𝐴𝑉𝑉ℎ𝑒𝑒𝑟𝑟𝑖𝑖 × 𝐼𝐼𝐴𝐴𝐼𝐼𝑉𝑉𝐼𝐼𝑟𝑟𝑒𝑒𝑊𝑊𝑟𝑟𝑖𝑖 × 𝑊𝑊𝑊𝑊𝑊𝑊𝑒𝑒2𝑖𝑖) + 𝑊𝑊𝑖𝑖′𝛾𝛾 + η𝑖𝑖 (1)
𝑉𝑉𝑉𝑉𝑉𝑉𝑉𝑉𝑑𝑑𝑖𝑖 × 𝑊𝑊𝑊𝑊𝑊𝑊𝑒𝑒2𝑖𝑖 = 𝜃𝜃0 + 𝜃𝜃1 ∗ 𝐴𝐴𝐴𝐴𝐴𝐴𝑉𝑉𝑉𝑉𝐴𝐴𝑉𝑉ℎ𝑒𝑒𝑟𝑟𝑖𝑖 + 𝜃𝜃2
∗ (𝐴𝐴𝐴𝐴𝐴𝐴𝑉𝑉𝑉𝑉𝐴𝐴𝑉𝑉ℎ𝑒𝑒𝑟𝑟𝑖𝑖 × 𝑊𝑊𝑊𝑊𝑊𝑊𝑒𝑒2𝑖𝑖) + 𝜃𝜃3 ∗ 𝐼𝐼𝐴𝐴𝐼𝐼𝑉𝑉𝐼𝐼𝑟𝑟𝑒𝑒𝑊𝑊𝑟𝑟𝑖𝑖
+ 𝜃𝜃4 ∗ (𝐼𝐼𝐴𝐴𝐼𝐼𝑉𝑉𝐼𝐼𝑟𝑟𝑒𝑒𝑊𝑊𝑟𝑟𝑖𝑖 × 𝑊𝑊𝑊𝑊𝑊𝑊𝑒𝑒2𝑖𝑖) + 𝜃𝜃5 ∗
(𝐴𝐴𝐴𝐴𝐴𝐴𝑉𝑉𝑉𝑉𝐴𝐴𝑉𝑉ℎ𝑒𝑒𝑟𝑟𝑖𝑖 ×
𝐼𝐼𝐴𝐴𝐼𝐼𝑉𝑉𝐼𝐼𝑟𝑟𝑒𝑒𝑊𝑊𝑟𝑟𝑖𝑖) + 𝜃𝜃6 ∗ (𝐴𝐴𝐴𝐴𝐴𝐴𝑉𝑉𝑉𝑉𝐴𝐴𝑉𝑉ℎ𝑒𝑒𝑟𝑟𝑖𝑖 × 𝐼𝐼𝐴𝐴𝐼𝐼𝑉𝑉𝐼𝐼𝑟𝑟𝑒𝑒𝑊𝑊𝑟𝑟𝑖𝑖 × 𝑊𝑊𝑊𝑊𝑊𝑊𝑒𝑒2𝑖𝑖) + 𝑊𝑊𝑖𝑖′𝛾𝛾 + η𝑖𝑖 (2)
where 𝑉𝑉𝑉𝑉𝑉𝑉𝑉𝑉𝑑𝑑𝑖𝑖 is the measure of individual vocational education (i.e., years of
training completed), InfoTreat is an indicator for receiving information about the potential labor
market returns to vocational education, Wave2 is in indicator for the individual being surveyed in
KLPS-3 Wave 2, and 𝑊𝑊𝑖𝑖 is a vector of covariates. AnyVoucher is an indicator for winning any
type of voucher. Following Bruhn and McKenzie (2009), W contains the vector X of characteristics
used for stratification during the randomization, namely: the individual’s original project
participation (in PSDP or GSP), their gender, and their preferred training course. Course preference
consists of six indicator variables for the major occupational groups, namely, (i) construction and
related trades, (ii) textiles and tailoring, (iii) mechanics and driving, (iv) beauty, (v)
computers/secretarial/ business, and (vi) other. (As is standard, the “(vi) other” category indicator
will be excluded from the regression to avoid collinearity issues.) W also contains the following
additional individual characteristics: age (in 2008), school attainment (by 2008, at program
baseline), an indicator for any prior enrollment in vocational education (at baseline), stated
preference for a public versus a private training institution (at baseline), indicators for treatment
status in the earlier PSDP and GSP programs, a linear measure of the number of months since

21
KLPS-3 data collection began, and an indicator for being in Wave 2 data collection.16 We can then
specify our second stage as follows:
𝐴𝐴𝑖𝑖 = 𝛽𝛽0 + 𝛽𝛽1 ∗ 𝑉𝑉𝑉𝑉𝑉𝑉𝑉𝑉𝑑𝑑𝑖𝑖 + 𝛽𝛽2 ∗ (𝑉𝑉𝑉𝑉𝑉𝑉𝑉𝑉𝑑𝑑𝑖𝑖 × 𝑊𝑊𝑊𝑊𝑊𝑊𝑒𝑒2𝑖𝑖) + 𝑊𝑊𝑖𝑖′𝜑𝜑 + ε𝑖𝑖 (3)
where we instrument for 𝑉𝑉𝑉𝑉𝑉𝑉𝑉𝑉𝑑𝑑𝑖𝑖 and (𝑉𝑉𝑉𝑉𝑉𝑉𝑉𝑉𝑑𝑑𝑖𝑖 × 𝑊𝑊𝑊𝑊𝑊𝑊𝑒𝑒2𝑖𝑖) using the
first stage specified in equations (1) and (2).
Assignment to voucher treatment must satisfy several conditions to be a valid instrument
for vocational training, including the exogeneity and the relevance of the instrument. Exogeneity
is satisfied by the “successful” randomization of subjects into the treatment and control groups, in
terms of balance along observable characteristics, which we demonstrated in Table 3. Regarding
“relevance”, there are a number of compelling reasons to believe that a vocational education tuition
voucher should increase enrollment. Most obviously, eliminating or dramatically reducing the cost
of vocational education will increase demand through price effects. Subsidies may ease credit
constraints that prevent enrollment or lead to dropout prior to completion; enable youth to enroll
in higher quality institutions, including those that offer preparation for official certification exams
(note that the payment of certification exam fees was typically covered by the program); and allow
students to spend more time studying, rather than working to cover their tuition payments.
The TOT might differ from the intention‐to‐treat (ITT) effect because the experiment did
not have perfect compliance: in preliminary analysis, we found that 26% of individuals offered a
voucher did not take it up, and roughly 4% of individuals in the control group completed some
vocational training. Thus, we also present reduced‐form estimates (i.e., differences between those
who were offered a voucher and those who were not), which is equivalent to the ITT estimate.
16 These last two controls were not included in our pre-analysis plan, which was written with the KLPS-3 Wave 1
data collection effort in mind, but we decided to add them in order to incorporate the Wave 2 data collection effort,
which followed by several months.

22
6. Technical and Vocational Vouchers Program Results
6.1 Baseline School and Course Preferences During program recruitment meetings (after the information intervention but prior to the voucher
lottery), surveys were undertaken to elicit information on the preferences of each participant under
the two voucher treatment scenarios (i.e., if he/she were to receive an unrestricted voucher or a
public-only voucher). We collected information on preferred training center and course, as well as
the reasons for choosing this combination. Overall, applicants showed a moderate preference for
public training centers (57% preferred public, 43% preferred private, Table 3) as their first choice.
Such preferences did not vary at statistically significant levels across gender, level of education
completed, or by previous vocational training. However, individuals at or below median age (21
years old) were more likely to prefer public institutions than their older peers (59% versus 53%),
and those who had been out of school 3 years or less were more likely to prefer public institutions
than those who had been out of school longer (58% versus 54%). Previous participants of the GSP
were much more likely than those of the PSDP to prefer public institutions (66% to 52%).
Individuals living in or near Busia District (thus, primarily in rural areas) at the time of program
meetings were substantially more likely to prefer a public training institution than those living
outside of Busia (56% to 47%, respectively). Furthermore, those living in a city were much more
likely to prefer a private institution (56% of city dwellers preferred private, versus only 43% of
non-city dwellers).
In terms of industry of the course preferred, the largest number of participants hoped to
attend training for either tailoring/dressmaking (32%) or driving/mechanic (25%). Other popular
broad occupation groups include computer/secretarial/business work (15%), hairdressing (13%),
and skilled construction (12%). Table 5 summarizes the breakdown of broad occupation of interest
for various subgroups of program participants. The demand for tailoring/dressmaking, beauty and
computer/secretarial/business courses is driven primarily by females, while the demand for
vehicle-related and skilled construction courses is driven by males.17 The distribution of course
preferences is fairly similar across individuals aged above and below the median, and across
17 There also appear to be some differences in the distribution of preferences between individuals previously
participating in the PSDP and individuals previously participating in the GSP, though this is likely due to the gender
component of the scholarship intervention (and indeed, preferences of former GSP participants closely mirror those
of women in the sample as a whole; results not shown).

23
location of residence (although those living in cities seem to be more interested in vehicle-related
trades while those living in rural areas appear to be relatively more interested in tailoring). In terms
of education level attained, preferences are similar for those who attained less than a secondary
degree, while those with a secondary degree are much more likely to apply for a program in
computer/secretarial services. There do not appear to be substantial differences in terms of years
since last in school, whether the individual has previously attended any vocational training, or
whether or not they are currently working.
6.2 Program Take-up
Program take-up rates illustrate strong participant interest in vocational training. Of the 1,055
individuals offered a voucher, 778 youth (74%) used that voucher for at least one term of
vocational training between 2009 and 2010. Perhaps surprisingly, there are no statistically
significant differences in take-up across gender, years since last in school (above or at/below
median), or previous vocational training, although older voucher winners and those who reported
being employed at the time of the pre-program informational meetings were less likely to use their
voucher (by 7.9 percentage points for employed; results not shown).
There are, however, statistically significant differences in the take-up rate between
individuals who were awarded the restricted (government only) vouchers and those who were
awarded unrestricted vouchers (results not shown). Specifically, 79% of unrestricted voucher
recipients attended vocational training at some point after January 2009 while only 69% of
publiconly recipients attended for at least one term. Furthermore, the finding that individuals
employed at the start of the program were less likely to take-up is driven by those who received
restricted vouchers (results not shown). This is sensible since any expansion in training options
should be associated with higher take-up, by leading to the possibility of better trainee-institution
matches.
Within their institutions of choice, individuals enrolled in a range of different courses.
Onethird of voucher winners chose courses that lasted 2 years or more (at least 6 school terms),
while roughly 50% of voucher winners chose courses that lasted at most 1 year. Table 6 describes
course selection by voucher winners. The most popular courses among voucher winners were
Tailoring (38%), Motor Vehicle Mechanic (18%), Hairdressing and Beauty (9%), Driving (7%)
and Masonry (6%). The most popular courses for male voucher winners were Motor Vehicle

24
Mechanic (40%), Driving (16%) and Masonry (16%), while the most popular courses for females
were Tailoring (60%), Hairdressing and Beauty (14%) and Secretarial and Computing (11%).
Course length varied widely across these choices, from 1.4 to 7.3 three-month terms.
The project received an official decline of interest from 46 treatment students (4% of those
awarded a voucher). Of those who gave a specific reason, 23% had enrolled in an academic college
(including teachers’ colleges, academic technical colleges, and private diploma courses), 17%
enrolled in a four-year university, 15% enrolled in secondary or advanced-level secondary school
in Kenya or Uganda, and 3% returned to primary school. Aside from academic schooling options,
12% cited family care needs, 9% distance to available training centers, and 9% work
responsibilities. Only 6% expressed dissatisfaction with the courses on offer, as expected since this
is a sample of individuals that had shown genuine initial interest in vocational education by
attending program recruitment meetings in the first place.
Fewer than 4% of the control group sample, or 41 individuals, were reported to have
enrolled in some type of vocational schooling during 2009-2010. Of these, just over one-third
enrolled in institutions participating in the intervention, while the remaining individuals enrolled
in apprenticeship-type training with smaller private enterprises. Approximately 2% of the control
group was attending a secondary school or other academic institution, 19% were working and the
remaining 67% for whom we have data were “farming” (which typically means performing
subsistence agriculture for one’s own household) or “just at home”.
6.3 Educational Attainment
We use the KLPS-3 data (described in more detail in Section 3.1) to examine the impact of the
program on years of vocational education completed. While previous analysis presented above
examined initial program take-up, we can compare the differences in educational attainment across
treatment and control groups. This analysis also serves as the first-stage in a standard econometric
model that estimates the Mincerian returns to (vocational) education (Equation 1).
The results are shown in Table 7. Individuals who were awarded a voucher completed 0.55 years
more of vocational education than their counterparts in the control group. As control group
individuals attained 0.32 years of vocational education, these estimates suggest that the vouchers
nearly doubled vocational educational attainment among program participants. This strong
statistically significant effect of the vouchers on vocational educational attainment suggests that

25
the price of vocational training, possibly coupled with credit constraints, are a major impediment
to vocational education access.
6.4 The Information Intervention and the Demand for Vocational Training
Females and males participants of the vocational training program listed quite disparate course
preferences, conforming to traditional gender patterns in Kenya. Specifically, men expressed their
preference for male-dominated courses such as motor vehicle mechanics or driving, while women
expressed their preference for traditionally female-dominated courses such as tailoring or
hairdressing. Only 15% of women preferred male-dominated courses (vehicle- and
constructionrelated, Table 5) while 15% of men preferred female-dominated courses (mainly
tailoring, but also beauty, Table 5).
Results suggest that large information gaps existed in the sample at the start of the program.
On average both men and women appear to have had somewhat optimistic perceptions about the
returns to vocational training: they believed that the average returns were 61% compared to an
estimated Mincerian return (using the KLPS data) of 37%. 18 Sample individuals were also
mistaken about the highest earning trades. Individuals believed tailoring and mechanics were the
highest earning trades for women and men respectively. However, our data showed that the most
lucrative trades were actually hairdressing for women and tailoring for men. Given these apparent
baseline misperceptions about returns to vocational training, the provision of additional
information could potentially have had meaningful consequences on individual educational
choices.
We examine the impact of the information treatment on program enrollment, institution
preferences, and take-up decisions in Tables 8 and 9. The information intervention did not
significantly affect individual decisions to apply to the program (Table 8, Column 1), nor did it
affect enrollment for voucher winners (Table 8, Column 3). However, the intervention did have a
significant impact on females preferring and female voucher winners ultimately enrolling in
maledominated courses (Table 9, Columns 1 and 3). In fact, females exposed to the information
intervention were more than 5 percentage points more likely to express a preference for a
18 One important caveat is that the Mincerian returns estimated from the KLPS data likely suffer from some
selection bias, and thus are not always a reliable benchmark, as discussed in section 3.1 above.

26
maledominated course, and 5 percentage points more likely to actually enroll in one. More
educated females were especially likely to prefer for male-dominated fields.
The information treatment also made respondents more likely to express a preference for a
government (public) training institution (Table 8, Column 2), perhaps in part because these
institutions’ industrial trade and construction courses are traditionally male-dominated. Males also
preferred government institutions, probably due to the increased availability of courses such as
motor vehicle mechanics in government schools relative to private schools.
6.5 Course Completion Among Voucher Winners
School fees are often cited as the primary factor causing students to dropout of educational
institutions in Kenya (Republic of Kenya, 2007). This factor is not relevant for the majority of
voucher winners in our sample, for whom the voucher award pays for all fees, allowing us to
understand other important determinants of dropout choices beyond fees.
Despite recruiting individuals who claimed to be highly interested in vocational training, and
paying for all (or nearly all) of their fees, we still observe moderate dropout rates among the
participants. Defining course completion as attending all terms of the course, 52% of voucher
winners who enrolled in vocational training completed the course in which they enrolled (48% of
female enrolled voucher winners, Table 10). Defining course completion slightly more flexibly to
allow participants to miss one term (as long as it wasn’t the final term) of the course, 58% of
enrolled voucher winners completed their courses (54% of female enrolled voucher winners). This
retention rate is lower than the rate found in Kenyan secondary schools, although it should be noted
that the secondary rate is probably higher due to the positive selection caused by the low primary
to secondary school transition rate (World Bank, 2004). For those individuals who did dropout, we
observe a fairly sizeable degree of variation in the timing of dropout. The average dropout
completes approximately three-quarters of their course before dropping out. This equates to
approximately 3.6 terms, or 1.2 years of vocational education.
Table 10 explores the determinants of course completion among vocational training program
voucher winners who enrolled in training. Completion data used in this table was collected during
monitoring visits to training institutions during 2009-2010. Columns (1) and (4) define completion
as attended all terms of the course, for all participants and female participants, respectively.
Women were substantially less likely to attend every term than men (by 9.5 percentage points, s.e.

27
4.4). Furthermore, restricted (public-only) voucher winners were less likely than unrestricted
voucher winners (by 6.7 p.p., s.e. 3.6). This makes sense, since the restricted choice set of
institutions should lead to lower quality individual-institution “matches” than in the unrestricted
voucher case. Despite some evidence on the impact of information on training course selection,
we do not find that the provision of information had any impact on retention. There were also no
differences in completion according to prior program participation (PSDP versus GSP), years of
schooling attained, whether the participant completed secondary school or received prior
vocational training, or age. Similar results are obtained if we define completion somewhat more
flexibly, allowing participants to miss 1 term of their course as long as it wasn’t the final term
(Column 2). Among female enrolled voucher winners, there is suggestive evidence that those who
completed secondary school were somewhat more likely to complete their vocational training
course (Column 5).
The simple retention analysis in Columns (1) and (2) (Columns 4-5 for females) can mask
differences in the timing of dropout behavior. Columns (3) and (6) measure the percentage of
course completed to provide a clear metric on human capital acquisition of program participants,
since there is some variance in course length, for the full sample of enrolled voucher winners and
for females, respectively. This analysis shows that individuals with restricted (public institution
only) vouchers completed 5 percentage points less of their course than unrestricted voucher
winners. Females completed 8 percentage points less of their course than males, and individuals
with higher schooling attainment at baseline completed more coursework than less educated
individuals. Taken together, these results also suggest that students placed considerable valuation
on the greater choice provided by the unrestricted voucher, and this led them to complete more
training, most likely because greater flexibility in the institution and course choice led to higher
quality individual-institution matches.
6.6 Analysis of Medium-Term Labor Market Impacts
6.6.1 Attrition and Tracking in the KLPS-3 Follow-up Survey
The entire vocational training program sample of 2,163 individuals was tracked in a medium-term
follow-up round, as part of the Kenyan Life Panel Survey Round 3. Tracking was randomly divided
into two Waves, where each wave was representative of the whole. This was done in part to allow
for improvements to survey instruments over time. Tracking Wave 1 was launched in August 2011,

28
and lasted approximately 16 months. Tracking Wave 2 was launched in July 2013, and lasted
approximately 14 months. Hence, individuals interviewed during Tracking Wave 1 were surveyed
in some cases as little as a few months following the end of their training program, while those
interviewed during Tracking Wave 2 were surveyed 2-3 years following the end of their training
program. This variation in the timing of interview can have important implications for our analysis,
and we take advantage of the random splitting of the sample into survey Tracking Waves in our
medium-term impacts analysis.
Table 11 describes attrition in the KLPS-3 survey round among the vocational training program
sample.19 In particular, 88% of the sample was successfully surveyed, and information collected
from them on years of vocational training attended. There is no evidence of differential attrition
across the interventions we explore in what follows – assignment to receive a vocational training
voucher, or assignment to receive the information intervention. There is suggestive evidence that
restricted (public only) voucher winners were slightly less likely to be surveyed in the medium-
term follow-up round (3.9 percentage points, s.e. 2.0) – we do not explore that intervention in what
follows. Furthermore, there was no differential attrition across any baseline characteristics,
including gender, age, schooling attainment by 2008, attended vocational training prior to 2009,
vocational training institution or course preference in 2008, baseline program participation (PSDP
versus GSP), and whether the individual was assigned to the treatment group in their baseline
program.
6.6.2 Earnings
We use the KLPS-3 follow-up data to examine the impact of vocational training on earnings in
Table 12, taking advantage of the random division of the sample into two Tracking Waves as
described above. Overall we find limited evidence on program impacts on earnings. The reduced
form results in Panel A suggests a negative impact of vocational training vouchers on total
earnings among those with positive (non-zero) earnings who were surveyed in Wave 1, but a
positive, more-than-compensating increase in total earnings among those surveyed during Wave
2. This suggests that there were some positive impacts of the training vouchers on earnings
among those with positive earnings, but not until they had been out of training for a number of
19 Note that one observation is missing from this table, as this individual is missing baseline information on whether
he/she had previously attended vocational training.

29
months (recall that Wave 2 individuals were surveyed more than a year after those in Tracking
Wave 1).20 However, this evidence is only suggestive – the 2SLS results have the appropriate
signs but are not statistically significant at traditional confidence levels. Furthermore, the results
including individuals with zero earnings also have the same signs (negative for those interviewed
in Tracking Wave 1, positive for those interviewed in Tracking Wave 2) but again are not
statistically significant.
Panels B and D provide no evidence of impacts on overall non-agricultural earnings or
earnings from self-employment. Panel C examines the impact of the program on wage earnings.
While we do not find a statistically significant impact of the program on wage earnings for the
full sample, we do find suggestive evidence that the program led to increases in hourly wage
earnings for individuals that worked for a wage (i.e. individuals with positive wage earnings and
positive hours in the wage work sector at the time of follow-up). In particular, our IV estimates
for hourly wage earnings show that the Mincerian rate of return was 39% for an additional year
of vocational education, which is a very high rate of return. However, these findings are
necessarily tentative, given that individuals select into the wage employment sector (a finding
discussed in more detail below), and less than a quarter of the program participant sample are in
the wage employment sample.
6.6.3 Sector Shifts and Hours Worked
We examine the impact of the vouchers on the work sector and labor supply of program
participants in Table 13. There is no evidence to suggest increases in work hours on the intensive
margin (Panel A). Examining the extensive margin (Panel B), surprisingly, we do not find any
evidence that the program led to a shift out of agriculture (although the main term coefficient is
positive and the coefficient on the interaction with the Wave 2 indicator is negative). We do find
suggestive evidence of initial shifts away from non-agricultural employment, with later shifts into
this sector, and these results are driven by shifts in wage employment. We also do not see any
significant change in the labor supply of individuals in our sample. However, we find that the
20 It may be that the voucher control group initially benefits from the extra potential (or actual) experience relative to
the voucher treatment group, who are just entering the labor market. Standard models of human capital would
predict that while the initial earnings differences between the treatment and control groups would be small (or even
negative), these earnings differences between the groups would grow over time as the returns to education were
realized.

30
program led to an initial decrease, and then later a more-than-compensating increase, in the
probability of full time non-agricultural employment, as well as some evidence that by Tracking
Wave 2, voucher recipients were more likely to own a licensed non-agricultural business.
6.6.4 Other Impacts
We examine the impact of the program on migration and living standards in Table 14. Panel A
displays the results on migration. Surprisingly, it appears that individuals who did not receive a
training voucher (the reduced form results), or individuals who had lower levels of vocational
training (the 2SLS results) are more likely to be living in a city or outside of Kenya by the second
Tracking Wave of data collection.
Panel B of Table 14 explores selected consumption and well-being measures, such as
number of meals eaten and asset ownership, which were collected during the KLPS-3 interview
for the whole sample. Overall, we do not find significant improvements in consumption or
wellbeing due to the program. Furthermore, we see some evidence of a fall in consumption for
individuals surveyed later (fewer meals eaten for those interviewed in Wave 2, in both the
reduced form and 2SLS results).
Table 15 explores a range of other outcomes, including attitudes (Panel A), human capital
(Panel B), and marriage and fertility (Panel C). There is some evidence of decreased support for
democracy and the Kenyan government, and decreased political participation as a result of the
program, although this evidence is suggestive at best. There is no evidence of a program impact
on human capital in the form of math and sentence reading test scores, and little to suggest
impacts on marriage or fertility.
7. Discussion The evidence shown in this report suggests that vouchers are a potentially effective way of
encouraging investment in vocational education in Kenya. The results show that individuals who
were awarded a voucher were able to acquire more vocational education, consistent with the notion
that fees and credit constrains limit educational investments in this environment. We found
suggestive (but not dispositive) evidence of shifts out of agriculture and into (wage) employment,
however, we found little evidence of improvements in well-being or human capital due to the

31
program. We found limited evidence on earnings, where we only see statistically significant
increases in wages among wage earners.
There are two major limitations of our study thus far. First, we are still working to explore the
potential differences in the returns between private and public schooling and other heterogeneity
analyses. Using the initial enrollment data, we did observe that individuals who were awarded an
unrestricted voucher had higher take up rates compared to those awarded a restricted (public
institution only) voucher. These take up differences may be driven by the greater ability of
unrestricted voucher winners to find a program that better suits their needs. Our data suggest that
private institutions may provide more flexible and relevant training, thus individuals who have
access to them may be able to better customize their training programs. Second, the timing of the
KLPS-3 follow up was potentially too close to the completion of training. Since the returns to
education investments may not accrue in the short-run, our ability to document labor market
outcomes from the program may be limited. We plan to conduct another (longer-run) follow-up
survey (KLPS-4) in 2015/16.
The scarcity of start-up capital may also potentially dampen the ability of program beneficiaries
to reap the benefits of their training. Our data show that 75% of those not in selfemployment report
that the lack of capital is the main impediment to them starting a business. Discussions with
training program enrollees highlighted the lack of start-up capital as a significant impediment to
youth utilizing the skills obtained in vocational training. In particular, youth cited credit constraints
as a major obstacle to their future plans, impeding their ability to enter into selfemployment by
starting their own enterprises and diminishing the employment prospects for youth in trades such
as auto-mechanics due to their inability to finance the purchase of tools. The complementarity
between human and financial capital may be one reason for the dramatic program effects found in
Blattman, Fiala, and Martinez (2013). We will explore this possibility in more detail in future work
by overlaying a start-up capital grant intervention on top of this current program.

32
8. References
Angrist, Joshua, Eric Bettinger, and Michael Kremer (2006). “Long-Term Consequences of
Secondary School Vouchers: Evidence from Administrative Records in Colombia.”
American Economic Review, 96(3), 847-862.
Angrist, Joshua, Eric Bettinger, Erik Bloom, Elizabeth King and Michael Kremer (2002).
“Vouchers for Private Schooling in Colombia: Evidence from a Randomized Natural
Experiment.” American Economic Review, 92(5), 1535-1558.
Attanasio, Orazio, Adriana Kugler and Costas Meghir (2011). "Subsidizing Vocational Training
for Disadvantaged Youth in Colombia: Evidence from a Randomized Trial.” American
Economic Journal: Applied Economics, 3(3), 188-220.
Bandiera, Oriana, Niklas Buehren, Robin Burgess, Markus Goldstein, Selim Gulesci, Imran
Rasul and Munshi Sulaiman (2014). “Women's Empowerment in Action: Evidence from a
Randomized Control Trial in Africa.”
Bandiera, Oriana, Robin Burgess, Naryan Das, Selim, Gulesci, Imran Rasul, Munshi Sulaiman
(2013). “Can Basic Entrepreneurship Transform the Lives of the Poor?” IZA Discussion Paper
No. 7386. Available at SSRN: http://ssrn.com/abstract=2266813
Bettinger, Eric, Michael Kremer and Juan Saavedra (2010). “Are Education Vouchers Only
Redistributive?” Economic Journal,120(546), 204-228.
Blattman, Christopher and Fiala, Nathan and Martinez, Sebastian (2013). “Generating Skilled
SelfEmployment in Developing Countries: Experimental Evidence from Uganda.” Quarterly
Journal of Economics, forthcoming.
Bruhn, M., and D. McKenzie (2009). “In pursuit of balance: Randomization in practice in
development field experiments”, American Economic Journal: Applied Economics, 1(4).
Card, David, Pablo Ibarraran, Ferdinando Regalia, David Rosas-Shady and Yuri Soares (2011).
“The Labor Market Impacts of Youth Training in the Dominican Republic.” Journal of Labor
Economics, 29(2), 267-300
Casey, Katherine, Rachel Glennerster, and Edward Miguel (2012). “Reshaping Institutions:
Evidence on Aid Impacts Using a Pre-Analysis Plan” Quarterly Journal of Economics, 127(4),
1755-1812.
Cho, Yoonyoung, Davie Kalomba, A. Mushfiq Mobarak, and Victor Orozco (May 2013).
“Gender Differences in the Effects of Vocational Training: Constraints on Women and
Dropout Behavior.” IZA Discussion Paper 7408.
33
Hirshleifer, Saroini, and McKenzie, David and Almeida, Rita and Ridao-Cano, Cristobal (2014).
“The Impact of Vocational Training for the Unemployed: Experimental Evidence from
Turkey.” Economic Journal, forthcoming.
King, Kenneth and Chris Martin (2002). “The Vocational School Fallacy Revisited: Education,
Aspiration and Work in Ghana 1959-2000.” International Journal of Education Development,
22(1), 5-26.
Kremer, Michael, Edward Miguel and Rebecca Thornton (2009). “Incentives to Learn.” Review of
Economics and Statistics, 91(3), 437-456.
Maitra, Pushkar and Subha Mani. (2012). “Learning and Earning: Evidence from a Randomized
Evaluation in India.” Monash University Department of Economics Discussion Paper 44/12.
Miguel, Edward and Michael Kremer (2004). “Worms: Identifying Impacts on Education and
Health in the Presence of Treatment Externalities.” Econometrica, 72(1), 159-217.
Nishimura, M. and Orodho, J. (1999). Education, Vocational Training and Employment:
Designing Projects that Link Education and Vocational Training and Employment in Kenya.
JICA, Nairobi.
Republic of Kenya (2007). “Kenya Integrated Household Budget Survey 2005/06 (KIHBS).”
Central Bureau of Statistics, Ministry of Finance and Planning. Government Printer: Nairobi.
Republic of Kenya (1999). “Demographic and Health Survey 1998 (KDHS).” Central Bureau of
Statistics, National Council for Population and Development. Government Printer: Nairobi.
World Bank (2004). “Strengthening the Foundation of Education and Training in Kenya:
Opportunities and Challenges in Primary and General Secondary Education” Report No.
28064-KE. Washington DC.
World Bank. (2007) World Development Report 2007. Washington DC.
World Bank (2008) Kenya Poverty and Inequality Assessment. Washington DC

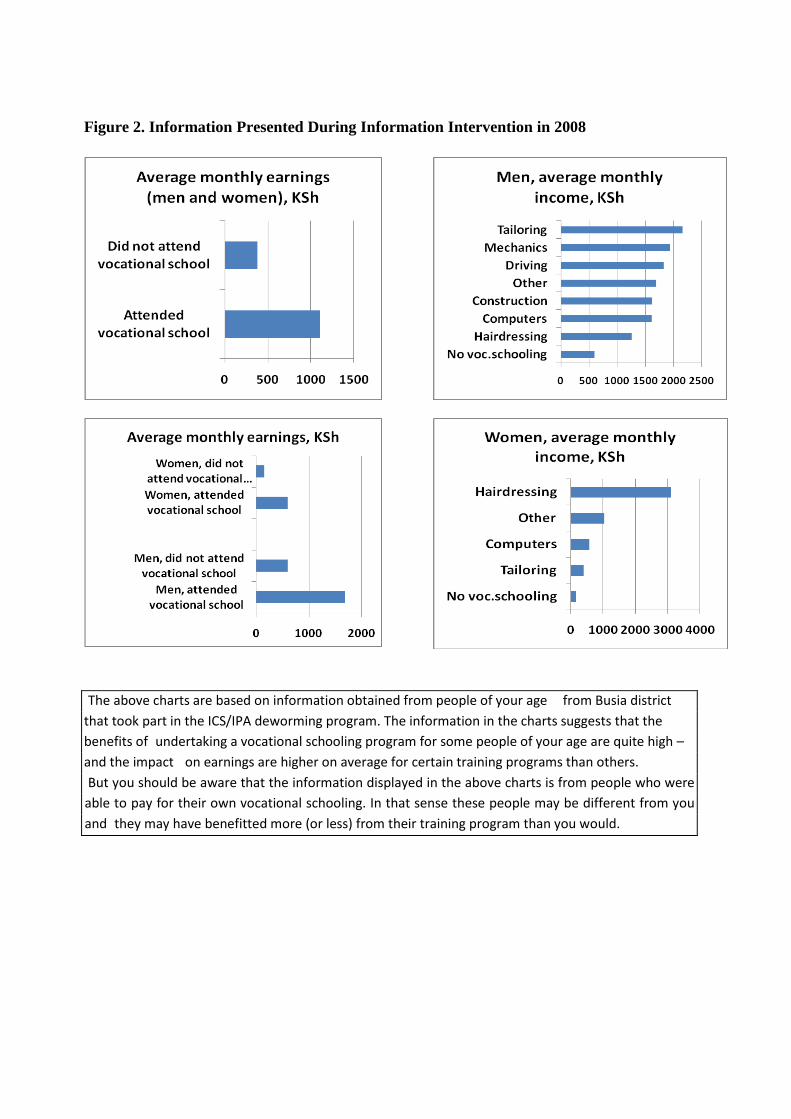
Figure 2. Information Presented During Information Intervention in 2008
The above charts are based on information obtained from people of your age from Busia district
that took part in the ICS/IPA deworming program. The information in the charts suggests that the
benefits of undertaking a vocational schooling program for some people of your age are quite high –
and the impact on earnings are higher on average for certain training programs than others.
But you should be aware that the information displayed in the above charts is from people who were
able to pay for their own vocational schooling. In that sense these people may be different from you
and they may have benefitted more (or less) from their training program than you would.

Table 1. Summary Statistics on Voucher Design
Expenses covered Public-Only Voucher Unrestricted Voucher
Tuition, Materials, Uniform,
Trade Test Fees Tuition, Materials, Uniform,
Trade Test Fees Expenses not covered Board, Lunch, Transport Board, Lunch, Transport Voucher amount (mean) in Kshs 21,507 19,858 Voucher amount (median) in Kshs 21,300 18,000 Out-of-pocket costs (mean) in Kshs 8,289 6,988 Out-of-pocket costs (median) in Kshs 1,000 1,000 Voucher percent of total costs (mean) 72.2% 74.0% Voucher percent of total costs (median) 95.5% 94.7% Course duration (3 month terms) 4.06 3.29
Notes: Data on voucher amounts and term length was collected during monitoring visits to training institutions of
voucher winners during 2009-2010. Data on out-of-pocket costs was collected for a subsample of 112 voucher
winners during a midline follow-up survey conducted in mid-2010. Data on course duration was collected from
Vocational training centers where voucher winners enrolled.

Table 2. Baseline Summary Statistics, Vocational Training vs. Other KLPS Participants
Female
Full KLPS
Sample VocEd
Sample Non-VocEd
Sample (VocEd -
Non-
VocEd) 0.654 0.630 0.660 -0.030***
Age in 2008 21.9 22.0 21.9 0.147*** 1998/2001 (KLPS baseline) grade 4.8 4.9 4.7 0.122*** Previous program participation
Participated in PSDP 0.700 0.695 0.701 -0.006 Assigned to PSDP treatment group 0.461 0.463 0.461 0.002 Assigned to GSP treatment group 0.147 0.164 0.142 0.021**
Number of observations 10,758 2,163 8,595 10,758
Notes: Data presented in this table was drawn from baseline (1998/2001) information for the full KLPS sample. The
first three columns present sample means, while the fourth column displays the average difference between those
who participated in the Vocational Training Program (i.e., VocEd Sample) and those who did not participate (i.e.,
NonVocEd Sample). *** indicates p≤0.01, ** indicates p≤0.05, and * indicates p≤0.1. Note that 14.5% of
observations are missing age data.

Table 3. Pre-Intervention Summary Statistics, by Voucher Treatment Group
Female
Age Location of residence
Busia District1
District neighboring Busia2
City3
Previous program participation Participated in PSDP Assigned to PSDP treatment group
Assigned to GSP treatment group
Highest level of schooling completed4
Some primary Primary Some secondary Secondary
Other education characteristics
Total years of schooling completed4
Number of years since last in school4
In school Ever attended vocational training
Employed5
In agriculture/fishing In retail In an unskilled trade In a skilled trade As a professional
Preferred training course group6
Construction and related Textiles and tailoring Mechanics and driving Beauty Computers, secretarial, business
Other
Prefers to attend private institution7
Number of observations
All Treatment Control T-C
Overall Unrestricted Restricted
0.630
21.7
0.893
0.042
0.055
0.695 0.463 0.164
0.264 0.376 0.108 0.241
8.8
3.8 0.025 0.218
0.136 0.204 0.211 0.068 0.211 0.058
0.118 0.324 0.247 0.129 0.149
0.033
0.433
2,163
0.625
21.6
0.895
0.042
0.050
0.695 0.479 0.153
0.263 0.383 0.110 0.234
8.8
3.8 0.028 0.218
0.137 0.214 0.186 0.062 0.221 0.069
0.118 0.328 0.238 0.135 0.152
0.030
0.450
1,055
0.622
21.6
0.889
0.040
0.055
0.694 0.485 0.150
0.255 0.405 0.114 0.209
8.7
3.9 0.034 0.231
0.137 0.181 0.181 0.056 0.306 0.069
0.105 0.333 0.240 0.129 0.156
0.038
0.464
526
0.628
21.7
0.901
0.044
0.046
0.696 0.473 0.155
0.270 0.361 0.106 0.250
8.9
3.8 0.023 0.203
0.138 0.247 0.192 0.068 0.137 0.068
0.130 0.323 0.236 0.140 0.147
0.023
0.437
529
0.635
21.8
0.891
0.042
0.059
0.695 0.449 0.174
0.265 0.370 0.106 0.247
8.8
3.9 0.023 0.217
0.134 0.195 0.235 0.074 0.201 0.047
0.119 0.320 0.255 0.124 0.146
0.035
0.416
1,108
-0.011 -0.120*
0.003
0.000
-0.008
0.000 0.030 -0.022
-0.003 0.013 0.003 -0.013
-0.025
-0.038 0.006 0.000
0.003 0.019 -0.049 -0.012 0.019 0.022
-0.002 0.008 -0.018 0.011 0.005 -0.005
0.034
2,163
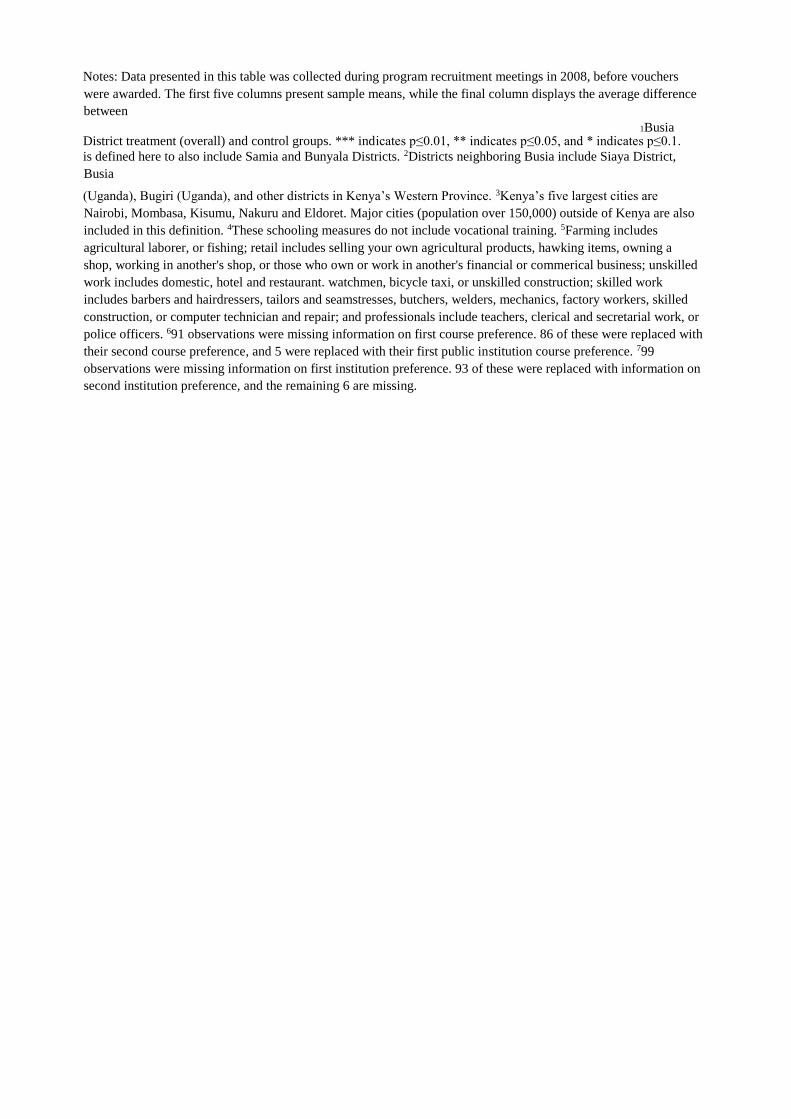
Notes: Data presented in this table was collected during program recruitment meetings in 2008, before vouchers
were awarded. The first five columns present sample means, while the final column displays the average difference
between 1Busia
District treatment (overall) and control groups. *** indicates p≤0.01, ** indicates p≤0.05, and * indicates p≤0.1. is defined here to also include Samia and Bunyala Districts. 2Districts neighboring Busia include Siaya District,
Busia
(Uganda), Bugiri (Uganda), and other districts in Kenya’s Western Province. 3Kenya’s five largest cities are
Nairobi, Mombasa, Kisumu, Nakuru and Eldoret. Major cities (population over 150,000) outside of Kenya are also
included in this definition. 4These schooling measures do not include vocational training. 5Farming includes
agricultural laborer, or fishing; retail includes selling your own agricultural products, hawking items, owning a
shop, working in another's shop, or those who own or work in another's financial or commerical business; unskilled
work includes domestic, hotel and restaurant. watchmen, bicycle taxi, or unskilled construction; skilled work
includes barbers and hairdressers, tailors and seamstresses, butchers, welders, mechanics, factory workers, skilled
construction, or computer technician and repair; and professionals include teachers, clerical and secretarial work, or
police officers. 691 observations were missing information on first course preference. 86 of these were replaced with
their second course preference, and 5 were replaced with their first public institution course preference. 799
observations were missing information on first institution preference. 93 of these were replaced with information on
second institution preference, and the remaining 6 are missing.

Table 4: Pre-Intervention Local Labor Market Characteristics
Fraction of individuals in:
Agriculture All Male Female
0.745 0.739 0.753
Wage Employment, of which: 0.152 0.209 0.088 Food, Travel, and Tourism 0.073 0.056 0.118 Skilled Construction 0.116 0.159 0.000 Unskilled Construction 0.077 0.103 0.008 Tailoring and Textiles 0.037 0.003 0.129 Professional 0.102 0.087 0.141 Government 0.065 0.085 0.012 Business and Retail 0.199 0.220 0.141 Transportation 0.014 0.019 0.000 Other Low-Skill Work 0.096 0.043 0.236 Other 0.231 0.237 0.214
Self Employment, of which: 0.112 0.115 0.108 Food, Travel, and Tourism 0.336 0.215 0.481 Skilled Construction 0.008 0.015 0.000 Unskilled Construction 0.039 0.067 0.006 Tailoring and Textiles 0.124 0.070 0.190 Professional 0.005 0.009 0.000 Business and Retail 0.174 0.141 0.214 Transportation 0.061 0.111 0.000 Other Low-Skill Work 0.029 0.039 0.018 Other 0.242 0.359 0.099
Unemployed1 0.272 0.269 0.277
Observations 5,083 2,596 2,487
Notes: The data used in this table comes from the KLPS-2 survey, which was
collected during 2007-2009. All sub-category breakdowns display fractions of the
total in that category. Means are weighted to preserve initial population weights. 1Unemployed individuals are defined as those who are not employed in wage or self-
employment, and are currently looking for a job. The number of observations for the
"Unemployed" category is 5,049 for "All", 2,580 for "Male", and 2,469 for "Female".

Table 5. Pre-Intervention Participant Course Preferences
Overall Tailoring
VehicleRelated Computers/
Secretarial Beauty Construction Other No.
Obs 0.324 0.247 0.149 0.129 0.118 0.033 2,163
Gender
Male 0.123 0.485 0.091 0.026 0.241 0.034 800 Female 0.442 0.107 0.183 0.189 0.046 0.032 1,363
Age At or below median 0.343 0.190 0.183 0.144 0.103 0.038 1,100 Above median 0.305 0.306 0.114 0.114 0.135 0.027 1,063
Location of Residence
Busia District1 0.326 0.243 0.146 0.128 0.124 0.032 1,927 District surrounding Busia2 0.411 0.211 0.167 0.144 0.033 0.033 90
City3 0.178 0.339 0.186 0.136 0.110 0.051 118
Education Level4
Some primary 0.408 0.235 0.065 0.142 0.142 0.009 571 Primary degree 0.365 0.247 0.093 0.143 0.124 0.028 814 Some secondary 0.321 0.295 0.115 0.154 0.090 0.026 234 Secondary degree 0.177 0.242 0.332 0.083 0.096 0.071 521
Years since school
At or below
median 0.304 0.232 0.191 0.122 0.108 0.043 1,366 Above median 0.359 0.272 0.077 0.142 0.136 0.015 797
Attended vocational training No 0.316 0.249 0.152 0.128 0.117 0.038 1,672 Yes 0.357 0.234 0.140 0.129 0.125 0.015 465
Working
No 0.336 0.225 0.154 0.138 0.113 0.034 1,869 Yes 0.248 0.384 0.116 0.071 0.153 0.027 294
Notes: Data presented in this table was collected during the program recruitment meetings, before vouchers were awarded. 91
observations were missing information on first course preference. 86 of these were replaced with their second course preference, and
5 were replaced with their first public institution course preference. 1Busia District is defined here to also include Samia and Bunyala
Districts, which were just recently defined as distinct administrative districts by the Kenyan government. 2Districts neighboring Busia
include Siaya District, Busia (Uganda), Bugiri (Uganda), and other districts in Kenya’s Western Province. 3Kenya’s five largest cities
are Nairobi, Mombasa, Kisumu, Nakuru and Eldoret. 4Primary school rus through grade 8; secondary school runs through grade 12.

Table 6. Courses Chosen By Enrolled Voucher Winners
Construction
Carpentry
Number of
Students % of All
Students % of Male
Students % of Female
Students Avg Course
Length (Terms)
14 1.8 4.7 0.0 6.0 Masonry 48 6.2 15.9 0.2 6.0 Metal Work 4 0.5 0.7 0.4 6.0 Mechanical/Mechanical Engineering 4 0.5 1.4 0.0 7.3 Welding and Plumbing 9 1.2 2.0 0.6 6.0 Electrical Engineering/Installation 26 3.3 5.4 2.1 6.6
Textile
Tailoring/Dressmaking/Textile21 297 38.2 2.4 60.0 5.5 Embroidery 3 0.4 0.0 0.6 3.0
Vehicle Related
Driving 51 6.6 16.3 0.6 4.7 Motor Vehicle Mechanics 140 18.0 40.7 4.1 4.7
Hairdressing and Beauty 68 8.7 0.3 13.9 2.7 Computers/Secretarial
Computer Packages 23 3.0 3.1 3.1 1.4 Secretarial 12 1.5 0.3 2.3 4.8 Copy Typist/Clerk 2 0.3 0.0 0.4 2.0 IT (Secretarial and Computer) 26 3.3 0.0 5.4 5.0 Computer Systems and Applications 4 0.5 0.0 0.6 1.5 Computer Engineering 2 0.3 0.7 0.0 3.0
Business Skills Business Administration 21 2.7 1.7 3.3 5.5 Business Management 1 0.1 0.3 0.0 6.0 Sales and Marketing 4 0.5 0.0 0.8 -- Human Resources 3 0.4 0.3 0.4 2.0
Food/Tourism Hotel and Catering/Hospitality 2 0.3 0.3 0.2 3.0 Travel and Tourism 5 0.6 0.3 0.8 2.0
Other
Electronics 3 0.4 1.0 0.0 5.8 Others 6 0.8 2.0 0.0 --
Number of Observations 778 778 295 483 --
Notes: Data on course of enrollment for voucher winners, and on average course length, was collected during monitoring
visits to training institutions of voucher winners during 2009-2010. Individuals who enrolled in more than one course have
been assigned to their 'primary' or 'longest' course. All categories include their relevant certificates and diplomas; for
example, "Motor Vehicle Mechanics" includes the Automotive KNEC Certificate. The average course length column uses
separate school-course level data on time needed to complete a course. "Driving" and "Motor Vehicles" were combined in
the analysis of course term length, since some courses were "Driving and Motor Vehicle Mechanics" courses. "Other" does
not adaquately capture the types of courses students enrolled in. There was no data for "Sales and Marketing".
21 "Tailoring/Dressmaking/Textile" includes "Suiting" and "Dressmaking only".

Table 7. Relationship Between Voucher Assignment and Vocational Training
Dependent Variable: Years VocEd Completed by KLPS-3 Interview Indic for
Attended VocEd
by KLPS-3 Assigned to vocational training voucher
0.544***
(0.056) (0.053) (0.029) (0.028) Assigned to information intervention 0.016 0.010 0.017 0.016
(0.047) (0.044) (0.029) (0.026)
Vocational training voucher * Information
intervention 0.086 0.062 -0.007 -0.016
(0.083) (0.077) (0.043) (0.040)
Demographic and stratification controls No Yes No Yes Number of observations 1,896 1,896 1,896 1,896 R2 0.099 0.217 0.141 0.257
Mean (std dev) in voucher control group 0.320 0.320 0.286 0.286
(0.738) (0.738) (0.452) (0.452)
Notes: Data used in this table was drawn from the KLPS-3 survey, as well as information collected during
program recruitment meetings in 2008, before vouchers were awarded. Demographic and stratification controls
include an indicator for female, 2008 age, years of schooling attained by 2008, an indicator for vocational training
prior to 2009, an indicator for preference to attend a private vocational training center (2008), indicators for
preference to enroll in one of 5 different course groups (2008), an indicator for participation in the PSDP, an
indicator for assignment to the PSDP treatment group, an indicator for assignment to the GSP treatment group, an
indicator for interviewed in KLPS-3 Wave 2, and a measure of months since launch of KLPS-3 surveying. Robust
standard errors in parentheses. *** indicates p<0.01, ** indicates p<0.05, and * indicates p<0.1.

Table 8. Information Intervention Impacts on Applications, Preferences, and Enrollment
Dependent Variable:
Completed Valid Preference Sheet and
Entered VocEd Sample
Chose a Public Institution as Top
Preference Of Voucher Winners,
Confirmed Enrollment
Of Unrestricted Voucher Winners, Enrolled in a
Public Institution
Assigned to information intervention
(1) (2) (3) (4)
-0.016 0.071** -0.033 0.033
(0.024) (0.035) (0.037) (0.055)
Assigned to a public only voucher -- -- -0.101*** --
-- -- (0.026) --
Female 0.013 -0.096*** -0.051 -0.130***
(0.020) (0.032) (0.033) (0.042)
PSDP participant -0.063** -0.178*** -0.027 -0.157**
(0.024) (0.043) (0.041) (0.066)
Years of schooling attained (2008) 0.017** -0.002 -0.002 -0.002
(0.008) (0.010) (0.012) (0.018)
Completed secondary school (2008) -0.093*** -0.066 -0.037 -0.101
(0.033) (0.051) (0.048) (0.108)
Ever attended vocational training (2008) 0.004 -0.018 0.001 0.040
(0.019) (0.026) (0.034) (0.058)
Age in 2008 -0.005 -0.003 -0.017** -0.012
(0.004) (0.005) (0.007) (0.010)
Observations 2,645 2,132 1,041 517 R-Squared 0.014 0.029 0.025 0.030 Mean of Dependent Variable 0.801 0.567 0.737 0.420
Notes: Columns (1) and (2) employ data collected during program recruitment meetings in 2008, before vouchers were awarded. Columns (3) and (4)
combine this data with information collected during monitoring visits to institutions of voucher winners during 2009-2010. Column (1) includes all
individuals who attended an introductory meeting in 2008 and who provided data on the controls included, even if they did not ultimately apply to recieve

a vocational training voucher. The samples used for the remaining columns are indicated in the column headings. In Column (1), missing age data is
replaced with mean age, and the regression additionally includes an indicator for missing age data. Results presented are from OLS regressions, but are
substantively the same when a Probit specification is used. Standard errors are clustered by 2008 assigned sub-location, and all columns additionally
include a constant term. *** indicates p≤0.01, ** indicates p≤0.05, and * indicates p≤0.1.

Table 9. Information Intervention Impacts on Female Preferences and Enrollment Dependent Variable: (Among Females)
Of Program
Applicants, Chose a
Male-Dominated Of Voucher Winners,
Course as Top Of Voucher Winners, Enrolled in a Male
Preference Confirmed Enrollment Dominated Course1
Assigned to information intervention
(1) (2) (3)
0.051* -0.048 0.048*
(0.027) (0.041) (0.028)
Assigned to a public only voucher -- -0.132*** 0.005
-- (0.032) (0.024)
PSDP participant 0.129*** -0.021 0.003
(0.024) (0.042) (0.031)
Years of schooling attained (2008) -0.010 0.003 0.012
(0.008) (0.016) (0.013)
Completed secondary school (2008) 0.126*** -0.046 0.131**
(0.045) (0.067) (0.070)
Attended vocational training prior to 2009 0.017 -0.000 0.005
(0.026) (0.038) (0.022)
Age in 2008 -0.001 -0.019** -0.004
(0.004) (0.009) (0.005)
Observations 1342 649 649 R-Squared 0.039 0.038 0.081 Mean of Dependent Variable 0.169 0.733 0.094
Notes: All columns use data collected at program recruitment meetings in 2008, before vouchers were awarded. Columns (2) and (3) additionally use data collected during monitoring visits to training institutions of voucher winners during
20092010. The sample used in Column (1) includes all females who attended an introductory meeting, even if they did not
ultimately apply to recieve a vocational training voucher. Columns (2) and (3) are restricted to female voucher winners.
Results presented are from OLS regressions, but are substantively the same when a Probit specification is used; however,
in Column (3), the indicator for having completed secondary education is not significant at the 10% level using the Probit
specification. Standard errors are clustered by 2008 assigned sub-location, and all columns additionally include a constant 1Courses were assigned as "male-dominated" if, in
term. *** indicates p≤0.01, ** indicates p≤0.05, and * indicates p≤0.1. the KLPS Round 2 survey data, at least 70% of individuals who report working in that industry/occupation were male. The
male-dominated occupations thus defined include skilled construction, driving and automotive, IT and computers, sales
and marketing, and farming.

Table 10. Course Completion Among Enrolled Voucher Winners
Among All Enrolled Voucher Winners: Among All Enrolled Female Voucher Winners:
Course Compl. Co (defn 1)
urse Compl. Co (defn 2)
urse Compl. Co
Rate urse Compl. Co (defn 1)
urse Compl. Co (defn 2)
urse Compl.
Rate
Assigned to information intervention
(1) (2) (3) (4) (5) (6)
0.019 0.037 1.160 0.038 0.054 2.567
(0.036) (0.035) (2.212) (0.046) (0.046) (2.963)
Assigned to a public only voucher -0.067* -0.059* -5.186** -0.039 -0.025 -3.757
(0.036) (0.035) (2.204) (0.046) (0.046) -2.936
Female -0.095** -0.010** -8.184*** -- -- --
(0.044) (0.044) (2.811) -- -- --
PSDP participant 0.006 0.001 -0.978 0.017 -0.000 -0.970
(0.048) (0.048) (3.098) (0.050) (0.050) (3.305)
Years of schooling attained (2008) 0.021 0.022 2.553** 0.008 0.002 1.052
(0.015) (0.015) (1.040) (0.020) (0.020) (1.324)
Completed secondary school (2008) 0.075 0.004 -0.204 0.146 0.207** 5.542
(0.078) (0.044) (4.892) (0.101) (0.100) (6.581)
Ever attended vocational training (2008) -0.010 0.003 0.777 0.053 0.054 2.508
(0.044) (0.008) (2.681) (0.056) (0.055) (3.502)
Age in 2008 0.002 -0.003 -0.150 -0.006 -0.005 -0.474
(0.008) (0.008) (0.511) (0.012) (0.012) (0.789)
Observations 769 769 769 477 477 477
R-Squared 0.037 0.048 0.055 0.026 0.036 0.026
Mean of Dependent Variable 0.515 0.575 74.546 0.476 0.536 71.663
Notes: The data used in this table comes from information collected during monitoring visits to vocational training institutions where voucher winners were
enrolled, as well as from a suvey conducted in the 2008 program recruitment meetings, prior to the voucher randomization. Completion in Columns (1) and (4) is

defined such that the participant attended all terms of their program. Completion in Columns (2) and (5) allows individuals to miss one term of their course as long
as it was not the final term. The Completion Rate in Columns (3) and (6) is defined as number of terms attended divided by number of terms to complete course,
multiplied by 100. Results are from OLS regression with robust standard errors, though results for Columns (1), (2), (4) and (5) are substantively similar using a
Probit specification. All columns additionally include a constant term. Note that 9 observations are missing due to lack of data on years of schooling attainment
and/or vocational training prior to 2009. *** indicates p≤0.01, ** indicates p≤0.05, and * indicates p≤0.1.

Table 11. KLPS-3 Follow-Up Survey Attrition
Dependent Variable:
Indic for Provided Info on Vocational Training History in KLPS-3 Survey
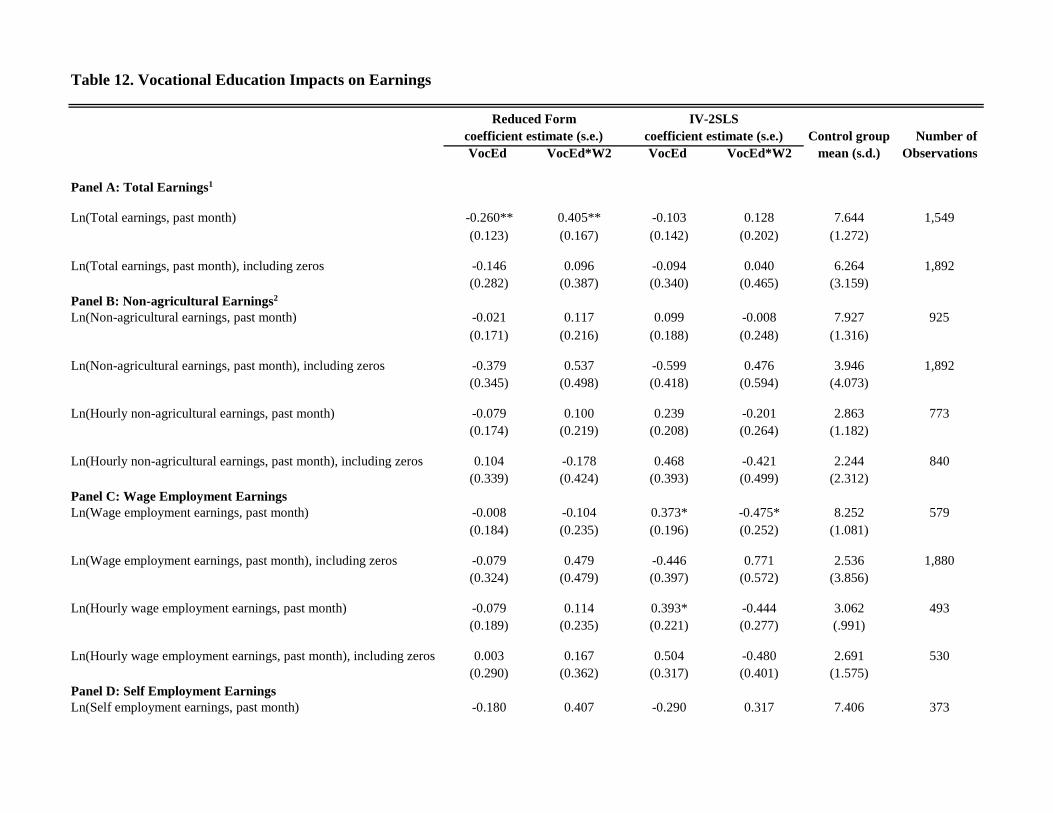
Table 12. Vocational Education Impacts on Earnings
Reduced Form IV-2SLS
coefficient estimate (s.e.) coefficient estimate (s.e.) Control group Number of VocEd VocEd*W2 VocEd VocEd*W2 mean (s.d.) Observations
Panel A: Total Earnings1
Ln(Total earnings, past month) -0.260** 0.405** -0.103 0.128 7.644 1,549
(0.123) (0.167) (0.142) (0.202) (1.272)
Ln(Total earnings, past month), including zeros -0.146 0.096 -0.094 0.040 6.264 1,892
Panel B: Non-agricultural Earnings2 (0.282) (0.387) (0.340) (0.465) (3.159)
Ln(Non-agricultural earnings, past month) -0.021 0.117 0.099 -0.008 7.927 925
(0.171) (0.216) (0.188) (0.248) (1.316)
Ln(Non-agricultural earnings, past month), including zeros -0.379 0.537 -0.599 0.476 3.946 1,892
(0.345) (0.498) (0.418) (0.594) (4.073)
Ln(Hourly non-agricultural earnings, past month) -0.079 0.100 0.239 -0.201 2.863 773
(0.174) (0.219) (0.208) (0.264) (1.182)
Ln(Hourly non-agricultural earnings, past month), including zeros 0.104 -0.178 0.468 -0.421 2.244 840
Panel C: Wage Employment Earnings (0.339) (0.424) (0.393) (0.499) (2.312)
Ln(Wage employment earnings, past month) -0.008 -0.104 0.373* -0.475* 8.252 579
(0.184) (0.235) (0.196) (0.252) (1.081)
Ln(Wage employment earnings, past month), including zeros -0.079 0.479 -0.446 0.771 2.536 1,880
(0.324) (0.479) (0.397) (0.572) (3.856)
Ln(Hourly wage employment earnings, past month) -0.079 0.114 0.393* -0.444 3.062 493
(0.189) (0.235) (0.221) (0.277) (.991)
Ln(Hourly wage employment earnings, past month), including zeros 0.003 0.167 0.504 -0.480 2.691 530
Panel D: Self Employment Earnings (0.290) (0.362) (0.317) (0.401) (1.575)
Ln(Self employment earnings, past month) -0.180 0.407 -0.290 0.317 7.406 373

(1) (2) (3) (4) (5) (6)
(0.327) (0.407) (0.330) (0.477) (1.441)
Ln(Self employment earnings, past month), including zeros -0.355 0.187 -0.218 -0.198 1.546 1,883
(0.246) (0.382) (0.308) (0.450) (3.082)
Ln(Hourly self employment earnings, past month) -0.115 0.044 -0.031 -0.095 2.528 285
(0.356) (0.455) (0.358) (0.508) (1.368)
Ln(Hourly self employment earnings, past month), including zeros 0.282 -0.901 0.519 -1.174 2.148 305
(0.431) (0.658) (0.483) (0.792) (2.059)

Regression Notes: Data used in this table was drawn from the KLPS-3 survey, and information collected during program recruitment meetings in 2008, before vouchers
were awarded. The first two columns (the "reduced form") present results from a regression of the dependent variable on an indicator for assignment to a vocational
training voucher, and that indicator interacted with an indicator for surveyed in KLPS-3 Survey Wave 2. The reduced form regression also includes an indicator for
assignment to the information intervention, that indicator interacted with an indicator for surveyed in KLPS-3 Survey Wave 2, an interaction between indicators for
assignment to vocational training voucher and assignment to information intervention, and a triple interaction between these and the indicator for surveyed in KLPS-3
Survey Wave 2. The second two columns (the "IV-2SLS") present results from a two-stage least squares regression in which years of vocational training and years of
training interacted with the indicator for surveyed in KLPS-3 Survey Wave 2 are instrumented using an indicator for assignment to receive a vocational training voucher,
an indicator for assignment to recieve the information intervention, these indicators interacted with each other, these indicators each interacted with an indicator for
surveyed in KLPS-3 Survey Wave 2, and the triple interaction of all three indicators. Additional controls in both the reduced form and 2SLS regressions include an
indicator for female, 2008 age, years of schooling attained by 2008, an indicator for vocational training prior to 2009, an indicator for preference to attend a private
vocational training center (2008), indicators for preference to enroll in one of 5 different course groups (2008), an indicator for participation in the PSDP, an indicator for
assignment to the PSDP treatment group, an indicator for assignment to the GSP treatment group, an indicator for interviewed in KLPS-3 Wave 2, and a measure of
months since launch of KLPS-3 surveying. Robust standard errors in parentheses. *** indicates p≤0.01, ** indicates p≤0.05, and * indicates p≤0.1. Table Notes: "Including zeros" indicates that values of zero were replaced with either 1 or the variable's positive, minimum value - whichever is smaller - before taking
the natural log. Hourly measures are calculated among those who work at least 10 hours per week 1Total earnings includes earnings from agriculture, wage, and
selfemployment. 2Non-agricultural earnings include earnings from wage and self-employment.

Table 13. Vocational Education Impacts on Work Hours, Sector, and Other Employment Outcomes
Reduced Form IV-2SLS
coefficient estimate (s.e.) coefficient estimate (s.e.) Control group Number
Panel A: Work Hours
Total hours worked across all activities 0.760 2.974 1.354 0.752 51.792 1,882
(2.721) (3.712) (3.282) (4.442) (28.637)
Total hours worked in agriculture for the household 2.974 2.192 1.278 1.019 10.47 1,876
(3.712) (1.795) (1.645) (2.205) (14.424)
Total hours worked in wage- or self-employment -0.634 2.939 1.354 0.752 21.405 1,894
(2.309) (3.406) (3.282) (4.442) (26.652)
Total hours worked in wage employment 0.511 0.416 -2.071 3.349 14.365 1,894
(2.168) (3.198) (2.572) (3.709) (24.726)
Total hours worked in self-employment -1.144 2.523 -2.062 1.873 7.039 1,894
Panel B: Sector of Work (1.346) (2.108) (1.725) (2.523) (16.963)
Indic for positive hours worked -0.010 0.013 -0.014 0.018 0.986 1,882
(0.012) (0.016) (0.013) (0.018) (.116)
Indic for positive hours worked in ag for the household 0.009 -0.018 0.073 -0.015 0.547 1,879
(0.042) (0.061) (0.051) (0.073) (.498)
Indic for positive hours worked in wage or self-employment -0.067 0.107* -0.116** 0.147* 0.504 1,882
(0.043) (0.062) (0.054) (0.075) (.5)
Indic for positive hours worked in wage employment -0.016 0.050 -0.079 0.120* 0.311 1,880
(0.039) (0.057) (0.048) (0.069) (.463)
Indic for positive hours worked in self-employment -0.048 0.059 -0.035 0.014 0.208 1,880
Panel C: Other Employment Outcomes (0.033) (0.051) (0.043) (0.061) (.406)
Indic for unemployed 0.069 -0.044 0.105** -0.016 0.301 1,880
(0.042) (0.059) (0.052) (0.073) (.459)

VocEd VocEd*W2 VocEd VocEd*W2 mean (s.d.) Observations
Notes: For notes on what is included in the regressions, see "Regression Notes" under Table 12. 1Full time job refers to working at least 30 hours in a given sector.
Indic for has a full time job in wage or self-employment1 -0.020 0.059 -0.110** 0.145** 0.352 1,881
(0.039) (0.059) (0.050) (0.072) (.478)
Indic for owns a non-ag business that is licensed -0.014 0.049* -0.016 0.033 0.051 1,892
(0.017) (0.027) (0.022) (0.033) (.219)
Number of employed workers in place of (self-)employment 0.687 7.833 -0.135 4.850 0.636 1,892
(0.823) (7.545) (0.515) (4.652) (1.497)

Table 14. Vocational Education Impacts on Migration and Living Standards
Reduced Form IV-2SLS
coefficient estimate (s.e.) coefficient estimate (s.e.) Control group Number
Panel A: Migration Outcomes
Indic for residence in city at time of survey 0.031 -0.081 0.039 -0.128** 0.238 1,890
(0.038) (0.054) (0.044) (0.063) (.426)
Indic for residence in a city since program launch 0.058 -0.129** 0.073 -0.163** 0.327 1,891
(0.040) (0.057) (0.049) (0.070) (.469)
Indic for residence outside of Kenya at time of survey 0.011 -0.033* -0.007 -0.026 0.028 1,896
(0.012) (0.019) (0.015) (0.023) (.165)
Indic for residence outside of Kenya since program launch 0.014 -0.020 -0.008 -0.010 0.042 1,896
Panel B: Living Standards
(0.017) (0.026) (0.019) (0.029) (.201)
Number of meals eaten yesterday 0.083 -0.193** 0.074 -0.251** 2.24 1,891
(0.061) (0.087) (0.072) (0.101) (.657)
Number of meals with protein eaten yesterday -0.064 0.036 -0.020 0.032 0.722 1,883
(0.059) (0.085) (0.071) (0.099) (.657)
Indic for home has improved floor or roof 0.068* -0.046 -0.002 -0.053 0.694 1,835
(0.041) (0.058) (0.049) (0.070) (.461)
Indic for home has electricity -0.017 -0.007 -0.011 -0.014 0.285 1,838
(0.037) (0.055) (0.045) (0.066) (.452)
Indic for home has a toilet -0.002 -0.005 -0.013 0.046 0.116 1,839
(0.030) (0.041) (0.034) (0.049) (.32)
Number of rooms in home 0.037 0.119 0.114 0.055 2.734 1,837
(0.135) (0.185) (0.167) (0.217) (1.402)
Indic for home has piped water -0.042 0.014 0.041 -0.111 0.388 1,838

VocEd VocEd*W2 VocEd VocEd*W2 mean (s.d.) Observations
Notes: For notes on what is included in the regressions, see "Regression Notes" under Table 12. 1Summary measure includes all measures listed under Panel B, as well
as a count of each of 26 different household assets and an indicator for responding "better" to the question "Compared to two years ago, would you say that your own
personal economic situation today is much the same, better, or worse?"
(0.043) (0.062) (0.052) (0.074) (.488)
Indic for home is owned 0.006 0.013 0.012 0.025 0.654 1,838
(0.040) (0.058) (0.048) (0.069) (.476)
Summary index of improved living standards1 -0.008 0.026 -0.010 0.012 -0.005 1,896
(0.033) (0.046) (0.039) (0.053) (.345)

Table 15. Vocational Education Impacts on Attitudes and Other Outcomes
Reduced Form IV-2SLS
coefficient estimate (s.e.) coefficient estimate (s.e.) Control group Number
Panel A: Opinions and Social Attitudes
Summary measure of gender equality views 0.038 -0.052 0.013 -0.020 0.003 1,891
(0.042) (0.061) (0.051) (0.071) (.482)
Summary measure of increased support for democracy 0.055 -0.111 0.111 -0.220** 0.003 1,891
(0.052) (0.072) (0.071) (0.092) (.622)
Indic for satisfaction with democracy in Kenya 0.016 -0.032 0.051 -0.085 0.661 1,890
(0.042) (0.060) (0.052) (0.073) (.473)
Indic for thinks Kenyan governance is better than 2 years ago -0.074* 0.088 -0.098** 0.088 0.235 1,891
(0.039) (0.054) (0.046) (0.063) (.424)
Summary measure of political participation -0.069* 0.083 -0.102** 0.234*** -0.004 1,892
(0.037) (0.065) (0.047) (0.079) (.537)
Summary index for justified political violence -0.069* 0.083 -0.102** 0.234*** -0.004 1,892
(0.037) (0.065) (0.047) (0.079) (.537)
Indic for agrees that most people cannot be trusted -0.038 0.035 -0.055* 0.031 0.07 1,892
Panel B: Human Capital
(0.023) (0.030) (0.029) (0.035) (.256)
Summary index of math and reading test scores 0.001 -0.025 0.077 -0.085 -0.011 1,821
Panel C: Marriage and Fertility
(0.067) (0.089) (0.077) (0.106) (.887)
Indic for married, conditional on not married by 2008 0.075 -0.100 0.061 -0.151 .464 1,077
(0.054) (0.080) (0.063) (0.093) (.499)
Age at first marriage, conditional on not married by 2008 -0.156 0.318 0.600* -0.695 23.161 497
(0.243) (0.363) (0.354) (0.523) (2.525)

VocEd VocEd*W2 VocEd VocEd*W2 mean (s.d.) Observations
Notes: For notes on what is included in the regressions, see "Regression Notes" under Table 12.
Number of pregnancies, , conditional on not pregnant by 2008 0.121 -0.202 0.021 -0.212 1.051 1,074
(0.106) (0.155) (0.119) (0.175) (1.027)
Age of first pregnancy, conditional on not pregnant by 2008 -0.415 0.102 -0.519 0.777 22.188 651
(0.376) (0.542) (0.454) (0.650) (3.109)
Spouse's education level, conditional on not married by 2008 -0.235 0.452 0.393 -0.195 9.607 485
(0.488) (0.661) (0.667) (0.899) (2.744)