vocabulary does not complicate the simple view of reading · unitary construct, but as encompassing...
TRANSCRIPT

Vocabulary does not complicate the simple viewof reading
David Braze1 • Leonard Katz1,2 • James S. Magnuson1,2 •
W. Einar Mencl1 • Whitney Tabor1,2 • Julie A. Van Dyke1 •
Tao Gong1 • Clinton L. Johns1 • Donald P. Shankweiler1,2
Published online: 17 December 2015
� The Author(s) 2015. This article is published with open access at Springerlink.com
Abstract Gough and Tunmer’s (1986) simple view of reading (SVR) proposed
that reading comprehension (RC) is a function of language comprehension (LC) and
word recognition/decoding. Braze et al. (2007) presented data suggesting an
extension of the SVR in which knowledge of vocabulary (V) affected RC over and
above the effects of LC. Tunmer and Chapman (2012) found a similar independent
contribution of V to RC when the data were analyzed by hierarchical regression.
However, additional analysis by factor analysis and structural equation modeling
indicated that the effect of V on RC was, in fact, completely captured by LC itself
and there was no need to posit a separate direct effect of V on RC. In the present
study, we present new data from young adults with sub-optimal reading skill
(N = 286). Latent variable and regression analyses support Gough and Tunmer’s
original proposal and the conclusions of Tunmer and Chapman that V can be
considered a component of LC and not an independent contributor to RC.
Keywords Simple view of reading � Adult literacy � Vocabulary � Oral language �Reading comprehension � Structural equation modeling
Introduction
The large role of vocabulary in reading ability has long been acknowledged (and
extensively assessed) in the reading research literature. Much evidence is consistent
with the common-sense assumption that knowledge of word meanings and ready access
& David Braze
1 Haskins Laboratories, New Haven, CT, USA
2 University of Connecticut, Storrs, CT, USA
123
Read Writ (2016) 29:435–451
DOI 10.1007/s11145-015-9608-6

to that knowledge are causal components of skill in reading comprehension (e.g., Beck
& McKeown, 1983; Perfetti, 2007; Perfetti & Stafura, 2014; Senechal, Ouellette, &
Rodney, 2006). The question under examination in this study is whether the role of
vocabulary should be modeled as distinct from that of general language comprehension
ability, when the latter is assessed by measures of listening comprehension.
The simple view of reading (SVR) of Gough and Tunmer (1986) holds that
comprehension of language in print, reading comprehension (RC), is the product of just
two factors. The first is linguistic comprehension (LC), encapsulating those aspects of
knowledge necessary for general understanding of linguistic material and typically
measured as ability to comprehend language in the form of sentences or narratives
presented to the ear (i.e., listening comprehension). In the SVR, LC is not envisioned as a
unitary construct, but as encompassing all those skills and capacities necessary to
comprehend both the spoken and the printed word, in spite of differences between the
linguistic content typically conveyed by print and speech (prosody being a case in point).
The second factor is the reader’s ability to recognize or decode printed words (D). D
represents the ability to translate the printed word into an internal linguistic code consonant
with LC. Gough and Tunmer suggest that the ability to pronounce orthographic
pseudowords is the purest measure of D, while conceding that knowledge of the speech-
print correspondence rules that support this ability may be insufficient for word
recognition in general, especially in the case of a deep orthography like that of English.
Thus, LC figures equally in the comprehension of language presented to the ear or to the
eye, while D is the new skill that learners must acquire to become readers of their native
language, at least to be able to read to the same level as their language comprehension
allows. The stronger each component, D and LC, the better the reader will comprehend a
text. Conversely, if either component is zero, no reading comprehension is possible.
In the context of the Simple View, vocabulary is just one aspect of LC, and so of
equal import to comprehension of print or speech, as with all other aspects of LC.
However, some researchers have questioned the assumption that word knowledge
contributes identically to comprehension of language in each modality. The
question is important, because of the influence that the Simple View continues to
have on theoretical proposals regarding the cognitive processes involved in reading
and reading skill differences. It is precisely because the SVR has been so influential,
having guided or inspired extensive research and theory, that it is essential to test its
underlying assumptions.
Braze, Tabor, Shankweiler, and Mencl (2007) presented evidence that suggested a
complication for the Simple View. Working with data from a sample of young adults
(16–24 years old) living in the northeastern United States of America, they inferred
that a reader’s knowledge of vocabulary (V) affects RC directly and independently of
LC and D. These findings were based on standard measures of (1) spoken receptive
and expressive vocabulary to measure V, (2) word and nonword reading in order to
measure D, (3) speech sentence comprehension to measure LC, and (4) printed
sentence and passage comprehension to measure RC. Regression models targeting RC
with variables representing D, LC and V, showed a significant independent
contribution of vocabulary over and above the effects of D and LC. On this
evidence, Braze and colleagues proposed that the Simple View be extended to include
a separate direct effect of V on RC, in addition to the previously supported direct
436 D. Braze et al.
123

effects of D and LC. Consistent with the Lexical Quality Hypothesis (Perfetti, 2007),
they also suggested that word knowledge, as a top down constraint on comprehension,
is more important to comprehension of printed language than to oral language. This,
they contend, is due to the referents for speech being often less ambiguous than those
for print.
Subsequent work has been inconsistent in its support of the vocabulary-enriched
version of the Simple View. Among studies using a linear regression based analytic
approach, some have found that measures of vocabulary knowledge capture unique
variance in reading comprehension scores, after accounting for the effects of printed
word recognition ability and general linguistic knowledge (Fraser & Conti-
Ramsden, 2008; Ouellette & Beers, 2010), while others have not (Conners, 2009;
Macaruso & Shankweiler, 2010).
More recently, researchers have employed the technique of latent variable
modeling to directly assess the question of whether, in the context of the Simple View
of Reading, evidence can be found for a latent construct of vocabulary knowledge that
is clearly distinct from that of general language skill (Foorman, Herrera, Petscher,
Mitchell, & Truckenmiller, 2015; Protopapas, Mouzaki, Sideridis, Kotsolakou, &
Simos, 2013; Sabatini, Sawaki, Shore, & Scarborough, 2010; Tunmer & Chapman,
2012). However, all of this work used but a single indicator to measure RC and so
may not have thoroughly canvassed the underlying factors identified with reading
comprehension (Cutting & Scarborough, 2006; Keenan, Betjemann, & Olson, 2008).
Tunmer and Chapman (2012) presented data for 122 7-year-old children from New
Zealand using age-appropriate and culture-appropriate measures of V, D, LC and RC.
Regression analysis of their data found a small but significant effect of V on RC over
and above the effects of D and LC, as did Braze et al. (2007). However, the authors
analyzed their data further using a latent variable approach in order to determine if V
clustered with LC, rather than forming its own independent factor (as the regression
results suggested). They found that structural models that posited an independent
contribution of V to RC fit their data no better than models that lacked an independent
factor for V. Thus, they concluded there was no evidence for an independent
contribution of V. The fact that hierarchical regression found a small but significant
effect of vocabulary measures over that of decoding and oral language comprehension
measures was explained as due to a failure of the study’s oral language measures to
capture fully all aspects of LC that existed. That is, the specific tests used to measure
LC were likely to have been less valid and reliable than were the direct tests of
vocabulary knowledge and, because of this, hierarchical regression was able to
account for additional covariance between vocabulary and reading comprehension.
Protopapas et al. (2013) reach a similar conclusion to Tunmer and Chapman
(2012) based on data from Greek-speaking children of similar age to the English-
speaking children that Tunmer and Chapman studied, but who were learning to read
a much more transparent orthography. They presented results based on data from a
1 year longitudinal study of 436 Greek school children in grades three to five.
Regression analyses targeting concurrent reading comprehension showed that
measures of oral language comprehension, decoding skill and vocabulary knowl-
edge all accounted for unique variance in reading comprehension, with vocabulary
capturing the largest share at 7.8 %. Measures of oral language and vocabulary also
Vocabulary does not complicate the simple view of reading 437
123

captured unique variance in reading comprehension measured 1 year later, whereas
decoding skill did not, regardless of whether concurrent reading comprehension was
included as an auto-regressor. They then used structural equation modeling (SEM)
to assess whether a conjectured latent variable V mediates the role of LC on RC, or
vice versa. They concluded that both models (LC mediating V, and V mediating
LC) demonstrate good fits to the data, with neither clearly superior to the other.
Thus, their results are consistent with the perspective that the Simple View need not
be enriched with an additional component of V.
Still, Protopapas et al. (2013) do point out that the question remains to be
answered as to why measures of vocabulary so often surface as unique predictors of
reading comprehension in regression analyses (e.g., Braze et al., 2007; Fraser &
Conti-Ramsden, 2008; Ouellette & Beers, 2010; Tunmer & Chapman, 2012). There
are at least two possible answers to this question. It may be that measures of
vocabulary and oral language comprehension are indeed reflections of a unitary
construct (conventionally labeled LC), but that measures of vocabulary are more
robust indicators of that construct than are other measures of oral language skill.
Alternatively, it may be that while V and LC are distinct constructs, low reliability
of at least some tasks used to measure LC precludes a strong demonstration of
divergent validity for those constructs (Protopapas et al., 2013).
The present study was designed to examine the question of the independence of
V from LC and D. We largely replicate the analytic methodology of Tunmer and
Chapman (2012) and Protopapas et al. (2013), and extend its application to a diverse
population of English-speaking adults. We used an age range and sampling
procedure designed to capture a sample similar to that studied by Braze et al.
(2007). Thus, the present study is a quasi-replication of Tunmer and Chapman, who
also worked with readers of English, with the main difference being the age of the
reader. Unlike most previous studies (e.g., Protopapas et al., 2013; Tunmer &
Chapman, 2012), we also employed multiple indicators of reading comprehension,
in order to more thoroughly canvas features of the underlying construct. For adult
readers representing a wide range of skill levels, we asked whether there is support
for an independent construct, V, or whether the contributions of vocabulary
knowledge to reading comprehension are completely subsumed by D and LC (as
was found by Tunmer and Chapman for children) when we employ the same
analytic methods used by them. This study compared the results of latent variable
and multiple regression analyses, as did Tunmer and Chapman.
Method
Participants
Participants were 295 native speakers of English, ages from 16 to 25 years (mean
20.18, SD = 2.34). Average years of education was 11.89, SD = 1.71. We
recruited through posters placed on adult school and community college campuses
and in community gathering places, which by design brought in individuals with a
wide range of backgrounds and abilities, including many with low reading scores.
438 D. Braze et al.
123
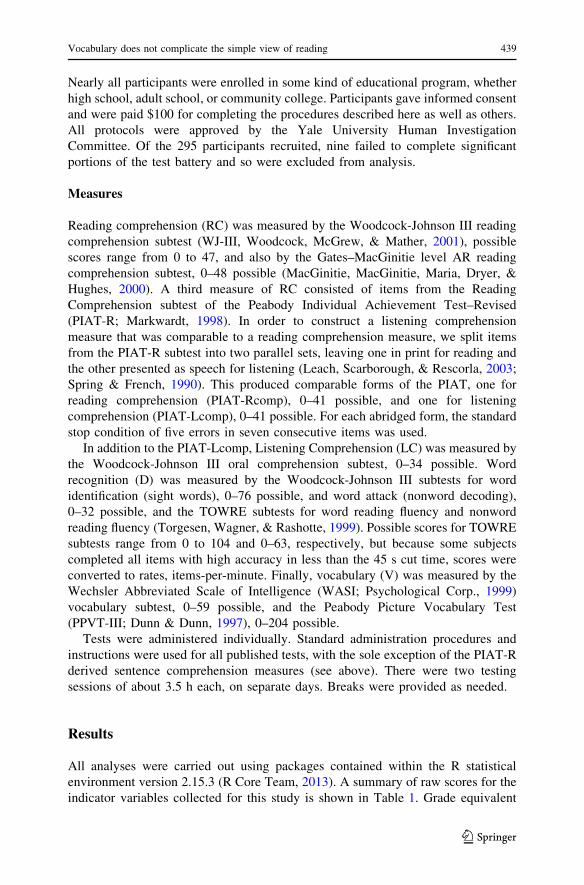
Nearly all participants were enrolled in some kind of educational program, whether
high school, adult school, or community college. Participants gave informed consent
and were paid $100 for completing the procedures described here as well as others.
All protocols were approved by the Yale University Human Investigation
Committee. Of the 295 participants recruited, nine failed to complete significant
portions of the test battery and so were excluded from analysis.
Measures
Reading comprehension (RC) was measured by the Woodcock-Johnson III reading
comprehension subtest (WJ-III, Woodcock, McGrew, & Mather, 2001), possible
scores range from 0 to 47, and also by the Gates–MacGinitie level AR reading
comprehension subtest, 0–48 possible (MacGinitie, MacGinitie, Maria, Dryer, &
Hughes, 2000). A third measure of RC consisted of items from the Reading
Comprehension subtest of the Peabody Individual Achievement Test–Revised
(PIAT-R; Markwardt, 1998). In order to construct a listening comprehension
measure that was comparable to a reading comprehension measure, we split items
from the PIAT-R subtest into two parallel sets, leaving one in print for reading and
the other presented as speech for listening (Leach, Scarborough, & Rescorla, 2003;
Spring & French, 1990). This produced comparable forms of the PIAT, one for
reading comprehension (PIAT-Rcomp), 0–41 possible, and one for listening
comprehension (PIAT-Lcomp), 0–41 possible. For each abridged form, the standard
stop condition of five errors in seven consecutive items was used.
In addition to the PIAT-Lcomp, Listening Comprehension (LC) was measured by
the Woodcock-Johnson III oral comprehension subtest, 0–34 possible. Word
recognition (D) was measured by the Woodcock-Johnson III subtests for word
identification (sight words), 0–76 possible, and word attack (nonword decoding),
0–32 possible, and the TOWRE subtests for word reading fluency and nonword
reading fluency (Torgesen, Wagner, & Rashotte, 1999). Possible scores for TOWRE
subtests range from 0 to 104 and 0–63, respectively, but because some subjects
completed all items with high accuracy in less than the 45 s cut time, scores were
converted to rates, items-per-minute. Finally, vocabulary (V) was measured by the
Wechsler Abbreviated Scale of Intelligence (WASI; Psychological Corp., 1999)
vocabulary subtest, 0–59 possible, and the Peabody Picture Vocabulary Test
(PPVT-III; Dunn & Dunn, 1997), 0–204 possible.
Tests were administered individually. Standard administration procedures and
instructions were used for all published tests, with the sole exception of the PIAT-R
derived sentence comprehension measures (see above). There were two testing
sessions of about 3.5 h each, on separate days. Breaks were provided as needed.
Results
All analyses were carried out using packages contained within the R statistical
environment version 2.15.3 (R Core Team, 2013). A summary of raw scores for the
indicator variables collected for this study is shown in Table 1. Grade equivalent
Vocabulary does not complicate the simple view of reading 439
123
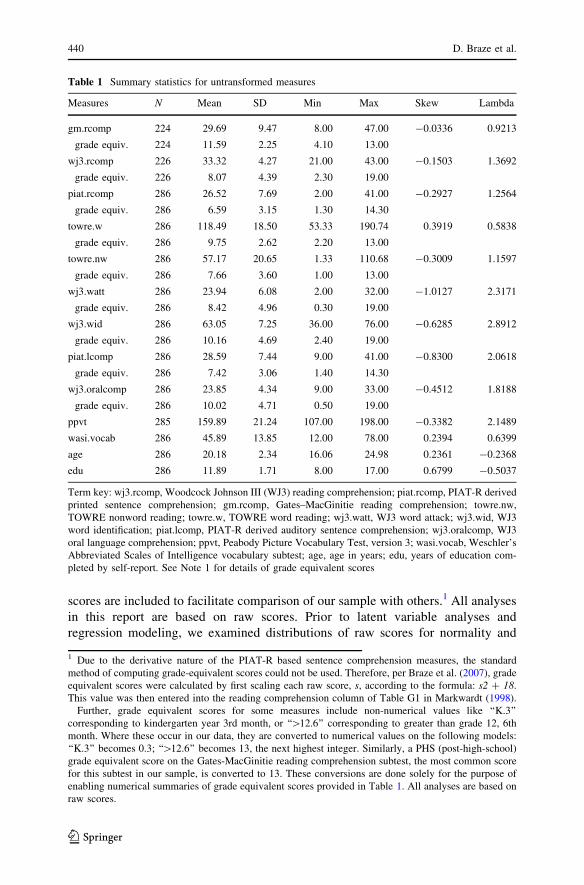
scores are included to facilitate comparison of our sample with others.1 All analyses
in this report are based on raw scores. Prior to latent variable analyses and
regression modeling, we examined distributions of raw scores for normality and
Table 1 Summary statistics for untransformed measures
Measures N Mean SD Min Max Skew Lambda
gm.rcomp 224 29.69 9.47 8.00 47.00 -0.0336 0.9213
grade equiv. 224 11.59 2.25 4.10 13.00
wj3.rcomp 226 33.32 4.27 21.00 43.00 -0.1503 1.3692
grade equiv. 226 8.07 4.39 2.30 19.00
piat.rcomp 286 26.52 7.69 2.00 41.00 -0.2927 1.2564
grade equiv. 286 6.59 3.15 1.30 14.30
towre.w 286 118.49 18.50 53.33 190.74 0.3919 0.5838
grade equiv. 286 9.75 2.62 2.20 13.00
towre.nw 286 57.17 20.65 1.33 110.68 -0.3009 1.1597
grade equiv. 286 7.66 3.60 1.00 13.00
wj3.watt 286 23.94 6.08 2.00 32.00 -1.0127 2.3171
grade equiv. 286 8.42 4.96 0.30 19.00
wj3.wid 286 63.05 7.25 36.00 76.00 -0.6285 2.8912
grade equiv. 286 10.16 4.69 2.40 19.00
piat.lcomp 286 28.59 7.44 9.00 41.00 -0.8300 2.0618
grade equiv. 286 7.42 3.06 1.40 14.30
wj3.oralcomp 286 23.85 4.34 9.00 33.00 -0.4512 1.8188
grade equiv. 286 10.02 4.71 0.50 19.00
ppvt 285 159.89 21.24 107.00 198.00 -0.3382 2.1489
wasi.vocab 286 45.89 13.85 12.00 78.00 0.2394 0.6399
age 286 20.18 2.34 16.06 24.98 0.2361 -0.2368
edu 286 11.89 1.71 8.00 17.00 0.6799 -0.5037
Term key: wj3.rcomp, Woodcock Johnson III (WJ3) reading comprehension; piat.rcomp, PIAT-R derived
printed sentence comprehension; gm.rcomp, Gates–MacGinitie reading comprehension; towre.nw,
TOWRE nonword reading; towre.w, TOWRE word reading; wj3.watt, WJ3 word attack; wj3.wid, WJ3
word identification; piat.lcomp, PIAT-R derived auditory sentence comprehension; wj3.oralcomp, WJ3
oral language comprehension; ppvt, Peabody Picture Vocabulary Test, version 3; wasi.vocab, Weschler’s
Abbreviated Scales of Intelligence vocabulary subtest; age, age in years; edu, years of education com-
pleted by self-report. See Note 1 for details of grade equivalent scores
1 Due to the derivative nature of the PIAT-R based sentence comprehension measures, the standard
method of computing grade-equivalent scores could not be used. Therefore, per Braze et al. (2007), grade
equivalent scores were calculated by first scaling each raw score, s, according to the formula: s2 ? 18.
This value was then entered into the reading comprehension column of Table G1 in Markwardt (1998).
Further, grade equivalent scores for some measures include non-numerical values like ‘‘K.3’’
corresponding to kindergarten year 3rd month, or ‘‘[12.6’’ corresponding to greater than grade 12, 6th
month. Where these occur in our data, they are converted to numerical values on the following models:
‘‘K.3’’ becomes 0.3; ‘‘[12.6’’ becomes 13, the next highest integer. Similarly, a PHS (post-high-school)
grade equivalent score on the Gates-MacGinitie reading comprehension subtest, the most common score
for this subtest in our sample, is converted to 13. These conversions are done solely for the purpose of
enabling numerical summaries of grade equivalent scores provided in Table 1. All analyses are based on
raw scores.
440 D. Braze et al.
123

potential outliers. Skewness was observed in most variables and so Box–Cox
transformations were applied across the board before further analysis (Box & Cox,
1964). The general form of this family of transformations is:
yi ¼yki � 1� �
=k k 6¼ 0ð Þlog yið Þ k ¼ 0ð Þ
�
Values of lambda were identified that optimize univariate normality for each
variable using the bcpower function from the car package (Fox & Weisberg, 2011).
Specific lambdas applied to raw scores are listed in Table 1. Because transforma-
tions resulted in large heterogeneity in variances, Box–Cox transformed variables
were subsequently standardized.
Inspection of Table 1 shows that there are a number of participants with missing
scores on two of our three measures of reading comprehension (Gates–MacGinitie
and Woodcock-Johnson reading comprehension subtests). These measures were
added to the assessment battery only after data collection had begun. For present
purposes, the question arises as to whether the essential characteristics of
participants assessed before the additions, and so are missing these scores, are
different from those of participants who entered the study afterward. We use the
Hawkins test of multivariate normality and heteroscedasticity, as implemented in
the R package MissMech (Jamshidian & Jalal, 2010; Jamshidian, Jalal, & Jansen,
2014), to address this question. A non-significant p value from this test would
indicate a lack of sufficient evidence to reject the null hypothesis that data are
missing completely at random (MCAR). The method relies on assessing
homogeneity of covariances for groups with different patterns of missingness.
Our data include five such patterns: 217 complete cases, 54 cases are missing both
the WJ3 and Gates reading comprehension tests, six are missing WJ3 reading
comprehension only, eight are missing the Gates reading comprehension only, and
one is missing the PPVT only. The latter is excluded from the Hawkins test as it
requires at least two cases in each group. The Hawkins test indicated there is not
sufficient evidence to reject the null hypothesis that missingness in our data set is
MCAR (p = 0.329).
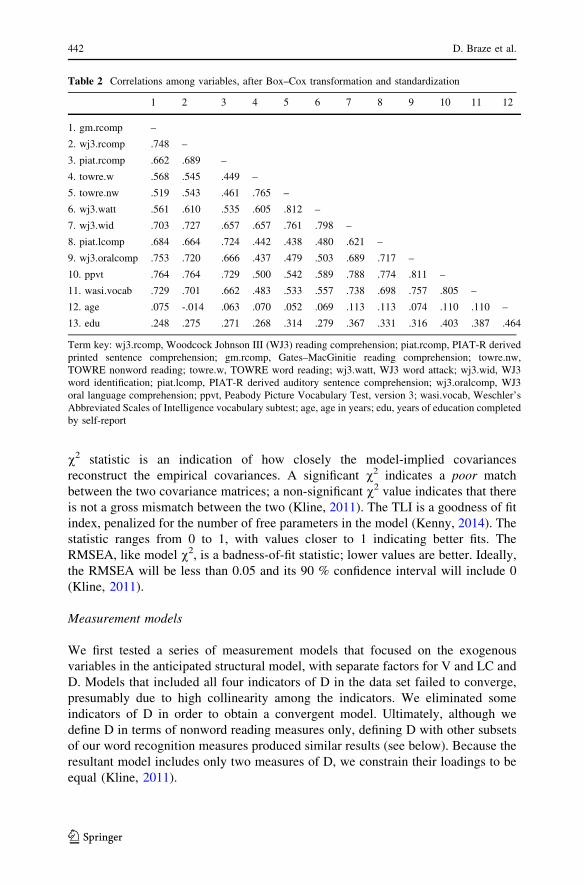
A correlation matrix of all Box–Cox transformed and standardized variables is
presented in Table 2. Inspection of the matrix suggests that there are strong
correlations among the variables for V (variables PPVT, WASI vocabulary) and LC
(WJ oral comprehension and the PIAT-Lcomp) with smaller correlations between
these and the variables for D (WJ word attack, WJ word identification, TOWRE
nonwords, and TOWRE words).
Latent variable analysis
All latent variable models were fit with the R package lavaan (Rosseel, 2012) using
full information maximum likelihood (FIML) as the estimation method. As noted
above, manifest variables were Box–Cox transformed and standardized. For the
final measurement and structural models we report model v2, Tucker Lewis Index
(TLI) and root mean square error of approximation (RMSEA) statistics. The model
Vocabulary does not complicate the simple view of reading 441
123
v2 statistic is an indication of how closely the model-implied covariances
reconstruct the empirical covariances. A significant v2 indicates a poor match
between the two covariance matrices; a non-significant v2 value indicates that there
is not a gross mismatch between the two (Kline, 2011). The TLI is a goodness of fit
index, penalized for the number of free parameters in the model (Kenny, 2014). The
statistic ranges from 0 to 1, with values closer to 1 indicating better fits. The
RMSEA, like model v2, is a badness-of-fit statistic; lower values are better. Ideally,
the RMSEA will be less than 0.05 and its 90 % confidence interval will include 0
(Kline, 2011).
Measurement models
We first tested a series of measurement models that focused on the exogenous
variables in the anticipated structural model, with separate factors for V and LC and
D. Models that included all four indicators of D in the data set failed to converge,
presumably due to high collinearity among the indicators. We eliminated some
indicators of D in order to obtain a convergent model. Ultimately, although we
define D in terms of nonword reading measures only, defining D with other subsets
of our word recognition measures produced similar results (see below). Because the
resultant model includes only two measures of D, we constrain their loadings to be
equal (Kline, 2011).
Table 2 Correlations among variables, after Box–Cox transformation and standardization
1 2 3 4 5 6 7 8 9 10 11 12
1. gm.rcomp –
2. wj3.rcomp .748 –
3. piat.rcomp .662 .689 –
4. towre.w .568 .545 .449 –
5. towre.nw .519 .543 .461 .765 –
6. wj3.watt .561 .610 .535 .605 .812 –
7. wj3.wid .703 .727 .657 .657 .761 .798 –
8. piat.lcomp .684 .664 .724 .442 .438 .480 .621 –
9. wj3.oralcomp .753 .720 .666 .437 .479 .503 .689 .717 –
10. ppvt .764 .764 .729 .500 .542 .589 .788 .774 .811 –
11. wasi.vocab .729 .701 .662 .483 .533 .557 .738 .698 .757 .805 –
12. age .075 -.014 .063 .070 .052 .069 .113 .113 .074 .110 .110 –
13. edu .248 .275 .271 .268 .314 .279 .367 .331 .316 .403 .387 .464
Term key: wj3.rcomp, Woodcock Johnson III (WJ3) reading comprehension; piat.rcomp, PIAT-R derived
printed sentence comprehension; gm.rcomp, Gates–MacGinitie reading comprehension; towre.nw,
TOWRE nonword reading; towre.w, TOWRE word reading; wj3.watt, WJ3 word attack; wj3.wid, WJ3
word identification; piat.lcomp, PIAT-R derived auditory sentence comprehension; wj3.oralcomp, WJ3
oral language comprehension; ppvt, Peabody Picture Vocabulary Test, version 3; wasi.vocab, Weschler’s
Abbreviated Scales of Intelligence vocabulary subtest; age, age in years; edu, years of education completed
by self-report
442 D. Braze et al.
123
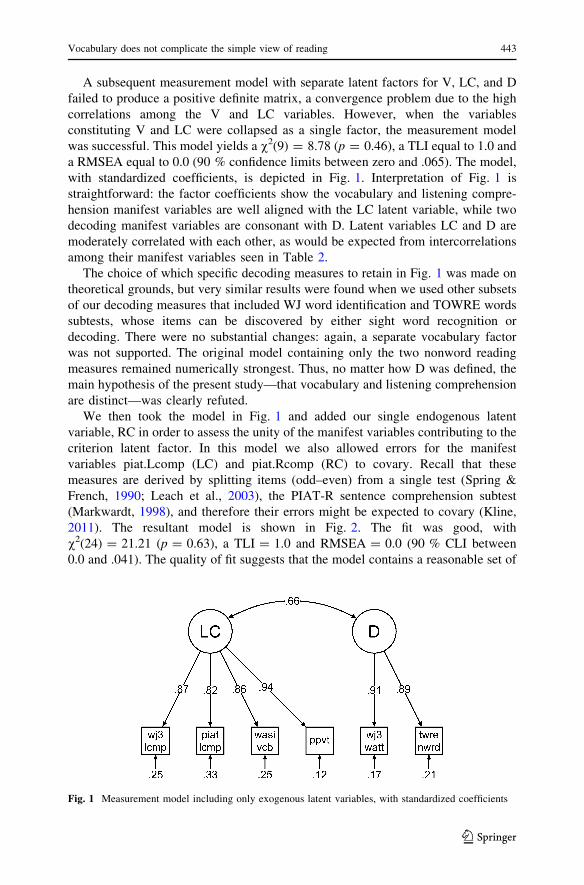
A subsequent measurement model with separate latent factors for V, LC, and D
failed to produce a positive definite matrix, a convergence problem due to the high
correlations among the V and LC variables. However, when the variables
constituting V and LC were collapsed as a single factor, the measurement model
was successful. This model yields a v2(9) = 8.78 (p = 0.46), a TLI equal to 1.0 and
a RMSEA equal to 0.0 (90 % confidence limits between zero and .065). The model,
with standardized coefficients, is depicted in Fig. 1. Interpretation of Fig. 1 is
straightforward: the factor coefficients show the vocabulary and listening compre-
hension manifest variables are well aligned with the LC latent variable, while two
decoding manifest variables are consonant with D. Latent variables LC and D are
moderately correlated with each other, as would be expected from intercorrelations
among their manifest variables seen in Table 2.
The choice of which specific decoding measures to retain in Fig. 1 was made on
theoretical grounds, but very similar results were found when we used other subsets
of our decoding measures that included WJ word identification and TOWRE words
subtests, whose items can be discovered by either sight word recognition or
decoding. There were no substantial changes: again, a separate vocabulary factor
was not supported. The original model containing only the two nonword reading
measures remained numerically strongest. Thus, no matter how D was defined, the
main hypothesis of the present study—that vocabulary and listening comprehension
are distinct—was clearly refuted.
We then took the model in Fig. 1 and added our single endogenous latent
variable, RC in order to assess the unity of the manifest variables contributing to the
criterion latent factor. In this model we also allowed errors for the manifest
variables piat.Lcomp (LC) and piat.Rcomp (RC) to covary. Recall that these
measures are derived by splitting items (odd–even) from a single test (Spring &
French, 1990; Leach et al., 2003), the PIAT-R sentence comprehension subtest
(Markwardt, 1998), and therefore their errors might be expected to covary (Kline,
2011). The resultant model is shown in Fig. 2. The fit was good, with
v2(24) = 21.21 (p = 0.63), a TLI = 1.0 and RMSEA = 0.0 (90 % CLI between
0.0 and .041). The quality of fit suggests that the model contains a reasonable set of
Fig. 1 Measurement model including only exogenous latent variables, with standardized coefficients
Vocabulary does not complicate the simple view of reading 443
123

latent constructs, which would support addition of structural components. However,
we note that the measurement models in Figs. 1 and 2 already answer our question
of whether addition of a V factor to the SVR is supported.
Structural equation modeling
We examined the standard SVR hypothesis that LC and D are determiners of RC.
To this end, we conducted an SEM that included the latent variables LC, D, and RC
based on the revised measurement model in Fig. 2 (i.e., there is no independent V
factor). The structural model, with the resulting path coefficients, is shown in Fig. 3.
Table 3, lower triangle, gives the model-implied inter-correlations among all
manifest and latent variables for the model in Fig. 3. The model provides a good
overall fit to the data, with v2(24) = 21.21 (p = 0.63), a TLI = 1.0 and
RMSEA = 0.0 (90 % CLI between 0.0 and 0.041). Moreover, its uniformly low
residual correlations, shown in the upper triangle of Table 3, suggest that it yields
good local fit to the data, across the board.
Regression analysis
A secondary set of analyses was conducted using linear regression. These were
carried out using the lm function in the R statistical environment (R Core Team,
2013). Although latent variable modeling has already rejected the notion of V as
distinct from LC, our purpose here is to see if the present data are consistent with
previous work using regression analysis, which showed that vocabulary measures
account for a unique portion of variance in reading comprehension beyond that
captured by measures of decoding and oral language skill (Braze et al., 2007; Fraser
& Conti-Ramsden, 2008; Ouellette & Beers, 2010; Protopapas et al., 2013; Tunmer
& Chapman, 2012). Variables selected for inclusion in the regression analysis are
Fig. 2 Measurement model including all latent variables, with standardized coefficients
444 D. Braze et al.
123

based on the measurement model in Fig. 2. In separate regression models, we
targeted each of the three manifest variables used to measure the RC factor in our
latent variable models. Manifest variables for LC and D were entered as
simultaneous predictors in the three models.
In fact, analysis of the current data set converges with earlier findings that
vocabulary measures account for unique variance in reading comprehension even
after controlling for the effects of word recognition and listening comprehension
(Braze et al., 2007). The proportion of variance uniquely attributable to each
vocabulary measure in models targeting the three reading comprehension measures
is indicated as their squared semi-partial correlations (SSPC) in Table 4.
Discussion
The result originally reported by Braze et al. (2007), and replicated subsequently by
Tunmer and Chapman (2012) and others (see above), was obtained in the present
study as well. Regression modeling indicates that measures of vocabulary do
capture a small but significant amount of variance in reading comprehension beyond
that captured by other oral language measures and decoding measures. However,
latent variable analysis does not support the presence of a factor for V, independent
of general oral language skill. As Tunmer and Chapman point out, the variance in
reading comprehension uniquely captured by vocabulary measures could arise as a
result of low reliability in the predictor variables; the non-vocabulary variables used
to represent LC may have failed to measure all aspects of LC relevant to RC and so
measures of vocabulary may have captured additional aspects of LC not covered by
the original variables. Moreover, different measures of RC may draw more or less
heavily on various component reading skills, including word knowledge (Cutting &
Scarborough, 2006; Keenan et al., 2008).
There is no question that vocabulary is an essential part of general language
capacity in both older and younger readers (Joshi, 2005; Perin, 2013). Obviously,
understanding will be impaired if a text contains words whose meanings are not
known to the reader. However, the issue is more subtle: word knowledge is not all or
none, and it is possible to have some knowledge of a word’s meaning and range of
Fig. 3 Structural model basedon measurement model inFig. 2, with standardizedcoefficients
Vocabulary does not complicate the simple view of reading 445
123

Table
3M
odel
imp
lied
corr
elat
ion
sam
on
gm
anif
est
var
iab
les
and
late
nt
var
iab
les
that
aris
efr
om
mo
del
inF
ig.
3(l
ow
ertr
ian
gle
)an
dco
rrel
atio
nre
sid
ual
s(u
pp
er
tria
ng
le,
cf.
Tab
le2)
12
34
56
78
91
01
1
1.
wj3
.rco
mp
–.0
13
-.0
01
-.0
07
-.0
10
-.0
08
-.0
06
.03
3-
.00
7
2.
pia
t.rc
om
p.6
97
–-
.00
8-
.00
5-
.00
1-
.00
4.0
14
-.0
01
-.0
57
3.
gm
.rco
mp
.77
7.7
08
–.0
22
.00
7.0
20
-.0
11
.00
7-
.01
3
4.
wj3
.ora
lco
mp
.73
7.6
71
.74
9–
.00
0.0
01
-.0
02
-.0
30
-.0
36
5.
pia
t.lc
om
p.6
92
.72
5.7
04
.71
7–
-.0
13
.01
0-
.02
0-
.04
6
6.
was
i.v
oca
b.7
30
.66
5.7
42
.75
6.7
11
–-
.00
1.0
29
.02
3
7.
pp
vt
.78
4.7
14
.79
7.8
12
.76
3.8
05
–.0
24
-.0
03
8.
wj3
.wat
t.5
88
.53
6.5
98
.53
3.5
00
.52
8.5
67
–-
.00
2
9.
tow
re.n
w.5
68
.51
8.5
77
.51
5.4
83
.51
0.5
47
.81
4–
10
.R
C.8
74
.79
7.8
89
.84
3.7
92
.83
5.8
97
.67
2.6
50
–
11
.L
C.8
43
.76
8.8
57
.87
4.8
21
.86
6.9
30
.61
0.5
89
.96
5–
12
.D
.64
0.5
84
.65
1.5
80
.54
5.5
75
.61
7.9
18
.88
7.7
33
.66
4
Ter
mk
ey:
wj3
.rco
mp
,W
oo
dco
ckJo
hnso
nII
I(W
J3)
read
ing
com
pre
hen
sio
n;
pia
t.rc
om
p,
PIA
T-R
der
ived
pri
nte
dse
nte
nce
com
pre
hen
sio
n;
gm
.rco
mp
,G
ates
–M
acG
init
ie
read
ing
com
pre
hen
sio
n;
tow
re.n
w,
TO
WR
En
on
wo
rdre
adin
g;
wj3
.wat
t,W
J3w
ord
atta
ck;
pia
t.lc
om
p,
PIA
T-R
der
ived
aud
ito
ryse
nte
nce
com
pre
hen
sio
n;
wj3
.ora
lcom
p,
WJ3
ora
lla
ngu
age
com
pre
hen
sio
n;
pp
vt,
Pea
bod
yP
ictu
reV
oca
bu
lary
Tes
t,v
ersi
on
3;
was
i.vo
cab
,W
esch
ler’
sA
bb
rev
iate
dS
cale
so
fIn
tell
igen
cev
oca
bula
rysu
bte
st
446 D. Braze et al.
123

use without being able to fully apprehend every nuance. More elaborate lexical
representations—that is, higher quality representations—that incorporate subtle
gradations of meaning, may integrate more flexibly into representations of discourse
or narrative and, as a result may be more readily recognized in context (Braze et al.,
2007; Perfetti, 2007).
It seems likely that individual differences in reading comprehension reflect
changes in components of reading skill as associated with D (accuracy in word
recognition), but also proficiency in dealing with material that contains syntactic or
pragmatic challenges, or specialized vocabulary, all of which fall within the scope
of LC (Braze et al., 2011; Braze, Shankweiler, Ni, & Palumbo, 2002; Frost et al.,
2009; Shankweiler, Mencl, Braze, Tabor, Pugh & Fulbright, 2008; Perfetti &
Stafura, 2014). Comparison of relative weights across studies of LC and D in
supporting RC hints at a developmental progression. Foorman et al. (2015) reported
that in their 1st and 2nd grade cohorts, oral language and decoding skill figure about
equally in their contributions to reading comprehension. Tunmer and Chapman
Table 4 Three regression models targeting separate reading comprehension measures
Term Estimate SE Statistic p value SSPC
4a: Gates–MacGinitie reading comprehension (N = 223; multiple R2 = 0.69)
towre.nw 0.0483 0.0674 0.72 0.4744 0.0007
wj3.watt 0.1443 0.0702 2.06 0.0409 0.0061
piat.lcomp 0.1507 0.0629 2.39 0.0175 0.0083
wj3.oralcomp 0.2956 0.0698 4.23 0.0000 0.0259
ppvt 0.1801 0.0829 2.17 0.0309 0.0068
wasi.vocab 0.2200 0.0776 2.84 0.0050 0.0116
4b: WJ3 reading comprehension (N = 225; multiple R2 = 0.58)
towre.nw 0.0076 0.0687 0.11 0.9123 0.0000
wj3.watt 0.2128 0.0712 2.99 0.0031 0.0138
piat.lcomp 0.1167 0.0660 1.77 0.0785 0.0048
wj3.oralcomp 0.2196 0.0712 3.08 0.0023 0.0147
ppvt 0.2796 0.0849 3.29 0.0012 0.0168
wasi.vocab 0.1421 0.0787 1.80 0.0725 0.0050
4c: PIAT-R reading comprehension (N = 285; multiple R2 = 0.62)
towre.nw -0.0689 0.0643 -1.07 0.2846 0.0016
wj3.watt 0.1738 0.0663 2.62 0.0093 0.0094
piat.l 0.3580 0.0605 5.92 0.0000 0.0482
wj3.oralcomp 0.0969 0.0672 1.44 0.1506 0.0029
ppvt 0.2293 0.0802 2.86 0.0046 0.0112
wasi.vocab 0.0916 0.0668 1.37 0.1716 0.0026
Squared semipartial correlation (SSPC) is the increment in variance accounted for when the given term is
entered last into the model. Term key: towre.nw, TOWRE nonword reading; wj3.watt, Woodcock
Johnson III (WJ3) word attack; piat.lcomp, PIAT-R derived auditory sentence comprehension;
wj3.oralcomp, WJ3 oral language comprehension; ppvt, Peabody Picture Vocabulary Test, version 3;
wasi.vocab, Weschler’s Abbreviated Scales of Intelligence vocabulary subtest
Vocabulary does not complicate the simple view of reading 447
123
(2012) found that D weighed somewhat more heavily than LC in their study of 3rd
grade students. It may be worth noting that Foorman and colleagues used a speeded
measure of decoding skill, while those used by Tunmer and Chapman were simple
accuracy measures. Results from Sabatini et al. (2010) indicate that for adults in an
Adult Basic Literacy program, with reading skills in the 3rd to 4th grade range, D
and LC were again nearly equal in their contributions to reading comprehension.
Finally, our own study examined reading in an adult sample that struggles
somewhat with reading, but not nearly to the extent of the Sabatini sample. We
found that reading comprehension in this group depends rather more heavily on oral
language comprehension than on decoding. Looking across studies, the reading
comprehension of better readers seems to be more constrained by limits on their oral
language comprehension than on decoding skill, whereas limits on decoding
figure more prominently in less skilled readers.
The debate surrounding the status of word knowledge is particularly significant
because the vocabulary of school and instruction is not at all the same as the
vernacular language. Yet, it is the former that provides entry into the world of
higher education, commerce, and industry. The differences are often magnified in
predominantly low SES communities (Townsend, Filippini, Collins, & Biancarosa,
2012), and commonly used measures of vocabulary are not designed to capture this
distinction. Further, as Braze et al. (2007) maintained, these differences are
associated with language modality. Academic language, though it is reflected in
both speech and print, is the language of expository print material.
Although we found no evidence of an important separation between vocabulary
knowledge and listening comprehension, we do not conclude from these results that
oral language comprehension is necessarily the product of a single latent variable,
nor even that reading comprehension relies solely on D and LC. Certainly, some
evidence points to the decomposability of LC in both beginning readers and
struggling older readers (Tighe & Schatschneider, 2015; Foorman et al., 2015).
Moreover, the roles of more general cognitive mechanisms must be taken into
account, and proposals for relatively language specific extensions to the Simple
View of Reading remain part of the discussion in the research community (e.g.,
Adlof, Catts, & Little, 2006; Foorman et al., 2015; Silverman, Speece, Harring, &
Ritchey, 2012). Limitations of instruments used to assess component skills, in terms
of measurement reliability and construct validity, may constrain our ability to
discriminate among underlying factors and to discern their roles. Some of those
limitations are apparent in the observed differences among grade equivalent scores
for the measures of RC in the present study (see Table 1).
Thus, although our data indicate that, at least within the context of the Simple
View of Reading, there is no basis for treating vocabulary as anything other than a
component of listening comprehension, it is clear that the role of vocabulary in
reading and its relation to other language skills is not fully understood. Further
research is necessary to understand the ramifications of weak vocabulary knowledge
and its interaction with other skills necessary to reading comprehension (e.g.,
Ouellette 2006; Perfetti & Stafura, 2014; Uccelli et al., 2015; Van Dyke et al.,
2014). Perhaps most significantly, vocabulary is a skill that we know how to teach;
several studies have shown vocabulary to be highly amenable to training (Coyne
448 D. Braze et al.
123

et al., 2007, 2010; Roberts, Torgesen, Boardman, & Scammacca, 2008; Scammacca,
Roberts, Vaughn, & Stuebing, 2015). Moreover, the importance of rich spoken
vocabulary experience for preliterate language development is well known (Hart &
Risley, 2003). Consequently, training to improve vocabulary knowledge is an
important lever that can be used to drive gains in general language comprehension,
which has been demonstrated repeatedly to have an extremely high association with
reading skill.
Acknowledgments We are grateful to Erica Davis and Joshua Coppola for assistance with this project.
This research was supported by NIH Grants R01 HD040353 and R01 HD071988 to Haskins Laboratories.
Open Access This article is distributed under the terms of the Creative Commons Attribution 4.0
International License (http://creativecommons.org/licenses/by/4.0/), which permits unrestricted use, dis-
tribution, and reproduction in any medium, provided you give appropriate credit to the original
author(s) and the source, provide a link to the Creative Commons license, and indicate if changes were
made.
References
Adlof, S. M., Catts, H. W., & Little, T. D. (2006). Should the simple view of reading include a fluency
component? Reading and Writing, 19(9), 933–958.
Beck, I. L., & McKeown, M. G. (1983). Learning words well: A program to enhance vocabulary and
comprehension. Reading Teacher, 36(7), 622–625.
Box, G. E. P., & Cox, D. R. (1964). An analysis of transformations. Journal of the Royal Statistical
Society: Series B (Methodological), 26(2), 211–252.
Braze, D., Mencl, W. E., Tabor, W., Pugh, K. R., Constable, R. T., Fulbright, R. K., et al. (2011).
Unification of sentence processing via ear and eye: An fMRI study. Cortex, 47, 416–431.
Braze, D., Shankweiler, D. P., Ni, W., & Palumbo, L. C. (2002). Readers’ eye movements distinguish
anomalies of form and content. Journal of Psycholinguistic Research, 31(1), 25–44.
Braze, D., Tabor, W., Shankweiler, D., & Mencl, W. E. (2007). Speaking up for vocabulary: Reading skill
differences in young adults. Journal of Learning Disabilities, 40, 226–243.
Conners, F. (2009). Attentional control and the simple view of reading. Reading and Writing, 22(5),
591–613.
Coyne, M. D., McCoach, D. B., Loftus, S., Zipoli, R., Ruby, M., Crevecoeur, Y., & Kapp, S. (2010).
Direct & extended vocabulary instruction in kindergarten: Investigating transfer effects. Journal of
Research on Educational Effectiveness, 3, 93–120.
Coyne, M. D., McCoach, D. B., & Sharon, K. (2007). Vocabulary intervention for kindergarten students:
Comparing extended instruction to embedded instruction and incidental exposure. Learning
Disability Quarterly, 30(2), 74–88.
Cutting, L. E., & Scarborough, H. S. (2006). Prediction of reading comprehension: Relative contributions
of word recognition, language proficiency, and other cognitive skills can depend on how
comprehension is measured. Scientific Studies of Reading, 10(3), 277–299.
Dunn, L. M., & Dunn, L. M. (1997). Peabody picture vocabulary test (3rd ed.). Circle Pines, MN:
American Guidance Service.
Foorman, B. R., Herrera, S., Petscher, Y., Mitchell, A., & Truckenmiller, A. (2015). The structure of oral
language and reading and their relation to comprehension in Kindergarten through Grade 2. Reading
and Writing, 28(5), 655-681.
Fox, J., & Weisberg, S. (2011). An R companion to applied regression (2nd ed.). Thousand Oaks, CA:
Sage.
Fraser, J., & Conti-Ramsden, G. (2008). Contribution of phonological and broader language skills to
literacy. International Journal of Language & Communication Disorders, 43(5), 552–569.
Vocabulary does not complicate the simple view of reading 449
123

Frost, S. J., Landi, N., Mencl, W. E., Sandak, R., Fulbright, R. K., Tejada, E. T., et al. (2009).
Phonological awareness predicts activation patterns for print and speech. Annals of Dyslexia, 59(1),
78–97.
Gough, P. B., & Tunmer, P. B. (1986). Decoding, reading, and reading disability. Remedial and Special
Education, 7, 6–10.
Hart, B., & Risley, T. R. (2003). The early catastrophe: The 30 million word gap by age 3. American
Educator, 27(1), 4–9.
Jamshidian, M., & Jalal, S. (2010). Tests of homoscedasticity, normality, and missing completely at
random for incomplete multivariate data. Psychometrika, 75(4), 649–674.
Jamshidian, M., Jalal, S. J., & Jansen, C. (2014). MissMech: An R package for testing homoscedasticity,
multivariate normality, and missing completely at random (mcar). Journal of Statistical Software,
56(6), 1–31.
Joshi, R. M. (2005). Vocabulary: A critical component of comprehension. Reading & Writing Quarterly,
21(3), 209–219.
Keenan, J. M., Betjemann, R. S., & Olson, R. K. (2008). Reading comprehension tests vary in the skills
they assess: Differential dependence on decoding and oral comprehension. Scientific Studies of
Reading, 12(3), 281–300.
Kenny, D. A. (2014). Measuring model fit. Retrieved April 28, 2015, from http://davidakenny.net/cm/fit.
htm.
Kline, R. B. (2011). Principles and practice of structural equation modeling. New York, NY: Guilford
Press.
Leach, J. M., Scarborough, H. S., & Rescorla, L. (2003). Late-emerging reading disabilities. Journal of
Educational Psychology, 95, 211–224.
Macaruso, P., & Shankweiler, D. (2010). Expanding the simple view of reading in accounting for reading
skills in community college students. Reading Psychology, 31(5), 454–471.
MacGinitie, W. H., MacGinitie, R. K., Maria, K., Dryer, L. G., & Hughes, K. E. (2000). Gates–
MacGinitie Reading Tests (GMRT). Itasca: Riverside Publishing.
Markwardt, F. C., Jr. (1998). Peabody individual achievement test—revised. Circle Pines, MN: American
Guidance Service.
Ouellette, G. P. (2006). What’s meaning got to do with it: The role of vocabulary in word reading and
reading comprehension. Journal of Educational Psychology, 98(3), 554–566.
Ouellette, G., & Beers, A. (2010). A not-so-simple view of reading: How oral vocabulary and visual-word
recognition complicate the story. Reading and Writing, 23(2), 189–208.
Perfetti, C. A. (2007). Reading ability: Lexical quality to comprehension. Scientific Studies of Reading,
11(4), 357–383.
Perfetti, C., & Stafura, J. (2014). Word knowledge in a theory of reading comprehension. Scientific
Studies of Reading, 18(1), 22–37.
Perin, D. (2013). Literacy skills among academically underprepared students. Community College
Review, 41(2), 118–136.
Protopapas, A., Mouzaki, A., Sideridis, G. D., Kotsolakou, A., & Simos, P. G. (2013). The role of
vocabulary in the context of the simple view of reading. Reading & Writing Quarterly, 29(2),
168–202.
Psychological Corporation. (1999). Wechsler abbreviated scale of intelligence. San Antonio: Harcourt
Brace & Co.
R Core Team. (2013). R: A language and environment for statistical computing. Vienna: R Foundation
for Statistical Computing. Retrieved from http://www.r-project.org.
Roberts, G., Torgesen, J. K., Boardman, A., & Scammacca, N. (2008). Evidence-based strategies for
reading instruction of older students with learning disabilities. Learning Disabilities Research &
Practice, 23(2), 63–69.
Rosseel, Y. (2012). Lavaan: An R package for structural equation modeling. Journal of Statistical
Software, 48(2), 1–36.
Sabatini, J. P., Sawaki, Y., Shore, J. R., & Scarborough, H. S. (2010). Relationships among reading skills
of adults with low literacy. Journal of Learning Disabilities, 43(2), 122–138.
Scammacca, N. K., Roberts, G., Vaughn, S., & Stuebing, K. K. (2015). A meta-analysis of interventions
for struggling readers in grades 4–12: 1980–2011. Journal of Learning Disabilities, 48(4), 369–390.
Senechal, M., Ouellette, G., & Rodney, D. (2006). The misunderstood giant: On the predictive role of
early vocabulary to future reading. In S. B. Neuman & D. Dickinson (Eds.), Handbook of early
literacy research (Vol. 2, pp. 173–182). New York: Guilford Press.
450 D. Braze et al.
123
Shankweiler, D. P., Mencl, W. E., Braze, D., Tabor, W., Pugh, K. R., & Fulbright, R. K. (2008). Reading
differences and brain: Cortical integration of speech and print in sentence processing varies with
reader skill. Developmental Neuropsychology, 33(6), 745–776.
Silverman, R. D., Speece, D. L., Harring, J. R., & Ritchey, K. D. (2012). Fluency has a role in the simple
view of reading. Scientific Studies of Reading, 17(2), 108–133.
Spring, C., & French, L. (1990). Identifying children with specific reading disabilities from listening and
reading discrepancy scores. Journal of Learning Disabilities, 23, 53–58.
Tighe, E. L., & Schatschneider, C. (2015). Exploring the dimensionality of morphological awareness and
its relations to vocabulary knowledge in adult basic education students. Reading Research
Quarterly, 50(3), 293–311.
Torgesen, J. K., Wagner, R. K., & Rashotte, C. A. (1999). Tests of word reading efficiency (TOWRE).
Austin, TX: Pro-Ed.
Townsend, D., Filippini, A., Collins, P., & Biancarosa, G. (2012). Evidence for the importance of
academic word knowledge for the academic achievement of diverse middle school students. The
Elementary School Journal, 12(3), 497–518.
Tunmer, W. E., & Chapman, J. W. (2012). The simple view of reading redux vocabulary knowledge and
the independent components hypothesis. Journal of Learning Disabilities, 45(5), 453–466.
Uccelli, P., Phillips Galloway, E., Barr, C. D., Meneses, A., & Dobbs, C. L. (2015). Beyond vocabulary:
Exploring cross-disciplinary academic-language proficiency and its association with reading
comprehension. Reading Research Quarterly, 50(3), 337–356.
Van Dyke, J. A., Johns, C. L., & Kukona, A. (2014). Low working memory capacity is only spuriously
related to poor reading comprehension. Cognition, 13(3), 372–404.
Woodcock, R. W., McGrew, K. S., & Mather, N. (2001). Woodcock–Johnson III tests of achievement.
Itasca, IL: Riverside.
Vocabulary does not complicate the simple view of reading 451
123