vmworld 2013: vcenter operations management –troubleshooting best practices
DESCRIPTION
VMworld 2013 Praveen Kannan, VMware Frank Brix Pedersen, Arrow ECS Denmark Learn more about VMworld and register at http://www.vmworld.com/index.jspa?src=socmed-vmworld-slideshareTRANSCRIPT

vCenter Operations Management –
Troubleshooting Best Practices
Praveen Kannan, VMware
Frank Brix Pedersen, Arrow ECS Denmark
VCM4555
#VCM4555
Agenda
– Introduction to vCenter Operations Management Suite
– Myths
– vCenter Operations Manager Overview
– Dashboard and Badges
– Smart Alerts
– Related Events
– Metric Chart
– Heat Maps
– Custom Dash Board
– Q&A
2

VMware Cloud Management Portfolio
SIMPLE,
AUTOMATED
MANAGEMENT
FOR THE CLOUD
CLOUD SERVICE
PROVISIONING
CLOUD OPERATIONS
MANAGEMENT
CLOUD BUSINESS
MANAGEMENT
vCloud Automation
Center
vFabric Application
Director
vCenter
Operations
Management
Suite
vCenter Log
Insight
VMware
IT Business
Management
Suite
New!
vCenter Operations Management Suite
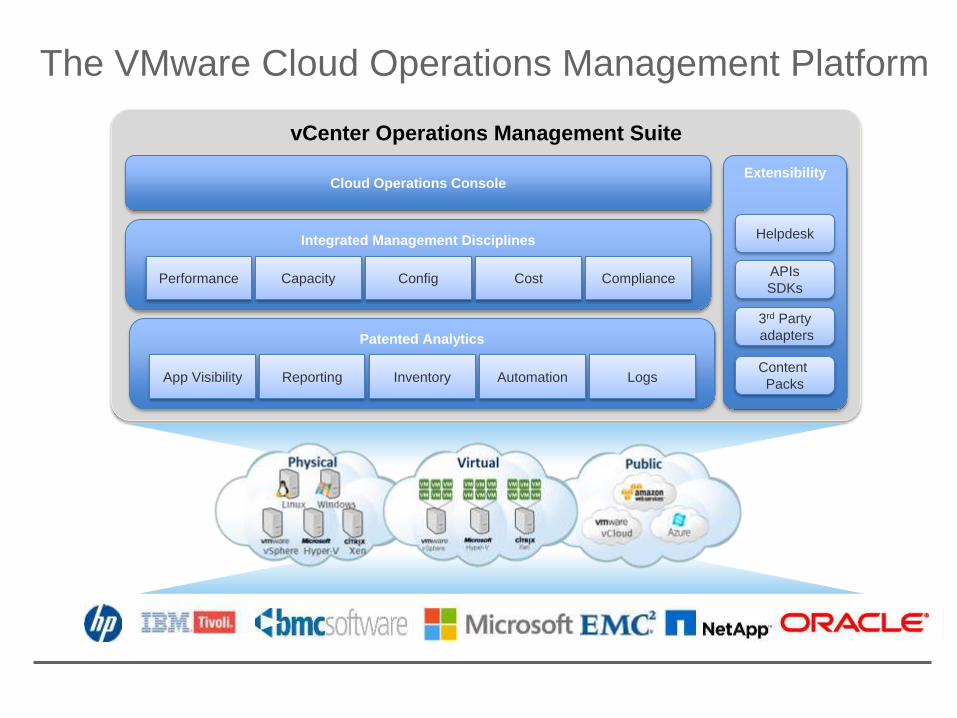
The VMware Cloud Operations Management Platform
Cloud Operations Console Extensibility
APIs
SDKs
3rd Party
adapters
Content
Packs
Helpdesk Integrated Management Disciplines
Performance Compliance Config Capacity Cost
Patented Analytics
App Visibility Logs Inventory Reporting Automation
Myths
– vCenter Operations Manager is only for the Enterprise with thousands
of virtual machines
– I am a vSphere Ninja – esxtop is the only tool I need. vCops got
nothing on me
5
Overview ‒ Features
– How much capacity have I left in my environment – when will I run out
of resources and what resource (storage, cpu, memory, network)
– Reclaim waste
– Proactive alerting
– Root Cause analysis
– Deep forensics analysis
– vCenter Operations Manager is a lot more than badges and it is a lot
more than we can cover in 50 minutes!
6

Dashboard
7
Is it healthy
= Health
Is it enough
= Risk
Is it
optimized =
Efficiency

Badges
8
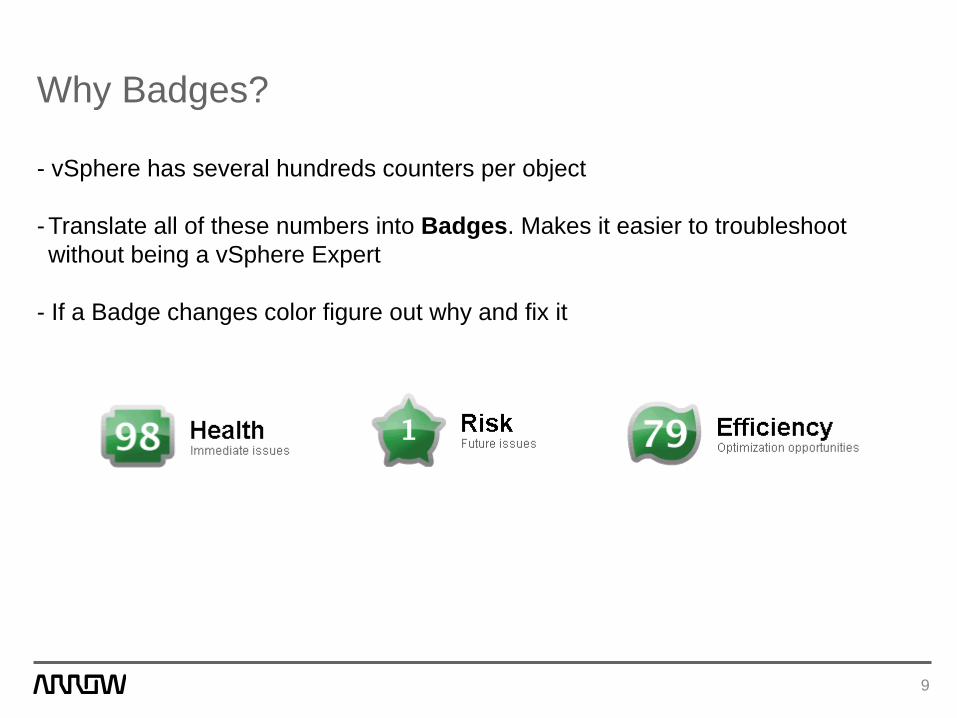
Why Badges?
9
- vSphere has several hundreds counters per object
- Translate all of these numbers into Badges. Makes it easier to troubleshoot
without being a vSphere Expert
- If a Badge changes color figure out why and fix it

Health Changed – Related Events
10

vCops Integration in vCenter Web Client
11
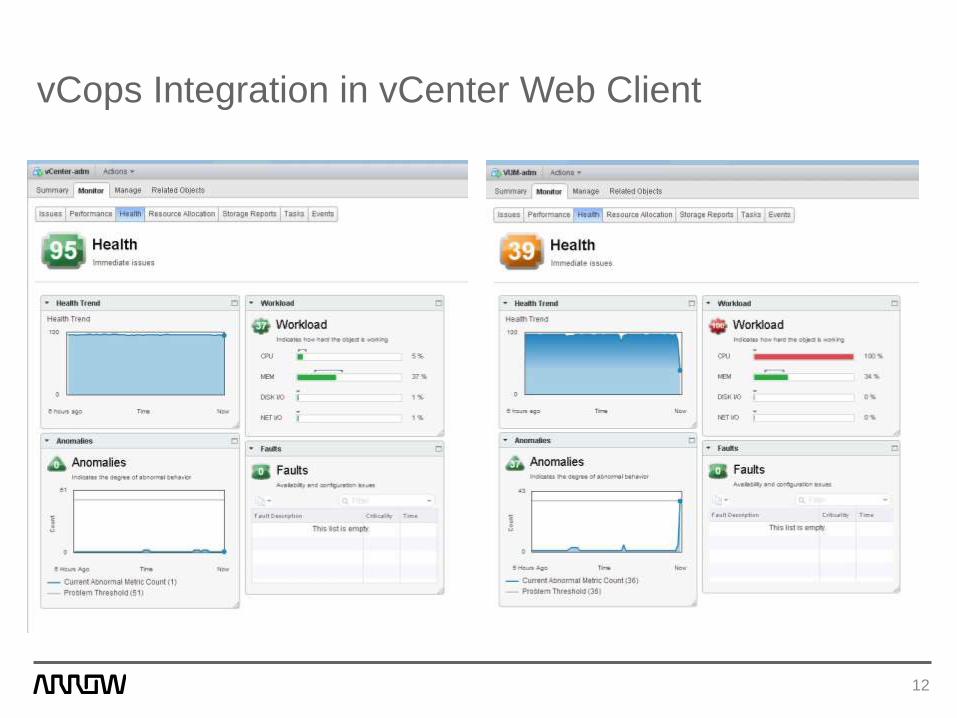
vCops Integration in vCenter Web Client
12
vCenter Alarms versus vCops Smart Alerts
– vCenter uses static thresholds
– vCops uses dynamic thresholds
– Each object has its own thresholds calculated
13

Virtual Machine CPU Usage Alarm in vCenter
14
Warning
5 min > 75%
Alert
5 min > 90%
How often does
this actually report
a fault?

Dynamic Threshold in vCops
15
- Instead of static thresholds vCops uses dynamic thresholds (DT)
- No need to get alert if a machine is doing what it normally does
- How do we know normal behaviour is good behaviour??
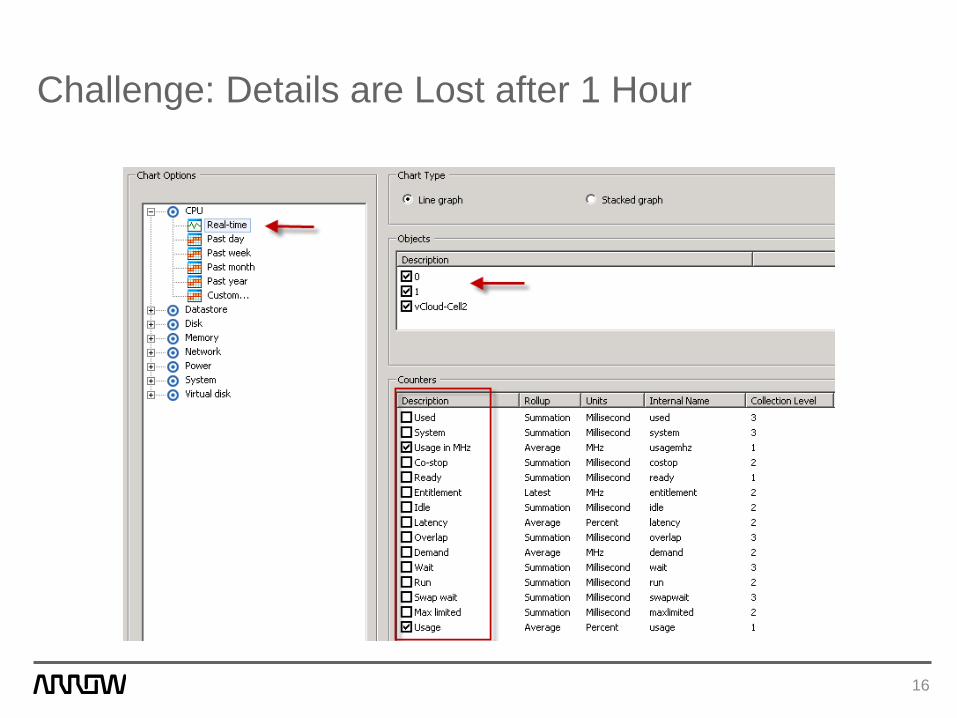
Challenge: Details are Lost after 1 Hour
16

Challenge: Details are Lost after 1 Hour
17
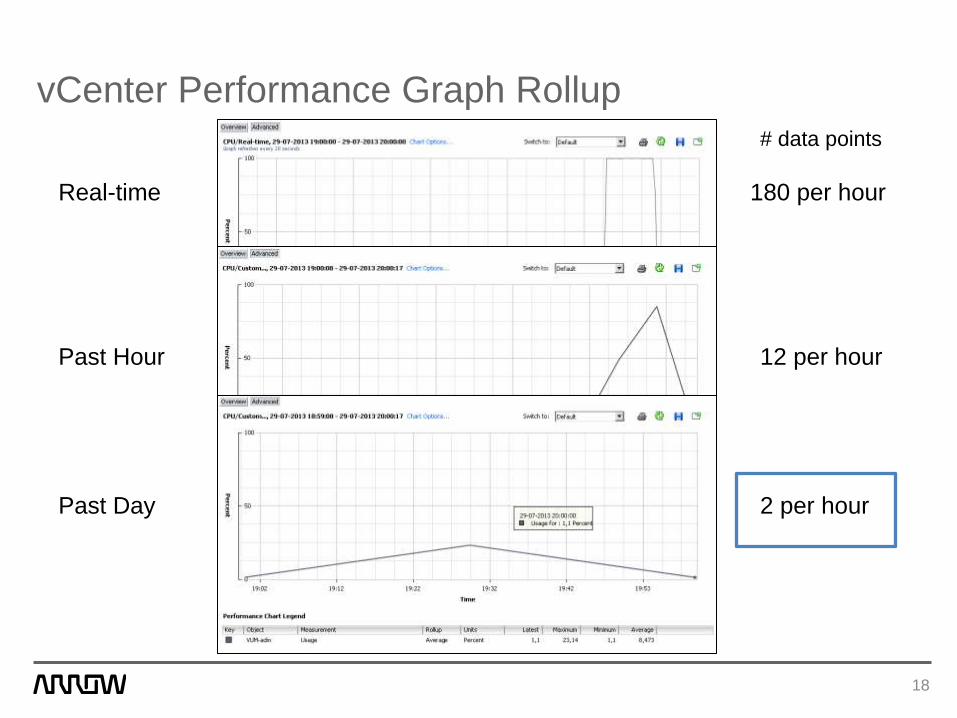
vCenter Performance Graph Rollup
18
Real-time
Past Hour
Past Day
180 per hour
12 per hour
2 per hour
# data points
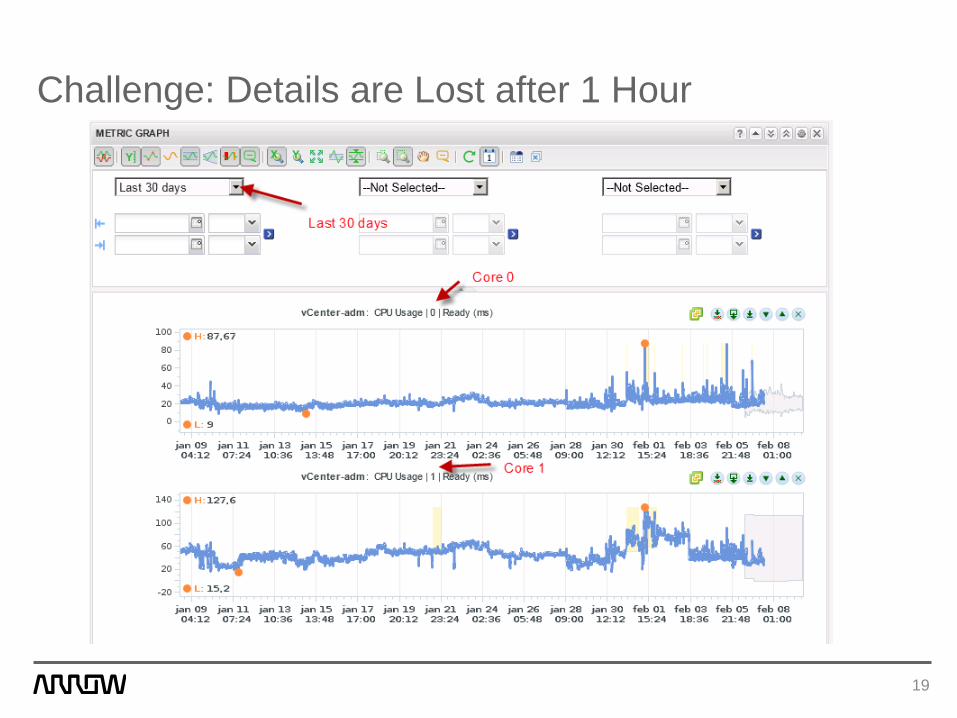
Challenge: Details are Lost after 1 Hour
19
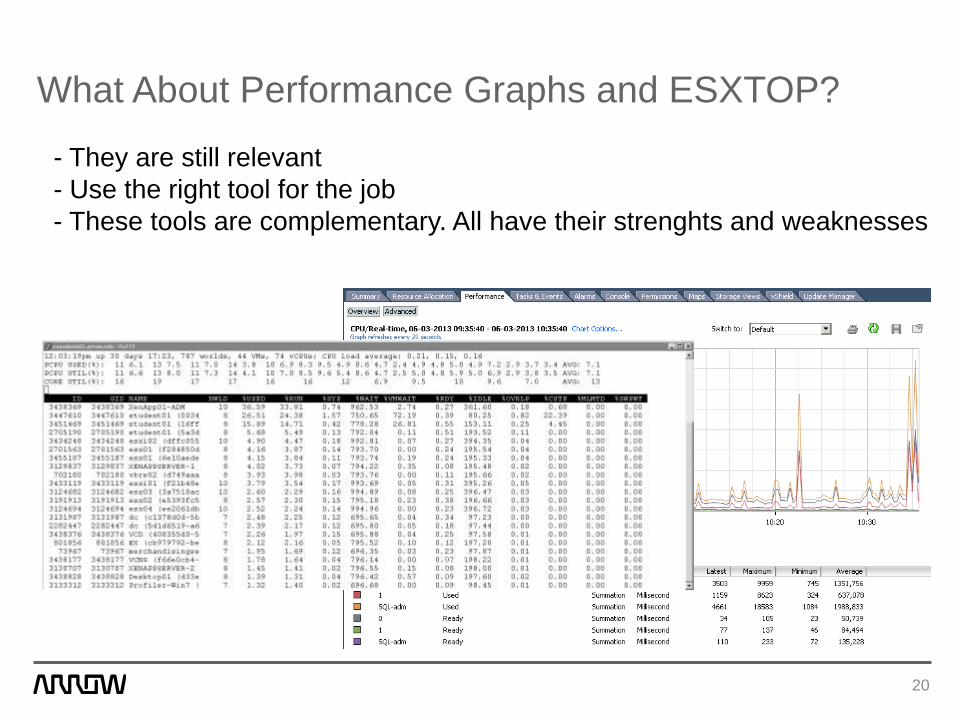
What About Performance Graphs and ESXTOP?
20
- They are still relevant
- Use the right tool for the job
- These tools are complementary. All have their strenghts and weaknesses

ESXTOP vs. Perf. Graphs vs. Metric Chart
– Use ESXTOP for ”live” monitoring
– Use vCenter Performance Graphs for ”real-time” (past-hour)
– Use vCops Metric Chart for everything that is not ”real-time”
– Trendline, Dynamic Thresholds, Multiple Graph on one page. All counters
available, 5 minutes intervals.
21
ESXTOP vCenter
Past Hour
vCenter
Past Day
vCenter
Past Week
vCops Metric
Chart
Data
Interval
2-20 sec. 20 sec. 5 min. 30 min. 5 min.
Finding the Most IO Intensive Virtual Machines
- Users have reported slow disk performance
- You want to find out what virtual machines is saturating the storage array.
- You have 30 ESXi hosts, 40 datastores and 600 virtual machines.
Approximately 15 VMs per datastore.
- What do you do?
22
– Start 30 ESXTOP in batch mode and add all data to Excel?
– Open 600 Performance Graphs in vCenter and save them all?
– All of the data is in the vCenter Database, but not easily accessible!
– With vCops it is extremely easy to find this information.
The Key word is ”Heat Maps”
23
Finding the Most IO Intensive Virtual Machines
vCops Heat Maps
– A Heat Map is a graphical representation of one or two metrics.
– Use them to find ”Hot-Spots” in your environment
– One Metric defines the Size of the blocks in the map
– The second metric defines the Color of the blocks in the map
– Build your own or use the pre-defined
24
Build You Own Heat Map of Use the Pre-defined
25
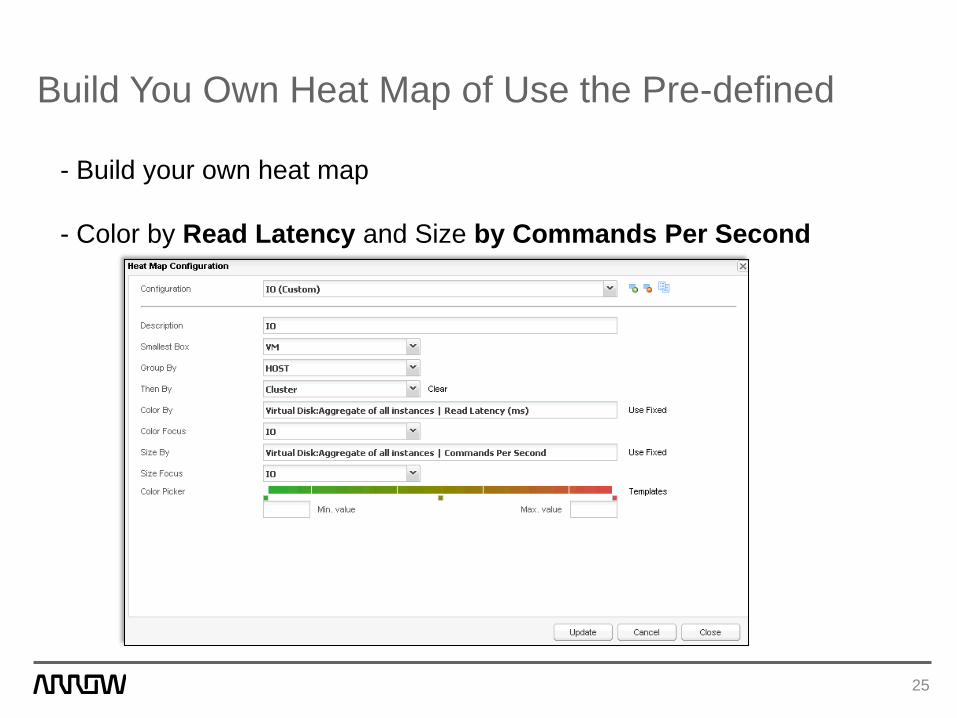
- Build your own heat map
- Color by Read Latency and Size by Commands Per Second
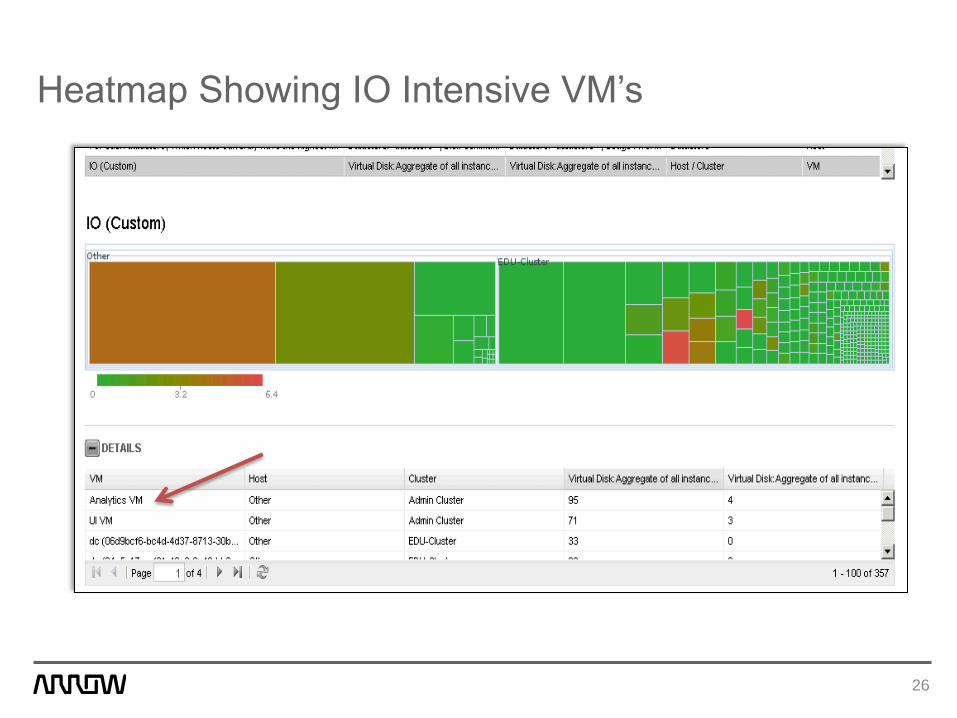
Heatmap Showing IO Intensive VM’s
26
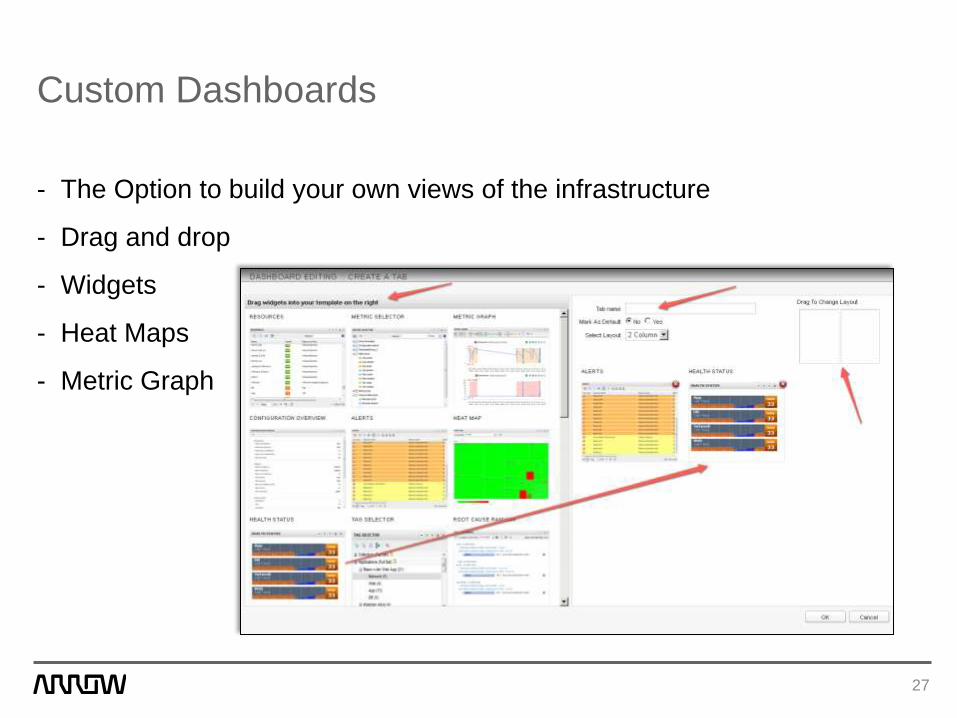
Custom Dashboards
- The Option to build your own views of the infrastructure
- Drag and drop
- Widgets
- Heat Maps
- Metric Graph
27

Why Customizable Dashboards
– Create different views of the infrastructure
– Storage View
– Network View
– vSphere View
– CPU analysis
– Memory analysis
– Datastore analysis
– My favorite: Forensics dashboard
28

Example: Storage Dashboards
29
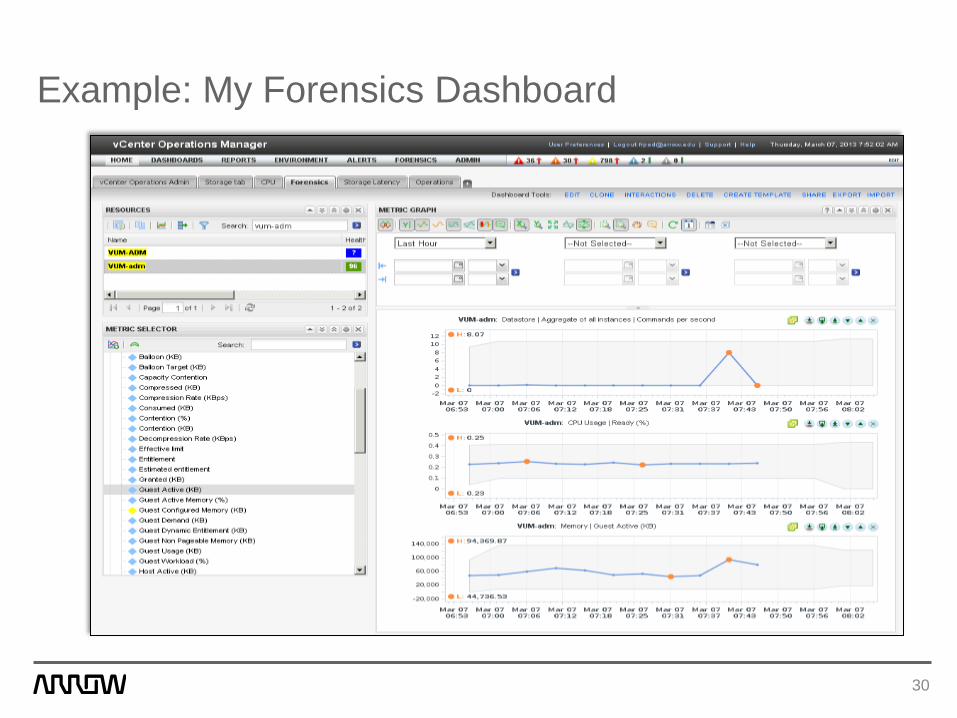
Example: My Forensics Dashboard
30
Summary
– Use vCenter Operations Manager Metric Chart for insight into every
counter. No rollup
– Use the Badges in your troubleshooting methodology
– Use Smart Alerts to find out if the object is behaving normal
– Use Heat Maps to find hotspots
– Build your own views of your infrastructure with Custom Dashboards
31

Q&A
32

33
Other VMware Activities Related to This Session
HOL:
HOL-SDC-1301
Applied Cloud Operations
Group Discussions:
VCM1002-GD, VCM1004-GD
Cloud Operations with Hicham Mourad or Sam McBride
VCM4555

THANK YOU

vCenter Operations Management –
Troubleshooting Best Practices
Praveen Kannan, VMware
Frank Brix Pedersen, Arrow ECS Denmark
VCM4555
#VCM4555