vlq%ulwlvk&roxpeld - geo scientific risc... · standard operating procedures for hydrometric...
TRANSCRIPT
0DQXDO�RI�6WDQGDUG�2SHUDWLQJ3URFHGXUHV�IRU�+\GURPHWULF6XUYH\V�LQ�%ULWLVK�&ROXPELD
Prepared byMinistry of Environment, Lands & Parks
Resources Inventory Branchfor the Aquatic Inventory Task Force
Resources Inventory Committee
Version 1.0
November 2, 1998

© Copyright The Province of British ColumbiaPublished by theResources Inventory Committee
Canadian Cataloguing in Publication DataMain entry under title:
1. Manual of standard operating procedures for hydrometric surveys in BritishColumbia [computer file]
Available through the Internet.
Issued also in printed format on demand.
Includes bibliographical references: p.
ISBN 0-7726-3484-X
1. Stream measurements - British Columbia. I. G.McG. Clark and Associates. II.BC Environment. Resources Inventory Branch. III. Resources InventoryCommittee (Canada). Aquatic Ecosystems Task Force.
TC177.M36 1998 627’.042’09711 C98-960051-3
Additional Copies of this publication can be purchased from:Superior Repro#200 - 1112 West Pender StreetVancouver, BC V6E 2S1Tel: (604) 683-2181Fax: (604) 683-2189
Digital Copies are available on the Internet at:http://www.for.gov.bc.ca/ric
Standard Operating Procedures for Hydrometric Surveys
November 2, 1998 iii
PrefaceThe Manual of Standard Operation Procedures for Hydrometric Surveys in BritishColumbia defines a common set of standards with detailed procedures for the successfulacquisition of water quantity data. This will result in measurable quality, the fundamentalrequirement under the mandate of the Resources Inventory Committee (RIC). Thisedition is subject to further editorial and technical review during its formal field testperiod which goes until the end of 1998.
Writing for this manual has been completed and many of the comments of reviewersincluding an independent consultant have been incorporated. The subject covered in thismanual can not be exhaustive, nevertheless, what is included must be clear and precise,therefore further input is invited from all users.
The next version will consider the following:
1. Adoption and implementation of additional recommendations madeby the review consultant, M. Miles and Associates,
2. supplementation of graphics, illustrations, tables and bibliography asrequired to clarify the text and
3. classification and incorporation of suggestions from reviewers andusers, received during field trials.
The next formal edit should begin toward the end of the field trial period.
The Resources Inventory Branch, Ministry ofEnvironment, Lands & Parks (MELP) will acceptand compile all relevant materials and comments inpreparation for the next edition. Please submit suchmaterial to the undersigned or to Wilf Dreher,Manager of the Water Inventory Section in Victoria.
R.P. Richards, P.Eng.Project ManagerOctober, 1997
Standard Operating Procedures for Hydrometric Surveys
November 2, 1998 v
AcknowledgmentsFunding of the Resources Inventory Committee work, including the preparation of thisdocument, is provided by the Corporate Resources Inventory Initiative (CRII) and byForest Renewal BC (FRBC). Preliminary work of the Resources Inventory Committeewas funded by the Canada-British Columbia Partnership Agreement of Forest ResourceDevelopment FRDA II.
The Resources Inventory Committee consists of representatives from various ministriesand agencies of the Canadian and the British Columbia governments as well as fromFirst nations peoples. RIC objectives are to develop a common set of standards andprocedures for the provincial resources inventories, as recommended by the ForestResources Commission in its report “The Future of our Forests”.
For further information about the Resources Inventory Committee and its various TaskForces, please contact:
The Executive SecretariatResources Inventory Committee840 Cormorant StreetVictoria, BC V8W 1R1
Tel: (250) 920-0661Fax: (250) 384-1841
http://www.for.gov.bc.ca/ric
Aquatic Inventory Task Force
This standards manual is the first attempt to define and publish a widely availablereference for the practice of hydrometric surveying in British Columbia. The role ofthe Resources Inventory Committee in this venture is significant, because the manualprovides for the first time the means for regulating the standard of quality forprovincially based hydrometric programs.
This work parallels the widely respected National Standards developed by EnvironmentCanada, which has been utilized extensively along with other sources listed andacknowledged in Appendix VII. Contract services for assembly of materials andinformation and writing were provided by Gordon Clark of G.McG. Clark andAssociates, drawing on the references and his own experience. The data logger sectionwas written by Frank van der Have of Mill Bay, BC. Editorial and organizationalservices and formatting were provided by Kathi Hagan, a Vancouver Technical Writerand Editor. Formatting assistance to bring the manual to RIC publication standards wasprovided by Leah Westereng of the Wildlife Inventory Section, Resources InventoryBranch, (MELP).

Standard Operating Procedures for Hydrometric Surveys
vi November 2, 1998
Standards development as well as technical writing and review were done by ResourcesInventory Branch staff, mainly D.B. Letvak and R.P. Richards. M. Miles and Associatesof Victoria conducted an extensive and independent review of the contents and theirarrangement. A review committee consisting of individuals within the Ministry ofForests and the Ministry of Environment, Lands and Parks provided helpful advice.
Standard Operating Procedures for Hydrometric Surveys
November 2, 1998 vii
AbstractManual of Standard Procedures for Hydrometric Surveys in British Columbia
This manual prescribes the procedures for hydrometric surveys, or the measurement andrecording of water level and discharge in an open channel. The three basic measurementsare discussed: gauge height (stage); and velocity and area of flow, which are required tocompute discharge. The manual describes all aspects of hydrometric surveys includingstream reconnaissance, site selection, station design and construction, instrumentation,gauge height measurement, discharge calculation, stage-discharge rating and dischargecompilation.
Documentation of station operation and data compilation procedures is essential forverifying the quality of data for archiving; standard forms for this documentation areprovided. Software for on-site computation and recording of discharge calculation isintroduced.
Standard Operating Procedures for Hydrometric Surveys
November 2, 1998 ix
Table of ContentsPreface................................................................................................................................iii
Acknowledgments............................................................................................................... v
Abstract .............................................................................................................................vii
A. INTRODUCTION TO PROVINCIAL STANDARDS ................................................. 1
A.1 Standardization of Hydrometric Surveys................................................................. 1
A.1.1 The Need for Provincial Hydrometric Standards.............................................. 1
A.1.2 The Role of RIC................................................................................................ 2
A.1.3 Hydrometric Data - Approval and Storage ....................................................... 2
A.1.4 Who Should Use the Manual ............................................................................ 2
A.1.5 Disclaimer ......................................................................................................... 3
A.2 Provincial Standards ................................................................................................ 4
A.2.1 Introduction....................................................................................................... 4
A.2.2 RIC / Provincial Standards................................................................................ 4
A.3 Data Certification and Audit .................................................................................... 6
A.3.1 Review and Approval........................................................................................ 6
A.3.2 Data Audits ....................................................................................................... 7
B. FUNDAMENTALS OF HYDROMETRIC OPERATIONS ......................................... 9
B.1 Establishing a Gauging Station ................................................................................ 9
B.1.1 Choosing a Station Type ................................................................................... 9
B.1.2 Types of Gauging Stations ................................................................................ 9
B.1.3 Selecting a Site for the Gauging Station ......................................................... 18
B.2 Constructing a Gauging Station ............................................................................. 21
B.2.1 Design Costing ................................................................................................ 21
B.2.2 Permissions...................................................................................................... 21
Standard Operating Procedures for Hydrometric Surveys
x November 2, 1998
B.2.3 Reference Gauge Installation ..........................................................................21
B.2.4 Selecting the Metering Section .......................................................................32
C. HYDROMETRIC SURVEY EQUIPMENT................................................................35
C.1 Water Level Recorders...........................................................................................35
C.1.1 Introduction .....................................................................................................35
C.1.2 Graphic Recorders...........................................................................................35
C.1.3 Digital Recorders.............................................................................................36
C.1.4 Documentation of Station Water Level...........................................................43
C.2 Instrument Shelters for Stilling Wells....................................................................44
C.2.1 Types of Shelters .............................................................................................45
C.3 Stilling Wells..........................................................................................................47
C.3.1 Construction and Placement............................................................................48
C.3.2 Intake Pipe Design and Placement ..................................................................54
C.3.3 Operation and Maintenance ............................................................................55
C.4 Current Meters........................................................................................................60
C.4.1 Introduction .....................................................................................................60
C.4.2 Vertical Axis Current Meters ..........................................................................62
C.4.3 Horizontal Axis Current Meters......................................................................70
C.4.4 Current Meter Counters and Timing Devices .................................................80
C.5 Other Equipment and Assemblies ..........................................................................85
C.5.1 Rods.................................................................................................................85
C.5.2 Handlines, Hangers, and Weights ...................................................................87
C.5.3 Reels ................................................................................................................89
C.5.4 Portable Flumes...............................................................................................90
C.5.5 Volumetric Measurement Equipment .............................................................93
C.5.6 Metering Bridges.............................................................................................93
Standard Operating Procedures for Hydrometric Surveys
November 2, 1998 xi
D. STREAMFLOW MEASUREMENT PROCEDURES................................................ 99
D.1 Pre-Measurement Activities................................................................................... 99
D.1.1 Field Data Book and Forms ............................................................................ 99
D.1.2 Before Departing for the Field ........................................................................ 99
D.1.3 On Site Preparations...................................................................................... 100
D.2 Discharge Measurement....................................................................................... 103
D.2.1 Measuring by Wading................................................................................... 103
D.2.2 Measuring from a Bridge .............................................................................. 110
D.2.3 Measuring from a Bank-Controlled Cableway ............................................. 123
D.3 Post-Measurement Activities and Discharge Measurement Computation .......... 124
D.3.1 Errors Affecting Accuracy ............................................................................ 124
D.3.2 Mean Section Method ................................................................................... 127
D.3.3 Mid-Section Method ..................................................................................... 127
D.4 Documentation of Station Water Level ............................................................... 129
D.4.1 Introduction................................................................................................... 129
D.4.2 Proper Documentation .................................................................................. 129
D.4.3 Station Log Form .......................................................................................... 130
D.4.4 Discharge Measurement Note....................................................................... 130
E. HYDROMETRIC LEVELLING PROCEDURES..................................................... 131
E.1 Introduction .......................................................................................................... 131
E.2 Procedure for Conducting Two-Peg Test ............................................................. 131
E.3 Levelling Procedures ............................................................................................ 132
E.3.1 Setting Up the Instrument.............................................................................. 132
E.3.2 Positioning and Reading the Rod .................................................................. 133
E.3.3 Level Notes.................................................................................................... 135
E.3.4 Gauge Checks ................................................................................................ 139
Standard Operating Procedures for Hydrometric Surveys
xii November 2, 1998
E.3.5 Line, or Differential, Levelling .....................................................................144
E.3.6 Reciprocal Levelling......................................................................................146
E.3.7 Adjustment of Elevation................................................................................148
E.3.8 Levelling Errors.............................................................................................148
F. RATING STREAMS AND COMPUTING DISCHARGE........................................151
F.1 Introduction...........................................................................................................151
F.2 Stage-Discharge Relationship...............................................................................151
F.2.1 Development of a Stage-Discharge Rating Curve .........................................151
F.2.2 Curve Plotting ................................................................................................153
F.2.3 Determining Zero Flow Gauge Height ..........................................................154
F.2.4 Extending the Rating Curve...........................................................................156
F.2.5 Curve Labelling .............................................................................................157
F.2.6 Stage-Discharge Tables .................................................................................157
F.2.7 Expanded Stage Discharge Table ..................................................................158
F.2.8 Daily Discharges............................................................................................158
F.2.9 Loop Curves...................................................................................................161
F.3 Summary of Discharge Measurements AQU-05 Form.........................................163
F.3.1 Introduction....................................................................................................163
F.3.2 Shift and Backwater Corrections ...................................................................168
F.3.3 Symbols and Footnotes..................................................................................170
F.3.4 Station Analysis .............................................................................................172
F.3.5 Conclusion .....................................................................................................172
G. DISCHARGE MEASUREMENT STRUCTURES ...................................................174
G.1 Introduction ..........................................................................................................174
G.2 Purpose.................................................................................................................174
G.3 Design ..................................................................................................................174

Standard Operating Procedures for Hydrometric Surveys
November 2, 1998 xiii
G.3.1 Design Considerations .................................................................................. 175
G.3.2 Selecting the Measuring Device ................................................................... 175
G.3.3 Installation..................................................................................................... 175
G.3.4 Site Conditions.............................................................................................. 180
G.3.5 Erosion Protection......................................................................................... 181
G.4 Continuous Stage Recording................................................................................ 181
G.4.1 Flumes........................................................................................................... 181
G.4.2 Weirs ............................................................................................................. 182
APPENDICES............................................................................................................. 187
Appendix I. Glossary .............................................................................................. 189
Appendix II. Hydrometric Forms............................................................................ 195
Appendix III. Analogue Recorders......................................................................... 209
Appendix III-1. Type F Water Level Recorder................................................... 209
Appendix III-2. Type A Water Level Recorder.................................................. 211
Appendix III-4. Clock Removal and Servicing................................................... 221
Appendix III-5. Recorder Options and Accessories ........................................... 224
Appendix III-6. Recorder Dismantling and Reassembly .................................... 225
Appendix III-7. Recorder Troubleshooting......................................................... 229
Appendix IV. Water Act ......................................................................................... 233
The Regulation.................................................................................................... 233
Appendix V. Discharge Tables for Rated Structures.............................................. 247
Appendix VI. Discharge Measurement Field Data and Calculation (DMFDC) V. 1.2279
1.0 Introduction to DMFDC................................................................................ 281
2.0 Entering Data into a DMFDC Worksheet..................................................... 281
3.0 DMFDC and WindowsCE ............................................................................ 286
Appendix VII. List of References........................................................................... 295

Standard Operating Procedures for Hydrometric Surveys
xiv November 2, 1998
Standard Operating Procedures for Hydrometric Surveys
November 2, 1998 xv
List of FiguresFigure B-1. Two water level recorders: a data logger and an analogue recorder. ............ 12
Figure B-2. Pool formed by a modified Crump Weir, where both a digital and ananalogue recorder are installed. Judge Creek, Victoria Water Board. The crest hasbeen formed with a shallow vee to increase low flow sensitivity. ........................... 13
Figure B-3. Data logger and analogue recorder installed in the instrument shelter at theabove site. Judge Creek, Victoria Water Board........................................................ 14
Figure B-4. Boulder control (subject to debris build-up) and water level recorder stillingwell and shelter. Narcosli Creek, above Ramsay Creek, West Fraser. ..................... 15
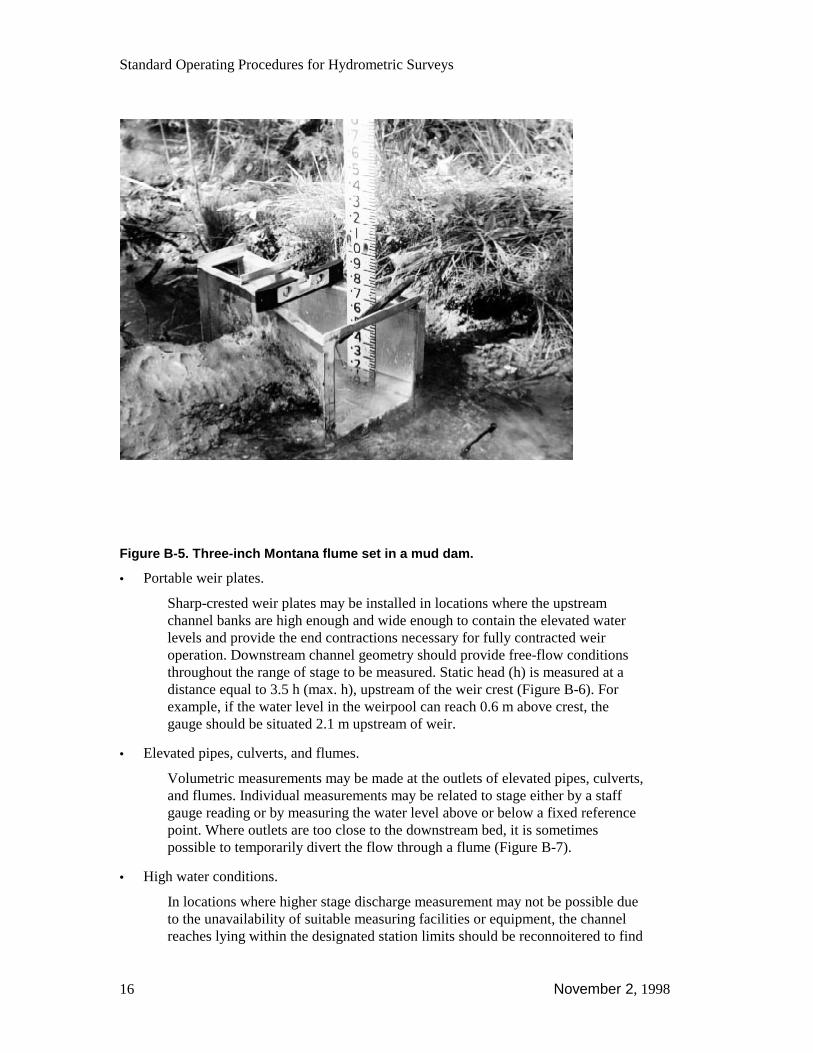
Figure B-5. Three-inch Montana flume set in a mud dam................................................ 16
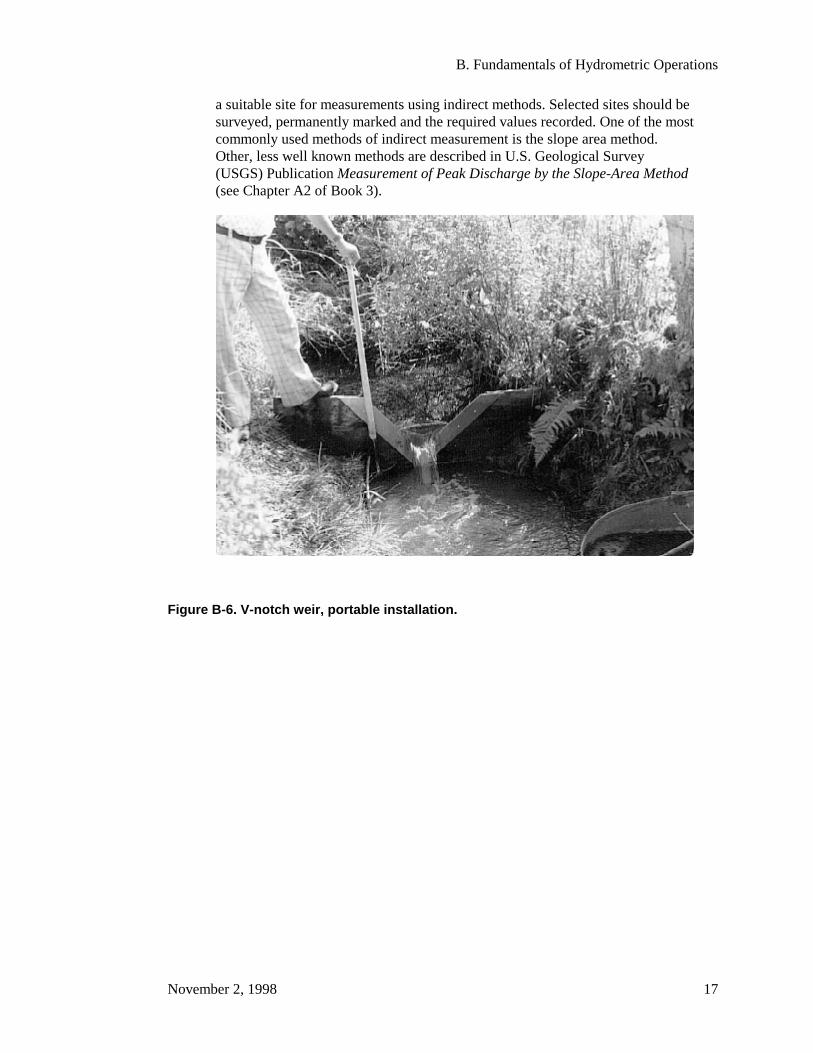
Figure B-6. V-notch weir, portable installation................................................................ 17
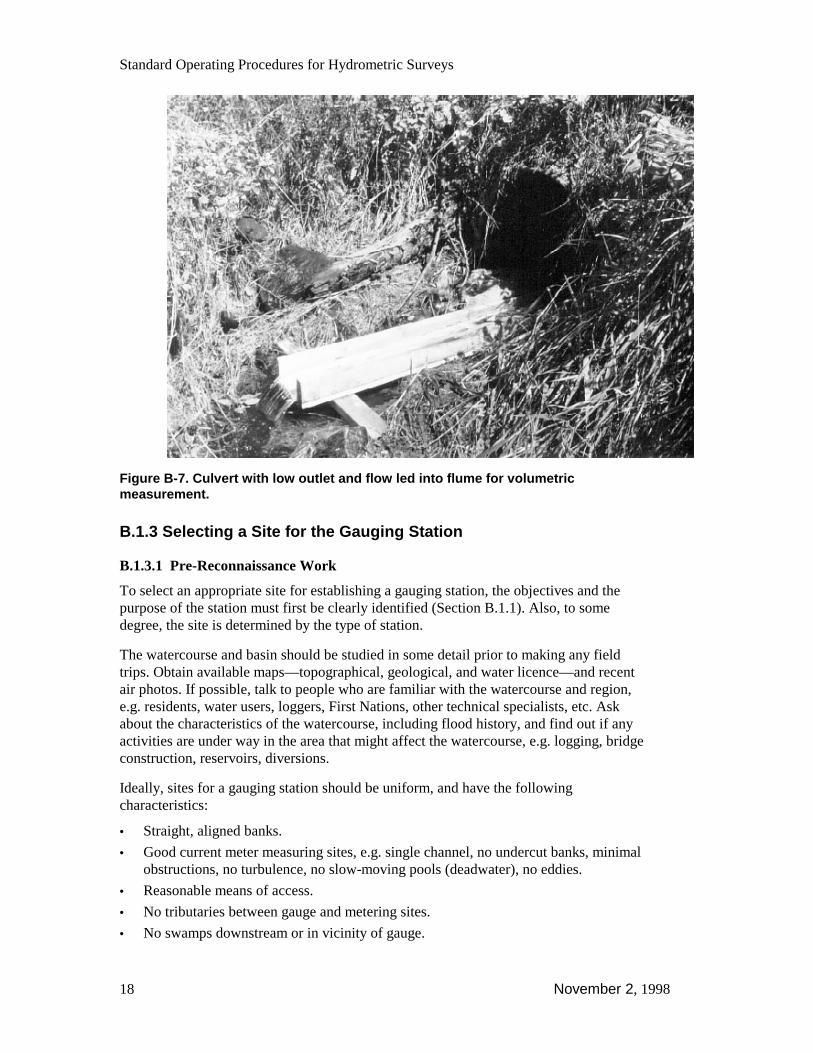
Figure B-7. Culvert with low outlet and flow led into flume for volumetric measurement.18
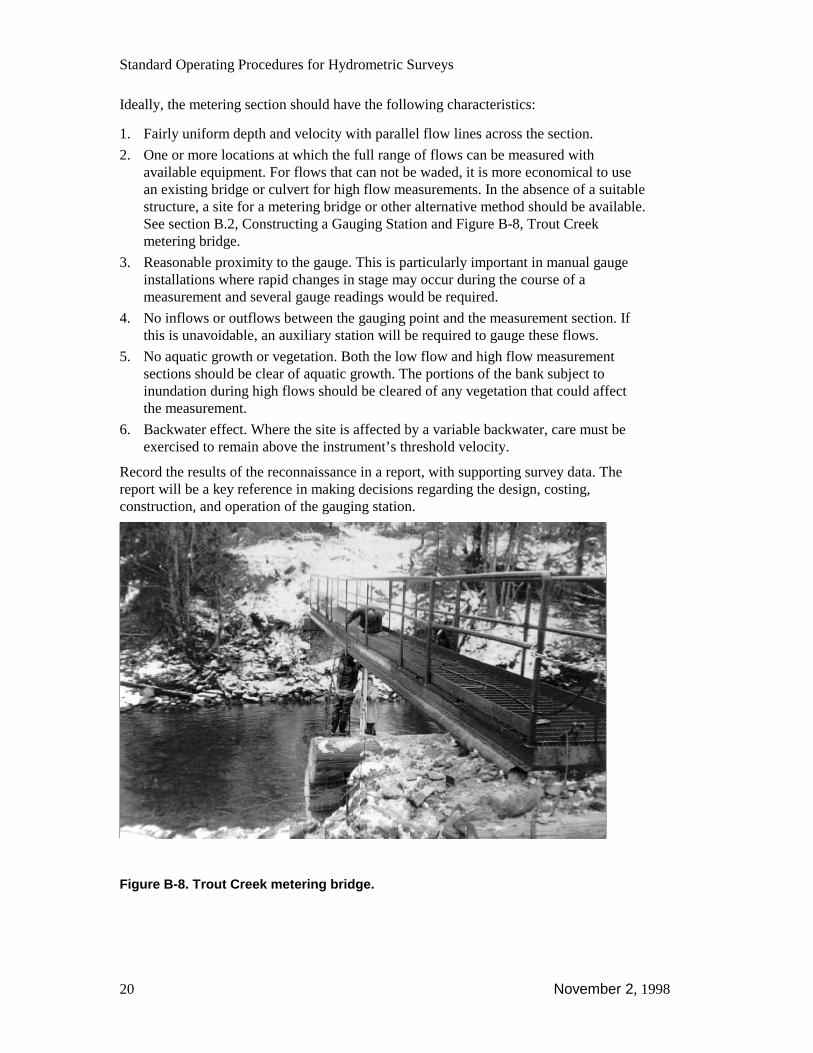
Figure B-8. Trout Creek metering bridge. ........................................................................ 20
Figure B-9. Illustration of a staff gauge............................................................................ 23
Figure B-10. Example of completed RIC Form AQU-01, Description of HydrometricStation (front)............................................................................................................ 24
Figure B-11. Example of completed RIC Form AQU-01, Description of HydrometricStation (back). ........................................................................................................... 24
Figure B-12. Each meter, or part of meter, requires colour-coded tags and numeral plates.The spacing between the tag points must be exactly 1.000 m. ................................. 26
Figure B-13. Boom wire weight gauge. ............................................................................ 26
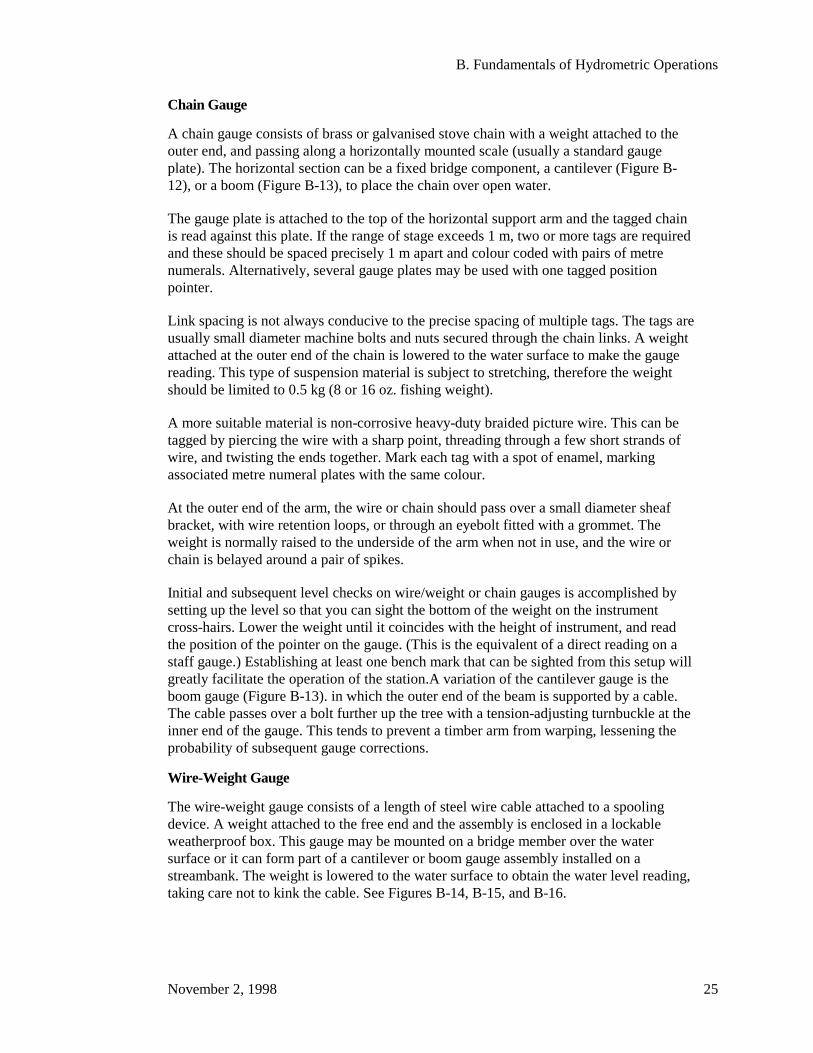
Figure B-14. Wire-weight gauge....................................................................................... 27
Figure B-15. Wire-weight gauge mounted to a bridge rail. Bear River, near Stewart. .... 27
Figure B-16. Wire-weight gauge and mounting brackets. Athabasca River, near Windfall.28
Figure B-17. Horizontally mounted wire-weight gauge. .................................................. 29
Figure B-18. Wire-weight gauge with decimetre plate..................................................... 30
Figure B-19. Non-Tagged wire-weight gauge. ................................................................. 31
Figure B-20. Inclined gauge with metal tags between the metre markers. ....................... 32
Standard Operating Procedures for Hydrometric Surveys
xvi November 2, 1998
Figure C-1. Typical menu-driven software package.........................................................40
Figure C-2. Check that the correct communication port is selected. ................................40
Figure C-3. Programming screen showing types and allocation of sensors being used. ..40
Figure C-4. Look-in shelter...............................................................................................46
Figure C-5. Walk-in shelter...............................................................................................47
Figure C-6. In-bank stilling well. ......................................................................................48
Figure C-7. Static tube for intakes. ...................................................................................49
Figure C-8. Diagram of a walk in shelter, stilling well, intakes. ......................................50
Figure C-9. Diagram of typical stilling well intakes of flushing system. .........................51
Figure C-10. Jamieson creek dry well...............................................................................52
Figure C-11. Instream stilling well, Bear River near Stewart...........................................53
Figure C-12. Instream stilling well, Whitehead Creek near Summerland. .......................54
Figure C-13. Stevens A-71 recorder with beaded float wire. ...........................................60
Figure C-14. Components of the Price 622AA current meter. .........................................63
Figure C-15. Price 622AA meter. .....................................................................................64
Figure C-16. Price 622AA meter with retro-fit kit containing magnetic reed switchcontact chamber. .......................................................................................................66
Figure C-17. Fibre optic retrofitted Price 622AA.............................................................67
Figure C-18. Price 62AA winter (ice) meter.....................................................................67
Figure C-19. Price 622AA meter. .....................................................................................69
Figure C-20. OTT C2 current meter, mounted on a 9-mm rod.........................................72
Figure C-21. OSS PC1 with adapter for use on a USGS top setting rod. .........................73
Figure C-22. Components of the OTT C2 and OSS PC1 meters......................................74
Figure C-23. OSS B1 current meter mounted on a 20-mm graduated rod. This unit mayalso be attached to a relocating device......................................................................76
Figure C-24. OTT C31 current meter fitted on a 20-mm rod, with relocating device. Notethat the locating device, at top, is aligned with a meter............................................77
Standard Operating Procedures for Hydrometric Surveys
November 2, 1998 xvii
Figure C-25. OSS B1 current meter mounted on a 30-kg sounding weight (middle), witha bottom feeler. ......................................................................................................... 78
Figure C-26. Panel layout for the CMC-200 (top) and CMC-20 (bottom) counters. ....... 84
Figure C-27. Top setting wading rod. ............................................................................... 86
Figure C-28. Relocating device. ....................................................................................... 87
Figure C-29. Handline....................................................................................................... 88
Figure C-30. Columbus weights. ...................................................................................... 89
Figure C-31. San sounding reel, made in Australia. ......................................................... 90
Figure C-32. Three-inch Montana flume set in temporary silt “dam”. ............................ 91
Figure C-33. Six-inch Montana flume set in permanent concrete sack structure............. 91
Figure C-34. Small V-notch weir plate inserted across flume entrance. .......................... 92
Figure C-35. Various throat widths for the Montana flume. ............................................ 93
Figure C-36. Portable metering bridge. ............................................................................ 95
Figure C-37. Section elevation of a standard metering bridge. ........................................ 96
Figure C-38. Abutment for a standard metering bridge.................................................... 97
Figure D-1. Example of typical vertical velocity curve.................................................. 102
Figure D-2. Ditch flow measurement using planks. ....................................................... 104
Figure D-3. Measuring by wading, with safety line angled upstream, Granite Creek nearTulameen................................................................................................................. 105
Figure D-4. Conducting a discharge measurement with tagline across the wading section,Bridge Creek below Deka Creek............................................................................. 106
Figure D-5. Mid-section method of discharge measurement.......................................... 107
Figure D-6. The technician is positioned downstream and to the side of the meter....... 109
Figure D-7. Defining the breakpoint............................................................................... 110
Figure D-8. Bridge rod in use on downstream side of bridge......................................... 110
Figure D-9. Price 622AA meter mounted on a 1-ft. hanger, with a 30-lb. Columbusweight...................................................................................................................... 111
Standard Operating Procedures for Hydrometric Surveys
xviii November 2, 1998
Figure D-10. Handline-suspended meter and Columbus weight. Just over 1 m ofsounding cable unwound from reel. Tags 0.5 m and 1.0 m above centre of meter.112
Figure D-11. Sounding reel/bridge board mounted on a boat.........................................113
Figure D-12. Three-wheeled bridge crane. .....................................................................114
Figure D-13. Measuring around piers and abutments.....................................................117
Figure D-14. Position of meter in cross section downstream of pier/pile. .....................117
Figure D-15. Handline in operation. ...............................................................................118
Figure D-16. A55 reel and bridge board mounted in boat (Nechako River). .................119
Figure D-17. Spacing of verticals when measuring around piers. ..................................122
Figure D-18. Typical stream cross-section with numbered verticals, Panel 6 ishighlighted. .............................................................................................................128
Figure D-19. Method for selection of edge verticals. .....................................................129
Figure D-20. Example of completed RIC Form AQU-06, Water Stage Recorder -StationRecord for the Year _____......................................................................................130
Figure E-1. Principles of the two-peg test.......................................................................131
Figure E-2. Positioning the rod. ......................................................................................134
Figure E-3. Reading the rod height 3.456 m, distance 29.2 m, (Source: Automatic Level,Wild NAO, Instructions for Use, Manual G2 106e - IX.80, p.9)............................135
Figure E-4. Level notes between two bench marks, Muddy River at new gauging station.136
Figure E-5a. Level notes for direct water level, Clear River at Little Bend. ..................137
Figure E-5b. Level notes for direct water level (submerged TP), Clear River at LittleBend. .......................................................................................................................125
Figure E-6a. Example 1: Level notes for staff gauge A, Clear River at Little Bend. .....139
Figure E-6b. Example 2: Level notes for staff gauge B, Clear River at Little Bend. .....139
Figure E-6c. Illustration of corrections to staff gauges. ................................................ 126
Figure E-7. Gauge corrections and how they are derived...............................................142
Figure E-8a. Example 3: Sample level notes and illustration of wire-weight gaugecorrections, Big River at Little Bend. .....................................................................143
Standard Operating Procedures for Hydrometric Surveys
November 2, 1998 xix
Figure E-8b. Example 4: Sample level notes and illustration of wire-weight gaugecorrections, Clear River at Little Bend. .................................................................. 143
Figure E-9. Wire-weight gauge corrections.................................................................... 143
Figure E-10. Example of completed RIC Form AQU-02, Gauge Level Notes in Metres144
Figure E-11. Differential leveling................................................................................... 145
Figure E-12. Level note for differential leveling. ........................................................... 146
Figure F-1. Example of a Stage-Discharge Rating Curve RIC Form AQU-08, shown halfsize. ......................................................................................................................... 153
Figure F-2. Graphical method for obtaining zero flow gauge height. ............................ 155
Figure F-3. Typical stage-discharge table as extracted from the relevant curve. ........... 156
Figure F-4. First page of typical expanded stage-discharge table. ................................. 160
Figure F-5. Flowchart for manual computation of streamflow data. .............................. 161
Figure F-6. Example of a stage-discharge loop. ............................................................. 163
Figure F-7. Example of completed RIC Form AQU-05, Summary of DischargeMeasurements.for the Year ______........................................................................ 165
Figure F-8a. Example of completed RIC Form AQU-03, Discharge Measurement (front).166
Figure F-8b. Example of completed RIC Form AQU-03, Discharge Measurement (back).152
Figure F-9. Example of completed RIC Form AQU-04, History of Gauge Level.......... 168
Figure G-1. Top - Rectangular sharp-nested weir (thin-plate weir). Bottom - Enlargedview of crest and side of rectangular sharp-crested weir........................................ 178
Figure G-2. Top - V-notch sharp-crested weir. Bottom - Enlarged view of V-notch..... 180
Figure G-3. 2.5 foot H Flume set in concrete filled sacks. Cuisson Creek above GibraltarMine. ....................................................................................................................... 183
Figure G-4. Dimensions of HL-type (top) and H-type (bottom) Flumes........................ 185
Figure G-5. 6-inch Montana Flume set in concrete sack bulkhead. Bidwell Creek aboveChilko River............................................................................................................ 185
Figure G-6. 120° stainless steel weir plate set in re-enforced concrete. Whitehead Creekbelow Whitehead Lake (Summerland District water supply)................................. 186

Standard Operating Procedures for Hydrometric Surveys
November 2, 1998 xxi
List of TablesTable A-1. Standards requirement criteria.......................................................................... 5
Table C-1. Signal types and wiring conventions. ............................................................. 42
Table C-2. Commonly used current meters. ..................................................................... 61
Table C-3. Specifications of the OTT C2 and OSS PC1 meters. ..................................... 71
Table C-4. Description of propellers for the OTT C2 and OSS PC1 meters.................... 73
Table C-5. Description of propellers for the OTT C31 and OSS B1 meters.................... 78
Table C-6. Closed circuit fault finding. ............................................................................ 80
Table C-7. Open circuit fault finding................................................................................ 80
Table C-8. Features of the CMC-20 and CMC-200 counters. .......................................... 82
Table C-9. Troubleshooting faults: CMC-20 and CMC-200 counters. ............................ 83
Table C-10. Vernier settings for top setting rod. .............................................................. 86
Table C-11. Dimensions for fabricating a Montana flume. .............................................. 92
Table C-12. Determining Stringer Size for a Clear Span. ................................................ 96
Table D-1. Columbus Weights: Suspensions and Operating Depths. ............................ 120
Table G-1. Operating limits for rated structures included in this Manual...................... 176
Table G-2. Comparison of two selected rated structures................................................ 180
A. Introduction to Provincial Standards
November 2, 1998 1
A. INTRODUCTION TO PROVINCIALSTANDARDS
A.1 Standardization of Hydrometric SurveysThis manual describes the equipment, methods and documentation that must be used tomeet the provincial standards for hydrometric surveys in accordance with the directivesof the Resources Inventory Committee (RIC). Once data are acquired, calculated andcompiled, the data must then be reviewed for certification and the ‘standards class’ or thelevel of quality achieved defined by the reviewer. A provincial hydrometric standard isrequired to affirm the credibility of data for any application, anywhere in the province.
A.1.1 The Need for Provincial Hydrometric Standards
Hydrometric standards described here are a set of information, which when followed willensure the quality and accuracy of data product in regard to measurement of water leveland discharge (streamflow). A provincial standard is needed so that governmentprograms, contractors, and partners have uniform guidelines for the collection ofhydrometric data, and to facilitate the development and maintenance of a hydrometricdata archive. This archive (or database) is to be established by the Ministry ofEnvironment, Lands and Parks (MELP).
RIC Hydrometric Standards will:
• support the collection of hydrometric inventory data to known standards usingequipment with verifiable calibration, by a variety of parties using standard methodsand record keeping
• provide for regulation of standards and data quality by review processes and audits
• support archiving of data of known quality, and use of such data for resourcemanagement
Hydrometric data collected or used for provincial resource management purposes,including Forest Renewal BC (FRBC), Forest Practices Code, water licensing, and otherswill now be required to meet RIC standards.
The Provincial Hydrometric Standards are intended to be complementary to the nationalstandards for hydrometric data collection, which have been in use for many years forEnvironment Canada programs (commonly referred to as Water Survey of Canada).These national standards are comprehensive and rigorous, and result in a high level ofaccuracy. Provincial standards are intended to cover a range of accuracies, fromequivalent to the national standard down to approximate methods, in keeping with therange of hydrometric operations done by and for provincial programs. There are fourdesignated levels of Provincial Hydrometric Standards: Class A, Class B, Class C andApproximate Methods. Class A has a sub-class defined as A/RS, for rated structures suchas weirs and flumes.

Standard Operating Procedures for Hydrometric Surveys
2 November 2, 1998
A.1.2 The Role of RIC
In recent years, there has been an increasing level of data collection under and forprovincial government programs, and by industry, project proponents, and theircontractors. These data are intended for use in resource management, but their use isoften compromised by the uncertainty as to the quality or accuracy. Also, there has beena lack of organized storage and retrieval systems for these data. In response to theseconcerns, government ministries involved in data collection connected with naturalresources have created a group called the Resources Inventory Committee (RIC). One ofthe functions of this committee is to establish standards for resource inventory datacollection and storage.
A standard in this context is defined as a document which has been established byconsensus and approved by a recognized body, that provides rules, guidelines, orcharacteristics for certain activities or their results.
A.1.3 Hydrometric Data - Approval and Storage
The Ministry of Environment, Lands and Parks intends to establish and maintain adatabase of hydrometric data that meets the RIC hydrometric standards, for use inresource management. To meet the A or B level of the RIC standard (described below)for hydrometric data, the data must be reviewed and certified as having met the RICstandards by a professional or other person who is able to establish his/her credentials tothe satisfaction of the Resources Inventory Committee. Professional Engineers (P.Eng.)and Geoscientists (P.Geo.) have the necessary background, which if supplemented byexperience qualifies them to certify data (and stamp reviewed documents) fromhydrometric surveys. The Resources Inventory Branch (MELP) will review thecredentials of data reviewers and if accepted, they will be added to a list of ‘CertifiedReviewers’.
The province intends to carry out audits of ‘approved data’ and where applicable, thequalifications (and professional standing) of individuals who have completed thecertification. In order for data to meet a RIC standard, comprehensive documentation ofstation information is required (station description, operations records, etc., as specifiedin this manual, much of which will be incorporated into the database). It is anticipatedthat the guidelines and formats presented will interface with the provincial hydrometricdatabase and will be identified as to standards level and source (including approver’sname).
A.1.4 Who Should Use the Manual
The primary users of this manual will be provincial government agencies, firms, orindividuals that collect or review and approve hydrometric data to RIC standards. Otherusers will include provincial agencies that use the data for resource management or funddata collection, other levels of government, resource user groups such as ImprovementDistricts, and educational users. In general, users of the provincial hydrometric databasewill refer to the manual to understand the accuracy of the data that falls within thedifferent standards categories.
A. Introduction to Provincial Standards
November 2, 1998 3
A.1.5 Disclaimer
The purpose of this manual is to provide information and standards for activitiesconnected with production of hydrometric data. The reader is reminded that fieldoperations for hydrometric surveys can involve some risk. All field operations should becarried out with appropriate safety measures, and in keeping with all relevant regulationsincluding Workers Compensation Board (WCB). None of the material in this annual(including text, photos, and diagrams) is intended to suggest deviation from safe fieldpractice.
Brand names of products and manufacturers are occasionally used in text andillustrations to describe various hydrometric operations. This is for the purpose ofexplanation and/or illustration only, and is not intended as a recommendation orotherwise of any brand names mentioned.
Standard Operating Procedures for Hydrometric Surveys
4 November 2, 1998
A.2 Provincial Standards
A.2.1 Introduction
The purpose of these standards is to reduce or eliminate the uncertainties associated withdata collected by non-specific methods, resulting in undefined standards and levels ofaccuracy. This will provide a basis for developing a provincial archive that store data thathave been collected to defined standards with essential and verifiable documentation.
By definition, the ‘Standard Operating Procedures’ (SOP) or standards, are theestablished written procedures of a given organization (see the Glossary of Terms Usedin Aquatic Inventory (Draft)). Water Survey of Canada (Environment Canada) has beenthe primary operator of hydrometric stations in British Columbia since the early part ofthe 20th century. Water Survey of Canada has operated under a system of nationalstandards for hydrometric surveys. To a large extent, the hydrometric procedures coveredin the provincial standards are an operational subset of the national standard. Operationalsubset means that the provincial standards do not cover all types of operations includedin the national standards, such as ice conditions. At this time, it is recommended thatwork beyond the scope of the provincial standard be referred to Environment Canada(Water Survey of Canada), or some other group with appropriate expertise. Anotherimportant feature of the provincial RIC Standard for hydrometric surveys is thedefinition of several levels of accuracy, as explained below.
A.2.2 RIC / Provincial Standards
The following table defines the various standard levels and the anticipated tests neededto confirm any data set. This will not be a simple procedure, but through the preliminaryperiod of field trials, such tests will become more obvious as data certifiers become moreproficient.
A.2.2.1 Class A
This standard is the highest level of data quality in the hierarchy of provincial standards,as shown in Table A-1. The accuracy of data in the Class A standard is similar to that inthe national standards. The procedures described in this manual are oriented to the ClassA standard level. Class A/RS is a sub-class of A, and is a method of data collectionwhich can result in a very high level of accuracy and reliability. Class A/RS is discussedin more detail below.
A.2.2.2 Class B
The Class B provincial standard allows for lower accuracy than Class A. The operationaltechniques are essentially the same, but allowance is made for more difficult operatingconditions, or a less rigorous standard by definition. Class B might be achieved if thehighest classification is not attainable because of the circumstances encountered in thefield.
A. Introduction to Provincial Standards
November 2, 1998 5
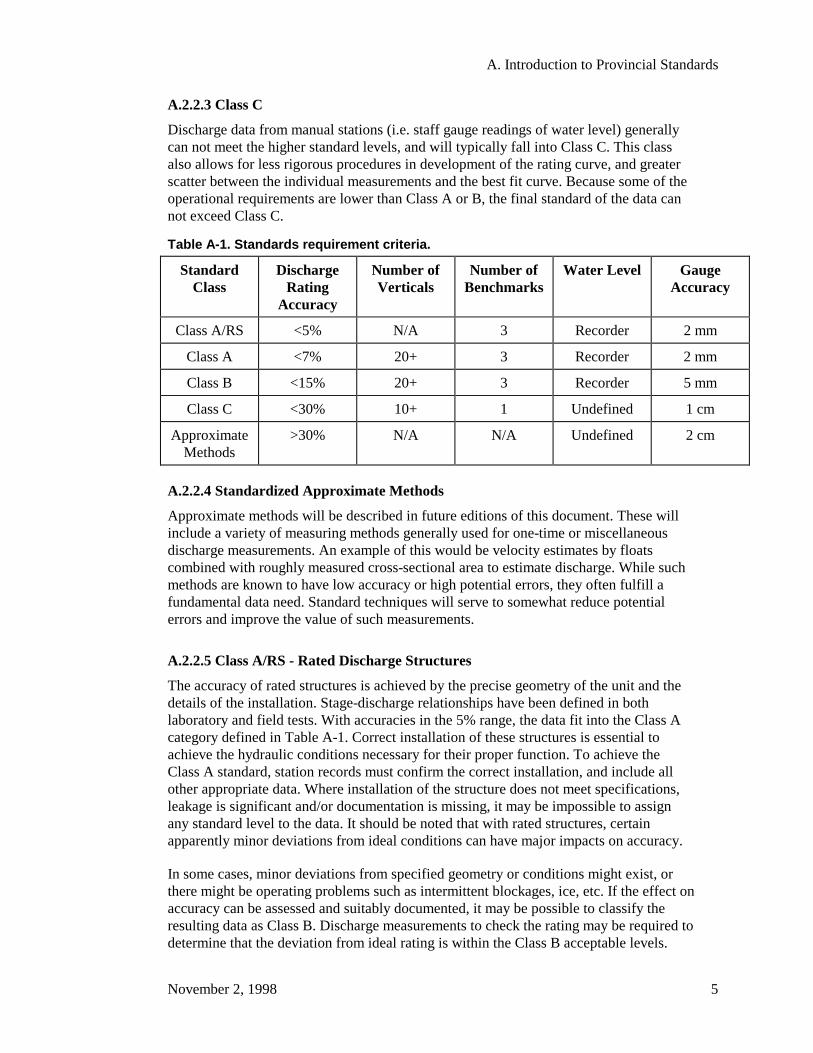
A.2.2.3 Class C
Discharge data from manual stations (i.e. staff gauge readings of water level) generallycan not meet the higher standard levels, and will typically fall into Class C. This classalso allows for less rigorous procedures in development of the rating curve, and greaterscatter between the individual measurements and the best fit curve. Because some of theoperational requirements are lower than Class A or B, the final standard of the data cannot exceed Class C.
Table A-1. Standards requirement criteria.
StandardClass
DischargeRating
Accuracy
Number ofVerticals
Number ofBenchmarks
Water Level GaugeAccuracy
Class A/RS <5% N/A 3 Recorder 2 mm
Class A <7% 20+ 3 Recorder 2 mm
Class B <15% 20+ 3 Recorder 5 mm
Class C <30% 10+ 1 Undefined 1 cm
ApproximateMethods
>30% N/A N/A Undefined 2 cm
A.2.2.4 Standardized Approximate Methods
Approximate methods will be described in future editions of this document. These willinclude a variety of measuring methods generally used for one-time or miscellaneousdischarge measurements. An example of this would be velocity estimates by floatscombined with roughly measured cross-sectional area to estimate discharge. While suchmethods are known to have low accuracy or high potential errors, they often fulfill afundamental data need. Standard techniques will serve to somewhat reduce potentialerrors and improve the value of such measurements.
A.2.2.5 Class A/RS - Rated Discharge Structures
The accuracy of rated structures is achieved by the precise geometry of the unit and thedetails of the installation. Stage-discharge relationships have been defined in bothlaboratory and field tests. With accuracies in the 5% range, the data fit into the Class Acategory defined in Table A-1. Correct installation of these structures is essential toachieve the hydraulic conditions necessary for their proper function. To achieve theClass A standard, station records must confirm the correct installation, and include allother appropriate data. Where installation of the structure does not meet specifications,leakage is significant and/or documentation is missing, it may be impossible to assignany standard level to the data. It should be noted that with rated structures, certainapparently minor deviations from ideal conditions can have major impacts on accuracy.
In some cases, minor deviations from specified geometry or conditions might exist, orthere might be operating problems such as intermittent blockages, ice, etc. If the effect onaccuracy can be assessed and suitably documented, it may be possible to classify theresulting data as Class B. Discharge measurements to check the rating may be required todetermine that the deviation from ideal rating is within the Class B acceptable levels.
Standard Operating Procedures for Hydrometric Surveys
6 November 2, 1998
Stations with rated structures will be designated with the code RS added to the standardclass, e.g., Class A/RS (Table A-1).
In some cases, rated structures can not be installed or maintained to the requiredhydraulic conditions to achieve the specified rating. An example of this would be a weirwhere the pond fills up with sediment. In these cases, the structure is essentially animproved streambed control, and the station should be rated with dischargemeasurements.
A.3 Data Certification and Audit
A.3.1 Review and Approval
Hydrometric standards are for the purpose of acquiring data of known quality, and areachieved by following certain set procedures, including detailed documentation. It isnecessary to undertake an independent review and approval process to confirm stationoperating information and final data. Using this process to define a standard is a commonfeature of a quality controlled system of hydrometric data collection.
The British Columbia hydrometric standards system recognizes that stations will beoperated by a large variety of agencies, firms, or individuals. To maintain overall quality,data from all sources must be reviewed, approved and an appropriate standard levelassigned by a qualified reviewer with a high level of skills and experience.
In future, it is intended to establish a system to test and certify RIC standard hydrometricreviewers. In the interim, Approved Reviewers will be designated on the basis of areview of qualifications (training and experience), to be undertaken by the ResourcesInventory Branch of MELP. There is no firm requirement for any particular professionalstatus, but the essential skills (shown below) will tend to favour some individuals withP.Eng./P.Geo. registration. Where professional registration exists, the stamp/seal of thelicensing body will be required as part of data review and approval, and this will invokethe professional responsibility according to the Acts and Codes of Ethics governing suchassociations. The stamp will be required for data to be considered to have achieved anyof the standards, and this will invoke the professional responsibility according to theActs and Codes of Ethics governing such associations.
To be certain that reviewers are fully qualified, university level training in the followingsubject areas is required:
• open channel hydraulics• surveying• statistics and mathematics• hydrology• fluvial geomorphology - sediment, streambed dynamics• applied mechanics (desirable)• electrical/electronics (desirable)
Work experience in hydrometric operations and quality review will also be relevant.
A. Introduction to Provincial Standards
November 2, 1998 7
Many or all of the above fields of knowledge come into play in an integrated manner inthe operations review of any given hydrometric station. While field operations may beand frequently are carried out by skilled technicians or other disciplines, the above skillset applied at a professional level is required to certify that a given standard level hasindeed been achieved.
A.3.2 Data Audits
It is recognized that the British Columbia government will not have the resources toreview and approve data or assign RIC standards level for all hydrometric data that isproduced. Initially, data may be reviewed and approved by qualified professionalsrepresenting consultants, contractors, government staff, employees of corporations, etc. Itis good practice to have the review/approval done by a person who was not personallyinvolved in the operation of the station. It is expected that the government willundertake and/or fund audits of approved hydrometric data. Professionals who haveimproperly approved data may be referred to the licensing body, just as anyP.Eng./P.Geo. might be for professional malpractice.
B. Fundamentals of Hydrometric Operations
November 2, 1998 9
B. Fundamentals of HydrometricOperations
B.1 Establishing a Gauging Station
B.1.1 Choosing a Station Type
B.1.1.1 Definition of a Hydrometric Gauging Station
An hydrometric gauging station is a natural or constructed location on a watercoursewhere records of water quantity (and sometimes quality) are systematically obtained. It isreferred to as a gauging station, but is also called an hydrometric station.
B.1.1.2 Purpose of the Station
The purpose of any water quantity (or water quality) data collection program must beclearly defined before site selection is considered. In addition, the benefits of archiveddata to other agencies or individuals should be considered, particularly when publicmoneys form any part of the funding for establishing and/or operating the station(s).
Some typical reasons for establishing a gauging station include:
• Runoff volume data for storage or water licensing. Peak flow timing and quantityfor spillway, culvert, bridge design.
• Determining peak flow - time and quantity. Low flow timing and quantity forfish, water supply.
• Lake or reservoir level for recreation, storage, flooding, septic tanks.• Determining low flow - periods and quantity.• Baseline information for water quality.• Causal relationships between watershed changes and flow regime changes.
B.1.2 Types of Gauging Stations
B.1.2.1 General
This manual focuses on measuring the smaller streams — from 0 to 10 m3/s (+/-) —without reference to peaks. Gauging stations and methods for measuring greater flowsare referred to, but not detailed.
The station variables considered in this manual are:
• Type of Operation• Annual - operates January to December.• Seasonal - selected period to satisfy the data purpose (open water, or low flow).• Miscellaneous - e.g., individual, periodic flow measurement.
Standard Operating Procedures for Hydrometric Surveys
10 November 2, 1998
• Type of Gauge• Manual - Read periodically (e.g., daily, weekly) by a technician.• Recording - Continuous record of water level either as an analogue or digital
record.
• Type of Station• Water level only - Lake or stream where discharge is of no concern.• Water level and discharge - Miscellaneous discharge at a specified location,
recorded by date and time, may be used to assess the potential of a stream ifreferenced to an active hydrometric station on an adjacent/nearby watershed.
• Other parameters - Sediment or other water quality characteristics may affect theconfiguration of the station.
• Special Equipment Requirements• Type of housing required - governed by number and type of sensors, and
equipment.• Real time equipment and sensors - will govern positioning of signal relays.• Automatic sediment and water quality samplers - will determine degree of
automation, i.e. multi-channel data loggers.
• Datum• Assumed (local) - placed at the zero of the gauge, which should be below low
water for lakes or below zero flow for streams (such as for rated structures).• GSC Datum - where feasible, can be related to the GSC datum.
Desirable Criteria for a Basic Station
A well-planned, well-constructed gauging station meets the following criteria:
1. It is possible to get an accurate water level reading from the gauge at all stages.
2. The control, whether natural or artificial, is stable.
a) A stable natural control may be a:
• bedrock outcrop, or other stable riffle (shoal) for measuring during low flow• channel constriction for measuring at high flow• falls or cascade that is not submerged at any water level
b) A stable artificial control may be a:
• rated structure (flume, weir, etc.)• fish barrier (drop structure)• streambed sill (log, concrete, etc.)
3. Discharge can be measured accurately at all stages, either through a ratedmeasurement structure or by means of a current meter.
4. The site is accessible during the operational season.
5. The station is structurally sound, e.g., can withstand being overtopped.
B.1.2.3 Comparison of Small Gauging Station Installations
Several types of gauging stations are suitable for use on small-to-medium watercourses.Each has advantages/disadvantages in terms of accuracy/efficiency, installation cost, andoperational cost.
B. Fundamentals of Hydrometric Operations
November 2, 1998 11
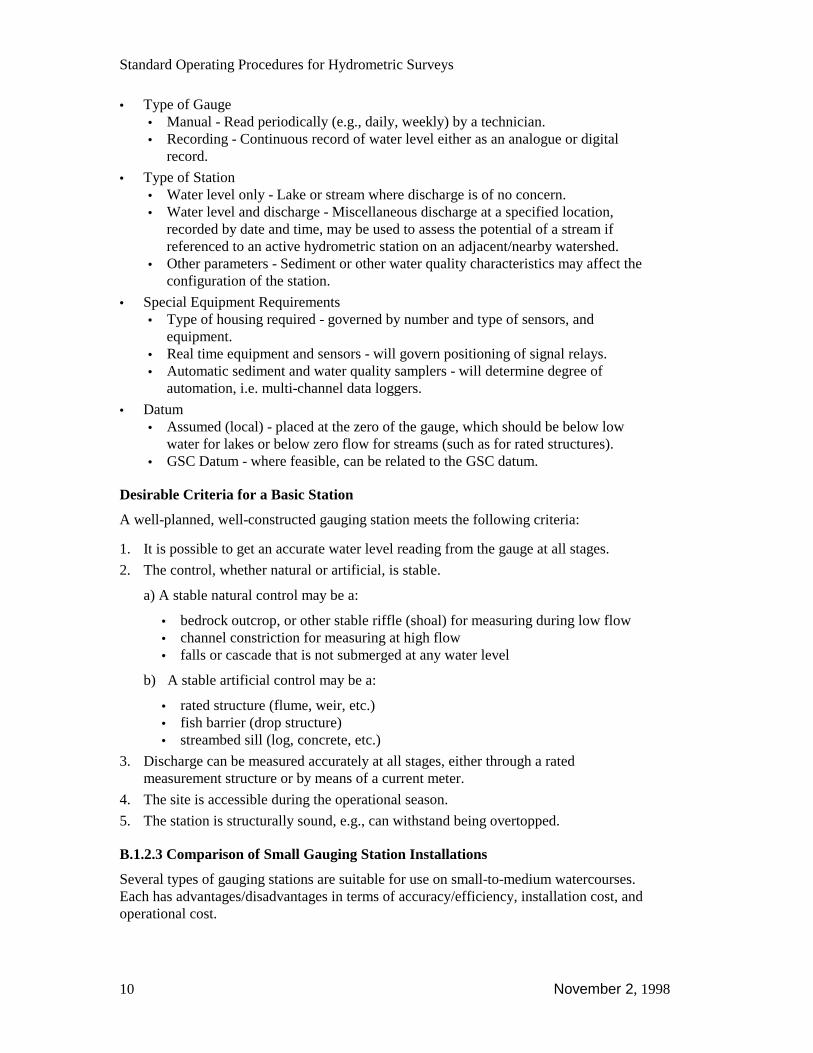
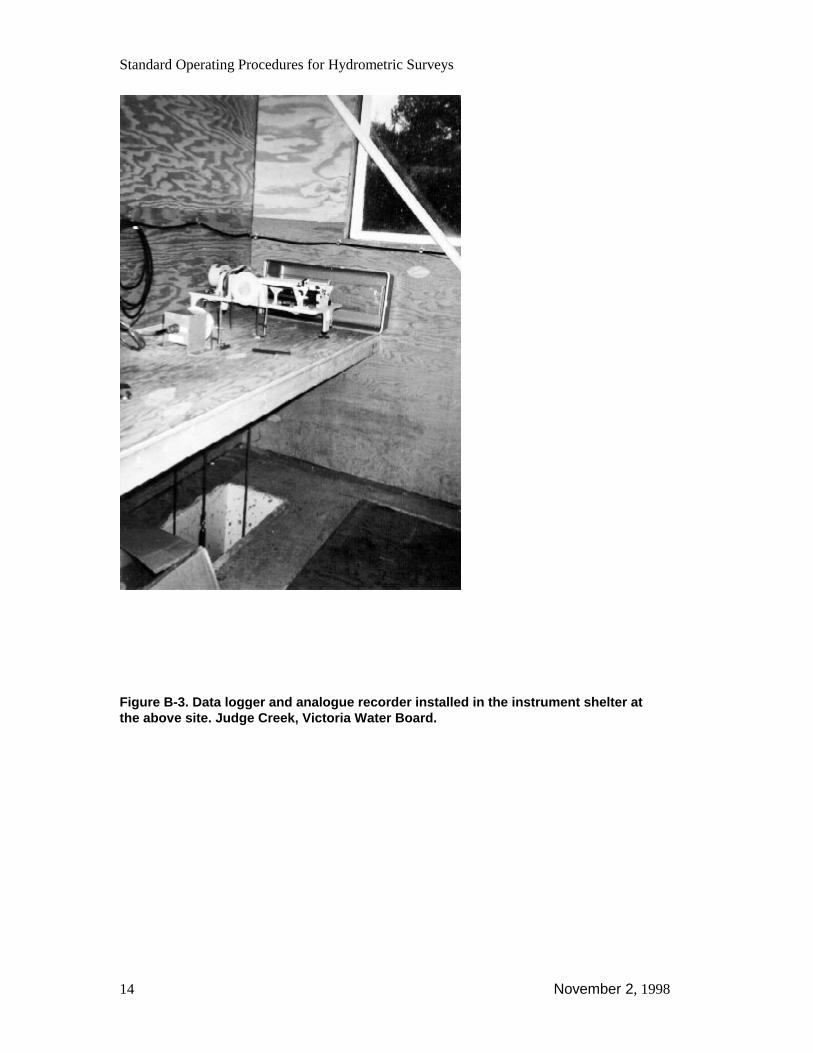
• Discharge measurement structure fitted with a digital water level data logger.
This is the most efficient type of gauging station, as it has the potential to bemulti-use. As well as recording water levels, a multi-channel data logger canrecord values from water and climate data quality sensors as well as water levelsfrom other nearby installations. Several other applications are possible. Dataloggers and sensor capabilities are described in detail in Section C, HydrometricEquipment.
Note: Rated structures built and installed to tested standards require no furtherrating. Designs for nonstandard or modified structures must be accompanied bya theoretical stage/discharge curve, and then confirmed by taking a series ofcurrent meter discharge measurements. See Section G, Discharge MeasurementStructures.
• Discharge measurement structure equipped with an analogue continuous automaticwater level recorder.
The processing of data from analogue recorders requires extraction of hourlywater levels by means of a digitizer and appropriate software, or by tediousmanual methods. Standard analogue recorders are limited to a single parameterand cost more to purchase, house, and maintain than a data logger.
• A continuous water level recording device set in a pool where the water level issensitive and stable over the full range of stage.
The control for this type of installation can be a natural or an existing artificialstructure. Either could be modified to bring about the required hydrauliccharacteristics. If necessary, design and construct an artificial control — seeSection B.2. This type of station must be rated by a series of current metermeasurements over the full range of stage, confirmed by a further two or moremeasurements per year in subsequent years. See Figures B-1, B-2, and B-3.
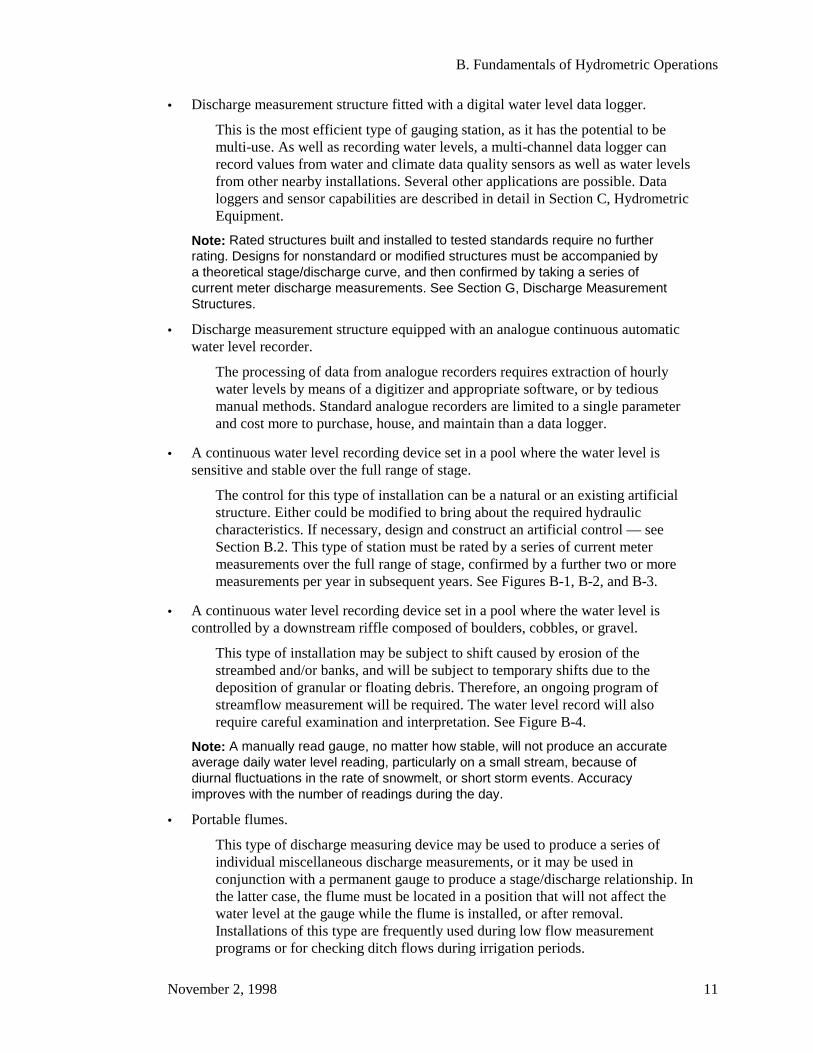
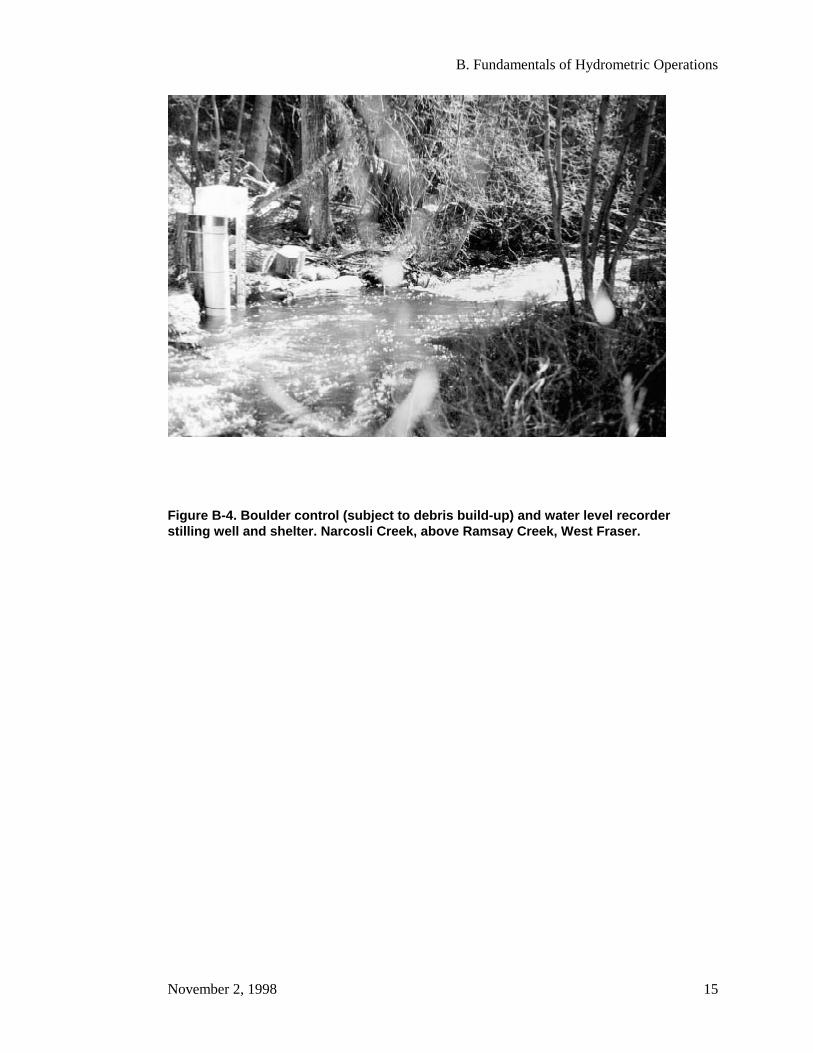
• A continuous water level recording device set in a pool where the water level iscontrolled by a downstream riffle composed of boulders, cobbles, or gravel.
This type of installation may be subject to shift caused by erosion of thestreambed and/or banks, and will be subject to temporary shifts due to thedeposition of granular or floating debris. Therefore, an ongoing program ofstreamflow measurement will be required. The water level record will alsorequire careful examination and interpretation. See Figure B-4.
Note: A manually read gauge, no matter how stable, will not produce an accurateaverage daily water level reading, particularly on a small stream, because ofdiurnal fluctuations in the rate of snowmelt, or short storm events. Accuracyimproves with the number of readings during the day.
• Portable flumes.
This type of discharge measuring device may be used to produce a series ofindividual miscellaneous discharge measurements, or it may be used inconjunction with a permanent gauge to produce a stage/discharge relationship. Inthe latter case, the flume must be located in a position that will not affect thewater level at the gauge while the flume is installed, or after removal.Installations of this type are frequently used during low flow measurementprograms or for checking ditch flows during irrigation periods.

Standard Operating Procedures for Hydrometric Surveys
12 November 2, 1998
Because of the requirements for flume operation, these devices are favoured overportable weir installations. This is important in a low gradient stream (Figure B-5).
Figure B-1. Two water level recorders: a data logger and an analogue recorder.

B. Fundamentals of Hydrometric Operations
November 2, 1998 13
Figure B-2. Pool formed by a modified Crump Weir, where both a digital and ananalogue recorder are installed. Judge Creek, Victoria Water Board. The crest hasbeen formed with a shallow vee to increase low flow sensitivity.
Standard Operating Procedures for Hydrometric Surveys
14 November 2, 1998
Figure B-3. Data logger and analogue recorder installed in the instrument shelter atthe above site. Judge Creek, Victoria Water Board.
B. Fundamentals of Hydrometric Operations
November 2, 1998 15
Figure B-4. Boulder control (subject to debris build-up) and water level recorderstilling well and shelter. Narcosli Creek, above Ramsay Creek, West Fraser.
Standard Operating Procedures for Hydrometric Surveys
16 November 2, 1998
Figure B-5. Three-inch Montana flume set in a mud dam.
• Portable weir plates.
Sharp-crested weir plates may be installed in locations where the upstreamchannel banks are high enough and wide enough to contain the elevated waterlevels and provide the end contractions necessary for fully contracted weiroperation. Downstream channel geometry should provide free-flow conditionsthroughout the range of stage to be measured. Static head (h) is measured at adistance equal to 3.5 h (max. h), upstream of the weir crest (Figure B-6). Forexample, if the water level in the weirpool can reach 0.6 m above crest, thegauge should be situated 2.1 m upstream of weir.
• Elevated pipes, culverts, and flumes.
Volumetric measurements may be made at the outlets of elevated pipes, culverts,and flumes. Individual measurements may be related to stage either by a staffgauge reading or by measuring the water level above or below a fixed referencepoint. Where outlets are too close to the downstream bed, it is sometimespossible to temporarily divert the flow through a flume (Figure B-7).
• High water conditions.
In locations where higher stage discharge measurement may not be possible dueto the unavailability of suitable measuring facilities or equipment, the channelreaches lying within the designated station limits should be reconnoitered to find
B. Fundamentals of Hydrometric Operations
November 2, 1998 17
a suitable site for measurements using indirect methods. Selected sites should besurveyed, permanently marked and the required values recorded. One of the mostcommonly used methods of indirect measurement is the slope area method.Other, less well known methods are described in U.S. Geological Survey(USGS) Publication Measurement of Peak Discharge by the Slope-Area Method(see Chapter A2 of Book 3).
Figure B-6. V-notch weir, portable installation.
Standard Operating Procedures for Hydrometric Surveys
18 November 2, 1998
Figure B-7. Culvert with low outlet and flow led into flume for volumetricmeasurement.
B.1.3 Selecting a Site for the Gauging Station
B.1.3.1 Pre-Reconnaissance Work
To select an appropriate site for establishing a gauging station, the objectives and thepurpose of the station must first be clearly identified (Section B.1.1). Also, to somedegree, the site is determined by the type of station.
The watercourse and basin should be studied in some detail prior to making any fieldtrips. Obtain available maps—topographical, geological, and water licence—and recentair photos. If possible, talk to people who are familiar with the watercourse and region,e.g. residents, water users, loggers, First Nations, other technical specialists, etc. Askabout the characteristics of the watercourse, including flood history, and find out if anyactivities are under way in the area that might affect the watercourse, e.g. logging, bridgeconstruction, reservoirs, diversions.
Ideally, sites for a gauging station should be uniform, and have the followingcharacteristics:
• Straight, aligned banks.
• Good current meter measuring sites, e.g. single channel, no undercut banks, minimalobstructions, no turbulence, no slow-moving pools (deadwater), no eddies.
• Reasonable means of access.
• No tributaries between gauge and metering sites.
• No swamps downstream or in vicinity of gauge.

B. Fundamentals of Hydrometric Operations
November 2, 1998 19
Study the maps and air photos. Look for the characteristics of a suitable site, realizingthat no site will be perfect. Select two or three potential locations and prioritize them.
Prepare a plan to reconnoitre the site identified as having the most potential, but beprepared to move on to other potential sites if the first one does not work out.
Before setting out on a field trip, be sure to check if written or verbal permission isneeded from the land owner or manager to access the property.
B.1.3.2 Field Reconnaissance and Site Selections
To complete the selection of a site for the gauging station, take a field trip to thepotential site. The field trip is an opportunity to make a detailed evaluation of the site interms of the objectives and the characteristics listed above (Section B.1.2.2).
Reconnaissance should include careful observation of the following:
• Low Flow Conditions.
Look for a stable well-defined low water control. A raised culvert invert at a roadcrossing can be an ideal site for a gauging station, particularly in areas with flatgradients.
If a stable control is not available, consider the feasibility of building an artificiallow water control. Investigate the options, and gather and record preliminary surveydata.
If a site with a movable streambed must be accepted, i.e. one with a mobile granularchannel, it is best to locate the gauge in as uniform a reach as possible, avoiding anychannel obstruction that may intensify scour and fill.
Where the watercourse emerges from an area of steeper gradients onto an alluvialfan, the reconnaissance must include streamflow measurements to determine wherethe seepage of water into the alluvium becomes significant. The station should belocated upstream of the area of water seepage if the maximum yield of thewatercourse is required.
• High Flow Conditions.
To determine the magnitude of maximum discharge, look for evidence of pastflooding, e.g. trash lines. Consider how easy it would be to access the gauge at allstages, and if it will be possible to position the recorder stilling well so as to avoiddamage from high water levels or velocities and floating debris.
• Flow Measurement Conditions.
Ensure that the site has a suitable location for measuring discharge, either with acurrent meter or by other means. Although the station will be designed toaccommodate discharge measurement, it is usually best to make observations thatwill cover all the options for obtaining a stage discharge record. Make enoughobservations, including making photographs, to prepare reasonable alternativeconceptual designs and cost estimates.
Standard Operating Procedures for Hydrometric Surveys
20 November 2, 1998
Ideally, the metering section should have the following characteristics:
1. Fairly uniform depth and velocity with parallel flow lines across the section.
2. One or more locations at which the full range of flows can be measured withavailable equipment. For flows that can not be waded, it is more economical to usean existing bridge or culvert for high flow measurements. In the absence of a suitablestructure, a site for a metering bridge or other alternative method should be available.See section B.2, Constructing a Gauging Station and Figure B-8, Trout Creekmetering bridge.
3. Reasonable proximity to the gauge. This is particularly important in manual gaugeinstallations where rapid changes in stage may occur during the course of ameasurement and several gauge readings would be required.
4. No inflows or outflows between the gauging point and the measurement section. Ifthis is unavoidable, an auxiliary station will be required to gauge these flows.
5. No aquatic growth or vegetation. Both the low flow and high flow measurementsections should be clear of aquatic growth. The portions of the bank subject toinundation during high flows should be cleared of any vegetation that could affectthe measurement.
6. Backwater effect. Where the site is affected by a variable backwater, care must beexercised to remain above the instrument’s threshold velocity.
Record the results of the reconnaissance in a report, with supporting survey data. Thereport will be a key reference in making decisions regarding the design, costing,construction, and operation of the gauging station.
Figure B-8. Trout Creek metering bridge.
B. Fundamentals of Hydrometric Operations
November 2, 1998 21
B.2 Constructing a Gauging Station
B.2.1 Design Costing
The reconnaissance report and survey data should provide the information necessary forpreparing preliminary conceptual designs and costs.
The factors to consider when producing a cost estimate are:
• Planned period of record.
• Requirements for artificial control in the absence of channel stability.
• Discharge measurement structure vs. ongoing metering in an unstable channel.
• The cost of transporting personnel, equipment, and materials to the construction site.
• The availability of suitable native material at or near the site.
• Construction methods.
• Selected instrumentation.
• Scheduling constraints based on flow magnitude and fishery regulations for in-stream construction.
• Future operational resources.
B.2.2 Permissions1. Be sure to obtain written permission from the land owner or manager before you
enter private land to carry out any proposed construction work. The scope of thepermission should include access for construction as well as for the futureoperational period.
2. Any individual or agency carrying out any type of construction in any watercourse inBritish Columbia must obtain approval from the Regional Water Manager, MELP. Inmost cases this means completing Notification for Proposed Works and Changes Inand About a Stream (Appendix IV). The approval process includes a review by theMinistry of Fisheries, who will, in most cases, limit the periods during whichconstruction may take place. The Ministry of Fisheries will consult with the FederalDepartment of Fisheries and Oceans where federal regulations are involved.
B.2.3 Reference Gauge Installation
All gauging stations require some form of water level reference gauge in addition to anywater level recording device that may also be installed. The chart pen or sensor voltagereading must be referenced to this gauge which in turn is referenced to station datumwith bench marks.
The choice of gauge mount will depend on the type of forces that may be exerted at thegauging position during periods of high flow, ice movement, or by human or animalactivities in the general area (e.g. lakes or reservoirs with flat bank form, providingaccess for recreational use, and subject to drawdown and wind-driven ice movementduring break-up).
Standard Operating Procedures for Hydrometric Surveys
22 November 2, 1998
B.2.3.1 Standard Vertical Staff Gauge
The most commonly used manual or non-recording gauge is the vertical staff gauge(Figure B-9). It consists of one or more 1-m sections of enameled steel plate accuratelygraduated to either 0.01 or 0.002 of a meter. Each decimetre is numbered andintermediate 5-cm graduation marks are wedge shaped. The 0.01-m graduated type ofplate is preferred for its less cluttered appearance; the third decimal value is estimated byreading the bottom of the meniscus.
Install staff gauges so that they are protected from damage by moving ice or otherfloating debris and are not affected by local drawdown or pileup of water. Reduce smalllocal effects by mounting the gauge so that the face is parallel to the current; attach alength of half roundwood moulding to streamline the upstream edge of the backing board(2”x 6”). When the gauge is to be used as a reference for a recording device, position thegauge as close as practicable to the stilling well intake. In most cases it is necessary, andeven preferable, to install the gauge near the bank below low water.
Slotted mounting holes for gauge plates allow for limited vertical adjustment of the plateduring the initial installation, or to eliminate minor gauge corrections identified atsubsequent gauge level checks. The gauge plates are fastened to 0.15-m-wide backingboard. In most small watercourses, the most convenient method of installation is tofasten the gauge plate(s), and metre numeral plates, to the backing which is then securedto a convenient vertical face such as a bridge abutment, pier, or piling. In some instances,shimming may be required to achieve a vertical installation. Attachments on concrete orsteel structures require concrete fastening tools, anchors, or plumber’s strapping. If nosuitable anchorage is available, a steel angle iron driven into the streambed is acceptable.
B. Fundamentals of Hydrometric Operations
November 2, 1998 23
Figure B-9. Illustration of a staff gauge.
B.2.3.2 Non-Standard Reference Gauges
In some locations a standard staff gauge may be subject to damage or destruction due toice or debris. Or, if a staff gauge is exposed to high velocities it may be difficult orimpossible to make an accurate reading. In these cases, another form of reference gaugeshould be installed. The following types may be installed as either the reference gauge oras the primary gauge.
Reference Mark
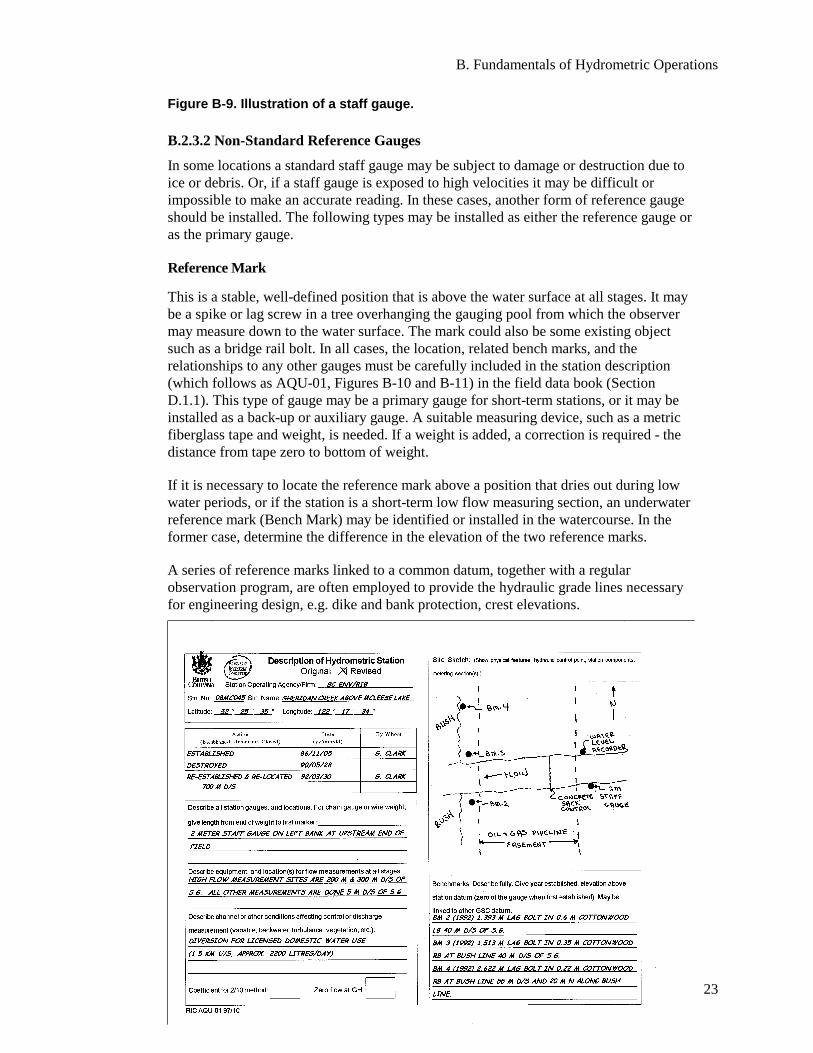
This is a stable, well-defined position that is above the water surface at all stages. It maybe a spike or lag screw in a tree overhanging the gauging pool from which the observermay measure down to the water surface. The mark could also be some existing objectsuch as a bridge rail bolt. In all cases, the location, related bench marks, and therelationships to any other gauges must be carefully included in the station description(which follows as AQU-01, Figures B-10 and B-11) in the field data book (SectionD.1.1). This type of gauge may be a primary gauge for short-term stations, or it may beinstalled as a back-up or auxiliary gauge. A suitable measuring device, such as a metricfiberglass tape and weight, is needed. If a weight is added, a correction is required - thedistance from tape zero to bottom of weight.
If it is necessary to locate the reference mark above a position that dries out during lowwater periods, or if the station is a short-term low flow measuring section, an underwaterreference mark (Bench Mark) may be identified or installed in the watercourse. In theformer case, determine the difference in the elevation of the two reference marks.
A series of reference marks linked to a common datum, together with a regularobservation program, are often employed to provide the hydraulic grade lines necessaryfor engineering design, e.g. dike and bank protection, crest elevations.
Standard Operating Procedures for Hydrometric Surveys
24 November 2, 1998
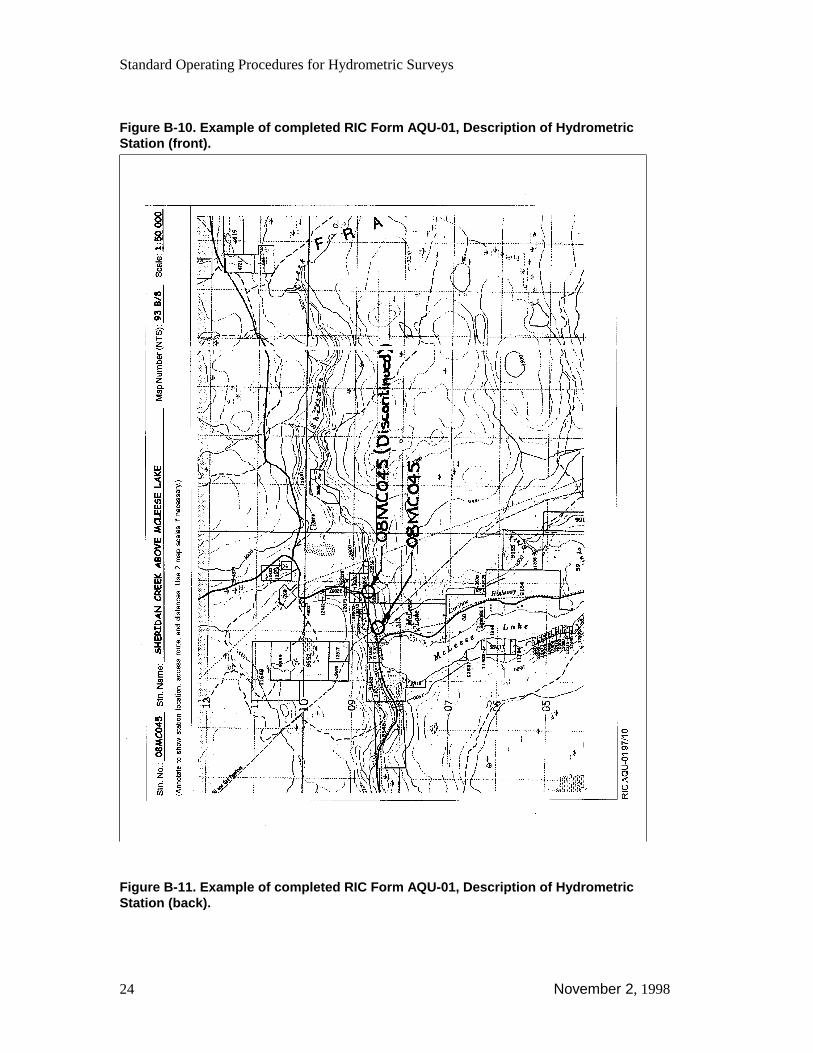
Figure B-10. Example of completed RIC Form AQU-01, Description of HydrometricStation (front).
Figure B-11. Example of completed RIC Form AQU-01, Description of HydrometricStation (back).
B. Fundamentals of Hydrometric Operations
November 2, 1998 25
Chain Gauge
A chain gauge consists of brass or galvanised stove chain with a weight attached to theouter end, and passing along a horizontally mounted scale (usually a standard gaugeplate). The horizontal section can be a fixed bridge component, a cantilever (Figure B-12), or a boom (Figure B-13), to place the chain over open water.
The gauge plate is attached to the top of the horizontal support arm and the tagged chainis read against this plate. If the range of stage exceeds 1 m, two or more tags are requiredand these should be spaced precisely 1 m apart and colour coded with pairs of metrenumerals. Alternatively, several gauge plates may be used with one tagged positionpointer.
Link spacing is not always conducive to the precise spacing of multiple tags. The tags areusually small diameter machine bolts and nuts secured through the chain links. A weightattached at the outer end of the chain is lowered to the water surface to make the gaugereading. This type of suspension material is subject to stretching, therefore the weightshould be limited to 0.5 kg (8 or 16 oz. fishing weight).
A more suitable material is non-corrosive heavy-duty braided picture wire. This can betagged by piercing the wire with a sharp point, threading through a few short strands ofwire, and twisting the ends together. Mark each tag with a spot of enamel, markingassociated metre numeral plates with the same colour.
At the outer end of the arm, the wire or chain should pass over a small diameter sheafbracket, with wire retention loops, or through an eyebolt fitted with a grommet. Theweight is normally raised to the underside of the arm when not in use, and the wire orchain is belayed around a pair of spikes.
Initial and subsequent level checks on wire/weight or chain gauges is accomplished bysetting up the level so that you can sight the bottom of the weight on the instrumentcross-hairs. Lower the weight until it coincides with the height of instrument, and readthe position of the pointer on the gauge. (This is the equivalent of a direct reading on astaff gauge.) Establishing at least one bench mark that can be sighted from this setup willgreatly facilitate the operation of the station.A variation of the cantilever gauge is theboom gauge (Figure B-13). in which the outer end of the beam is supported by a cable.The cable passes over a bolt further up the tree with a tension-adjusting turnbuckle at theinner end of the gauge. This tends to prevent a timber arm from warping, lessening theprobability of subsequent gauge corrections.
Wire-Weight Gauge
The wire-weight gauge consists of a length of steel wire cable attached to a spoolingdevice. A weight attached to the free end and the assembly is enclosed in a lockableweatherproof box. This gauge may be mounted on a bridge member over the watersurface or it can form part of a cantilever or boom gauge assembly installed on astreambank. The weight is lowered to the water surface to obtain the water level reading,taking care not to kink the cable. See Figures B-14, B-15, and B-16.

Standard Operating Procedures for Hydrometric Surveys
26 November 2, 1998
Figure B-12. Each meter, or part of meter, requires colour-coded tags and numeralplates. The spacing between the tag points must be exactly 1.000 m.
Figure B-13. Boom wire weight gauge.
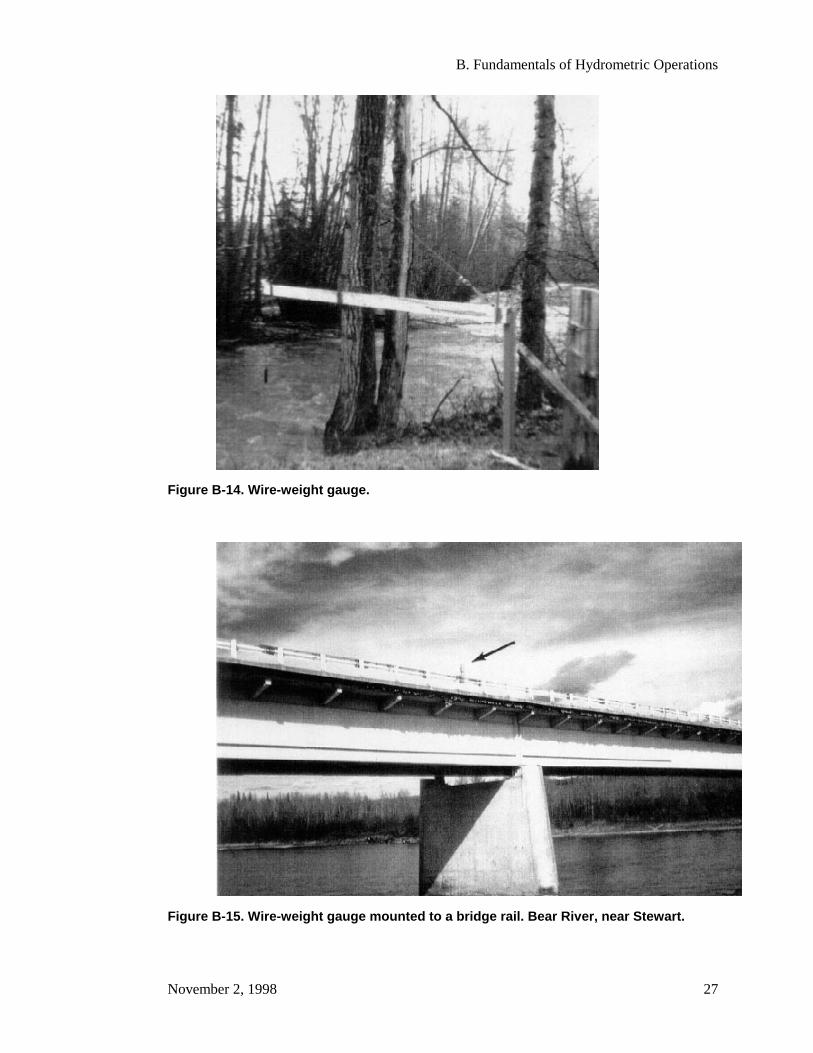
B. Fundamentals of Hydrometric Operations
November 2, 1998 27
Figure B-14. Wire-weight gauge.
Figure B-15. Wire-weight gauge mounted to a bridge rail. Bear River, near Stewart.
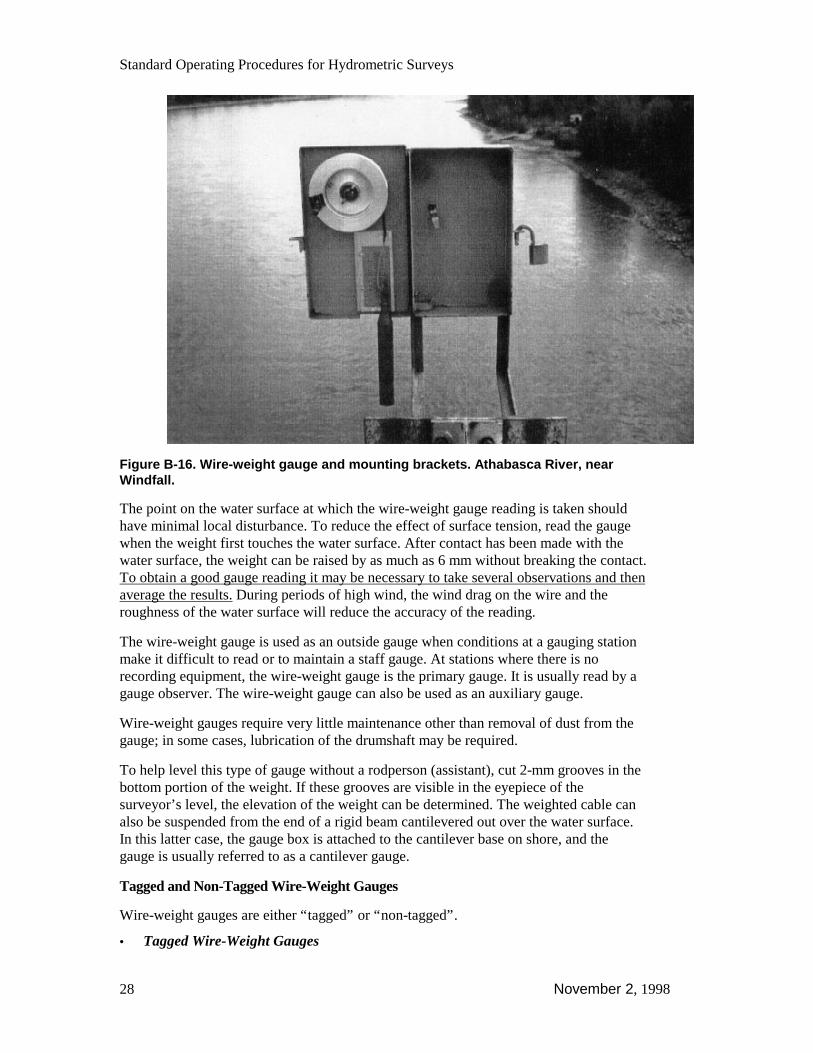
Standard Operating Procedures for Hydrometric Surveys
28 November 2, 1998
Figure B-16. Wire-weight gauge and mounting brackets. Athabasca River, nearWindfall.
The point on the water surface at which the wire-weight gauge reading is taken shouldhave minimal local disturbance. To reduce the effect of surface tension, read the gaugewhen the weight first touches the water surface. After contact has been made with thewater surface, the weight can be raised by as much as 6 mm without breaking the contact.To obtain a good gauge reading it may be necessary to take several observations and thenaverage the results. During periods of high wind, the wind drag on the wire and theroughness of the water surface will reduce the accuracy of the reading.
The wire-weight gauge is used as an outside gauge when conditions at a gauging stationmake it difficult to read or to maintain a staff gauge. At stations where there is norecording equipment, the wire-weight gauge is the primary gauge. It is usually read by agauge observer. The wire-weight gauge can also be used as an auxiliary gauge.
Wire-weight gauges require very little maintenance other than removal of dust from thegauge; in some cases, lubrication of the drumshaft may be required.
To help level this type of gauge without a rodperson (assistant), cut 2-mm grooves in thebottom portion of the weight. If these grooves are visible in the eyepiece of thesurveyor’s level, the elevation of the weight can be determined. The weighted cable canalso be suspended from the end of a rigid beam cantilevered out over the water surface.In this latter case, the gauge box is attached to the cantilever base on shore, and thegauge is usually referred to as a cantilever gauge.
Tagged and Non-Tagged Wire-Weight Gauges
Wire-weight gauges are either “tagged” or “non-tagged”.
• Tagged Wire-Weight Gauges
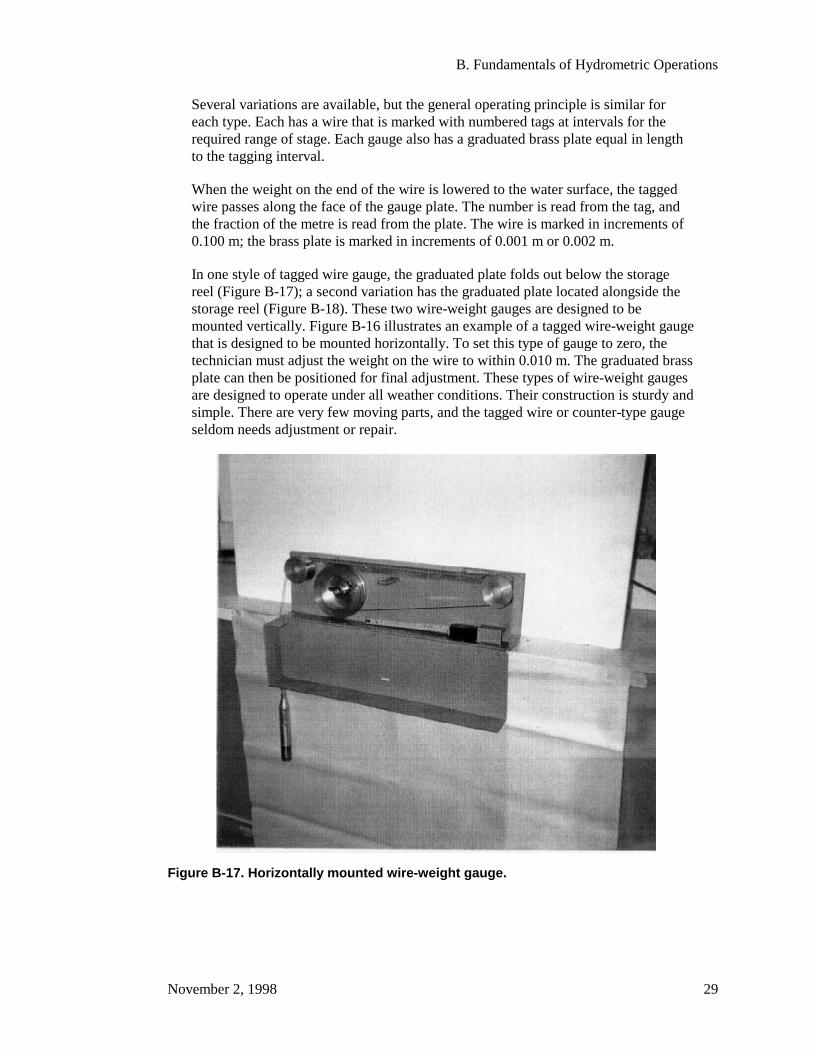
B. Fundamentals of Hydrometric Operations
November 2, 1998 29
Several variations are available, but the general operating principle is similar foreach type. Each has a wire that is marked with numbered tags at intervals for therequired range of stage. Each gauge also has a graduated brass plate equal in lengthto the tagging interval.
When the weight on the end of the wire is lowered to the water surface, the taggedwire passes along the face of the gauge plate. The number is read from the tag, andthe fraction of the metre is read from the plate. The wire is marked in increments of0.100 m; the brass plate is marked in increments of 0.001 m or 0.002 m.
In one style of tagged wire gauge, the graduated plate folds out below the storagereel (Figure B-17); a second variation has the graduated plate located alongside thestorage reel (Figure B-18). These two wire-weight gauges are designed to bemounted vertically. Figure B-16 illustrates an example of a tagged wire-weight gaugethat is designed to be mounted horizontally. To set this type of gauge to zero, thetechnician must adjust the weight on the wire to within 0.010 m. The graduated brassplate can then be positioned for final adjustment. These types of wire-weight gaugesare designed to operate under all weather conditions. Their construction is sturdy andsimple. There are very few moving parts, and the tagged wire or counter-type gaugeseldom needs adjustment or repair.
Figure B-17. Horizontally mounted wire-weight gauge.
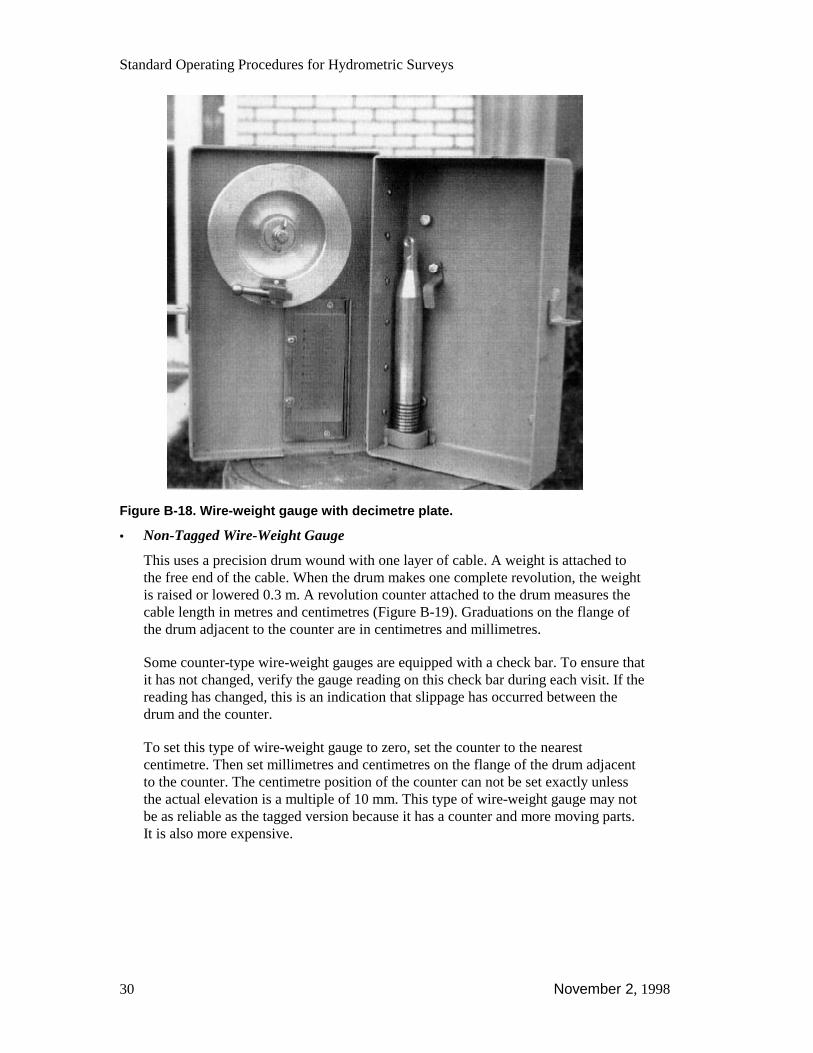
Standard Operating Procedures for Hydrometric Surveys
30 November 2, 1998
Figure B-18. Wire-weight gauge with decimetre plate.
• Non-Tagged Wire-Weight Gauge
This uses a precision drum wound with one layer of cable. A weight is attached tothe free end of the cable. When the drum makes one complete revolution, the weightis raised or lowered 0.3 m. A revolution counter attached to the drum measures thecable length in metres and centimetres (Figure B-19). Graduations on the flange ofthe drum adjacent to the counter are in centimetres and millimetres.
Some counter-type wire-weight gauges are equipped with a check bar. To ensure thatit has not changed, verify the gauge reading on this check bar during each visit. If thereading has changed, this is an indication that slippage has occurred between thedrum and the counter.
To set this type of wire-weight gauge to zero, set the counter to the nearestcentimetre. Then set millimetres and centimetres on the flange of the drum adjacentto the counter. The centimetre position of the counter can not be set exactly unlessthe actual elevation is a multiple of 10 mm. This type of wire-weight gauge may notbe as reliable as the tagged version because it has a counter and more moving parts.It is also more expensive.
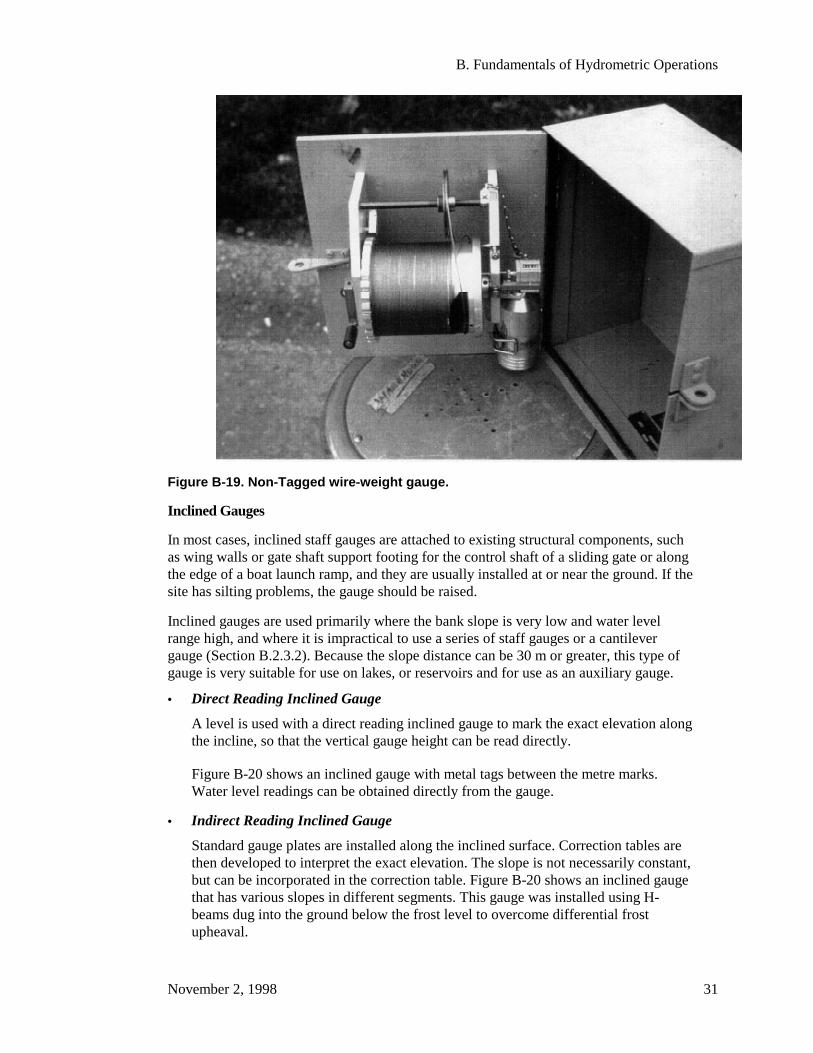
B. Fundamentals of Hydrometric Operations
November 2, 1998 31
Figure B-19. Non-Tagged wire-weight gauge.
Inclined Gauges
In most cases, inclined staff gauges are attached to existing structural components, suchas wing walls or gate shaft support footing for the control shaft of a sliding gate or alongthe edge of a boat launch ramp, and they are usually installed at or near the ground. If thesite has silting problems, the gauge should be raised.
Inclined gauges are used primarily where the bank slope is very low and water levelrange high, and where it is impractical to use a series of staff gauges or a cantilevergauge (Section B.2.3.2). Because the slope distance can be 30 m or greater, this type ofgauge is very suitable for use on lakes, or reservoirs and for use as an auxiliary gauge.
• Direct Reading Inclined Gauge
A level is used with a direct reading inclined gauge to mark the exact elevation alongthe incline, so that the vertical gauge height can be read directly.
Figure B-20 shows an inclined gauge with metal tags between the metre marks.Water level readings can be obtained directly from the gauge.
• Indirect Reading Inclined Gauge
Standard gauge plates are installed along the inclined surface. Correction tables arethen developed to interpret the exact elevation. The slope is not necessarily constant,but can be incorporated in the correction table. Figure B-20 shows an inclined gaugethat has various slopes in different segments. This gauge was installed using H-beams dug into the ground below the frost level to overcome differential frostupheaval.
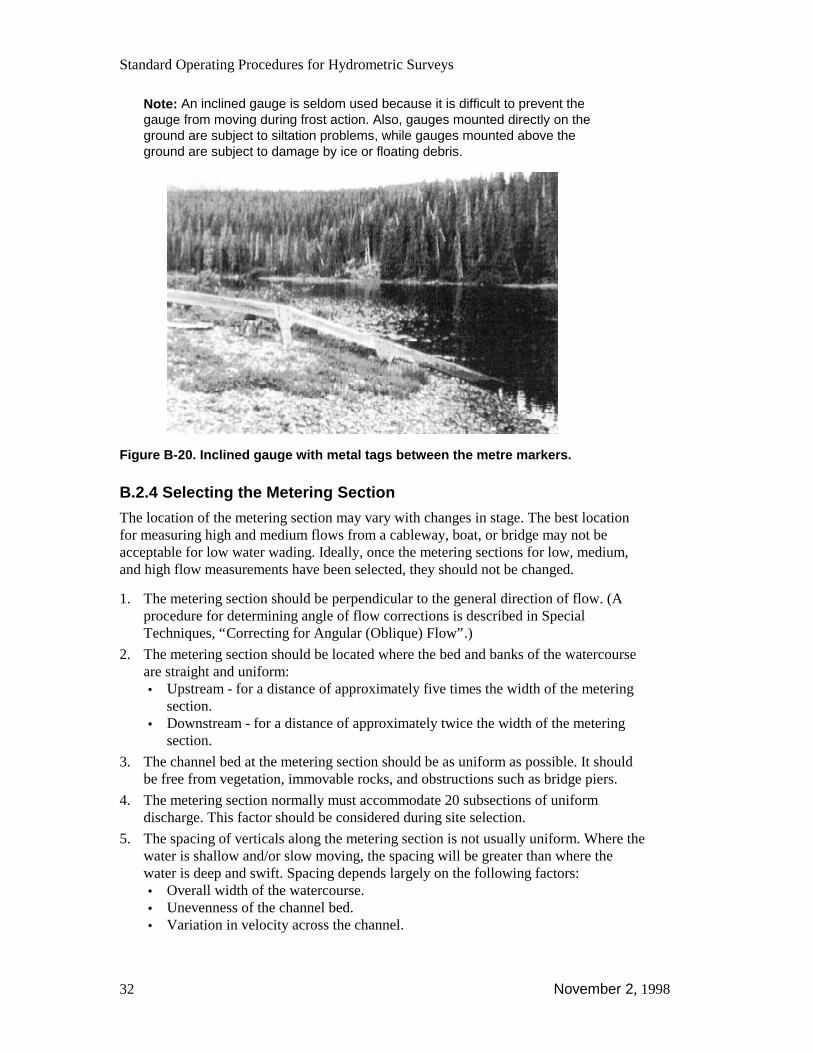
Standard Operating Procedures for Hydrometric Surveys
32 November 2, 1998
Note: An inclined gauge is seldom used because it is difficult to prevent thegauge from moving during frost action. Also, gauges mounted directly on theground are subject to siltation problems, while gauges mounted above theground are subject to damage by ice or floating debris.
Figure B-20. Inclined gauge with metal tags between the metre markers.
B.2.4 Selecting the Metering Section
The location of the metering section may vary with changes in stage. The best locationfor measuring high and medium flows from a cableway, boat, or bridge may not beacceptable for low water wading. Ideally, once the metering sections for low, medium,and high flow measurements have been selected, they should not be changed.
1. The metering section should be perpendicular to the general direction of flow. (Aprocedure for determining angle of flow corrections is described in SpecialTechniques, “Correcting for Angular (Oblique) Flow”.)
2. The metering section should be located where the bed and banks of the watercourseare straight and uniform:• Upstream - for a distance of approximately five times the width of the metering
section.• Downstream - for a distance of approximately twice the width of the metering
section.
3. The channel bed at the metering section should be as uniform as possible. It shouldbe free from vegetation, immovable rocks, and obstructions such as bridge piers.
4. The metering section normally must accommodate 20 subsections of uniformdischarge. This factor should be considered during site selection.
5. The spacing of verticals along the metering section is not usually uniform. Where thewater is shallow and/or slow moving, the spacing will be greater than where thewater is deep and swift. Spacing depends largely on the following factors:• Overall width of the watercourse.• Unevenness of the channel bed.• Variation in velocity across the channel.
B. Fundamentals of Hydrometric Operations
November 2, 1998 33
6. If the verticals are properly spaced, then the discharge in any one of the subsectionsshould be about 5% of the total discharge, and may not exceed 10% for theProvincial Class A Standard.
7. The spacing of each vertical may be referenced to a permanent initial point on theshore. The initial point should be well defined, usually by an iron pin driven into theground above the high water mark. And, the initial point in turn should be referencedto another permanent feature near the metering section or gauging station. (Thesedata are often required for detailed studies long after the gauging station has beenestablished or discontinued.) This is particularly important where it is desirable todefine channel erosion or deposition. As changes are usually determined by creatinga series of cross-section plots, an iron pin is usually set above the high water mark atthe far end of the cross section. The distance between the two points is used tomaintain the horizontal vertical ratio in successive computer-generated plots.

Standard Operating Procedures for Hydrometric Surveys
34 November 2, 1998
This page intentionally blank.
C. Hydrometric Survey Equipment
November 2, 1998 35
C. Hydrometric Survey EquipmentThis section describes the basic equipment required to measure water level or stage andvelocity, as well as several other equipment items that make measurement systems moreefficient and versatile.
C.1 Water Level Recorders
C.1.1 Introduction
This section describes the instrumentation used to collect automatically continuous waterlevel records, and methods of installation. There are two distinctive recording systemscommon to hydrometric surveys: analogue, or graphic; and digital. The analoguerecorder has been in continuous use since early in the 20th century and is still widelyused in Canada. The digital system, on the other hand, came into common use for waterlevel recording only in recent years.
The digital recording system has replaced the analogue recorder for many applications,although neither system is foolproof. For particularly sensitive or important sites, it iscommon to use both; the digital system as the primary and the analogue as a back-up.
All automatic water level recorders require some form of manual reference to the waterlevel at the time of installation, and again at all subsequent visits to the station by thetechnician. The reference gauge should be installed in close proximity to the recordingdevice. Manual reference gauges are described in Section B.2.3.
C.1.2 Graphic Recorders
A graphic water level recorder is an instrument that provides a permanent and continuouslong-term record of water level variation. A clock movement controls the rate at which astrip chart advances. At the same time, a float in contact with the water surface activatesa marking stylus or pen which reproduces the float’s vertical movement on the stripchart.
Graphic recorders can record a virtually unlimited range of stage. They provide a lowcost record of stage when installed at lakes or reservoirs, and they may be used toprovide a record of flow rates, for licensing purposes, below diversion structures in ratedchannels designed to transport water at a near constant rate.
Two types of graphic recorders, Type F and Type A, are manufactured by the LeupoldStevens Company of Beaverton, Oregon. Similar models are manufactured by SherlockInstruments in Australia and by Ott in Germany.
Graphic or Analogue Recorders are described in Appendix-III which also includesinstructions on their installation, operation and maintenance.

Standard Operating Procedures for Hydrometric Surveys
36 November 2, 1998
C.1.3 Digital Recorders
C.1.3.1 General
The advent of electronic sensors and data loggers, with their ability to record and storeinformation in database ready digital format, made the importing and compilation ofrecorded values much easier and faster. While there was the benefit of collecting datafaster there were problems to overcome. The first devices were usually more expensivethan their mechanical counterpart and were not easy to program.
Extreme environmental operating conditions, (i.e. temperature) revealed problems ingetting electronics to operate reliability and accurately. However, as the use of theseelectronic automated systems increased during the 1980’s, advancements in both sensorand data logger design overcame these problems.
Today there are a variety of sensors and data loggers on the market. In addition torecording water level, one can now include water quality and meteorological parametersas well. What used to require a separate recorder for each parameter now can becollected in one data-logging device. To determine what automated system best suits theneed of the end user will depend upon their present and future monitoring plans.
C.1.3.2 Sensor Types
There are a variety of different methods for measuring the change in water level. Someof the products currently used include:
• Ultrasonic Level Sensors
• Submersible Pressure Sensors
• Pressure Measurement Sensors (Bubbler Gauges)
• Shaft Encoders with Float Assemblies
Ultrasonic Sensors
Ultrasonic Sensors send out a series of sound waves, which travel through the air andstrike a target (water surface). An echo is returned back to the sensor and the transit timetaken to send the wave and return is related to the distance traveled. The advantage ofthis sensor is that it is non-invasive, having no physical contact with the media beingmeasured. In areas where periodic flooding may carrying away a conventional gaugestation, a ultrasonic sensor could be safely mounted above the high water. The maindisadvantage of the ultrasonic sensor is that the sound wave can travel at different speedsdepending upon the prevalent environmental conditions (temperature, pressure, andhumidity), thus affecting accuracy.
Submersible Pressure Sensors
Submersible Pressure Sensors represent the largest segment of the sensors market. As thename implies the system consists of a pressure transducer immersed in the water at afixed depth. The sensor transmits an analogue or digital signal via underwater conductorsback to the data logger. In addition to the signal wires there in normally a vent tube aswell. The vent tube allows the sensor to equilibrate itself to changes in barometricpressure. If the sensor did not do this then an increase or decrease in barometric pressure
C. Hydrometric Survey Equipment
November 2, 1998 37
would be reflected in the recorded readings, creating another source of error.Submersible analogue sensors can have an accuracy as good as 0.1% of Full ScaleOutput (FSO), while digital sensors are available with accuracy’s of 0.02% FSO orbetter. The main advantage of the submersible sensor is that it is relatively inexpensiveand easy to install. Some of the disadvantages include variances in accuracy (dependingupon make and model). A pressure transducer inaccuracy is usually based on thefollowing characteristics:
• Non-linearity - the deviation of the sensor’s signal curve from that of a straight line.
• Repeatability - the ability of the sensor to reproduce an output reading whensubjected to identical pressures.
• Hysteresis - the difference in value for the same measured point when pressure isfirst increased, then decreased past the point.
In addition there are errors caused by sensor drift (especially analogue sensors), and therealization that, should the sensor leak, in most cases the electronics are damaged beyondrepair and the sensor must be replaced. Digital submersible sensors offer high accuracyand excellent long-term stability, but usually at a substantial cost over their analoguecounterparts.
Pressure Measurement (Bubbler) Sensor
The Pressure Measurement (Bubbler) Sensor is an extremely accurate digital sensorwhich is used to measure the gas pressure required to generate a bubble at the end of asubmerged orifice line. The pressure required to create the bubble is proportional to thewater head above the orifice. These “bubbler” gauges are similar to the submersibledigital sensors, with the exception that they are typically mounted in a walk in shelteralong with the pressure source (nitrogen tank or battery compressor) and pressureregulator. The main advantages of this type of sensor is its lower cost compared to itssubmersible counterpart, and that the only component in the water itself is the low costorifice line. The main disadvantage is the requirement of a bulky pressure tank orexternal pressure source.
Shaft Encoders
The use of Shaft Encoders was a natural progression from the mechanical chartrecorders. The existing float and pulley arrangement mounted could be removed from themechanical recorder and mounted directly to the shaft of the encoder. The encoder wouldtypically provide a pulse corresponding to the smallest measured increment (1 mm). Asthe float raised and lowered the encoder would provide a positive or negative countdepending upon the direction of movement. The main advantages of the shaft encoderare the ease to which it can be retrofitted to stations already using a float and pulley set-up, and the excellent linearity and accuracy provided. The main disadvantage would arisefrom the installation costs as float sensors do require a stilling well to operate.
C.1.3.3 Water Quality Sensors
In addition to measuring and recording the physical aspects of the water, thesimultaneous collection of the water’s biochemical data is desired. Water quality sensorsare available in single parameter and multi-parameter styles. Some of the more commonparameters measured include Temperature, Dissolved Oxygen, Specific Conductance,
Standard Operating Procedures for Hydrometric Surveys
38 November 2, 1998
pH, Turbidity, and Redox. Coming onto the market now are: ammonium, nitrates,chlorides, total dissolved gas and fluorescence, to name but a few, and the list keeps ongrowing. Not unlike the submersible pressure sensors the signal outputs from thesesensors can either be analogue or digital. Most single parameter sensor utilize ananalogue output, while the multi-parameter sensors use a digital format known as SDI -12 (Serial Digital Interface, 1200 Baud), which allows the data from the various sensorsto be sent over the same set of signal wires.
Having decided on what parameters will be monitored, and subsequently selected theappropriate sensors, one needs to look at the various data loggers available.
Data Loggers, also known as Data Collection Platforms or Data Acquisition Systems,store readings electronically taken from the sensors mentioned previously. Most loggersare programmed through a computer or keyboard. The signal can be from a variety ofsensors whose output corresponds to a specific engineering value, whether it be watertemperature or turbidity. The recorded information is then stored in the data logger’smemory, where it remains until its downloaded by the end user into his/her computer.
Software
Programming the Data Logger can often be a trying experience, as with any new product,which uses software. It is good practice to first review the manuals which come with thedata logger and become familiar with the various menus and commands. A lot ofvaluable time will be saved should you have to explain your problems to the equipmentsupplier if can navigate your way through the software. Most data logger manufacturersutilize a menu driven format with “pull down” sub-menus to access specific functions(Figure C-1).
Software is installed by placing the manufacturer’s disk into the appropriate disk drive ofthe computer (i.e. Drive A). If you are using a windows based operating system use the“Run” command to access that drive (Drive A) then using the “Browse” command selectthe software installation program and press the Enter [( ] key to begin the process. If youare using a DOS based operating system, change your drive directory to that containingthe software (i.e. cd\A Drive):, then select the installation program and press Enter [( ].
The transfer of information between the data logger and your computer is accomplishedusing the computers RS-232 serial port. The port can be either a 25 pin, or morecommonly, a 9-pin connection. Always ensure that you have selected the correctcommunications port under the setting sections of the logger manufacturer’s softwareand at the same time check the baud rate (speed at which data is exchanged between thedata logger and the computer), (Figure C-2).
Having set up the computer to enable it to communicate with the data logger, the nextstep is to create your sensor’s characteristics. While each logger has its own menustructure, the steps required to create a logging program tend to follow the same basicsteps. Typically this will included putting information on Sensor Type (i.e. Temperature,Level…), Signal output, Excitation, Warm-up time, Conversion into Engineering Unitsetc.
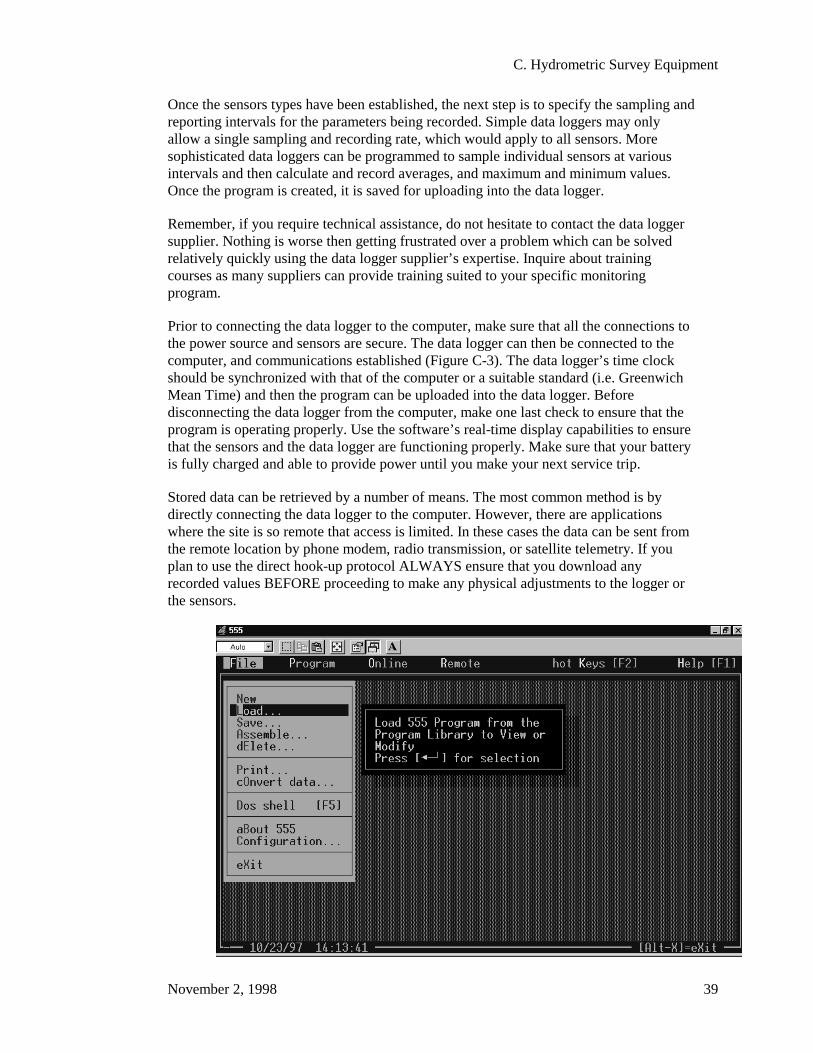
C. Hydrometric Survey Equipment
November 2, 1998 39
Once the sensors types have been established, the next step is to specify the sampling andreporting intervals for the parameters being recorded. Simple data loggers may onlyallow a single sampling and recording rate, which would apply to all sensors. Moresophisticated data loggers can be programmed to sample individual sensors at variousintervals and then calculate and record averages, and maximum and minimum values.Once the program is created, it is saved for uploading into the data logger.
Remember, if you require technical assistance, do not hesitate to contact the data loggersupplier. Nothing is worse then getting frustrated over a problem which can be solvedrelatively quickly using the data logger supplier’s expertise. Inquire about trainingcourses as many suppliers can provide training suited to your specific monitoringprogram.
Prior to connecting the data logger to the computer, make sure that all the connections tothe power source and sensors are secure. The data logger can then be connected to thecomputer, and communications established (Figure C-3). The data logger’s time clockshould be synchronized with that of the computer or a suitable standard (i.e. GreenwichMean Time) and then the program can be uploaded into the data logger. Beforedisconnecting the data logger from the computer, make one last check to ensure that theprogram is operating properly. Use the software’s real-time display capabilities to ensurethat the sensors and the data logger are functioning properly. Make sure that your batteryis fully charged and able to provide power until you make your next service trip.
Stored data can be retrieved by a number of means. The most common method is bydirectly connecting the data logger to the computer. However, there are applicationswhere the site is so remote that access is limited. In these cases the data can be sent fromthe remote location by phone modem, radio transmission, or satellite telemetry. If youplan to use the direct hook-up protocol ALWAYS ensure that you download anyrecorded values BEFORE proceeding to make any physical adjustments to the logger orthe sensors.
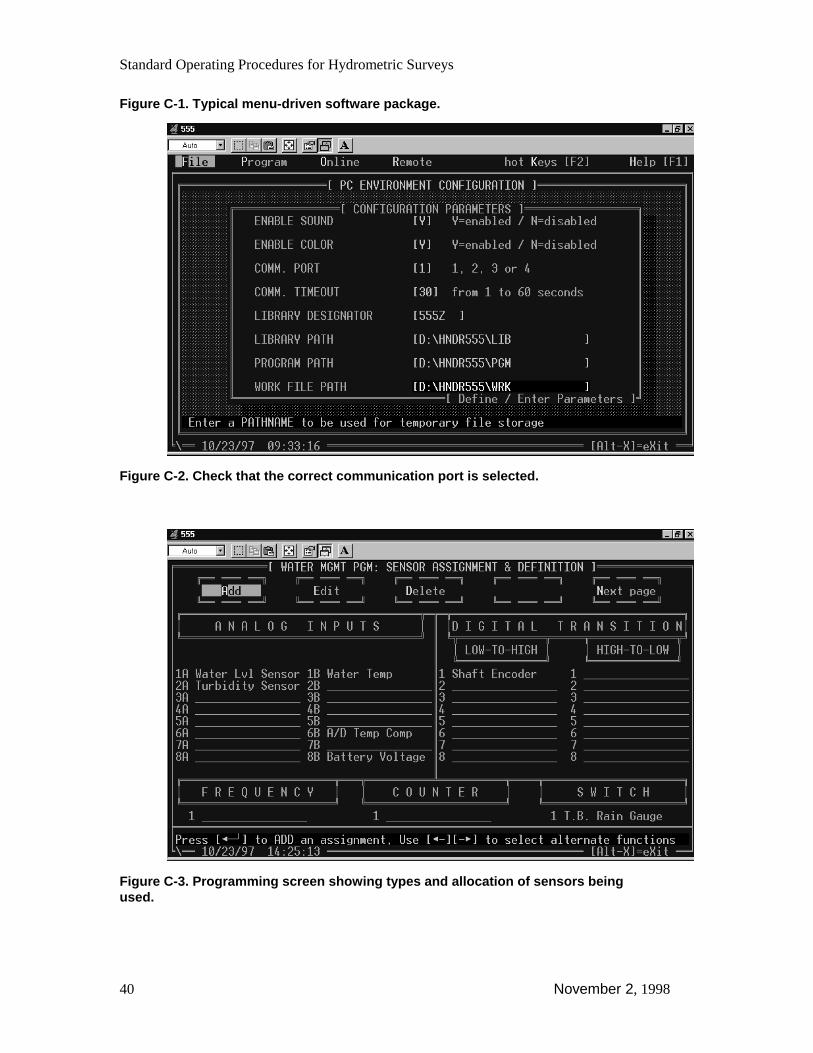
Standard Operating Procedures for Hydrometric Surveys
40 November 2, 1998
Figure C-1. Typical menu-driven software package.
Figure C-2. Check that the correct communication port is selected.
Figure C-3. Programming screen showing types and allocation of sensors beingused.

C. Hydrometric Survey Equipment
November 2, 1998 41
Analogue to Digital Converter (A/D)
As mentioned previously, sensors will either provide an Analogue or Digital outputsignal. The data logger stores all the readings in a digital format. Therefore, an analoguesignal must first be converted before it can be stored. The data logger uses an Analogueto Digital Converter to perform this process.
The important aspect when choosing the appropriate data logger is to look at the numberof “bits” used convert the analogue signal to a digital. Suffice to say the larger the “bit”number (i.e. 14 bits vs. 8 bits) the higher the accuracy. A detailed explanation onAnalogue to Digital conversion can be found in the Ministry of Environment, Land andParks “Interim Data Logging Standards for Water Quality Monitoring” manual.
Memory
Recorded data is typically stored in RAM (Random Access Memory). The size ofavailable RAM will dictate how long your data logger can remain in the field before yourmemory is filled and you have to download the collected readings. Check with the datalogger supplier on how their machines records and stores readings and confirm whetherthe logger will have sufficient capacity for the application it was intended. As youusually only get one try at collecting your data, the safe storage of that data is veryimportant. Most logger manufacturers use a lithium battery to maintain the logger’sinternal time clock and ensure the integrity of the data. Recently, data loggermanufacturers have been using the computer industry PCMCIA type RAM cards as away of providing additional storage space for readings. In most cases, the card with thestored readings can be replaced in the field with a new one, thus avoiding the problemsof taking a computer into a potentially hostile environment.
Signal Inputs
Sensors put out analogue and digital signals, which are in turn recorded by the datalogger. However, not every data logger can accept the variety of output signals provided.Here are some of the most common types.
Two of most commonly used Analogue signals employed by sensor manufacturers arevoltages (0-1 V, 0-2.5 V, 0-5 V) and current (0-20 mA, 4-20 mA). In each case themeasurement range of the sensor is equal to its full-scale output. For example, a sensorwith a 15 psi pressure range, and a 4-20 mA signal will output 4 mA at zero pressure and20 mA at 15 psi. In most cases, adjustments to correct for minor changes in zero andslope values have can be done via the data loggers’ software, but most sensors requireshipment back to the manufacturer for proper calibration.
In addition to the two different analogue signals, there are three main types of wiringconnections used when connecting a sensor to a data logger. Table C-1 illustrates thevarious signal types and their respective wiring conventions.
Digital signals are most commonly seen in a format called SDI-12 (Serial DigitalInterface, 1200 Baud). SDI-12 sensors have their own A/D converter, allowing them tomake corrections for changes in the ambient environment before sending the reading tothe data logger. In addition, conversions to the engineering units and adjustments to zeroand slope and can be directly inputted into the sensor. The result, is a “smart” sensor,
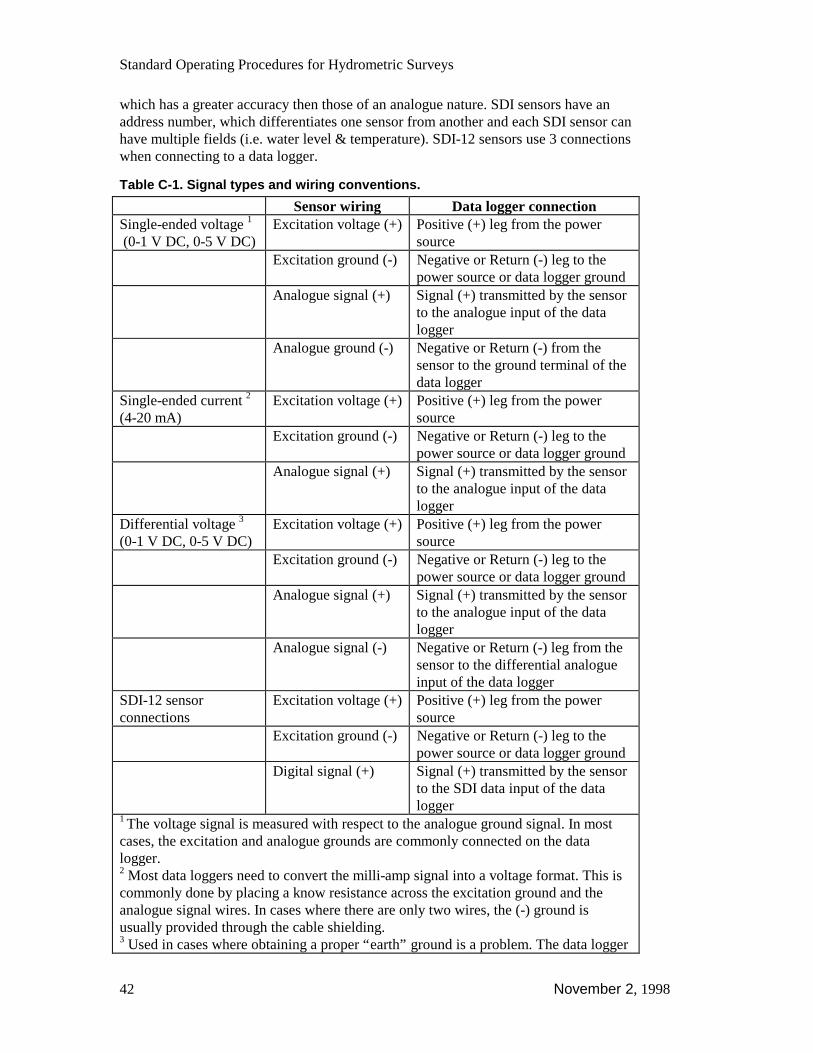
Standard Operating Procedures for Hydrometric Surveys
42 November 2, 1998
which has a greater accuracy then those of an analogue nature. SDI sensors have anaddress number, which differentiates one sensor from another and each SDI sensor canhave multiple fields (i.e. water level & temperature). SDI-12 sensors use 3 connectionswhen connecting to a data logger.
Table C-1. Signal types and wiring conventions.
Sensor wiring Data logger connectionSingle-ended voltage 1
(0-1 V DC, 0-5 V DC)Excitation voltage (+) Positive (+) leg from the power
sourceExcitation ground (-) Negative or Return (-) leg to the
power source or data logger groundAnalogue signal (+) Signal (+) transmitted by the sensor
to the analogue input of the datalogger
Analogue ground (-) Negative or Return (-) from thesensor to the ground terminal of thedata logger
Single-ended current 2
(4-20 mA)Excitation voltage (+) Positive (+) leg from the power
sourceExcitation ground (-) Negative or Return (-) leg to the
power source or data logger groundAnalogue signal (+) Signal (+) transmitted by the sensor
to the analogue input of the datalogger
Differential voltage 3
(0-1 V DC, 0-5 V DC)Excitation voltage (+) Positive (+) leg from the power
sourceExcitation ground (-) Negative or Return (-) leg to the
power source or data logger groundAnalogue signal (+) Signal (+) transmitted by the sensor
to the analogue input of the datalogger
Analogue signal (-) Negative or Return (-) leg from thesensor to the differential analogueinput of the data logger
SDI-12 sensorconnections
Excitation voltage (+) Positive (+) leg from the powersource
Excitation ground (-) Negative or Return (-) leg to thepower source or data logger ground
Digital signal (+) Signal (+) transmitted by the sensorto the SDI data input of the datalogger
1 The voltage signal is measured with respect to the analogue ground signal. In mostcases, the excitation and analogue grounds are commonly connected on the datalogger.2 Most data loggers need to convert the milli-amp signal into a voltage format. This iscommonly done by placing a know resistance across the excitation ground and theanalogue signal wires. In cases where there are only two wires, the (-) ground isusually provided through the cable shielding.3 Used in cases where obtaining a proper “earth” ground is a problem. The data logger
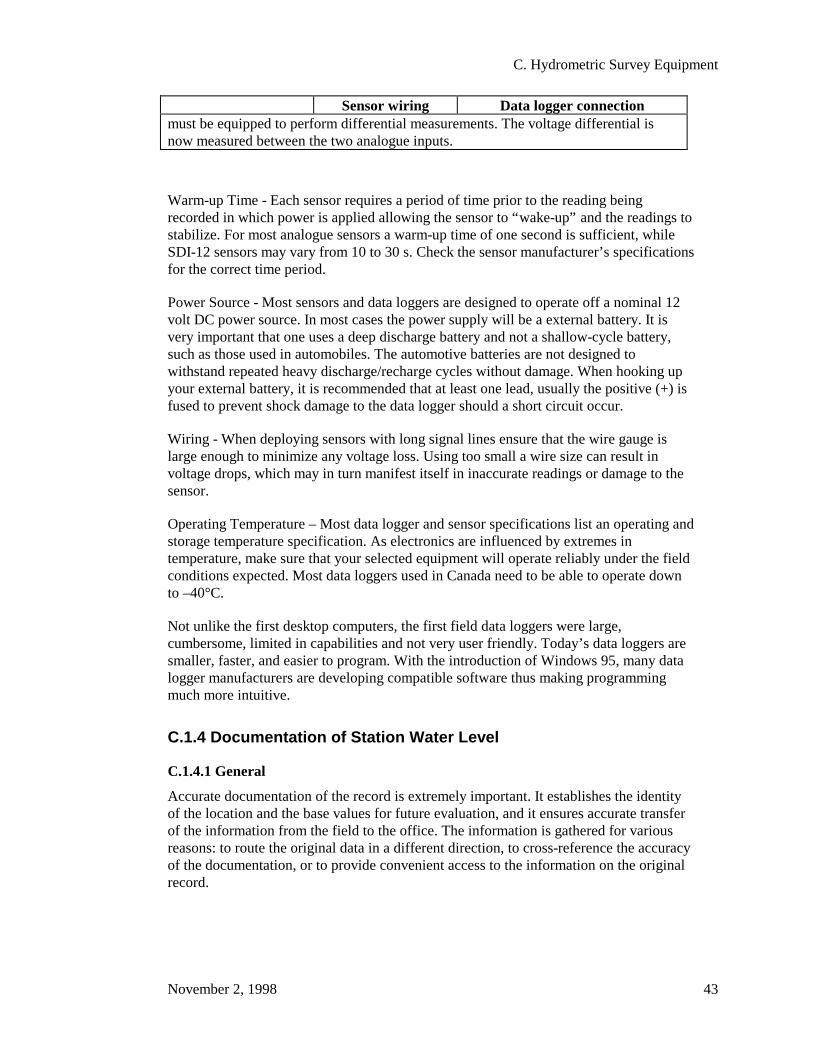
C. Hydrometric Survey Equipment
November 2, 1998 43
Sensor wiring Data logger connectionmust be equipped to perform differential measurements. The voltage differential isnow measured between the two analogue inputs.
Warm-up Time - Each sensor requires a period of time prior to the reading beingrecorded in which power is applied allowing the sensor to “wake-up” and the readings tostabilize. For most analogue sensors a warm-up time of one second is sufficient, whileSDI-12 sensors may vary from 10 to 30 s. Check the sensor manufacturer’s specificationsfor the correct time period.
Power Source - Most sensors and data loggers are designed to operate off a nominal 12volt DC power source. In most cases the power supply will be a external battery. It isvery important that one uses a deep discharge battery and not a shallow-cycle battery,such as those used in automobiles. The automotive batteries are not designed towithstand repeated heavy discharge/recharge cycles without damage. When hooking upyour external battery, it is recommended that at least one lead, usually the positive (+) isfused to prevent shock damage to the data logger should a short circuit occur.
Wiring - When deploying sensors with long signal lines ensure that the wire gauge islarge enough to minimize any voltage loss. Using too small a wire size can result involtage drops, which may in turn manifest itself in inaccurate readings or damage to thesensor.
Operating Temperature – Most data logger and sensor specifications list an operating andstorage temperature specification. As electronics are influenced by extremes intemperature, make sure that your selected equipment will operate reliably under the fieldconditions expected. Most data loggers used in Canada need to be able to operate downto –40°C.
Not unlike the first desktop computers, the first field data loggers were large,cumbersome, limited in capabilities and not very user friendly. Today’s data loggers aresmaller, faster, and easier to program. With the introduction of Windows 95, many datalogger manufacturers are developing compatible software thus making programmingmuch more intuitive.
C.1.4 Documentation of Station Water Level
C.1.4.1 General
Accurate documentation of the record is extremely important. It establishes the identityof the location and the base values for future evaluation, and it ensures accurate transferof the information from the field to the office. The information is gathered for variousreasons: to route the original data in a different direction, to cross-reference the accuracyof the documentation, or to provide convenient access to the information on the originalrecord.
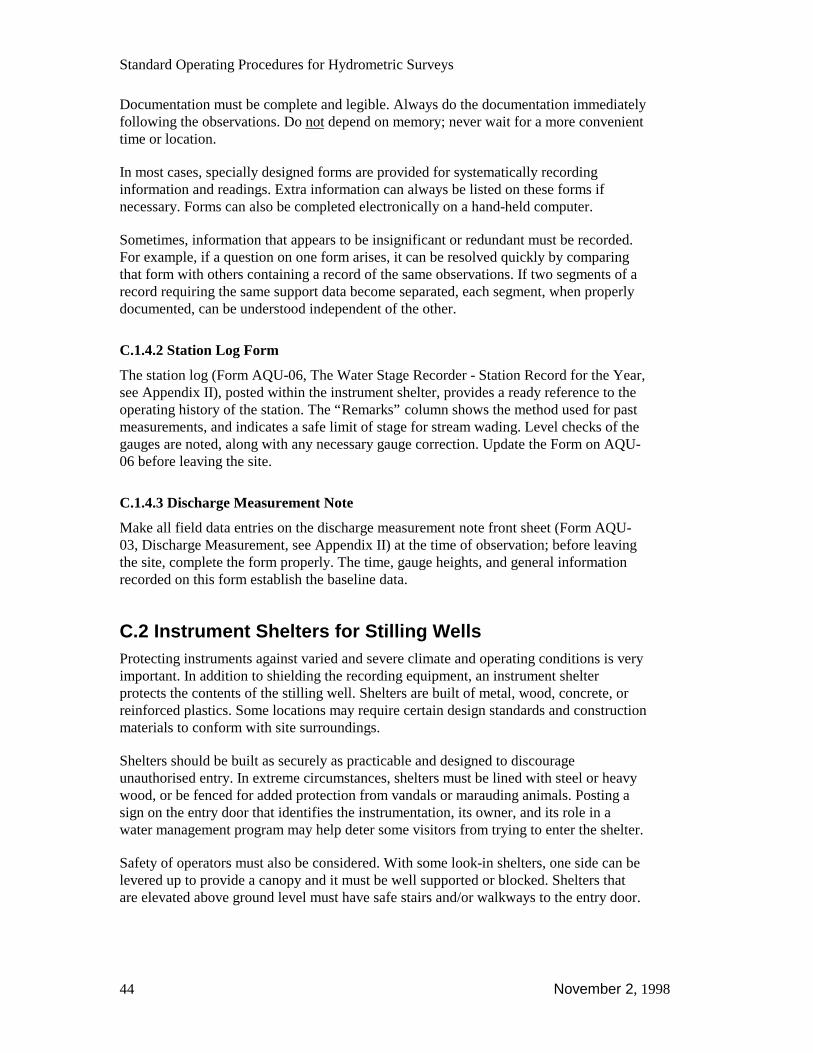
Standard Operating Procedures for Hydrometric Surveys
44 November 2, 1998
Documentation must be complete and legible. Always do the documentation immediatelyfollowing the observations. Do not depend on memory; never wait for a more convenienttime or location.
In most cases, specially designed forms are provided for systematically recordinginformation and readings. Extra information can always be listed on these forms ifnecessary. Forms can also be completed electronically on a hand-held computer.
Sometimes, information that appears to be insignificant or redundant must be recorded.For example, if a question on one form arises, it can be resolved quickly by comparingthat form with others containing a record of the same observations. If two segments of arecord requiring the same support data become separated, each segment, when properlydocumented, can be understood independent of the other.
C.1.4.2 Station Log Form
The station log (Form AQU-06, The Water Stage Recorder - Station Record for the Year,see Appendix II), posted within the instrument shelter, provides a ready reference to theoperating history of the station. The “Remarks” column shows the method used for pastmeasurements, and indicates a safe limit of stage for stream wading. Level checks of thegauges are noted, along with any necessary gauge correction. Update the Form on AQU-06 before leaving the site.
C.1.4.3 Discharge Measurement Note
Make all field data entries on the discharge measurement note front sheet (Form AQU-03, Discharge Measurement, see Appendix II) at the time of observation; before leavingthe site, complete the form properly. The time, gauge heights, and general informationrecorded on this form establish the baseline data.
C.2 Instrument Shelters for Stilling WellsProtecting instruments against varied and severe climate and operating conditions is veryimportant. In addition to shielding the recording equipment, an instrument shelterprotects the contents of the stilling well. Shelters are built of metal, wood, concrete, orreinforced plastics. Some locations may require certain design standards and constructionmaterials to conform with site surroundings.
Shelters should be built as securely as practicable and designed to discourageunauthorised entry. In extreme circumstances, shelters must be lined with steel or heavywood, or be fenced for added protection from vandals or marauding animals. Posting asign on the entry door that identifies the instrumentation, its owner, and its role in awater management program may help deter some visitors from trying to enter the shelter.
Safety of operators must also be considered. With some look-in shelters, one side can belevered up to provide a canopy and it must be well supported or blocked. Shelters thatare elevated above ground level must have safe stairs and/or walkways to the entry door.
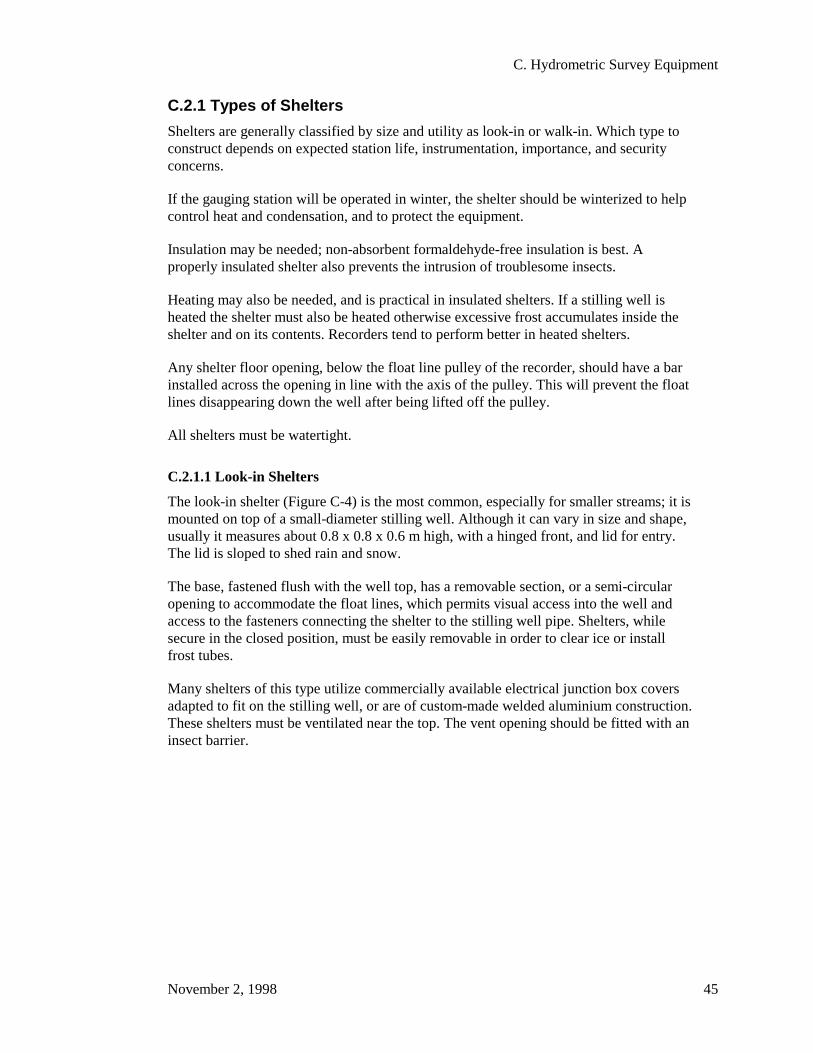
C. Hydrometric Survey Equipment
November 2, 1998 45
C.2.1 Types of Shelters
Shelters are generally classified by size and utility as look-in or walk-in. Which type toconstruct depends on expected station life, instrumentation, importance, and securityconcerns.
If the gauging station will be operated in winter, the shelter should be winterized to helpcontrol heat and condensation, and to protect the equipment.
Insulation may be needed; non-absorbent formaldehyde-free insulation is best. Aproperly insulated shelter also prevents the intrusion of troublesome insects.
Heating may also be needed, and is practical in insulated shelters. If a stilling well isheated the shelter must also be heated otherwise excessive frost accumulates inside theshelter and on its contents. Recorders tend to perform better in heated shelters.
Any shelter floor opening, below the float line pulley of the recorder, should have a barinstalled across the opening in line with the axis of the pulley. This will prevent the floatlines disappearing down the well after being lifted off the pulley.
All shelters must be watertight.
C.2.1.1 Look-in Shelters
The look-in shelter (Figure C-4) is the most common, especially for smaller streams; it ismounted on top of a small-diameter stilling well. Although it can vary in size and shape,usually it measures about 0.8 x 0.8 x 0.6 m high, with a hinged front, and lid for entry.The lid is sloped to shed rain and snow.
The base, fastened flush with the well top, has a removable section, or a semi-circularopening to accommodate the float lines, which permits visual access into the well andaccess to the fasteners connecting the shelter to the stilling well pipe. Shelters, whilesecure in the closed position, must be easily removable in order to clear ice or installfrost tubes.
Many shelters of this type utilize commercially available electrical junction box coversadapted to fit on the stilling well, or are of custom-made welded aluminium construction.These shelters must be ventilated near the top. The vent opening should be fitted with aninsect barrier.
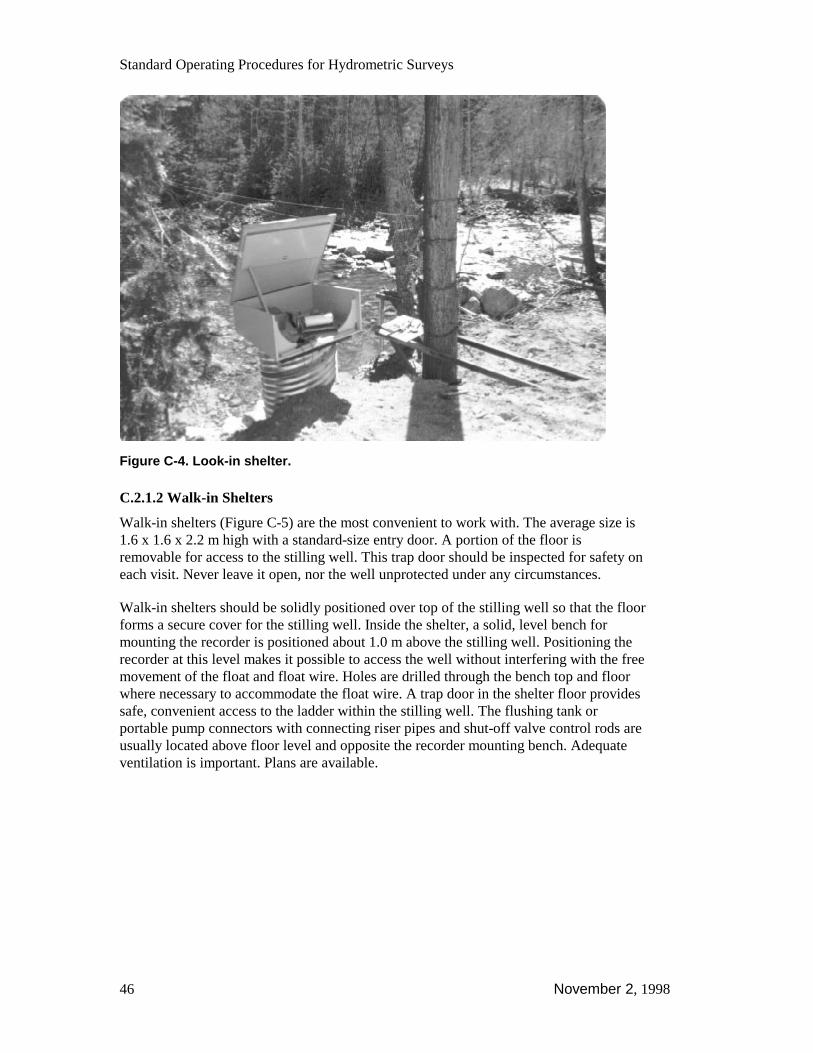
Standard Operating Procedures for Hydrometric Surveys
46 November 2, 1998
Figure C-4. Look-in shelter.
C.2.1.2 Walk-in Shelters
Walk-in shelters (Figure C-5) are the most convenient to work with. The average size is1.6 x 1.6 x 2.2 m high with a standard-size entry door. A portion of the floor isremovable for access to the stilling well. This trap door should be inspected for safety oneach visit. Never leave it open, nor the well unprotected under any circumstances.
Walk-in shelters should be solidly positioned over top of the stilling well so that the floorforms a secure cover for the stilling well. Inside the shelter, a solid, level bench formounting the recorder is positioned about 1.0 m above the stilling well. Positioning therecorder at this level makes it possible to access the well without interfering with the freemovement of the float and float wire. Holes are drilled through the bench top and floorwhere necessary to accommodate the float wire. A trap door in the shelter floor providessafe, convenient access to the ladder within the stilling well. The flushing tank orportable pump connectors with connecting riser pipes and shut-off valve control rods areusually located above floor level and opposite the recorder mounting bench. Adequateventilation is important. Plans are available.

C. Hydrometric Survey Equipment
November 2, 1998 47
Figure C-5. Walk-in shelter.
C.3 Stilling WellsA stilling well is a vertical pipe-shaped enclosure placed vertically in or near thestreambank. It is watertight, except for restricted access to the outside body of water. Thepurpose of the stilling well is to dampen water level fluctuation and protect the floatsensor components. Figures C-4 and C-6 show various stilling wells and shelters.
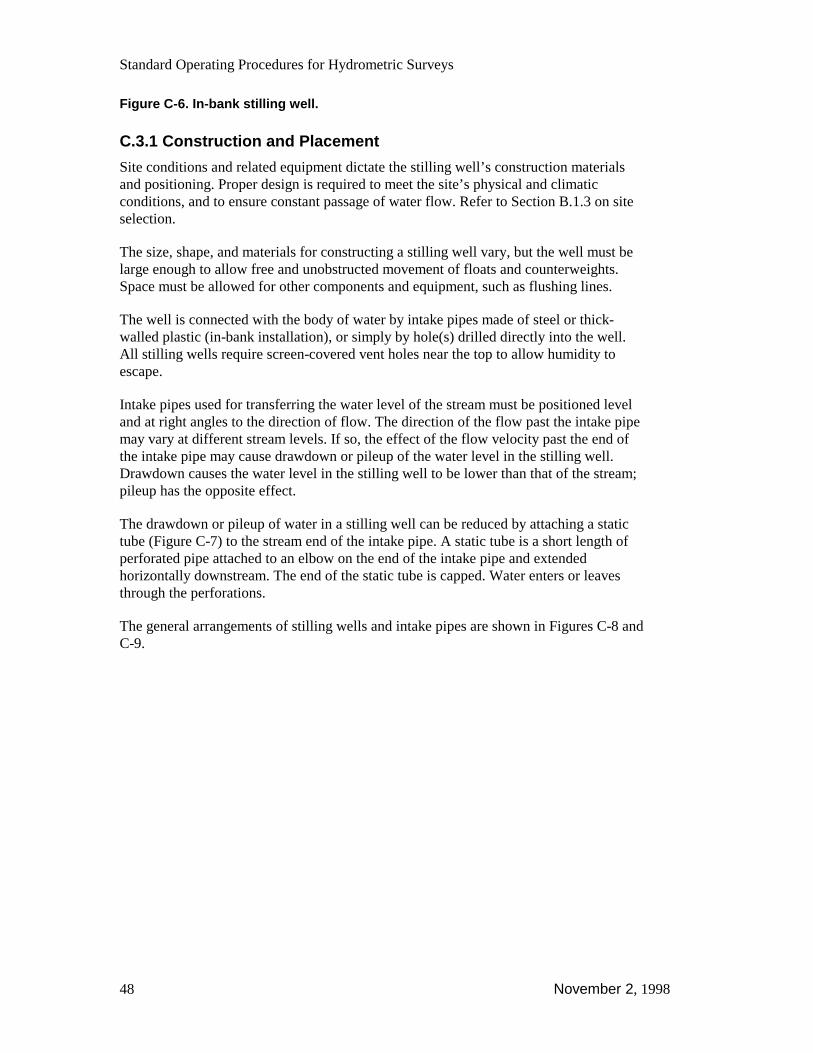
Standard Operating Procedures for Hydrometric Surveys
48 November 2, 1998
Figure C-6. In-bank stilling well.
C.3.1 Construction and Placement
Site conditions and related equipment dictate the stilling well’s construction materialsand positioning. Proper design is required to meet the site’s physical and climaticconditions, and to ensure constant passage of water flow. Refer to Section B.1.3 on siteselection.
The size, shape, and materials for constructing a stilling well vary, but the well must belarge enough to allow free and unobstructed movement of floats and counterweights.Space must be allowed for other components and equipment, such as flushing lines.
The well is connected with the body of water by intake pipes made of steel or thick-walled plastic (in-bank installation), or simply by hole(s) drilled directly into the well.All stilling wells require screen-covered vent holes near the top to allow humidity toescape.
Intake pipes used for transferring the water level of the stream must be positioned leveland at right angles to the direction of flow. The direction of the flow past the intake pipemay vary at different stream levels. If so, the effect of the flow velocity past the end ofthe intake pipe may cause drawdown or pileup of the water level in the stilling well.Drawdown causes the water level in the stilling well to be lower than that of the stream;pileup has the opposite effect.
The drawdown or pileup of water in a stilling well can be reduced by attaching a statictube (Figure C-7) to the stream end of the intake pipe. A static tube is a short length ofperforated pipe attached to an elbow on the end of the intake pipe and extendedhorizontally downstream. The end of the static tube is capped. Water enters or leavesthrough the perforations.
The general arrangements of stilling wells and intake pipes are shown in Figures C-8 andC-9.
C. Hydrometric Survey Equipment
November 2, 1998 49
Figure C-7. Static tube for intakes.
A stilling well must be positioned vertically and secured sufficiently to eliminate verticaland horizontal movement. The bottom of the stilling well must be placed at least 0.3 mbelow the minimum expected water level. The top must be above the maximum expectedwater level.
Where stilling wells are installed to record continuous flow at measuring structures, awet stilling well is attached to the wall of a dry well and the intake pipes are fitted withrodding eyes, shut-off valves, and an open-end upstand pipe. The top of the upstand pipeis set at precisely the same elevation as the invert of the measuring structure control. Thisarrangement permits setting zero flow on the recorder. A second, clear acrylic upstandpipe is bracketed to the dry well wall in front of standard gauge plate(s). This is theinside gauge; it extends to the top of the flume side wall. Figure C-10 shows the viewingpipe at the Jamieson Creek Flume.
C.3.1.1 In-Stream Stilling Well
If holes are drilled directly in the tube, the well is positioned against a verticalstreambank and anchored at the base by means of angle irons driven into the streambed,or it is secured to a wharf, bridge pier, abutment, or dike wall. Holes are drilled throughthe wall of the pipe at proper locations to permit water passage sufficient to maintain acontinuous balance of the inside and outside water level. The bottom of the pipe must bemade watertight by using caps or welded plates. A watertight door near the bottom of thewell provides access at low water level for removing silt or ice.
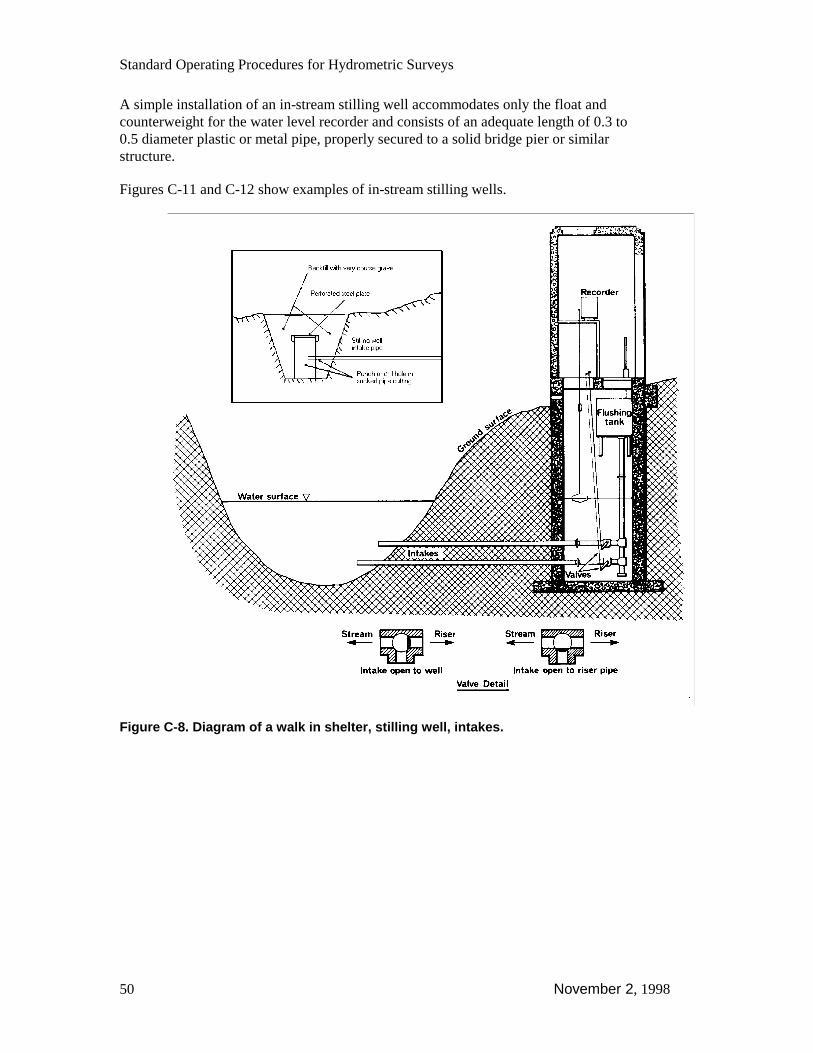
Standard Operating Procedures for Hydrometric Surveys
50 November 2, 1998
A simple installation of an in-stream stilling well accommodates only the float andcounterweight for the water level recorder and consists of an adequate length of 0.3 to0.5 diameter plastic or metal pipe, properly secured to a solid bridge pier or similarstructure.
Figures C-11 and C-12 show examples of in-stream stilling wells.
Figure C-8. Diagram of a walk in shelter, stilling well, intakes.
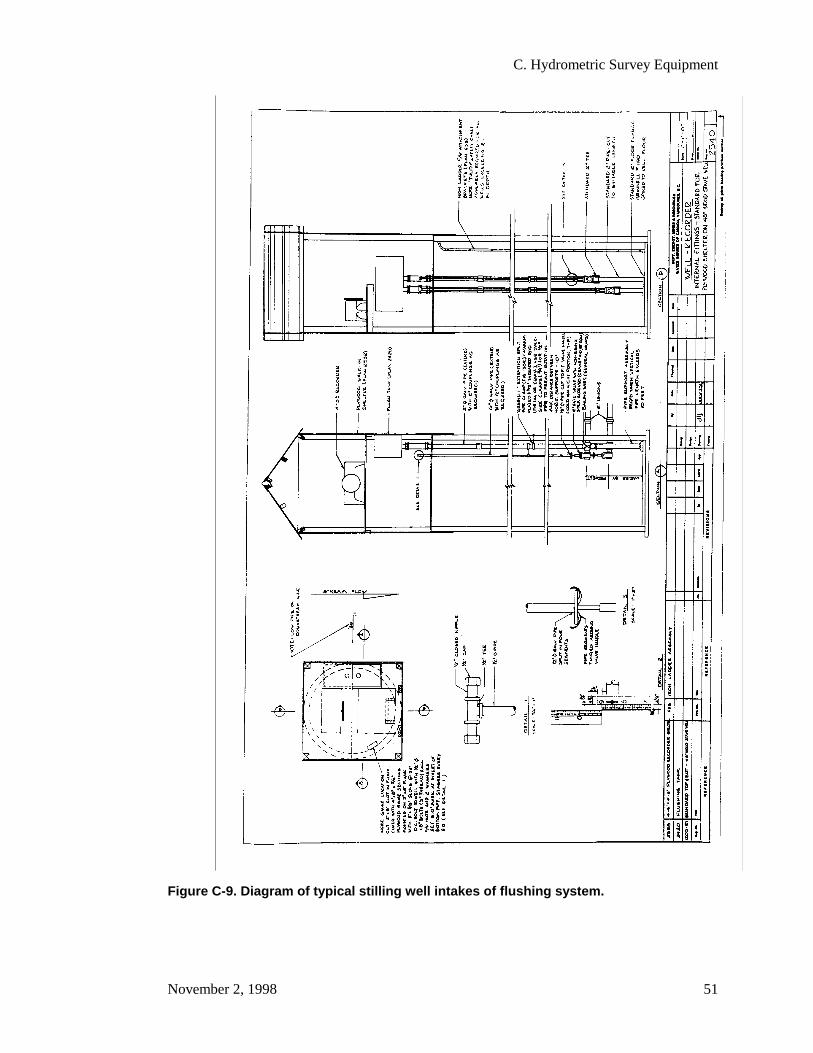
C. Hydrometric Survey Equipment
November 2, 1998 51
Figure C-9. Diagram of typical stilling well intakes of flushing system.

Standard Operating Procedures for Hydrometric Surveys
52 November 2, 1998
Note: the shelter for this type of installation requires a minimum floor areaof 7.5 m2 (dry well floor area, assuming a 0.31 m diameter wet well, mustbe at least 1.5 x 2.0 m). The dry well must be fitted with a ladder bolted tothe wall, a 37.5 mm floor drain and covered with a trap door or removablefloor plates.
Figure C-10. Jamieson Creek dry well.
C.3.1.2 In-Bank Placement
A stilling well with in-take pipes is placed a few metres inshore, in the bank, whereconditions are favourable and where long-term operation is possible. The design andinstallation of an in-bank well is more complex than that of an in-stream well.
The well is usually constructed of concrete, steel pipe, or wood staves. Connecting pipestransfer water between the well and the outside body of water. Earth is backfilled to theoutside perimeter of the well casing. The connecting pipes are buried, leaving exposedthe portion of the pipe protruding into the body of water. Provision must be made forcleaning out silt from both the bottom of the well and the intake system.
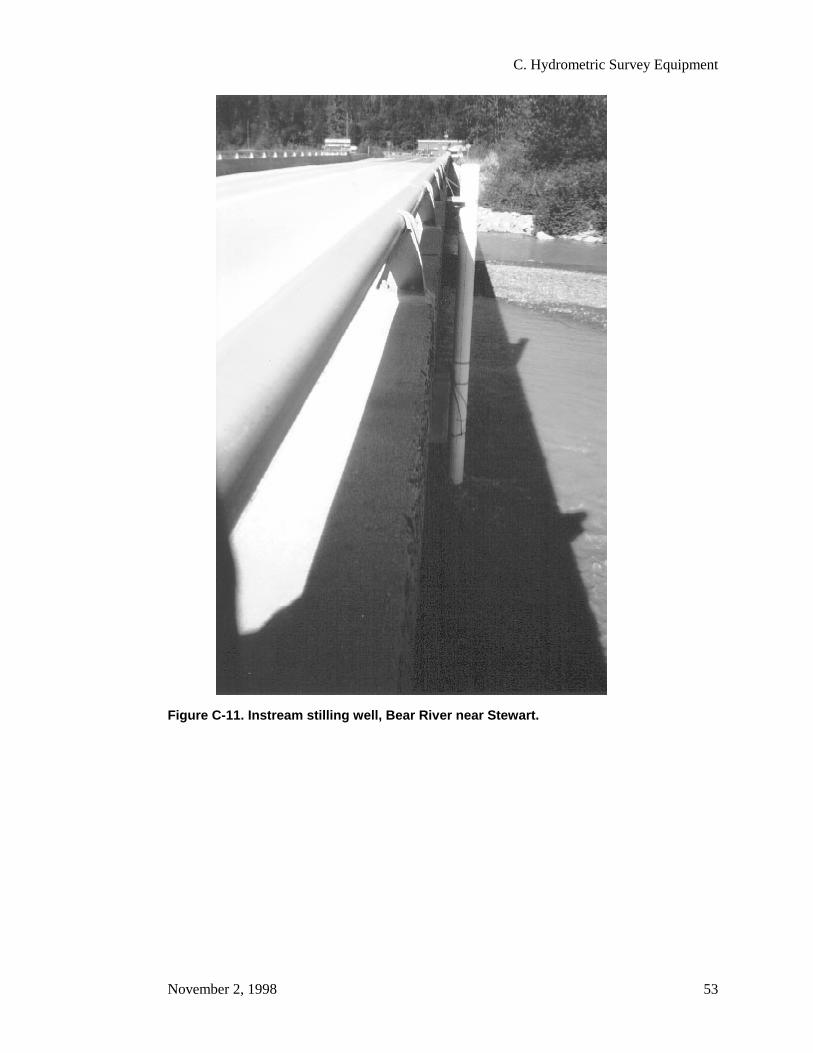
C. Hydrometric Survey Equipment
November 2, 1998 53
Figure C-11. Instream stilling well, Bear River near Stewart.

Standard Operating Procedures for Hydrometric Surveys
54 November 2, 1998
Figure C-12. Instream stilling well, Whitehead Creek near Summerland.
C.3.2 Intake Pipe Design and Placement
Water from the outside the well in the water body is transferred to and from the stillingwell through intakes. Depending on the type of stilling well, the intakes can be a series ofholes in the wall of the well, a single hole in the well bottom, or connecting pipes. Theintakes must be large enough to maintain the water level within the well at the samedepth as the outside water at all times. At the same time, the intakes must be sufficientlyconstricted to dampen unwanted oscillation of the water level.
Note: Rule of thumb for sizing the intake--the total area of the intake(s) or theholes in the well should equal one thousandth the area of the stilling well.
To prevent plugging by deposited silt, the intakes should be positioned at least 0.2 mlower than the lowest expected water level, but at least 0.15 m above the well bottom.
Pipe intakes should be positioned horizontally, below the frost line. The open ends of theintakes should protrude into the outside body of water to a point clear of obstruction.Two or more pipe intakes are normally installed at elevations throughout the range ofwater level variation. During high water, if silt deposits obstruct the lower intake theupper intakes will continue to operate. Record the elevation of the intakes in the fielddata book on the Description of Hydrometric Station Form (Form AQU-01).
The intake pipes must be positioned at right angles to the direction of flow. The directionof the flow past the intake pipe may vary at different stream levels. If so, the effect of theflow velocity past the end of the intake pipe may cause drawdown or pile-up of the waterlevel in the stilling well. Drawdown causes the water level in the stilling well to be lowerthan that of the stream; pile-up has the opposite effect.
C. Hydrometric Survey Equipment
November 2, 1998 55
C.3.2.1 Static Pipe
The drawdown or pile-up of water in a stilling well can be reduced by attaching a statictube to the stream end of the intake pipe. A static tube is a short length of perforated pipethat is attach to an elbow on the end of the intake pipe and extended horizontallydownstream. The end of the static tube is capped. Water enters or leaves through theperforations. A properly designed static tube eliminates the pressure due to the streamvelocity, but it still reacts to water pressure according to the depth of water over theintake.
C.3.2.2 Intake Chamber
To provide low water levels, the outer end of an intake pipe may have to be located somedistance from the stilling well and may be subject to damage due to bedload movement.In such circumstances, the intake pipe should be buried in a trench leading out to aperforated chamber embedded in the streambed.
The most suitable form of chamber is a length of concrete or plastic pipe one metre longand 0.3 m in diameter placed vertically with the top at least 0.2 m below the stream bed.The end of the intake pipe enters the chamber through a hole punched or drilled throughthe wall of the pipe at least 0.3 m below the top. If a socket pipe cutting is used, acircular piece of steel plate drilled with a number of 10-mm holes can be fitted to rest inthe bellmouth opening. The bottom of the chamber is left open, while the cover plate,fitted with a lifting handle, is covered with gravel level with the stream bed.
C.3.2.3 Intake Chamber Position
The position of the intake chamber should be carefully referenced to two or more pointson shore so that the chamber may be located easily for cleaning. The reference datashould be entered on the Description of Hydrometric Station Form (AQU-01) and on theWater Stage Recorder - Station Record Form (AQU-06).
When seepage or channeled rainfall gets into the stilling well, or when water leaks out ofthe stilling well through the wall or bottom, the accuracy of water level trace decreases.These problems should be rectified.
C.3.3 Operation and Maintenance
The operation of stilling wells is affected by seasonal changes, runoff patterns, andweather. Work performed on or around stilling wells is subject to safe workingconditions. Operating staff should be aware of safety requirements and look for andcorrect any unsafe conditions before beginning hydrometric work.
C.3.3.1 Open Water Season
Open water season is that part of the year when no ice is present on the watercourse.Each time the technician visits the station, the shelter and site must be inspected for anypotential problems such as damaged flooring, broken or bent intake pipes, inoperativeshutoff valves, and insecure ladders. Any observed faults should be repaired immediatelyif possible, or scheduled for repair at the earliest opportunity. Check for obstructions inthe well that may impede the float, float line, or clock weight travel.
Standard Operating Procedures for Hydrometric Surveys
56 November 2, 1998
Check the well for sit deposition by sounding with a weighted tape; compare thismeasurement to the original clean depth of the well.
Note: Remember, the lower intake pipe may be only 0.15 m above the wellbottom.
Promptly remove excessive silt deposits by using a pump and discharge hose to place theaccumulated silt into a suspension and to build the water head inside the well. Dischargethe water head out through the intake pipes to remove the suspended silt. Continueflushing until the plume of silt being discharged through the intakes is no longer visible.Stilling well system accuracy and reliability depend upon the free flow of water throughthe intakes.
Flush all intakes immediately before, during and immediately following seasonal highstage. For the rest of the season, flush the intakes during each station visit, or as required.Frequent flushing may be necessary where silting is an obvious problem.
Flush all intakes prior to obtaining a discharge measurement. Make sure the intake valvesare open after flushing and before you leave the site. Check to verify that the float, floatlines and clock-weight line are not tangled together and see that they are free fromobstructions. Also ensure that the float tape or line has not been knocked out of positionon the float pulley.
C.3.3.2 Seasonal Operation
The open water season described above excludes ice conditions normally associated withspring start-up and fall shut-down.
The operational ‘open water’ period for many hydrometric stations is April 1st to October31st, whether ice is present on the watercourse or not. However, before and after thisperiod the technician must undertake both pre-season and post-season activities.
Pre-season Operations
Pre-season activities involve clearing ice from the stilling well, repairing winter damage,and activating recorders.
Many stilling wells are constructed with 12-inch-diameter (305-mm) ABS water pipe,sealed at the bottom with a glued-on pipe cap. Ice removal from these relatively smalldiameter wells can prove quite a challenge even when the ice is no longer attached to thewall of the pipe. Preparations for ice removal must take place before freeze-up in the fall(see below).
If ice is frozen to the pipe wall, start-up can be delayed, or water added to the top tospeed melting. The judicious application of heat to warm the pipe sufficiently to detachthe ice block is suggested, if the stream ice is beginning to break up.
If the ice block is freed from the sides of the stilling well, it may be removed by lifting,although it may weigh up to 40 kg. The shelter must be removed from the stilling wellfirst.
C. Hydrometric Survey Equipment
November 2, 1998 57
Post-season Operations
In all location subject to winter freeze-up, ice may present problems if it occurs beforethe end of the operating season. Regardless of the operational period, all recordingstations require some degree of winterization if they are to be easily reactivated on timein the spring. Some preventive measures taken at the end of the season will make thefollowing season start-up, much easier. The usual problem found on arrival at stationstart-up is a large block of ice remaining in the stilling well. If the float has been leftactivated, it will almost certainly be stuck in the ice and will have to be freed before theice can be removed. The following shut-down procedures are recommended at the end ofthe season.
Remove the float, counterweight and float lines (carefully coil and secure lines to avoidkinking) from the well.
Through a 15-25 cm diameter metal or thick plastic disc with a 12 mm hole drilled in thecenter, pass a 10 mm polypropylene rope through the center of the disc, tie a figure ofeight knot, and lower disc to the bottom of the well. Align the rope to hang down thecenter of the well and tie it off at the top.
Note: Painting the shelter and exposed well exterior black, will promote earlierice detachment from the well wall. Also, if the recorder is to be left on site overthe winter, detach the chart roll from the take up roller, rewind on supply tube andtape. Wind negator spring and leave the clock running.
Winter Operation
Water which freezes in the stilling well and/or intakes during the winter period, presentsserious problems. Continuous operations in cases where there is no ice free zone in thestream are extremely difficult.
Ice Formation: If the intake pipes are below frost level and the end of the lowest intakedoes not become encased in ice, the stilling well can continue to operate. Formation ofice within the stilling well can be prevented or controlled with an insulated frost floor,heaters or an oil cylinder.
Fully exposed metal wells present the greatest problem. At freezing temperatures, iceforms quickly around the inside wall of the well and on the inside water surface whichtraps the float. Further freezing produces a cylindrical plug of ice.
Ice Effects on Floats: Warming temperatures may free the ice plug, but if the float istrapped within it, records of the response to water level changes will be inaccurate. Foran accurate record, the technician must free the float and remove the ice from the well.
Severe damage to the water level recorder can occur if both the float and counterweightbecome trapped in an ice plug. If the water level below the ice plug recedes, the weightof the ice will place extreme stress on the float pulley shaft and float wire above.
Frost Floor: A frost floor is an insulated sub-floor within the stifling well positionedbelow the frost line of the surrounding ground. The cold air spilling into the well ispartially confined to the area above the frost floor, while the warmer air from below can
Standard Operating Procedures for Hydrometric Surveys
58 November 2, 1998
not escape easily. This warmth retards the formation of ice within the well. Holes cut inthe frost floor allow the float and counterweight line to pass through.
Wells in the stream bank are normally encased with back-filled earth, which providessome insulation. However, ice plugs can still form in the well if cold air spills into it. Afrost floor may be enough to stop ice from forming as long as the water level remainsbelow the frost level of the surrounding soil.
Frost Tubes: Frost tubes have proven quite effective in overcoming ice in both exposedmetal and earth-protected stilling wells. A frost tube is an open-ended cylinder, usually25 cm in diameter, fastened vertically inside the stilling well. The bottom end is elevatedslightly above the well bottom; the top end extends to the well top, or to an elevationabove the maximum expected winter water level.
At stations where 305 mm ABS stilling wells have been installed, the well becomes thefrost tube and a quantity of oil sufficient to extend below the frost line or ice thickness ispoured into it. A 0.1-m column of oil in this diameter of pipe will require 7.3 litres of oil.
To prepare a frost tube, a non-toxic oil is poured into the top of the cylinder. The columnof oil that forms above the water forces the water surface in the cylinder below thesurrounding water level in the stilling well. The recorder float is then positioned in thecylinder where it will respond to the variation in the oil surface level.
Since the oil surface level stands higher than the true water level, a compensatingcorrection must be made to the record. The degree of correction will be proportional tothe amount and specific gravity of the added oil.
To quantify this initial correction, reinstall the float assembly and circle the position ofthe pen. Read the graduated float tape or mark the beaded wire opposite the recorderbase, and read the outside gauge. Remove the float from the tube before pouring the oil.Reinstall the float, circle pen and repeat readings as above. Differences in therelationship between pen/floatline and outside gauge is the correction for the quantity ofoil and its specific gravity. Set the recorder pen to the outside gauge for this andsubsequent station visits.
Oil Specification: An acceptable oil is ‘Esso Bayol 35M’ with a specific gravity of0.815. This oil is tasteless, colourless, odourless, and is used in food processing. Do notlet the oil spill from the frost tube into the stilling well, because it causes bacteria togrow on the water surface within the well. Non-toxic oil must be used. Kerosene andother petroleum oils must not be used for environmental reasons.
Discontinue using the frost tube at spring break-up time. If the cylinder is not designedand installed as a permanent fixture, the oil and cylinder must be removed from thestilling well before the rising water level forces the oil over top of the tube. Frost tubesdo not produce heat nor do they require any heat to be effective.
C. Hydrometric Survey Equipment
November 2, 1998 59
Spring Operations
Prior to spring break-up, stilling wells must be cleared of winter operations fixtures andany ice remaining in the well. Where the intakes are blocked with ice, the use of a steamgenerator may be needed to remove ice from the intakes and the well.
Inspect the well for possible structural damage that may have occurred during the winterseason. Check especially for vertical movement caused by frost heave. If signs of frostheave are evident, give special attention to the intake pipes, as they may be damaged atthe point of entry to the well. Inspect the outer ends of the intakes and remove anyattached ice from them.
Clean deposited silt from the stilling well bottom. Remember, in the next few monthswater will carry most of the annual silt deposit to the well. Flush all intake pipes andmake sure they are free and clear of obstruction. When flushing the intakes, observe thedischarge from the upper intakes. Finally be sure the intake valves are open beforeleaving the site.
In general, it is essential that the stilling well and the intakes are in good working order ifthe well is to provide accurate records through the upcoming spring runoff season.Corrective action for potential problems is far more difficult during spring when the wellis full and the intakes are all under water. Under these conditions, repairs or maintenancework may not be possible. Many water level records are lost as a result of improperpreparations prior to spring.
Ensure that the float and the suspension lines move freely and that they are clear of anypossible obstruction.
Spring Runoff
During high flows the water surface in the well appears to be excessively turbulent. Todampen the oscillation, close one of the upper intake valves and look for improvement.Slowly open the valve until you achieve a tolerable level of disturbance. For in-streaminstallations, when the water level exceeds the elevation of the top vent holes, block theholes to avoid further velocity turbulence. Note these actions on the station record or log.
If the water level should exceed the upper limit of float travel in the well, cut a hole inthe floor to allow passage of the float. This measure will provide additional distance forfloat travel which will in turn add to record collection. Manually pull the float throughthe hole in the floor to its upper limit of travel. Check to see if the counterweight hits thewell bottom. If it does, shorten the float line proportionately. Remove all buoyantmaterial from the floor to prevent it from obstructing the float line or restricting thefloat’s return passage through the hole when the water level recedes.
Inspect the streambank for possible cave-in or excessive erosion. If the stilling well isendangered, arrange for emergency corrective action. Until proper corrective actions canbe taken, the stilling well should be secured with a strong cable which can be anchored toinshore trees or other stable objects. This will prevent tilting or loss of the well.
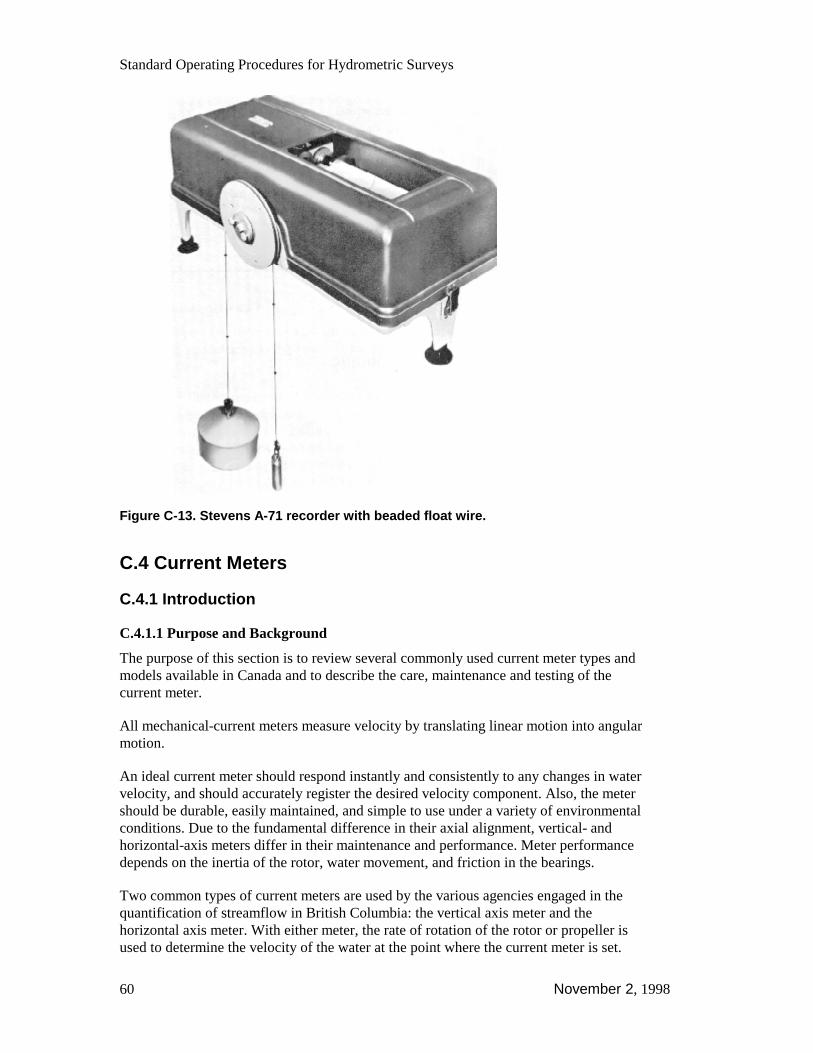
Standard Operating Procedures for Hydrometric Surveys
60 November 2, 1998
Figure C-13. Stevens A-71 recorder with beaded float wire.
C.4 Current Meters
C.4.1 Introduction
C.4.1.1 Purpose and Background
The purpose of this section is to review several commonly used current meter types andmodels available in Canada and to describe the care, maintenance and testing of thecurrent meter.
All mechanical-current meters measure velocity by translating linear motion into angularmotion.
An ideal current meter should respond instantly and consistently to any changes in watervelocity, and should accurately register the desired velocity component. Also, the metershould be durable, easily maintained, and simple to use under a variety of environmentalconditions. Due to the fundamental difference in their axial alignment, vertical- andhorizontal-axis meters differ in their maintenance and performance. Meter performancedepends on the inertia of the rotor, water movement, and friction in the bearings.
Two common types of current meters are used by the various agencies engaged in thequantification of streamflow in British Columbia: the vertical axis meter and thehorizontal axis meter. With either meter, the rate of rotation of the rotor or propeller isused to determine the velocity of the water at the point where the current meter is set.
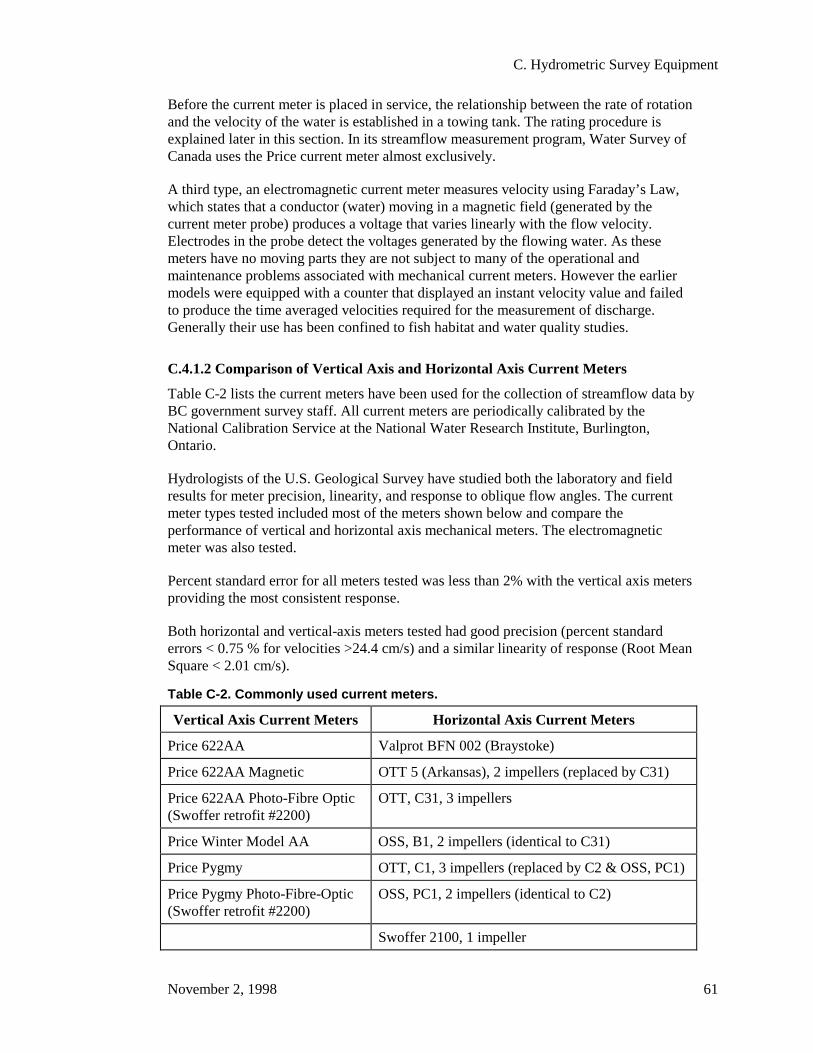
C. Hydrometric Survey Equipment
November 2, 1998 61
Before the current meter is placed in service, the relationship between the rate of rotationand the velocity of the water is established in a towing tank. The rating procedure isexplained later in this section. In its streamflow measurement program, Water Survey ofCanada uses the Price current meter almost exclusively.
A third type, an electromagnetic current meter measures velocity using Faraday’s Law,which states that a conductor (water) moving in a magnetic field (generated by thecurrent meter probe) produces a voltage that varies linearly with the flow velocity.Electrodes in the probe detect the voltages generated by the flowing water. As thesemeters have no moving parts they are not subject to many of the operational andmaintenance problems associated with mechanical current meters. However the earliermodels were equipped with a counter that displayed an instant velocity value and failedto produce the time averaged velocities required for the measurement of discharge.Generally their use has been confined to fish habitat and water quality studies.
C.4.1.2 Comparison of Vertical Axis and Horizontal Axis Current Meters
Table C-2 lists the current meters have been used for the collection of streamflow data byBC government survey staff. All current meters are periodically calibrated by theNational Calibration Service at the National Water Research Institute, Burlington,Ontario.
Hydrologists of the U.S. Geological Survey have studied both the laboratory and fieldresults for meter precision, linearity, and response to oblique flow angles. The currentmeter types tested included most of the meters shown below and compare theperformance of vertical and horizontal axis mechanical meters. The electromagneticmeter was also tested.
Percent standard error for all meters tested was less than 2% with the vertical axis metersproviding the most consistent response.
Both horizontal and vertical-axis meters tested had good precision (percent standarderrors < 0.75 % for velocities >24.4 cm/s) and a similar linearity of response (Root MeanSquare < 2.01 cm/s).
Table C-2. Commonly used current meters.
Vertical Axis Current Meters Horizontal Axis Current Meters
Price 622AA Valprot BFN 002 (Braystoke)
Price 622AA Magnetic OTT 5 (Arkansas), 2 impellers (replaced by C31)
Price 622AA Photo-Fibre Optic(Swoffer retrofit #2200)
OTT, C31, 3 impellers
Price Winter Model AA OSS, B1, 2 impellers (identical to C31)
Price Pygmy OTT, C1, 3 impellers (replaced by C2 & OSS, PC1)
Price Pygmy Photo-Fibre-Optic(Swoffer retrofit #2200)
OSS, PC1, 2 impellers (identical to C2)
Swoffer 2100, 1 impeller
Standard Operating Procedures for Hydrometric Surveys
62 November 2, 1998
C.4.1.3 Oblique Flow Tests
The magnitude of error for horizontal-axis meters is usually smaller than those forvertical-axis meters in oblique flows Two horizontal-axis meters, the Ott C-31 meterwith A and R impellers had the smallest error in oblique flows. At angles between ±100,errors ranged from -7.87% to 8.92% for the vertical-axis meters and from 2.02% to3.77% for the horizontal-axis meters.
Unfortunately neither the Ott C2 nor the OSS PC1 were included in the above study.(The Ott and OSS meters are identical - components are interchangeable). However, theimpellers supplied with these meters accurately compensate for angular flow to the limitsspecified by the manufacturers (Table C-5). These meters have, together with the earliermodel Ott C1, served as the preferred meter for the measurement of flow in watercoursesless than 0.3 m deep.
The Swoffer retrofitted Price type AA and the Price Pygmy do not have relatively largechambers on the upper section of yoke and therefore present a more symmetrical shapeto the current. The presence of the contact chamber is one of the factors listed as apossible cause of the rather large errors encountered in the oblique flow tests on standardPrice meters It is therefore likely that the absence of these chambers on the retrofitmodels will produce more accurate results in oblique flows.
The electromagnetic current meter has smaller errors than the vertical axis meters formost angles tested.
C.4.2 Vertical Axis Current Meters
C.4.2.2 General
Three models of vertical axis meters are in general use in Canada: the Price 622AAmeter, the WSC winter meter, and the Pygmy meter. This section describes these meters.
C.4.2.3 Price 622AA
The Price 622AA meter (Figures C-14 and C-15) is the most common vertical shaftmeter and is often considered the “standard” for discharge measurement. It has beensubjected to extensive research and experimentation and shown to be well suited to awide variety of field conditions. The Price 622AA is the principal meter used by theWSC and many other agencies to determine discharge.
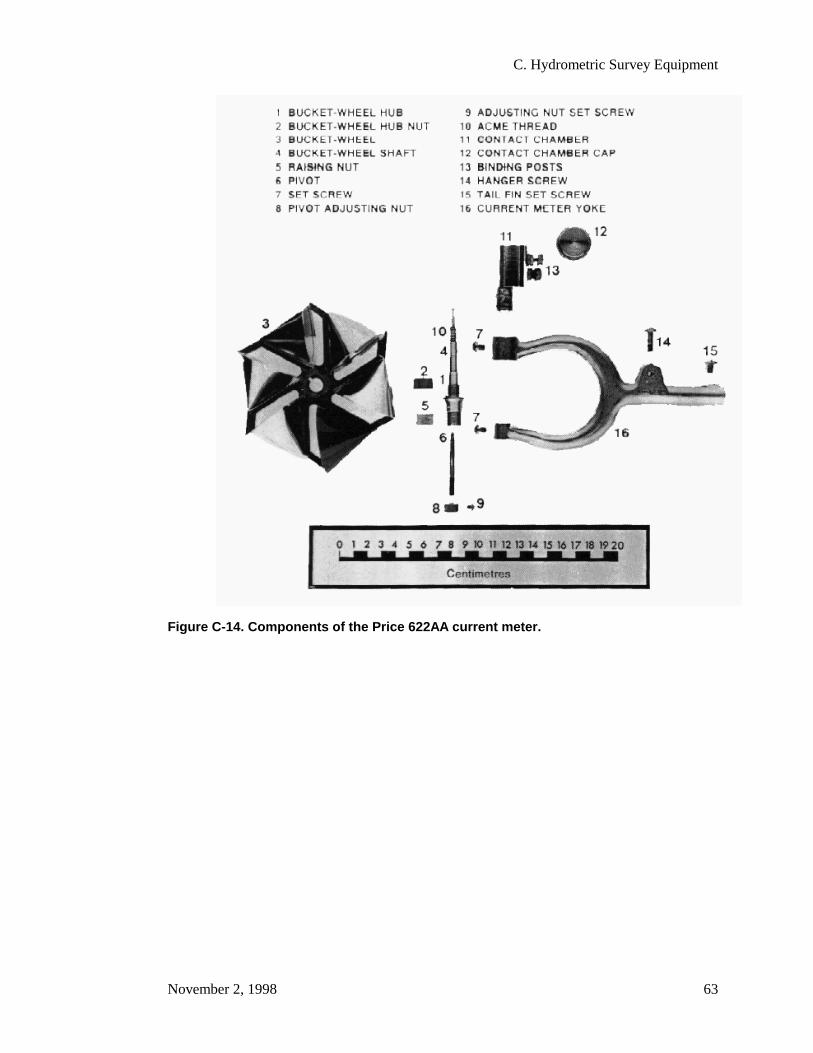
C. Hydrometric Survey Equipment
November 2, 1998 63
Figure C-14. Components of the Price 622AA current meter.
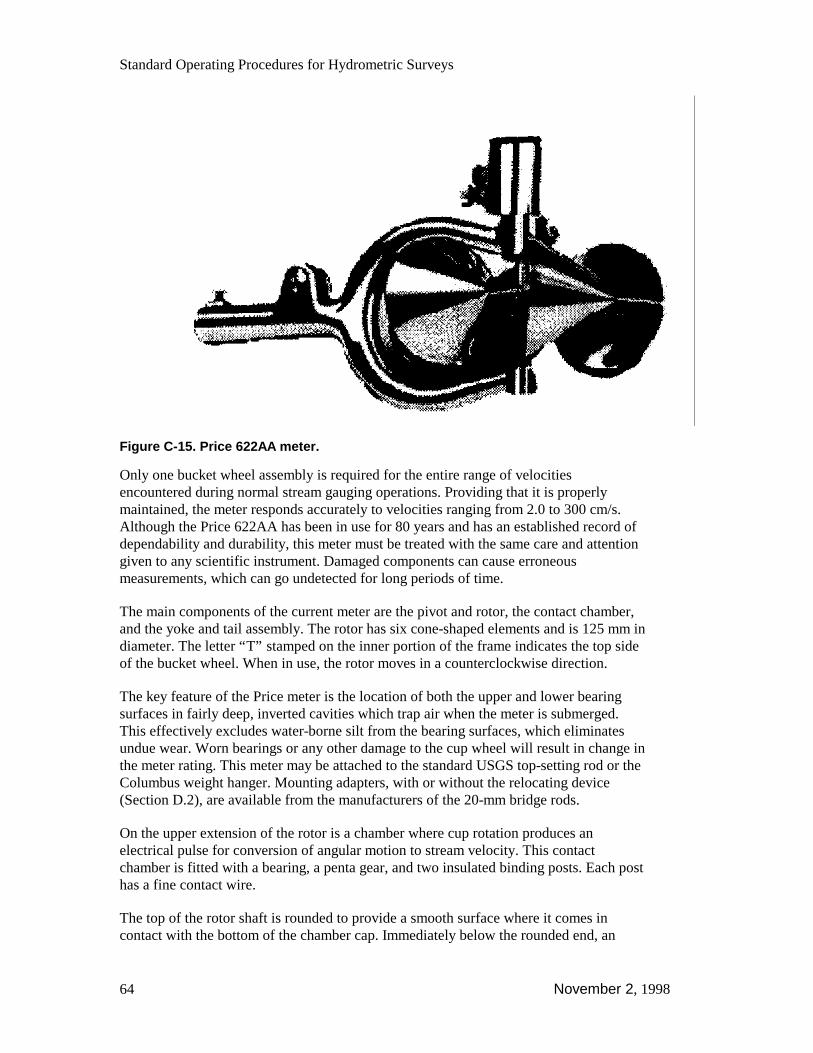
Standard Operating Procedures for Hydrometric Surveys
64 November 2, 1998
Figure C-15. Price 622AA meter.
Only one bucket wheel assembly is required for the entire range of velocitiesencountered during normal stream gauging operations. Providing that it is properlymaintained, the meter responds accurately to velocities ranging from 2.0 to 300 cm/s.Although the Price 622AA has been in use for 80 years and has an established record ofdependability and durability, this meter must be treated with the same care and attentiongiven to any scientific instrument. Damaged components can cause erroneousmeasurements, which can go undetected for long periods of time.
The main components of the current meter are the pivot and rotor, the contact chamber,and the yoke and tail assembly. The rotor has six cone-shaped elements and is 125 mm indiameter. The letter “T” stamped on the inner portion of the frame indicates the top sideof the bucket wheel. When in use, the rotor moves in a counterclockwise direction.
The key feature of the Price meter is the location of both the upper and lower bearingsurfaces in fairly deep, inverted cavities which trap air when the meter is submerged.This effectively excludes water-borne silt from the bearing surfaces, which eliminatesundue wear. Worn bearings or any other damage to the cup wheel will result in change inthe meter rating. This meter may be attached to the standard USGS top-setting rod or theColumbus weight hanger. Mounting adapters, with or without the relocating device(Section D.2), are available from the manufacturers of the 20-mm bridge rods.
On the upper extension of the rotor is a chamber where cup rotation produces anelectrical pulse for conversion of angular motion to stream velocity. This contactchamber is fitted with a bearing, a penta gear, and two insulated binding posts. Each posthas a fine contact wire.
The top of the rotor shaft is rounded to provide a smooth surface where it comes incontact with the bottom of the chamber cap. Immediately below the rounded end, an
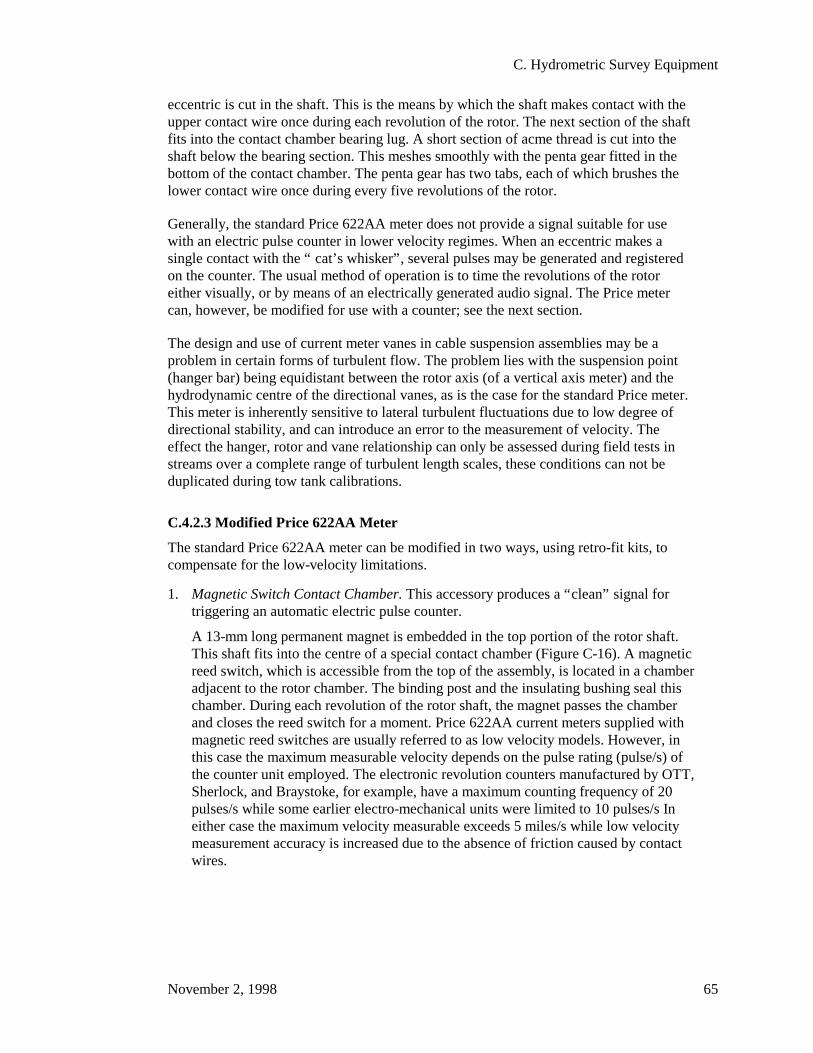
C. Hydrometric Survey Equipment
November 2, 1998 65
eccentric is cut in the shaft. This is the means by which the shaft makes contact with theupper contact wire once during each revolution of the rotor. The next section of the shaftfits into the contact chamber bearing lug. A short section of acme thread is cut into theshaft below the bearing section. This meshes smoothly with the penta gear fitted in thebottom of the contact chamber. The penta gear has two tabs, each of which brushes thelower contact wire once during every five revolutions of the rotor.
Generally, the standard Price 622AA meter does not provide a signal suitable for usewith an electric pulse counter in lower velocity regimes. When an eccentric makes asingle contact with the “ cat’s whisker”, several pulses may be generated and registeredon the counter. The usual method of operation is to time the revolutions of the rotoreither visually, or by means of an electrically generated audio signal. The Price metercan, however, be modified for use with a counter; see the next section.
The design and use of current meter vanes in cable suspension assemblies may be aproblem in certain forms of turbulent flow. The problem lies with the suspension point(hanger bar) being equidistant between the rotor axis (of a vertical axis meter) and thehydrodynamic centre of the directional vanes, as is the case for the standard Price meter.This meter is inherently sensitive to lateral turbulent fluctuations due to low degree ofdirectional stability, and can introduce an error to the measurement of velocity. Theeffect the hanger, rotor and vane relationship can only be assessed during field tests instreams over a complete range of turbulent length scales, these conditions can not beduplicated during tow tank calibrations.
C.4.2.3 Modified Price 622AA Meter
The standard Price 622AA meter can be modified in two ways, using retro-fit kits, tocompensate for the low-velocity limitations.
1. Magnetic Switch Contact Chamber. This accessory produces a “clean” signal fortriggering an automatic electric pulse counter.
A 13-mm long permanent magnet is embedded in the top portion of the rotor shaft.This shaft fits into the centre of a special contact chamber (Figure C-16). A magneticreed switch, which is accessible from the top of the assembly, is located in a chamberadjacent to the rotor chamber. The binding post and the insulating bushing seal thischamber. During each revolution of the rotor shaft, the magnet passes the chamberand closes the reed switch for a moment. Price 622AA current meters supplied withmagnetic reed switches are usually referred to as low velocity models. However, inthis case the maximum measurable velocity depends on the pulse rating (pulse/s) ofthe counter unit employed. The electronic revolution counters manufactured by OTT,Sherlock, and Braystoke, for example, have a maximum counting frequency of 20pulses/s while some earlier electro-mechanical units were limited to 10 pulses/s Ineither case the maximum velocity measurable exceeds 5 miles/s while low velocitymeasurement accuracy is increased due to the absence of friction caused by contactwires.
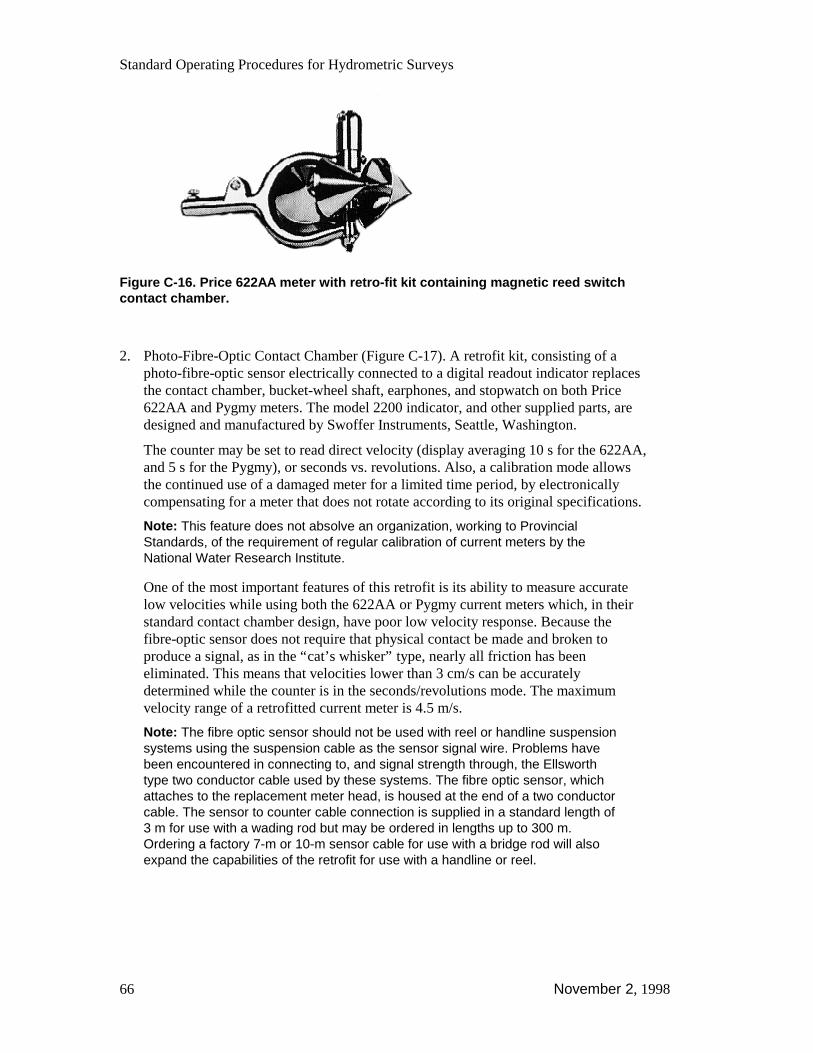
Standard Operating Procedures for Hydrometric Surveys
66 November 2, 1998
Figure C-16. Price 622AA meter with retro-fit kit containing magnetic reed switchcontact chamber.
2. Photo-Fibre-Optic Contact Chamber (Figure C-17). A retrofit kit, consisting of aphoto-fibre-optic sensor electrically connected to a digital readout indicator replacesthe contact chamber, bucket-wheel shaft, earphones, and stopwatch on both Price622AA and Pygmy meters. The model 2200 indicator, and other supplied parts, aredesigned and manufactured by Swoffer Instruments, Seattle, Washington.
The counter may be set to read direct velocity (display averaging 10 s for the 622AA,and 5 s for the Pygmy), or seconds vs. revolutions. Also, a calibration mode allowsthe continued use of a damaged meter for a limited time period, by electronicallycompensating for a meter that does not rotate according to its original specifications.
Note: This feature does not absolve an organization, working to ProvincialStandards, of the requirement of regular calibration of current meters by theNational Water Research Institute.
One of the most important features of this retrofit is its ability to measure accuratelow velocities while using both the 622AA or Pygmy current meters which, in theirstandard contact chamber design, have poor low velocity response. Because thefibre-optic sensor does not require that physical contact be made and broken toproduce a signal, as in the “cat’s whisker” type, nearly all friction has beeneliminated. This means that velocities lower than 3 cm/s can be accuratelydetermined while the counter is in the seconds/revolutions mode. The maximumvelocity range of a retrofitted current meter is 4.5 m/s.
Note: The fibre optic sensor should not be used with reel or handline suspensionsystems using the suspension cable as the sensor signal wire. Problems havebeen encountered in connecting to, and signal strength through, the Ellsworthtype two conductor cable used by these systems. The fibre optic sensor, whichattaches to the replacement meter head, is housed at the end of a two conductorcable. The sensor to counter cable connection is supplied in a standard length of3 m for use with a wading rod but may be ordered in lengths up to 300 m.Ordering a factory 7-m or 10-m sensor cable for use with a bridge rod will alsoexpand the capabilities of the retrofit for use with a handline or reel.
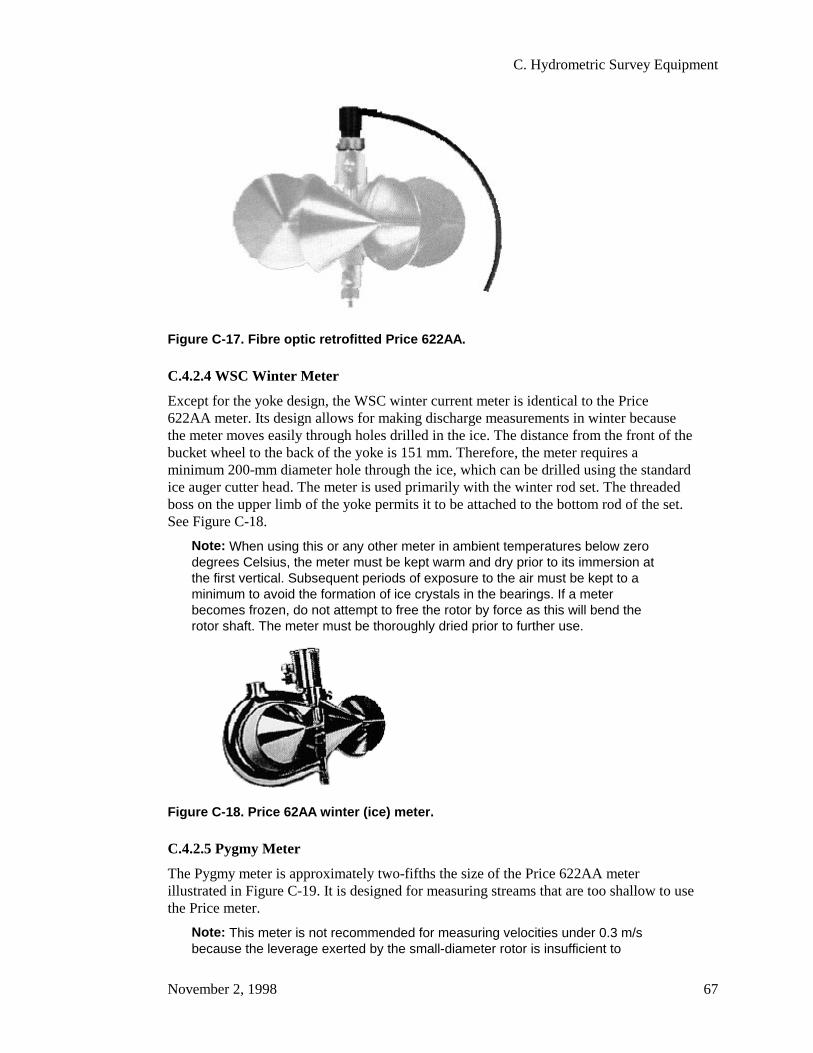
C. Hydrometric Survey Equipment
November 2, 1998 67
Figure C-17. Fibre optic retrofitted Price 622AA.
C.4.2.4 WSC Winter Meter
Except for the yoke design, the WSC winter current meter is identical to the Price622AA meter. Its design allows for making discharge measurements in winter becausethe meter moves easily through holes drilled in the ice. The distance from the front of thebucket wheel to the back of the yoke is 151 mm. Therefore, the meter requires aminimum 200-mm diameter hole through the ice, which can be drilled using the standardice auger cutter head. The meter is used primarily with the winter rod set. The threadedboss on the upper limb of the yoke permits it to be attached to the bottom rod of the set.See Figure C-18.
Note: When using this or any other meter in ambient temperatures below zerodegrees Celsius, the meter must be kept warm and dry prior to its immersion atthe first vertical. Subsequent periods of exposure to the air must be kept to aminimum to avoid the formation of ice crystals in the bearings. If a meterbecomes frozen, do not attempt to free the rotor by force as this will bend therotor shaft. The meter must be thoroughly dried prior to further use.
Figure C-18. Price 62AA winter (ice) meter.
C.4.2.5 Pygmy Meter
The Pygmy meter is approximately two-fifths the size of the Price 622AA meterillustrated in Figure C-19. It is designed for measuring streams that are too shallow to usethe Price meter.
Note: This meter is not recommended for measuring velocities under 0.3 m/sbecause the leverage exerted by the small-diameter rotor is insufficient to

Standard Operating Procedures for Hydrometric Surveys
68 November 2, 1998
consistently overcome the variable frictional component in the contact chamber;the result is in poor accuracy at low velocity. The photo-fibre-optic sensor retrofitkit, described earlier, converts the Pygmy meter to an instrument capable ofaccurately measuring velocities as low as 0.03 m/s.
As with all other current meters, individual calibrations are maintained for the Pygmymeters. The major difference is that the Pygmy meters are towed at lower velocities,from 2.5 to 140 cm/s.
The two meters differ in other significant ways. The Pygmy meter contact chamber andyoke are one unit. The chamber has only one contact wire that signals each revolution ofthe bucket wheel shaft. The meter is meant to be mounted on a wading rod. Because it isused in very shallow depths, it has no tailpiece nor can it be suspended from a cable.
The bucket wheel is only 50.8 mm in diameter, and it revolves 23 times faster than thelarger Price meter. Unless an automatic pulse counting device is used, the rapidlyrevolving bucket wheel limits the meter to measuring velocities that are 1 m/s or less.When not in use, the steel meter pivot must be replaced with the special brass shippingpivot. The bucket wheel is not equipped with a raising nut, and the pivot and bearing canbe damaged if the steel pivot is not replaced when the meter is not being used.

C. Hydrometric Survey Equipment
November 2, 1998 69
Figure C-19. Price 622AA meter.
C.4.2.6 Maintaining the Meter
The life expectancy and daily efficiency of a current meter depend largely on thethoroughness with which the operator cleans and lubricates the moving parts of theinstrument.
Cleaning and lubricating the Price type current meters is simple. It takes only a fewminutes and should not be postponed or neglected. During this process, all parts must becarefully examined to ensure that they are working. It is normal practice to clean andlubricate at the end of each day. However, if the meter has been used in a stream that isheavily laden with suspended sediment, clean the meter immediately after themeasurement. This helps to prevent abrasive particles from causing premature andunnecessary wear to the bearing surfaces.
Note: If water is already trapped in the head, and in the pivot bearing on theunderside of the bucket wheel, applying oil to the pivot may increase the wear.
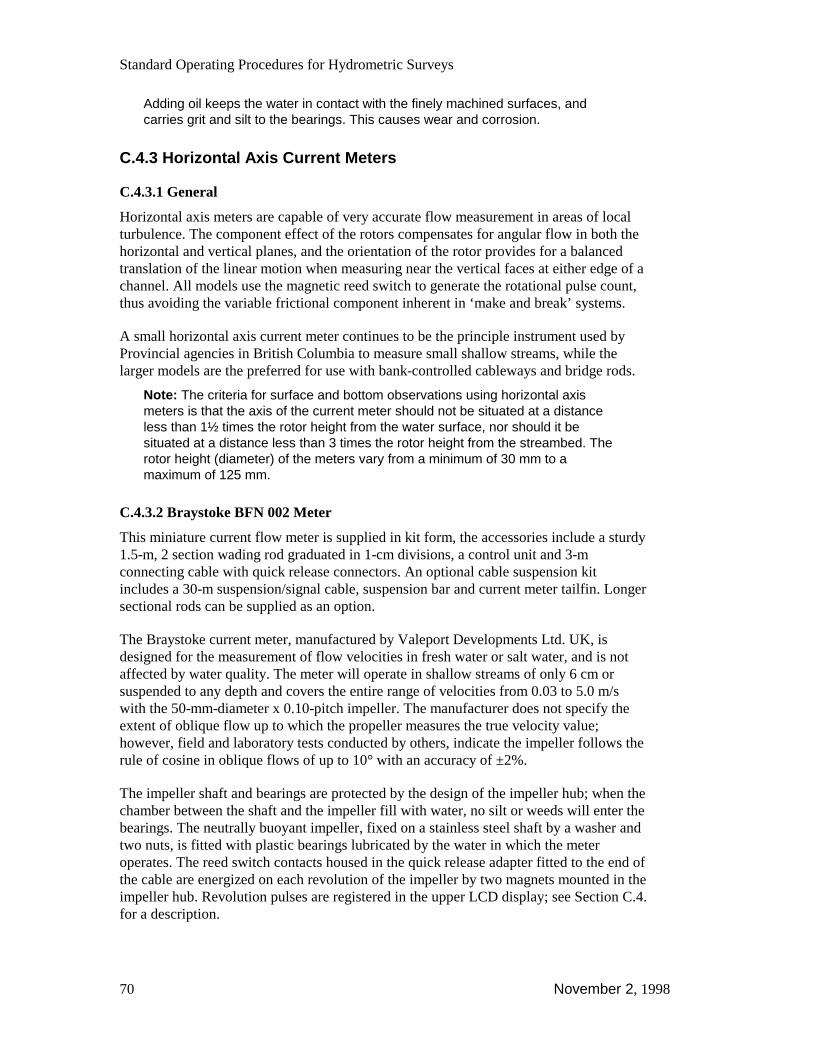
Standard Operating Procedures for Hydrometric Surveys
70 November 2, 1998
Adding oil keeps the water in contact with the finely machined surfaces, andcarries grit and silt to the bearings. This causes wear and corrosion.
C.4.3 Horizontal Axis Current Meters
C.4.3.1 General
Horizontal axis meters are capable of very accurate flow measurement in areas of localturbulence. The component effect of the rotors compensates for angular flow in both thehorizontal and vertical planes, and the orientation of the rotor provides for a balancedtranslation of the linear motion when measuring near the vertical faces at either edge of achannel. All models use the magnetic reed switch to generate the rotational pulse count,thus avoiding the variable frictional component inherent in ‘make and break’ systems.
A small horizontal axis current meter continues to be the principle instrument used byProvincial agencies in British Columbia to measure small shallow streams, while thelarger models are the preferred for use with bank-controlled cableways and bridge rods.
Note: The criteria for surface and bottom observations using horizontal axismeters is that the axis of the current meter should not be situated at a distanceless than 1½ times the rotor height from the water surface, nor should it besituated at a distance less than 3 times the rotor height from the streambed. Therotor height (diameter) of the meters vary from a minimum of 30 mm to amaximum of 125 mm.
C.4.3.2 Braystoke BFN 002 Meter
This miniature current flow meter is supplied in kit form, the accessories include a sturdy1.5-m, 2 section wading rod graduated in 1-cm divisions, a control unit and 3-mconnecting cable with quick release connectors. An optional cable suspension kitincludes a 30-m suspension/signal cable, suspension bar and current meter tailfin. Longersectional rods can be supplied as an option.
The Braystoke current meter, manufactured by Valeport Developments Ltd. UK, isdesigned for the measurement of flow velocities in fresh water or salt water, and is notaffected by water quality. The meter will operate in shallow streams of only 6 cm orsuspended to any depth and covers the entire range of velocities from 0.03 to 5.0 m/swith the 50-mm-diameter x 0.10-pitch impeller. The manufacturer does not specify theextent of oblique flow up to which the propeller measures the true velocity value;however, field and laboratory tests conducted by others, indicate the impeller follows therule of cosine in oblique flows of up to 10° with an accuracy of ±2%.
The impeller shaft and bearings are protected by the design of the impeller hub; when thechamber between the shaft and the impeller fill with water, no silt or weeds will enter thebearings. The neutrally buoyant impeller, fixed on a stainless steel shaft by a washer andtwo nuts, is fitted with plastic bearings lubricated by the water in which the meteroperates. The reed switch contacts housed in the quick release adapter fitted to the end ofthe cable are energized on each revolution of the impeller by two magnets mounted in theimpeller hub. Revolution pulses are registered in the upper LCD display; see Section C.4.for a description.
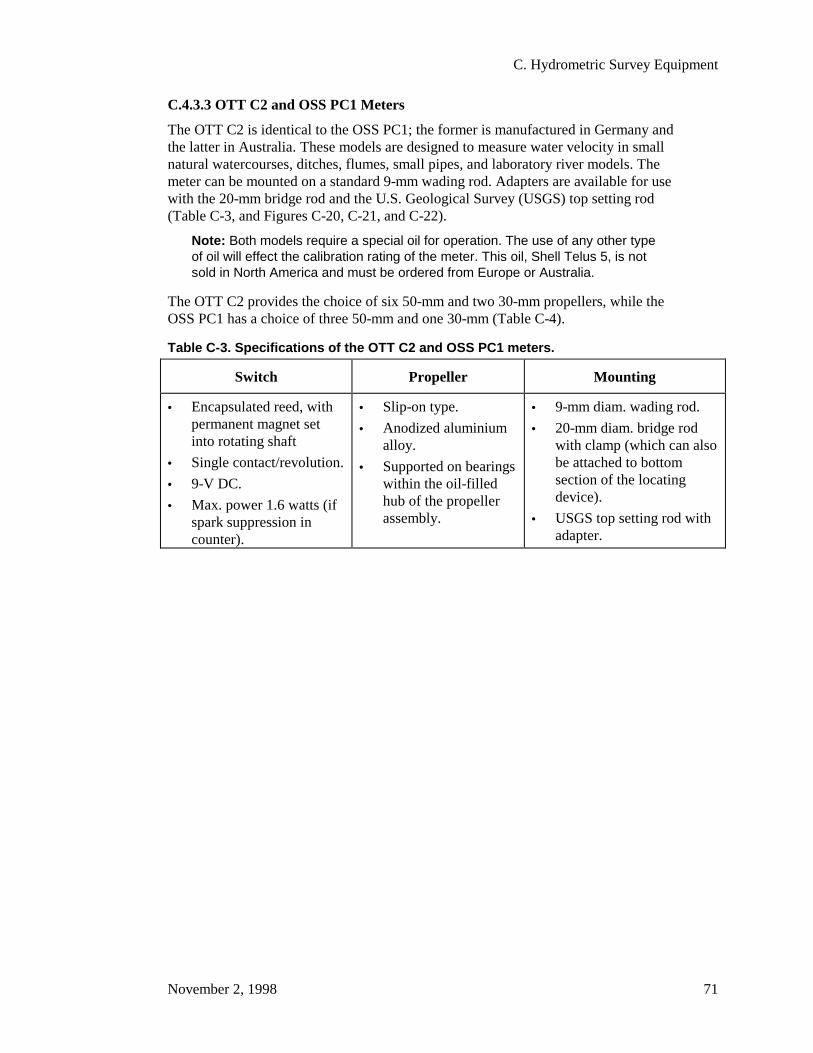
C. Hydrometric Survey Equipment
November 2, 1998 71
C.4.3.3 OTT C2 and OSS PC1 Meters
The OTT C2 is identical to the OSS PC1; the former is manufactured in Germany andthe latter in Australia. These models are designed to measure water velocity in smallnatural watercourses, ditches, flumes, small pipes, and laboratory river models. Themeter can be mounted on a standard 9-mm wading rod. Adapters are available for usewith the 20-mm bridge rod and the U.S. Geological Survey (USGS) top setting rod(Table C-3, and Figures C-20, C-21, and C-22).
Note: Both models require a special oil for operation. The use of any other typeof oil will effect the calibration rating of the meter. This oil, Shell Telus 5, is notsold in North America and must be ordered from Europe or Australia.
The OTT C2 provides the choice of six 50-mm and two 30-mm propellers, while theOSS PC1 has a choice of three 50-mm and one 30-mm (Table C-4).
Table C-3. Specifications of the OTT C2 and OSS PC1 meters.
Switch Propeller Mounting
• Encapsulated reed, withpermanent magnet setinto rotating shaft
• Single contact/revolution.
• 9-V DC.
• Max. power 1.6 watts (ifspark suppression incounter).
• Slip-on type.
• Anodized aluminiumalloy.
• Supported on bearingswithin the oil-filledhub of the propellerassembly.
• 9-mm diam. wading rod.
• 20-mm diam. bridge rodwith clamp (which can alsobe attached to bottomsection of the locatingdevice).
• USGS top setting rod withadapter.
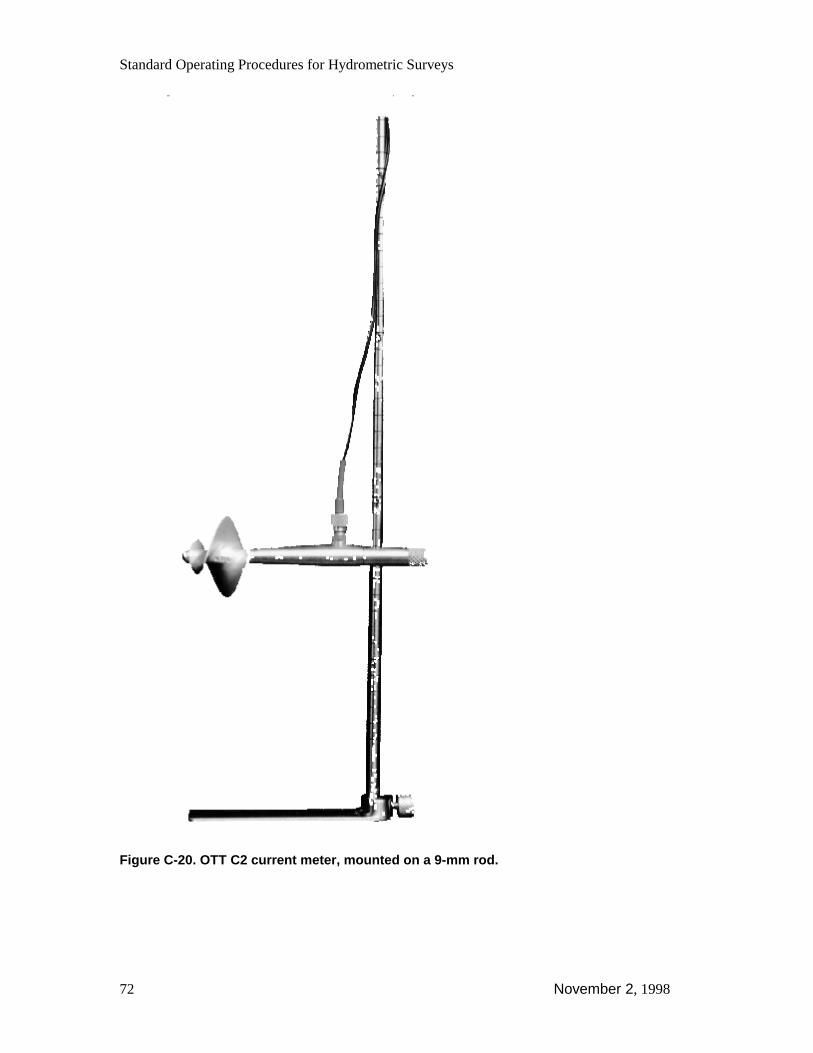
Standard Operating Procedures for Hydrometric Surveys
72 November 2, 1998
Figure C-20. OTT C2 current meter, mounted on a 9-mm rod.

C. Hydrometric Survey Equipment
November 2, 1998 73
Figure C-21. OSS PC1 with adapter for use on a USGS top setting rod.
Table C-4. Description of propellers for the OTT C2 and OSS PC1 meters.
Propellernumber
(engraved)
Diam. &pitch
(mm & m)
Max. watervelocity(m/s)
Startingspeed(m/s)
Range ofcomponent of
effect (degrees)
1 a 500.05
2.0 (1.0) b 0.025 30
2 500.10
4.0 (2.0) 0.030 20
3 a 500.60
6.0 (4.0) 0.035 10
4 500.60
7.5 (5.0) 0.060 5
5 a 300.05
2.0 (1.0) 0.050 20
6 300.10
4.0 (2.0) 0.055 10
a Propellers supplied by OTT are also available with the OSS PC1. Allpropellers can be used with either meter.b Maximum water velocities, shown in brackets, are when the meters are usedwith electro-mechanical type counters such as the OTT-Z21 (10 pulses/s).Electronic counters such as the Z210, CMC 20, or 200 accept 20 pulses/s.
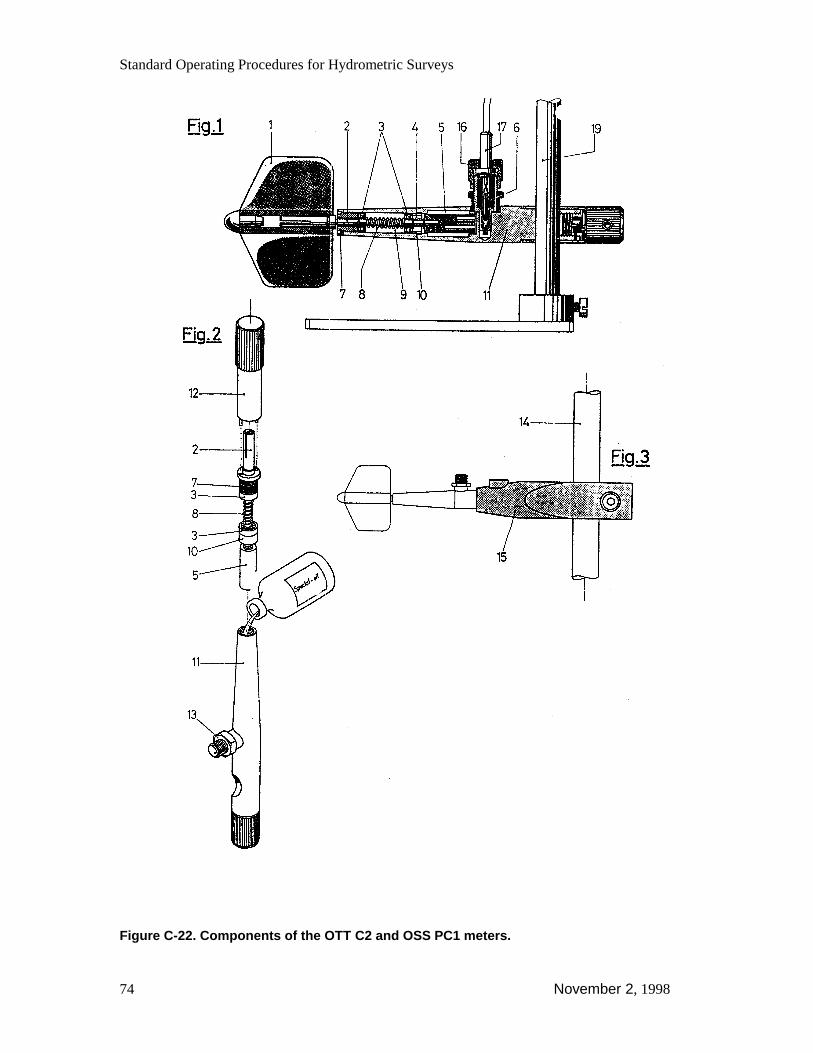
Standard Operating Procedures for Hydrometric Surveys
74 November 2, 1998
Figure C-22. Components of the OTT C2 and OSS PC1 meters.
C. Hydrometric Survey Equipment
November 2, 1998 75
C.4.3.4 Universal OTT C31 and OSS B1 Meters
The OTT C31 is identical to the OSS B1; the former is manufactured in Germany and thelatter in Australia. These current meters are used to determine the flow velocity of waterin open channels and the sea, as well as in pressure pipes. These meters can be usedunder extreme conditions with the following methods of suspension:
• 20-mm wading or bridge rods with direct connection to the rod or the relocatingdevice casing (Figures C-23 and C-24).
• Two conductor cable and weight assemblies of the following types, available fromeither manufacturer:• Handline and hanger with a choice of 5-kg or 10-kg weights.• Portable winch, standard weights, and hanger.• Portable winch or double drum (shore-controlled) cableway winch with 25-, 50-,
or 100-kg “middle piece” weights equipped with electrical ground feeler (FigureC-25).
Other special options are available for integration measurements, e.g. pressure pipeinstallations and sliding meter attachments.
Table C-5 lists propellers available from the two manufacturers for the OTT C31 and theOSS B1, together with the velocity range and component effect for each propeller. Themaximum water velocities shown can be measured only by means of counters with acounting rate of up to 20 rev/s.
As with the small propeller meters, the components of the OTT and OSS meters areinterchangeable.

Standard Operating Procedures for Hydrometric Surveys
76 November 2, 1998
Figure C-23. OSS B1 current meter mounted on a 20-mm graduated rod. This unitmay also be attached to a relocating device.

C. Hydrometric Survey Equipment
November 2, 1998 77
Figure C-24. OTT C31 current meter fitted on a 20-mm rod, with relocating device.Note that the locating device, at top, is aligned with a meter.
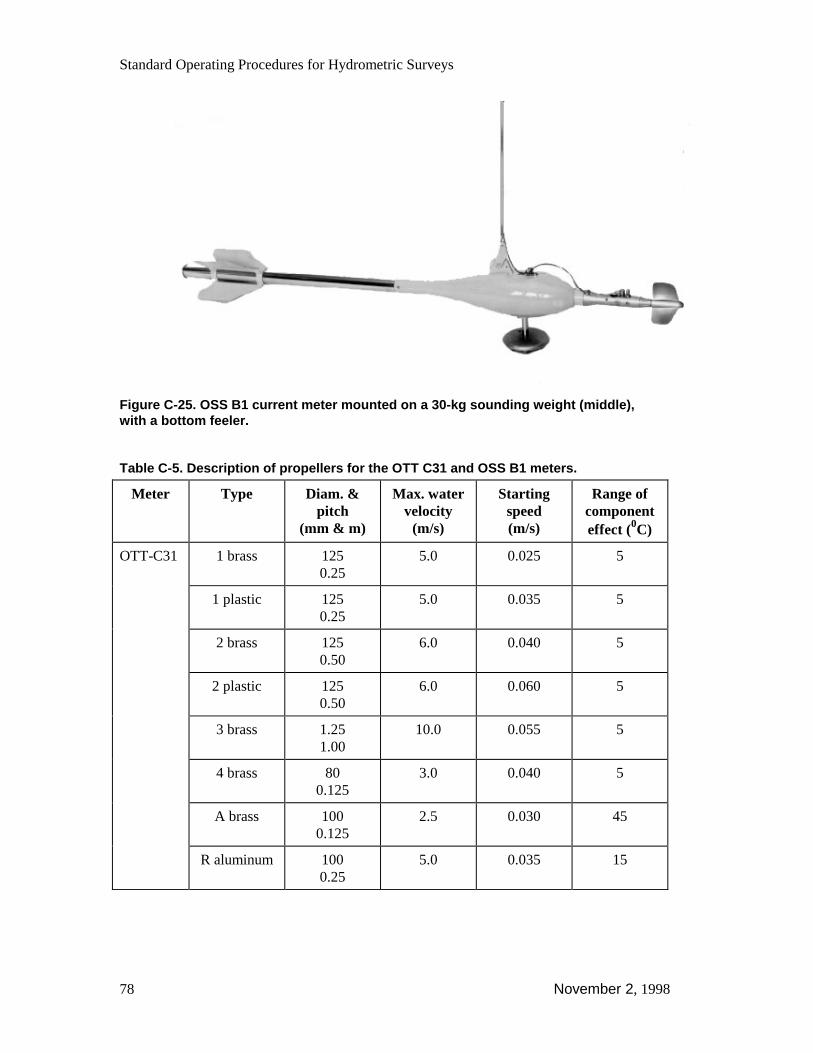
Standard Operating Procedures for Hydrometric Surveys
78 November 2, 1998
Figure C-25. OSS B1 current meter mounted on a 30-kg sounding weight (middle),with a bottom feeler.
Table C-5. Description of propellers for the OTT C31 and OSS B1 meters.
Meter Type Diam. &pitch
(mm & m)
Max. watervelocity(m/s)
Startingspeed(m/s)
Range ofcomponenteffect (0C)
OTT-C31 1 brass 1250.25
5.0 0.025 5
1 plastic 1250.25
5.0 0.035 5
2 brass 1250.50
6.0 0.040 5
2 plastic 1250.50
6.0 0.060 5
3 brass 1.251.00
10.0 0.055 5
4 brass 800.125
3.0 0.040 5
A brass 1000.125
2.5 0.030 45
R aluminum 1000.25
5.0 0.035 15
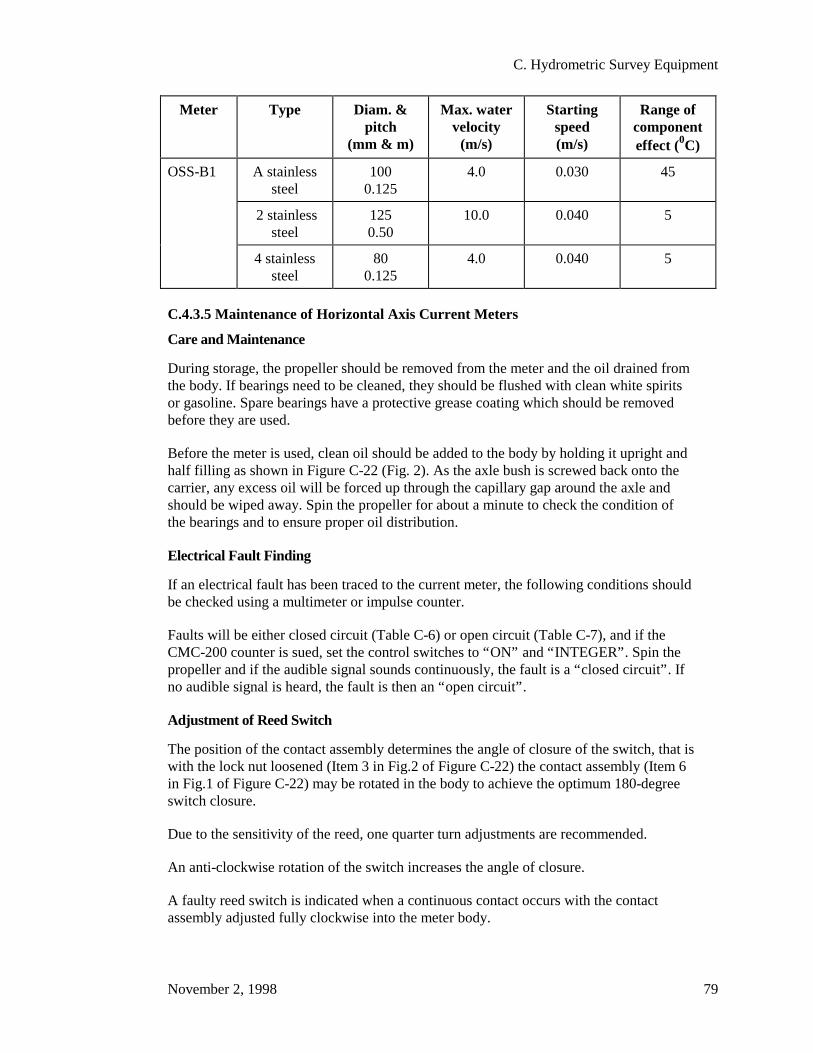
C. Hydrometric Survey Equipment
November 2, 1998 79
Meter Type Diam. &pitch
(mm & m)
Max. watervelocity(m/s)
Startingspeed(m/s)
Range ofcomponenteffect (0C)
OSS-B1 A stainlesssteel
1000.125
4.0 0.030 45
2 stainlesssteel
1250.50
10.0 0.040 5
4 stainlesssteel
800.125
4.0 0.040 5
C.4.3.5 Maintenance of Horizontal Axis Current Meters
Care and Maintenance
During storage, the propeller should be removed from the meter and the oil drained fromthe body. If bearings need to be cleaned, they should be flushed with clean white spiritsor gasoline. Spare bearings have a protective grease coating which should be removedbefore they are used.
Before the meter is used, clean oil should be added to the body by holding it upright andhalf filling as shown in Figure C-22 (Fig. 2). As the axle bush is screwed back onto thecarrier, any excess oil will be forced up through the capillary gap around the axle andshould be wiped away. Spin the propeller for about a minute to check the condition ofthe bearings and to ensure proper oil distribution.
Electrical Fault Finding
If an electrical fault has been traced to the current meter, the following conditions shouldbe checked using a multimeter or impulse counter.
Faults will be either closed circuit (Table C-6) or open circuit (Table C-7), and if theCMC-200 counter is sued, set the control switches to “ON” and “INTEGER”. Spin thepropeller and if the audible signal sounds continuously, the fault is a “closed circuit”. Ifno audible signal is heard, the fault is then an “open circuit”.
Adjustment of Reed Switch
The position of the contact assembly determines the angle of closure of the switch, that iswith the lock nut loosened (Item 3 in Fig.2 of Figure C-22) the contact assembly (Item 6in Fig.1 of Figure C-22) may be rotated in the body to achieve the optimum 180-degreeswitch closure.
Due to the sensitivity of the reed, one quarter turn adjustments are recommended.
An anti-clockwise rotation of the switch increases the angle of closure.
A faulty reed switch is indicated when a continuous contact occurs with the contactassembly adjusted fully clockwise into the meter body.
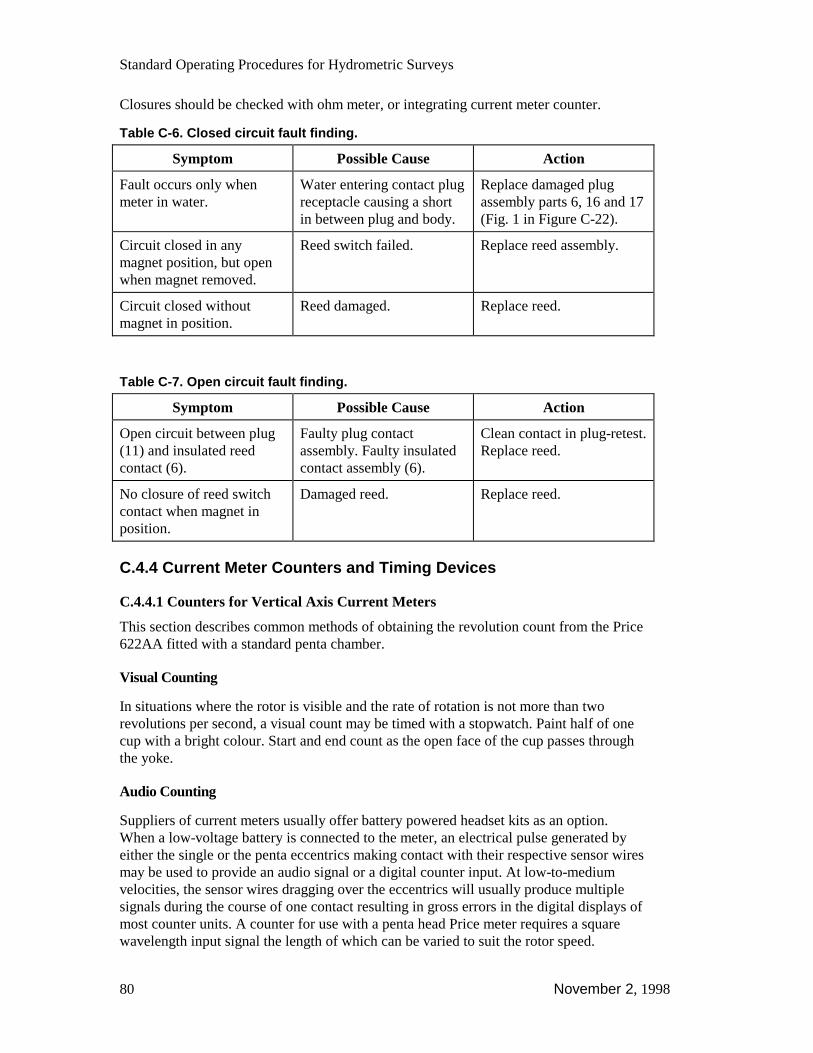
Standard Operating Procedures for Hydrometric Surveys
80 November 2, 1998
Closures should be checked with ohm meter, or integrating current meter counter.
Table C-6. Closed circuit fault finding.
Symptom Possible Cause Action
Fault occurs only whenmeter in water.
Water entering contact plugreceptacle causing a shortin between plug and body.
Replace damaged plugassembly parts 6, 16 and 17(Fig. 1 in Figure C-22).
Circuit closed in anymagnet position, but openwhen magnet removed.
Reed switch failed. Replace reed assembly.
Circuit closed withoutmagnet in position.
Reed damaged. Replace reed.
Table C-7. Open circuit fault finding.
Symptom Possible Cause Action
Open circuit between plug(11) and insulated reedcontact (6).
Faulty plug contactassembly. Faulty insulatedcontact assembly (6).
Clean contact in plug-retest.Replace reed.
No closure of reed switchcontact when magnet inposition.
Damaged reed. Replace reed.
C.4.4 Current Meter Counters and Timing Devices
C.4.4.1 Counters for Vertical Axis Current Meters
This section describes common methods of obtaining the revolution count from the Price622AA fitted with a standard penta chamber.
Visual Counting
In situations where the rotor is visible and the rate of rotation is not more than tworevolutions per second, a visual count may be timed with a stopwatch. Paint half of onecup with a bright colour. Start and end count as the open face of the cup passes throughthe yoke.
Audio Counting
Suppliers of current meters usually offer battery powered headset kits as an option.When a low-voltage battery is connected to the meter, an electrical pulse generated byeither the single or the penta eccentrics making contact with their respective sensor wiresmay be used to provide an audio signal or a digital counter input. At low-to-mediumvelocities, the sensor wires dragging over the eccentrics will usually produce multiplesignals during the course of one contact resulting in gross errors in the digital displays ofmost counter units. A counter for use with a penta head Price meter requires a squarewavelength input signal the length of which can be varied to suit the rotor speed.
C. Hydrometric Survey Equipment
November 2, 1998 81
The direct connection to the Price 622AA or Pygmy meter is accomplished by attachingone spade connector (or bare wire) to the meter/rod mounting screw (or the hangermounting screw) while the other connector is attached to either terminal on the pentachamber. Connecting to the top terminal should generate 1 click/rev, connecting to thelower terminal produces one click per five revolutions. The Pygmy has one single countterminal.
Note: An audio counter may be easily assembled using the following off-the-shelf-components: mini headphones with mini phone jack, phone jack socket,plastic pocket flashlight, length of lamp cable, and two or more open-ended #10spade connectors.
Assembly: Remove flashlight bulb socket and replace with mini phone jacksocket. Disable flashlight on/off switch. Split one end of the lamp cable andconnect it to either pole of the on /off switch. The other end of the cable can befitted with the spade connectors or any other type of connector to match themeter suspension to be used. Solder all modified connections.
Testing: Plug the headphones into the socket and touch the outer ends of thecable together several times. Matching clicks should be heard in the headphonesas the circuit opens and closes.
Price Meter Rotation Sensing
The two following methods of modification result in providing clean signals to digitalcounters.
The so-called Low Velocity Price Meter is a standard 622AA with the penta chambersensor replaced by a revolving magnet that activates a reed switch. This alternativesensor unit can be purchased as retrofit or supplied complete with the current meter, i.e.current meter “AA” Magnetic Head Model 1215. This type of current meter may beconnected to a variety of revolution counting devices such as powered headphones,digital counters (including the impeller types described below), velocity displaycalculating units, and field computer interfaces.
Note: All revolution indicators passing current through magnetic reed switchesshould have a spark suppression diode included with the unit or wired into thepositive pole of the connector.
Note: Velocity display units must employ time averaging over at least 40seconds and should be capable of applying changeable current meter calibrationequations.
The operational capabilities of the Photo-Fibre-Optic Swoffer 2200 quartz-timedcounter/retrofit kit have already been described. This control unit, powered by a standard9-V transistor battery, provides for input from both the retrofitted Price 622AA andPygmy meters.
C.4.4.2 Counters for Horizontal Axis Current MetersThere are several types of counters available that are primarily designed to display thefaster rate of pulse transmission generated by impeller type meters. The models aredescribed below in ascending order of capability (and price).
Note: The inexpensive and simple counter and stopwatch option is an awkwardcombination for streamflow measurement because the technician mustsimultaneously operate the start and stop buttons on both the stopwatch and

Standard Operating Procedures for Hydrometric Surveys
82 November 2, 1998
counter with one hand while holding the rod or handline steadily in position withthe other.
OTT F4 and Z21 Revolution Counters
Every pulse generated by the current meter is counted. The instrument counts amaximum of 10 pulses/s and is thus suited for operation in conjunction with metersgenerating a signal at every revolution of the propeller. A button is provided for resettingto zero.
The OTT F4 is powered by two 1.5-V flashlight batteries, and the OTT Z21 is poweredby four 1.5-V cells. Both instruments are used in conjunction with a stop watch.
CMC 20 and CMC 200 Counters
The CMC 20 and CMC 200 counters (Figure C-26 and Table C-8) are self-containedinstruments featuring solid state circuitry, a quartz timebase, and LCD. Both counters arepowered by six AA zinc carbon or alkaline cells.
An internal buzzer sounds at each contact closure during the timing period to indicatecorrect operation. The displays indicate time and count with a resolution of 0.1 secondsand one count respectively, to a maximum of 1000 seconds and 10 000 pulses. See TableC-9 for troubleshooting.
Note: A small variable error is introduced when a counter is operated in the pre-set time mode. While the time count starts when the first pulse from the meter isreceived, the count stops at the end of the selected time period. If the counter“times out” between pulses, some portion of the pulse cycle will be ignored. Thiserror will not occur in the CMC 200 or OTT Z210 when the pre-set pulse mode isselected.
The simpler of the counters, the CMC 20, displays the accumulated pulse count for arange of pre-set time periods. In addition an “integrate” range is included for use whenintegrating depth measurements are made with a ground-feeler weight. In the “integrate”mode the buzzer sounds continuously while the contacts are closed and countingcontinues until interrupted manually by the STOP switch. The use of a supplementarytimer is necessary in this mode. The OTT Z210 has similar capabilities.
The CMC 200 counter includes the features of the CMC-20 combined with the choice ofcounter operation in fixed count mode. Dual displays indicate both time and count. TheOTT Z200 has similar capabilities.
The Braystoke (BFN current meters) counter has capabilities similar to the CMC 200,although it is somewhat heavier.
Table C-8. Features of the CMC-20 and CMC-200 counters.
Action CMC-20 CMC-200
Pulses persecond
N/A Counter allows choice of fixed timeor fixed count.
Start Resets display and commences pre-set time interval.
When PULSES/SECOND switch isset to SECONDS, resets display and
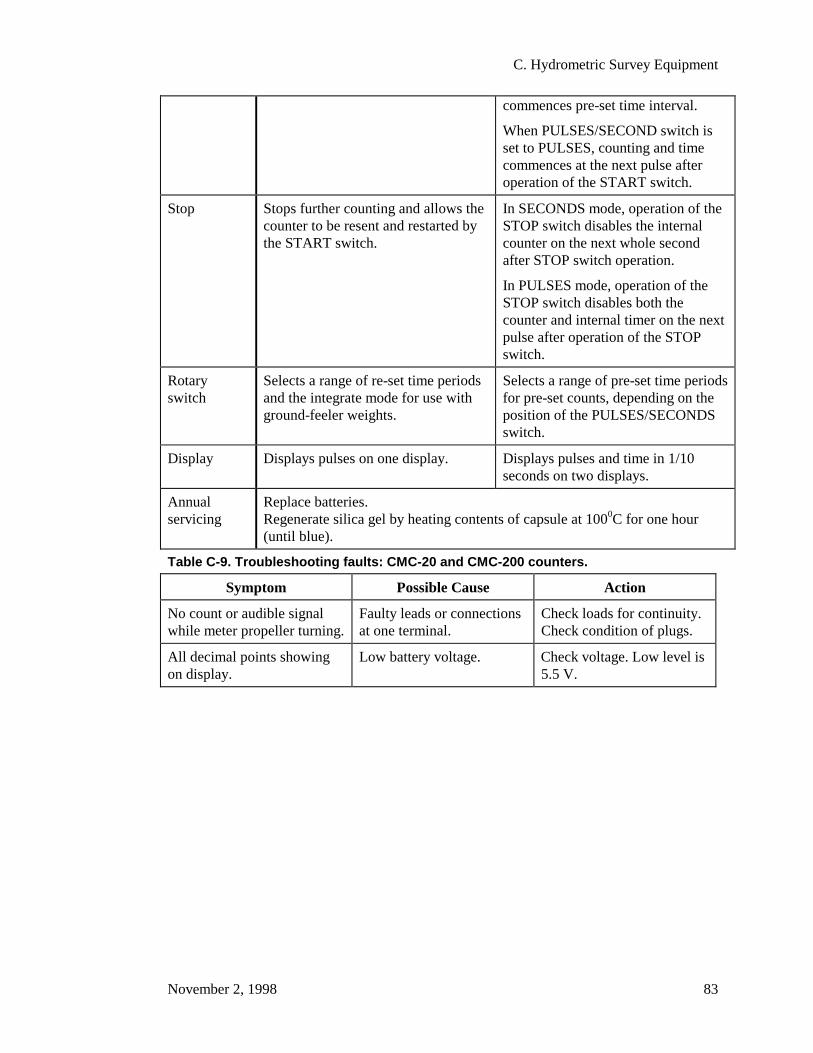
C. Hydrometric Survey Equipment
November 2, 1998 83
commences pre-set time interval.
When PULSES/SECOND switch isset to PULSES, counting and timecommences at the next pulse afteroperation of the START switch.
Stop Stops further counting and allows thecounter to be resent and restarted bythe START switch.
In SECONDS mode, operation of theSTOP switch disables the internalcounter on the next whole secondafter STOP switch operation.
In PULSES mode, operation of theSTOP switch disables both thecounter and internal timer on the nextpulse after operation of the STOPswitch.
Rotaryswitch
Selects a range of re-set time periodsand the integrate mode for use withground-feeler weights.
Selects a range of pre-set time periodsfor pre-set counts, depending on theposition of the PULSES/SECONDSswitch.
Display Displays pulses on one display. Displays pulses and time in 1/10seconds on two displays.
Annualservicing
Replace batteries.Regenerate silica gel by heating contents of capsule at 1000C for one hour(until blue).
Table C-9. Troubleshooting faults: CMC-20 and CMC-200 counters.
Symptom Possible Cause Action
No count or audible signalwhile meter propeller turning.
Faulty leads or connectionsat one terminal.
Check loads for continuity.Check condition of plugs.
All decimal points showingon display.
Low battery voltage. Check voltage. Low level is5.5 V.
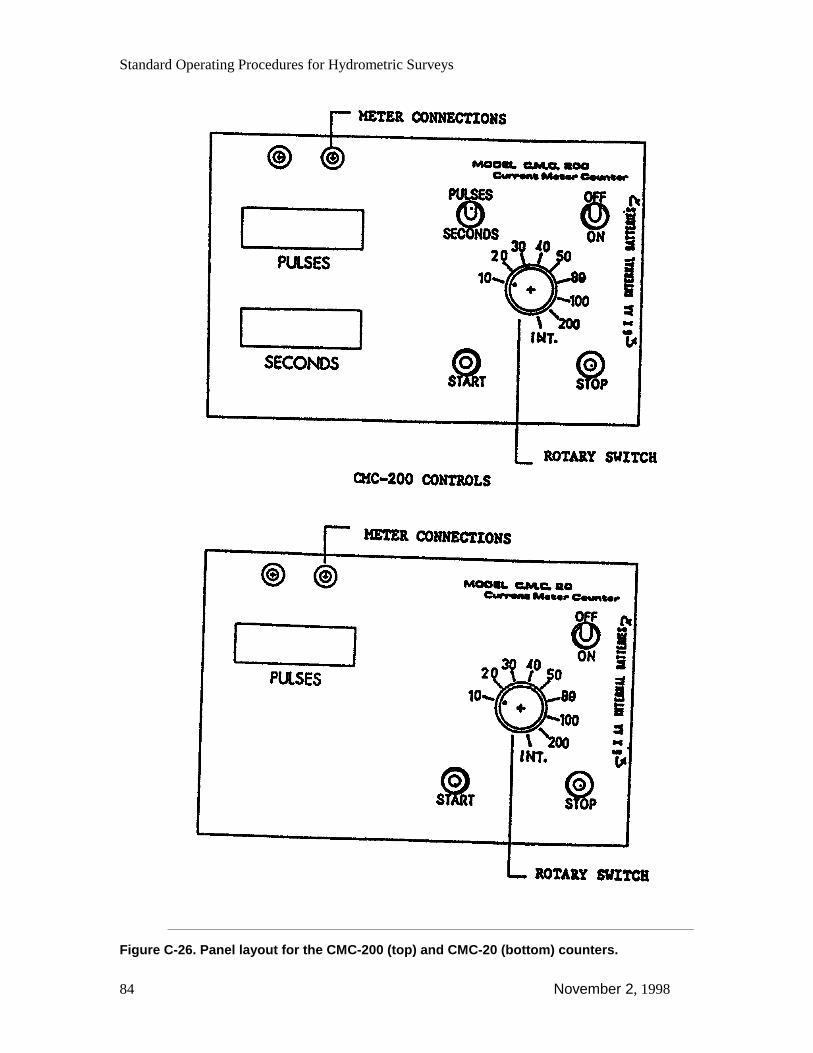
Standard Operating Procedures for Hydrometric Surveys
84 November 2, 1998
Figure C-26. Panel layout for the CMC-200 (top) and CMC-20 (bottom) counters.
C. Hydrometric Survey Equipment
November 2, 1998 85
C.5 Other Equipment and AssembliesThis section lists and describes other equipment and portable discharge measuringdevices that may be included in the hydrometric operational inventory. Some of theseitems may form part of the kits supplied by most current meter manufacturers.
C.5.1 Rods
C.5.1.1 Standard (Conventional) Wading Rods
A conventional wading rod is an option supplied with all Price current meters. It usuallyconsists of four ~13-mm diameter graduated rods that assemble to make up a rod 2.44-mlong. The length of these rods can be extended by ordering additional sections for use inlarge culverts or low bridges. An adjustable sliding support attached to the rod holds themeter and meter tailpiece in place. Electrical connections are provided for hook-up toheadsets or counters. To adjust of the depth of observation setting, the rod must be raisedfrom the streambed.
European and Australian manufacturers provide three-piece 9-mm-diameter graduatedrods with the small current meters. The top section of the rod is drilled to accept thenegative plug from the counter. If a shorter length of rod is required, e.g. for placing themeter in a small-diameter culvert, an alligator clip, modified to accept the cable plug,may be used with either of the lower sections.
For the larger model meters such as the OSS B1, and the OTT C31 and C5, a 20-mmdiameter conventional rod is provided. The current meter can be clamped directly on thisdiameter of rod while adapters may be supplied to accept Price AA and small currentmeters such as the OSS PC1 or the OTT C2. The rod is supplied in 1-m sections, whichare graduated in centimetres and numbered decimetres. A suitable length of connectorcable(s) to match the meters is needed. A meter relocating device for this rod isdescribed later in this section.
C.5.1.2 Top Setting Wading Rods
Top setting rods (Figure C-27) are designed to securely position Price AA or Pygmycurrent meter at any desired depth while the technician wades the stream. Adapters forsmall propeller meters are available from the manufacturer. The design incorporates agraduated stainless steel hexagonal rod and a parallel round aluminum rod (earlierversions are round and square respectively), connected by a cast aluminum handle. Thecurrent meter and tailfins are attached to a sliding support on the base of the aluminumrod which is allowed to slide vertically for rapid positioning of the meter. A vernier onthe handle permits automatic setting of the meter to any desired depth (Table C-10).
After the wading rod is placed into a stream and the water depth is read from thegraduated hexagonal (round) rod, the vernier is used to position the current meter to thedesired depth. Most models have an electrical connector mounted on the handle to attachthe headset or revolution counter.
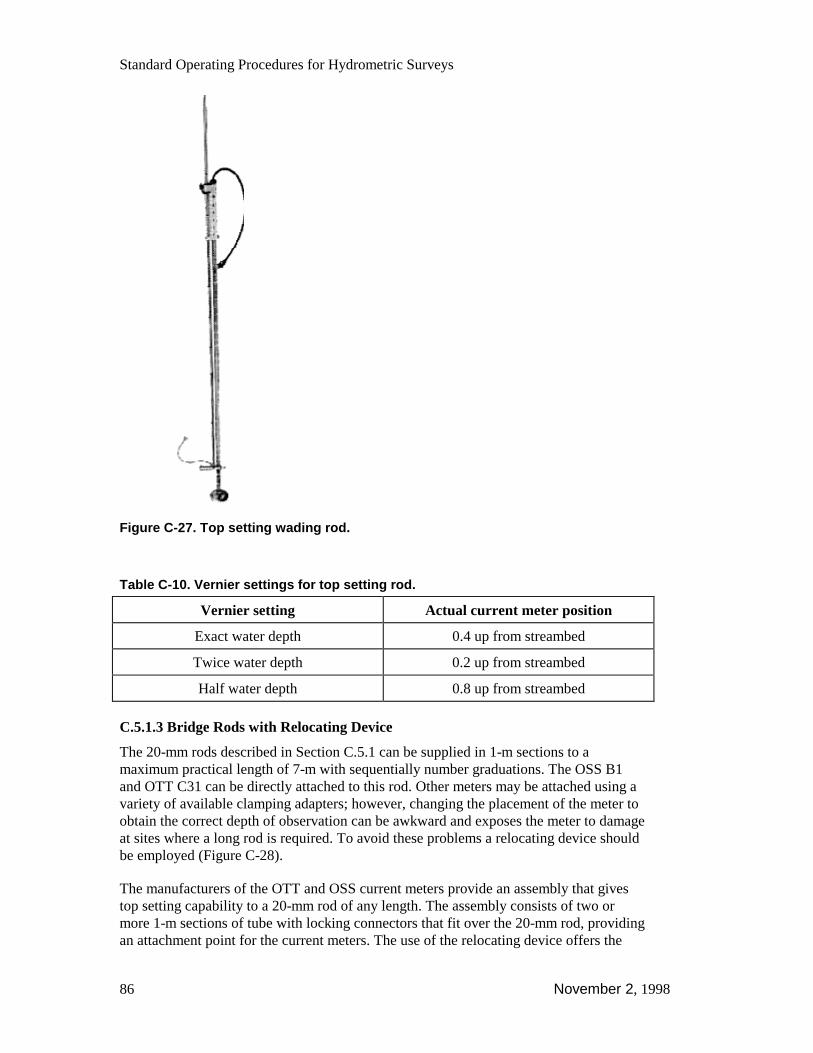
Standard Operating Procedures for Hydrometric Surveys
86 November 2, 1998
Figure C-27. Top setting wading rod.
Table C-10. Vernier settings for top setting rod.
Vernier setting Actual current meter position
Exact water depth 0.4 up from streambed
Twice water depth 0.2 up from streambed
Half water depth 0.8 up from streambed
C.5.1.3 Bridge Rods with Relocating Device
The 20-mm rods described in Section C.5.1 can be supplied in 1-m sections to amaximum practical length of 7-m with sequentially number graduations. The OSS B1and OTT C31 can be directly attached to this rod. Other meters may be attached using avariety of available clamping adapters; however, changing the placement of the meter toobtain the correct depth of observation can be awkward and exposes the meter to damageat sites where a long rod is required. To avoid these problems a relocating device shouldbe employed (Figure C-28).
The manufacturers of the OTT and OSS current meters provide an assembly that givestop setting capability to a 20-mm rod of any length. The assembly consists of two ormore 1-m sections of tube with locking connectors that fit over the 20-mm rod, providingan attachment point for the current meters. The use of the relocating device offers the
C. Hydrometric Survey Equipment
November 2, 1998 87
advantage that the current meter can be positioned along the vertical in the measuringpoint without taking the equipment out of the water. The device, designed primarily foruse with the B1, C31, and C5 meters, can also accommodate small current meters such asthe PC1 and the C2, as well as Price meters. Adapters are required.
Note: A company in Penticton, BC manufactures (to order) a similar completeassembly with identical capability.
Figure C-28. Relocating device.
C.5.2 Handlines, Hangers, and Weights
The handline (Figure C-29) provides a simple and effective method for suspending ameter and weight assembly and is an alternative to the bridge rod. The handline requireshangers and weights to counteract the effects of moving water.
The handline is lightweight, compact, and easy to operate. These features make itparticularly useful for obtaining measurements in winter when roads are impassable by avehicle and it is necessary to walk a long distance to reach a metering section. Thetechnician normally uses the handline to meter from footbridges and on ice cover.However, the handline is also a useful substitute when regular equipment malfunctions.
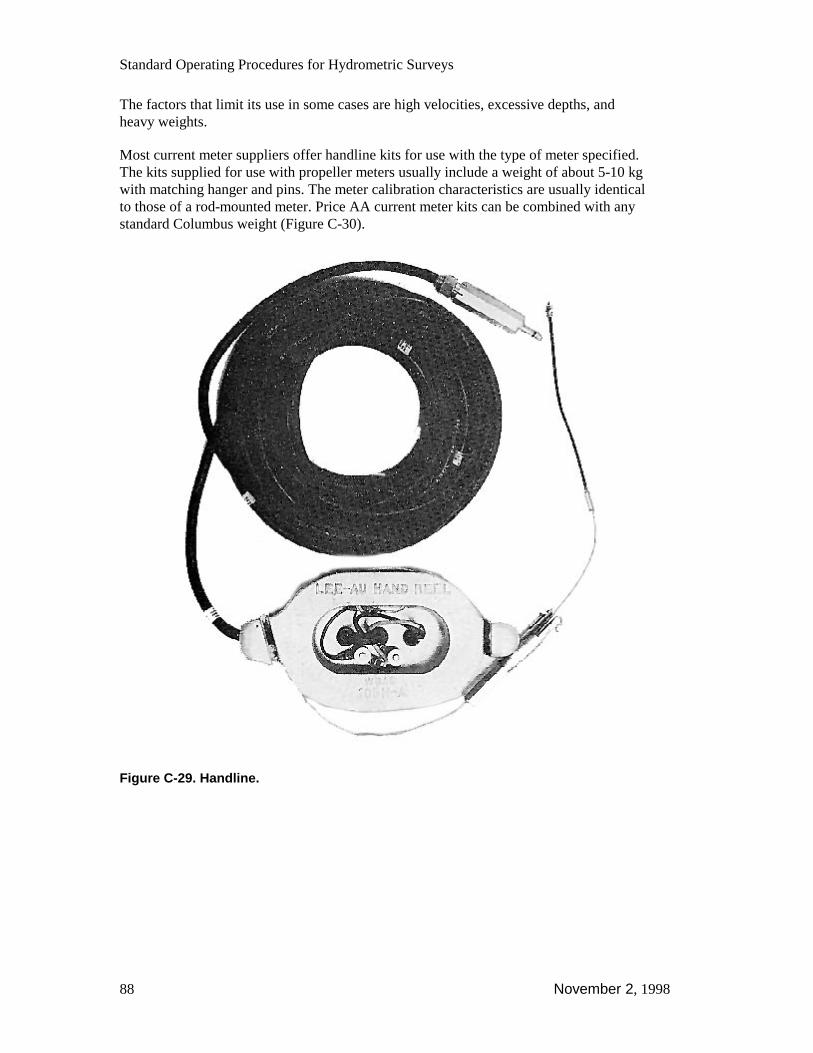
Standard Operating Procedures for Hydrometric Surveys
88 November 2, 1998
The factors that limit its use in some cases are high velocities, excessive depths, andheavy weights.
Most current meter suppliers offer handline kits for use with the type of meter specified.The kits supplied for use with propeller meters usually include a weight of about 5-10 kgwith matching hanger and pins. The meter calibration characteristics are usually identicalto those of a rod-mounted meter. Price AA current meter kits can be combined with anystandard Columbus weight (Figure C-30).
Figure C-29. Handline.

C. Hydrometric Survey Equipment
November 2, 1998 89
Figure C-30. Columbus weights.
A handline can be made from 15 m or less of 16-gauge cab tire electrical cord. Thehandline has a Cinch-Jones plug at one end and a cable thimble at the other. A clevis-type connector is fitted to the thimble. The cord is marked at 0.1-m intervals with stripsof adhesive tape. The markings can be accomplished in the following manner: one stripfor 0.1-m marks, two strips for 0.5-m marks and three strips to denote 1-m intervals.
Another way to make a handline is to spiral wrap a length of 1/16 inch galvanisedaircraft cable with 16- or 18-gauge insulated automotive wire. The spiral wrap ensuresthat the aircraft cable carries the full load of the meter and weight assembly. The entirelength of the wire and cable is then double-wrapped with a cloth type friction tape. Theaircraft cable is secured to a clevis-type connector and the automotive wire is joined tothe meter lead. The weight hanger and galvanised cable function as the return conductor.
A handline can also be made using Kevlar line instead of aircraft cable. However,because Kevlar is a non-conductor, two-conductor automotive wire must be used totransmit the electrical signal.
C.5.3 Reels
The American-made A55 sounding reel and a similar Australian model (Figure C-31) arelight-duty sounding reels with a maximum load capacity of 45 kg. The reels are wellsuited for use in streams of low-to-moderate water velocity where cable length need notexceed 24 m. Reels can be utilized in a variety of situations such as bridge and boatboards, bridge cranes, and cable cars. The meter pulses are transmitted by the twoconductor Ellsworth suspension cable through an electrical brush arrangement to the reelterminals. A two-position handle provides sufficient leverage for handling loads up to 45kg, and the spring ratchet stop provides positive locking of the reel at any desired depth.Digital or analogue depth counters display depth.

Standard Operating Procedures for Hydrometric Surveys
90 November 2, 1998
Figure C-31. San sounding reel, made in Australia.
Associated Equipment. Three-wheeled bridge cranes, and bridge and boat boards canbe purchased from suppliers. A combined bridge/boat board can be fabricated using a 3-m length of 50x150-mm (2x6-inch) fir as the jib on which an alloy plate fitted to acceptthe reel mounting studs is fixed. The outer end of the jib should be fitted with a 10- to15-cm v-belt pulley.
C.5.4 Portable Flumes
A properly installed small Montana flume (Figures C-32 and C-33), which is a truncatedversion of a Parshall flume, can provide a convenient method of making accuratemeasurements of small streams and ditches. The common sizes (i.e. throat dimensions)for portable use are 76.2 mm (3 inches) and 152 mm (6 inches). Commercially availableversions of the Parshall and Montana flumes are typically constructed of fiberglass; theymay also be built of plywood or sheet metal) provided the dimensions shown in Table C-11 and Figure C-35 are followed precisely.
Installation. When installing either type of flume, the crest should be used as an index.Careful leveling is necessary in both the longitudinal and transverse directions ifstandard discharge tables are to be used. In addition, a Montana flume should be usedonly under free flow conditions, i.e. where the maximum submergence limit (50% for 3inches, and 60% for 6 inches) will not be exceeded. A submerged flow condition willexist if the tailwater level divided by the flume gauge water level exceeds thepercentages shown. Under free flow conditions a phenomenon known as the hydraulicjump forms and is a certain indication of free flow conditions. When a standing waveoccurs downstream from the flume, submergence may be indicated.
Note: When portable flumes are used to collect individual dischargemeasurements, the upstream backwater effect caused by the installation shouldbe allowed to stabilize prior to obtaining the final gauge reading. This may takesome time in watercourses with low gradients. In addition, ensure that anytemporary changes to channel geometry due to the installation or removal of theflume does not affect the operation of a permanent reference gauge.
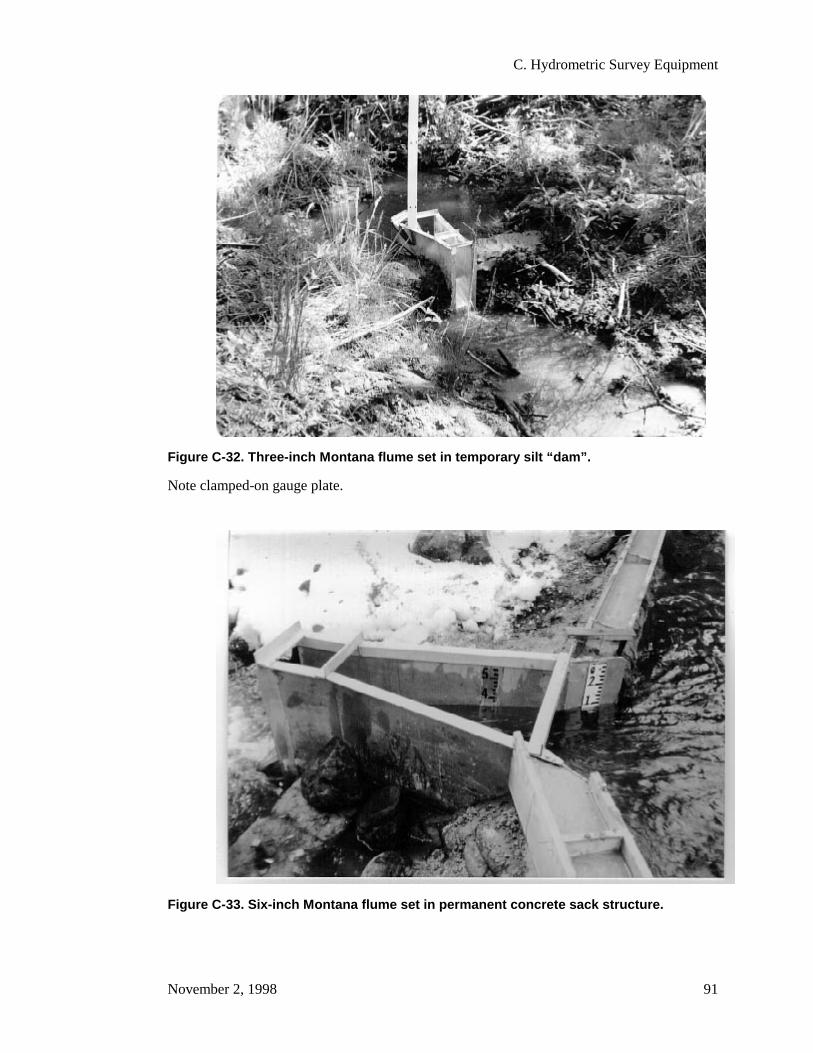
C. Hydrometric Survey Equipment
November 2, 1998 91
Figure C-32. Three-inch Montana flume set in temporary silt “dam”.
Note clamped-on gauge plate.
Figure C-33. Six-inch Montana flume set in permanent concrete sack structure.
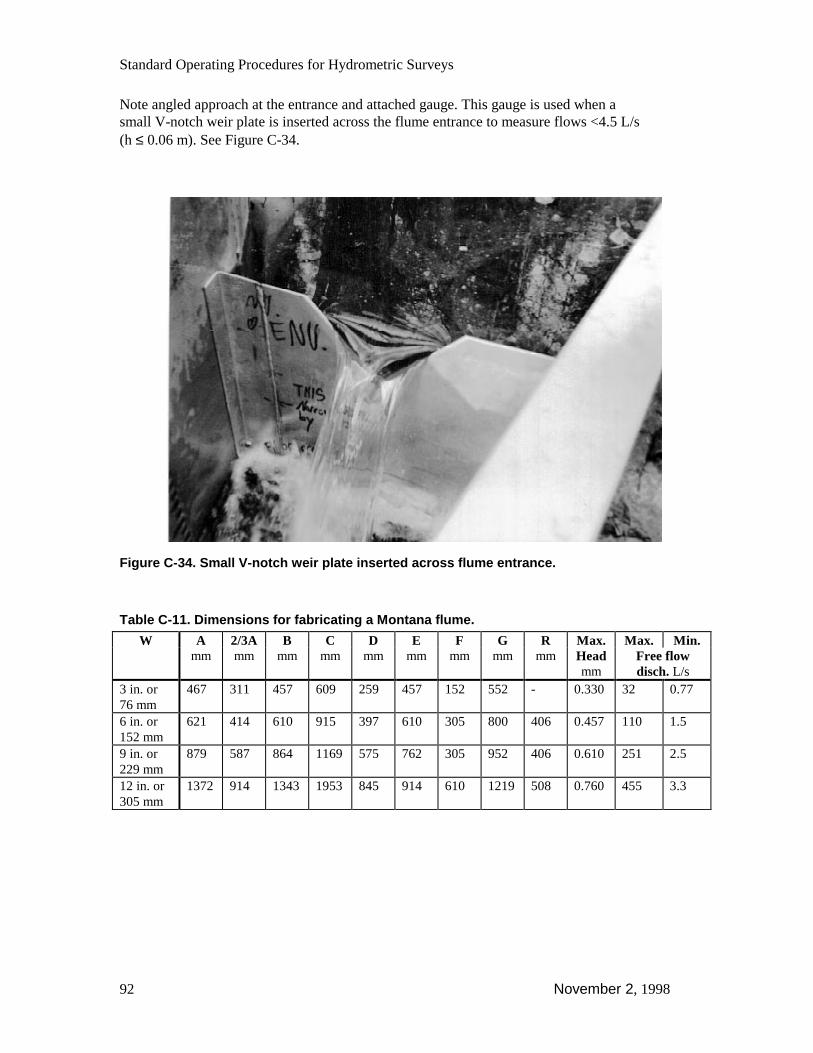
Standard Operating Procedures for Hydrometric Surveys
92 November 2, 1998
Note angled approach at the entrance and attached gauge. This gauge is used when asmall V-notch weir plate is inserted across the flume entrance to measure flows <4.5 L/s(h ≤ 0.06 m). See Figure C-34.
Figure C-34. Small V-notch weir plate inserted across flume entrance.
Table C-11. Dimensions for fabricating a Montana flume.
W A 2/3A B C D E F G R Max. Max. Min.mm mm mm mm mm mm mm mm mm Head
mmFree flowdisch. L/s
3 in. or76 mm
467 311 457 609 259 457 152 552 - 0.330 32 0.77
6 in. or152 mm
621 414 610 915 397 610 305 800 406 0.457 110 1.5
9 in. or229 mm
879 587 864 1169 575 762 305 952 406 0.610 251 2.5
12 in. or305 mm
1372 914 1343 1953 845 914 610 1219 508 0.760 455 3.3
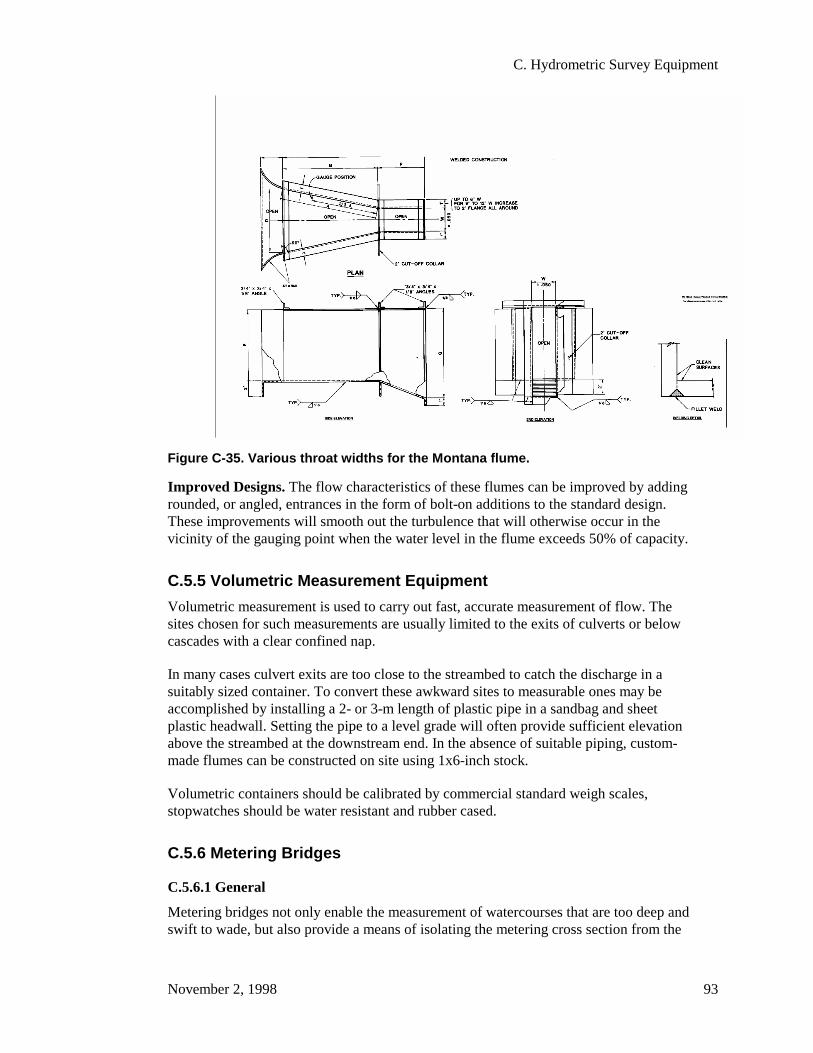
C. Hydrometric Survey Equipment
November 2, 1998 93
Figure C-35. Various throat widths for the Montana flume.
Improved Designs. The flow characteristics of these flumes can be improved by addingrounded, or angled, entrances in the form of bolt-on additions to the standard design.These improvements will smooth out the turbulence that will otherwise occur in thevicinity of the gauging point when the water level in the flume exceeds 50% of capacity.
C.5.5 Volumetric Measurement Equipment
Volumetric measurement is used to carry out fast, accurate measurement of flow. Thesites chosen for such measurements are usually limited to the exits of culverts or belowcascades with a clear confined nap.
In many cases culvert exits are too close to the streambed to catch the discharge in asuitably sized container. To convert these awkward sites to measurable ones may beaccomplished by installing a 2- or 3-m length of plastic pipe in a sandbag and sheetplastic headwall. Setting the pipe to a level grade will often provide sufficient elevationabove the streambed at the downstream end. In the absence of suitable piping, custom-made flumes can be constructed on site using 1x6-inch stock.
Volumetric containers should be calibrated by commercial standard weigh scales,stopwatches should be water resistant and rubber cased.
C.5.6 Metering Bridges
C.5.6.1 General
Metering bridges not only enable the measurement of watercourses that are too deep andswift to wade, but also provide a means of isolating the metering cross section from the
Standard Operating Procedures for Hydrometric Surveys
94 November 2, 1998
effects of the operator’s presence in the water. Bridges may be short lengths of plankspanning a ditch, or properly engineered structures for larger streams.
The following information contains suggestions for selecting a portable unit that may becarried between sites on a pick-up truck and placed in position by two people. Anexample of this type of portable bridge is shown in Figure C-36. It consists of a standardtype heavy-duty aluminum ladder modified by the addition of rails mounted on struts toform load-bearing trusses. With a practical clear span length limit of about 5 m, theconcentrated midpoint safe working load (S.W.L.) for design purposes should be 200 kg.Decking consisting of 9-mm plywood strips cut to fit between the rails is supported onthe ladder rungs. As these units are not fitted with regulation guard rails they may beused only in situations posing no threat of accidents that would result in injury.
The suppliers of this type of equipment (such as Spider Staging Corporation, Richmond,BC) custom engineer and fabricate each unit.
C.5.6.2 Standard Metering Bridge
A cross-sectional view of the standard metering bridge design employed by WSC isshown in Figure C-37 together with a table of the stringer dimensions (Table C-12).Dimensions are shown for both log and sawed lumber stringers. The dimensions shownfor lumber are actual rather than nominal sizes. Lumber stringers should be Douglas-fir,spruce, or cedar. Log stringers should be peeled.
Installation. Stringers should be laid level in both directions, resting on sills above well-compacted soil or concrete capped rock. The undersides of the stringers should be atleast 1 m above the expected maximum water level. If the elevation on either bank isinsufficient, bridge abutments should be constructed to achieve the necessary clearance,and spaced so as not to impinge on the wetted perimeter. Figure C-38 is a typical designsketch of a log crib abutment. Stringer overall length is calculated by using the formulain Note 1 below, i.e. clear span is measured between the inside faces of the bearing sills,overall stringer length shall be 0.3 m longer than the sum of the clear span and theoutside dimensions of both sills or cribs. Stairways or ramps should be constructed at theends of any elevated bridge ends.
Metering Section. All rocks, boulders, and debris must be removed from the streambedwithin 8 m upstream and downstream of the bridge to provide a smooth laminar flow inthe metering section.
Note 1: The overall length of stringer is calculated by taking the sum of the clearspan and the total length of the supporting sills or crib structures (the stringersshould rest on both the front and rear logs forming a crib) + 0.3 m.
Note 2: Only one end of the bridge should be pinned to the supporting member,the other end should be allowed to slide between guide rails when center loadingproduces deflection.
Note 3: Bridge rail posts shall have a maximum spacing of 2.44 m (8 ft).
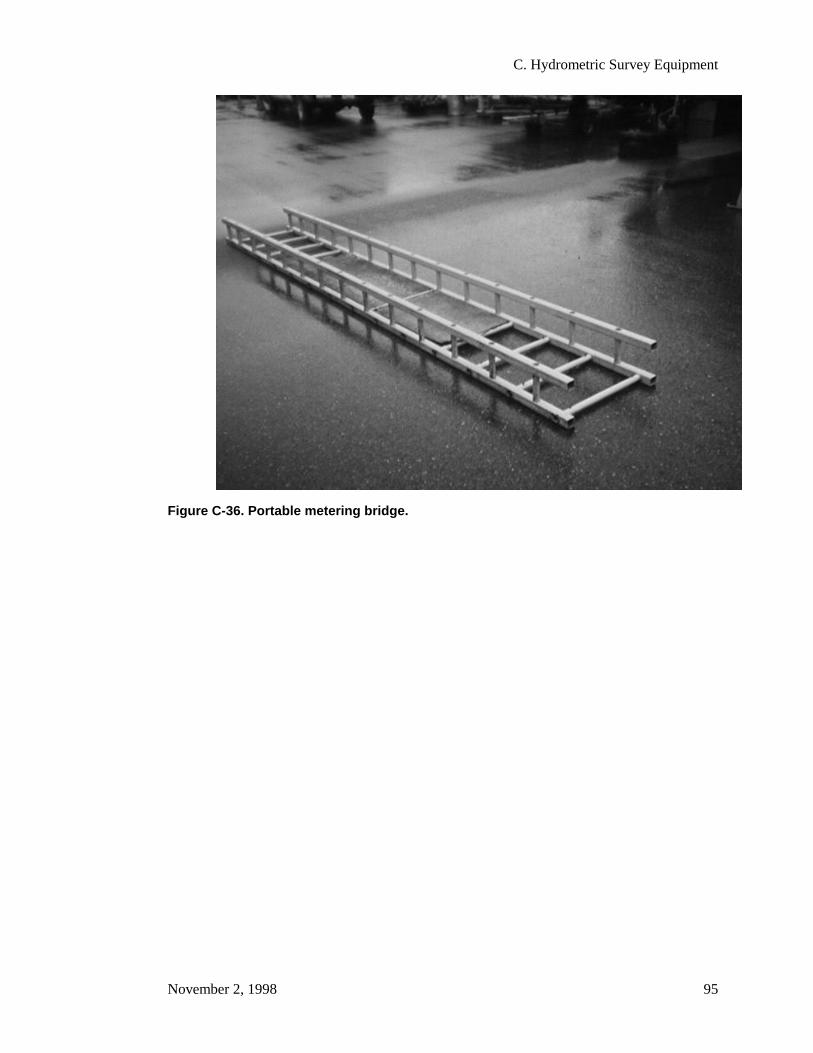
C. Hydrometric Survey Equipment
November 2, 1998 95
Figure C-36. Portable metering bridge.
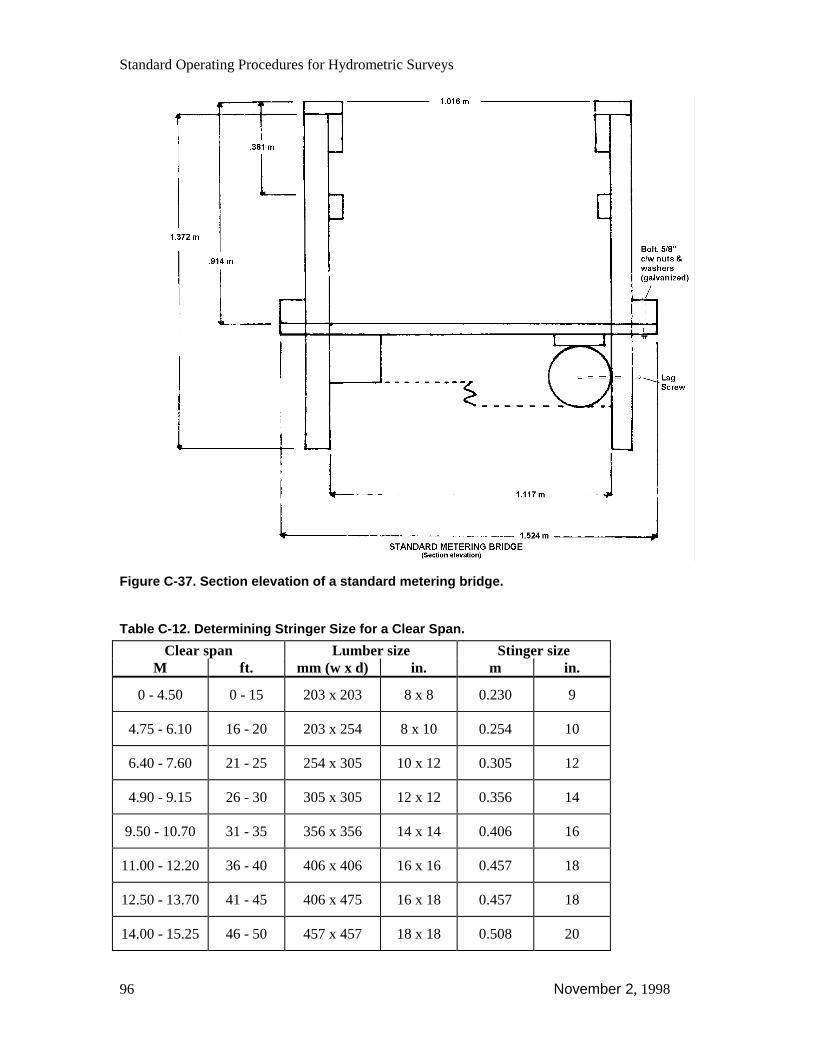
Standard Operating Procedures for Hydrometric Surveys
96 November 2, 1998
Figure C-37. Section elevation of a standard metering bridge.
Table C-12. Determining Stringer Size for a Clear Span.
Clear span Lumber size Stinger sizeM ft. mm (w x d) in. m in.
0 - 4.50 0 - 15 203 x 203 8 x 8 0.230 9
4.75 - 6.10 16 - 20 203 x 254 8 x 10 0.254 10
6.40 - 7.60 21 - 25 254 x 305 10 x 12 0.305 12
4.90 - 9.15 26 - 30 305 x 305 12 x 12 0.356 14
9.50 - 10.70 31 - 35 356 x 356 14 x 14 0.406 16
11.00 - 12.20 36 - 40 406 x 406 16 x 16 0.457 18
12.50 - 13.70 41 - 45 406 x 475 16 x 18 0.457 18
14.00 - 15.25 46 - 50 457 x 457 18 x 18 0.508 20
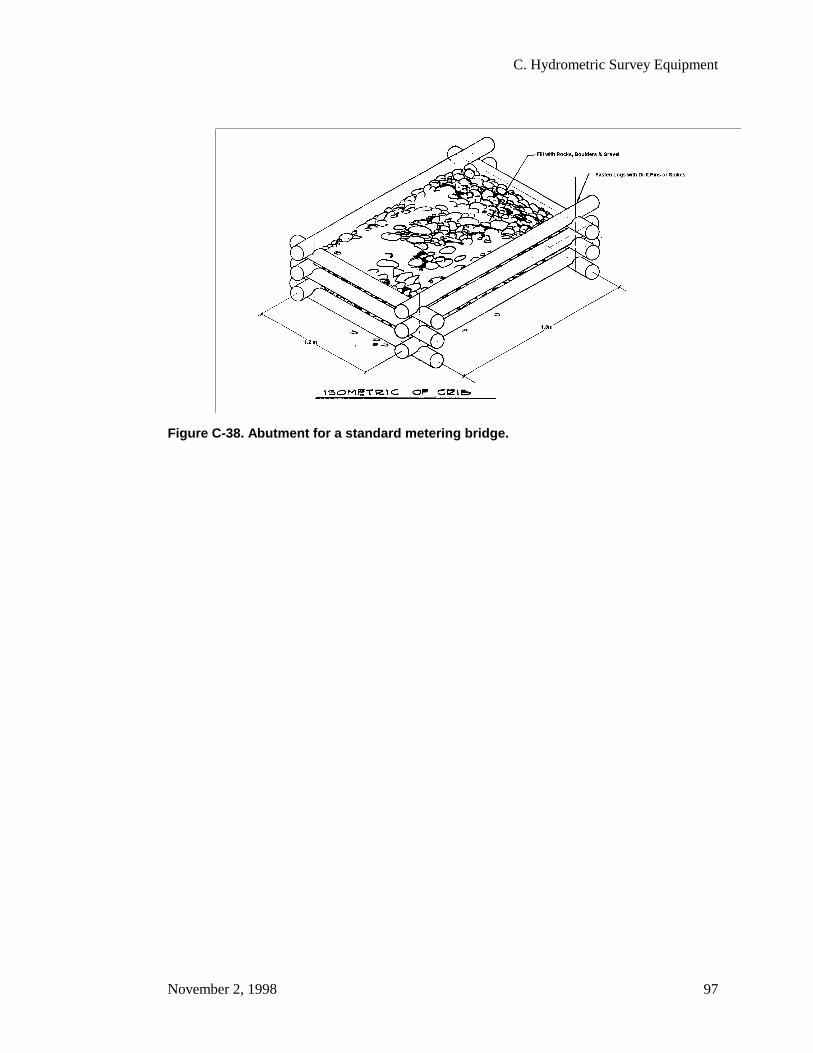
C. Hydrometric Survey Equipment
November 2, 1998 97
Figure C-38. Abutment for a standard metering bridge.

Standard Operating Procedures for Hydrometric Surveys
98 November 2, 1998
This page intentionally blank.
D. Streamflow Measurement Procedures
November 2, 1998 99
D. Streamflow Measurement Procedures
D.1 Pre-Measurement Activities
D.1.1 Field Data Book and Forms
It is very important that the hydrometric field technician establish a record keepingsystem in the form of a field data book. All pertinent notes and information should bewell organized in the field data book to facilitate planning, scheduling, decision making,equipment management, and overall record keeping.
The actual organization of the field data book is up to the individual, but it should belogically organized and kept up to date at all times. If for any reason a field techniciancan not undertake or complete the field work (e.g. due to illness or re-assignment), thefield data book should give colleagues a clear understanding of the design, function, andhistory of the station.
The field data book should contain the following information for each gauging station:
• Form AQU-01 Description of Hydrometric Station
• Form AQU-02 Gauge Level Notes
• Form AQU-03 Discharge Measurement
• Form AQU-04 History of Gauge Level Check
• Form AQU-05 Summary of Discharge Measurements for the Year
• Form AQU-06 Water Stage Recorder - Station Record for the Year
• Form AQU-07 Station Analysis for the Year
• Form AQU-08 Stage-Discharge Rating Curve
• Special instructions regarding equipment, maintenance, techniques, conditions, etc.as an attachment to Form AQU-01 (see completed example, Figures B-10 and B-11in Section B.2.3.2).
• Names of field staff, and contact information.
Appendix II at the end of this Manual contains blank forms and examples of completedforms.
D.1.2 Before Departing for the Field
Before departing on a field trip to gauging stations, the field technician should:
• Carefully review the information and notes in the field data book.
• Address all problems that were noted on previous field trips, and be prepared tohandle them if they come up again.
• Gather all equipment that might be needed for all potential conditions, i.e. high,medium, or low flow, at all stations.
• Check and test all equipment to ensure that it is functioning correctly.
Standard Operating Procedures for Hydrometric Surveys
100 November 2, 1998
D.1.3 On Site Preparations
Prior to conducting the discharge measurement, the conditions of the watercourse mustbe assessed and recorded, and all the equipment must be checked and serviced ifnecessary.
D.1.3.1 Assessing Channel Conditions of the Watercourse
One purpose of assessing the overall conditions of the watercourse is to be aware ofconditions that will affect the measurement, and to note conditions that could haveaffected the stage-discharge relationship since the last time the station was visited.
Also, assessing the conditions of the watercourse is important in deciding whether or notto go ahead with the measurement. In some conditions it will be unsafe or impractical todo the measurement.
To assess the conditions of the watercourse, look for the following conditions and makenotes about them in the field data book:
• Weed growth at the metering section or on the control
• Debris floating or lodged in the proximity of the gauge
• Beaver activity
• Deposition of gravel or development of sand bars in the vicinity of the gauge
• Any obstructions in the vicinity of the gauge
• Erosion of the channel banks
• Overflow channels that are bypassing the metering section (must be measured orestimated)
• High winds
• Ice conditions
D.1.3.2 Gauges and Water-Level Recorder
After noting the conditions of the watercourse, read the gauges and water-level recorder:
1. Note the time and date in the field data book.
2. Record all the gauge readings. Or, obtain a water level by instrument. Note andrecord any differences (pen setting, gauge height, or water level).Note: An accurate determination of the mean gauge height is essential forplotting the results of the discharge measurement. If the stage appears to changewhile the measurement is in progress, it is necessary to obtain additionalreadings during the progress of the measurement.
3. Flush the stilling well intakes and make certain they are not obstructed. Observe andrecord any differences that occur after the flushing.
4. Service the recorder (see Appendix III for details). Remove the stage record that hasbeen accumulating since the last visit to the gauging station.Wind the clock drive mechanism of the recorder. Set the pen to the correct time andgauge height.
5. Level check the gauge or gauges if required.
6. Make thorough notes in field data book about observations and procedures.
D. Streamflow Measurement Procedures
November 2, 1998 101
After taking the discharge measurement, obtain another gauge reading and observewhether the recorder drive system is operating properly and if the pen is trackingcorrectly. By this time the recorder will have been operating for approximately one hourand any error in setting the pen should be apparent.
This is also the time to check the recorder drive system to make certain that the clockweight spring has not caught on the shelf, or that the ratchet and pawl of a negatorspring-driven recorder is disengaged.
D.1.3.3 Current Meter
Before using a Price 622AA current meter, inspect it to be sure the bearing surfaces arein good order. This can be done quite easily:
1. Loosen the bucket wheel raising nut so that the pivot wheel bearing rests on thepivot.
2. Gently rotate the bucket wheel and observe it as it comes to a stop. If the stop isgradual, then the bearing surfaces and the pivot are in satisfactory condition. If thebucket wheel comes to an abrupt halt or the motion is abnormal in any way, the pivotand bearings should be closely inspected.
3. Inspect the pivot and bearings if necessary. If there is evidence of wear, the metershould not be used. Have the meter professionally serviced and re-calibrated.
4. If the pivot and bearings are in good order, then go ahead with the dischargemeasurement.
5. Horizontal shaft “propeller” meters should be spun to confirm that the bearings andshaft are in satisfactory condition. How to check the propeller meter is described inSection C.4.2.6.
D.1.3.4 Observing Velocity
The guidelines for observing velocity (Figure D-1) are:
• Allow sufficient time for the current meter to adjust to water conditions. Theadjustment time will be a very few seconds at high velocities, and significantlylonger at low velocities. This adjustment period is very important at low velocities,i.e. <0.3 m/s, and the failure to allow for it could produce errors.
• Observe velocities for 40 to 70 seconds.
• Observe time to the nearest 1/2 second (stopwatch/meter rating table use), or theexact displayed time, when using the meter calibration equation to determine thevelocity.
• Where water depth in the vertical is >1.0 m the velocity is measured at both 0.2 and0.8 depth (from the water surface) with the current meter, and the mean velocity iscalculated.
• Where water depth in the vertical is <0.8 m, observations are made at 0.6 depth(from the water surface) only. Using the 0.2 and 0.8 depth method in shallowwatercourses places the current meter too close to the water surface and the channelbed to give reliable results.
• Where water depth is between 0.8 m and 1.0 m, the technician can choose themethod.

Standard Operating Procedures for Hydrometric Surveys
102 November 2, 1998
• Usually, depth should be recorded to the nearest 2 cm. However, when wading smallor shallow watercourses (<20 cm depth), depths should be recorded to the nearestcentimetre. The important concept here is the total cross sectional area.
Figure D-1. Example of typical vertical velocity curve.

D. Streamflow Measurement Procedures
November 2, 1998 103
D.2 Discharge MeasurementThis manual presents five basic techniques for making discharge measurements:
1. Measuring by wading (Section D.2.1)
2. Measuring from a bridge with a bridge rod (Section D.2.2.1)
3. Measuring from a bridge with a cable-suspended current meter (Section D.2.2.2)
4. Measuring from a bank-controlled cableway (Section D.2.3)
5. Measuring with small flumes and weirs (Section C.5.4)
Although other techniques exist, such as measuring from a boat, or using dye tracing andsalt-dilution methods, they are rather complex for the non-specialist to apply, and aretherefore beyond the scope of this manual. The non-specialist technician is advised tolocate the gauging station at a spot along the watercourse suitable for conductingdischarge measurements by one of the five basic techniques.
D.2.1 Measuring by Wading
D.2.1.1 General
If conditions permit, wading measurements are preferred to those obtained by othermeans.
Wading measurements are relatively easy to carry out, and computing the discharge canbe simpler than for other techniques. However, in very small watercourses, e.g. ditches,the presence of the field technician in the water may significantly affect the flow. In thiscase, the technician should stand on a plank or log placed across the watercourse (FigureD-2).
D.2.1.2 Checking Safety Conditions
Check the overall conditions at the gauging station to determine if the watercourse can bewaded safely.
Providing the channel bed is firm and provides good footing, a general rule of thumb fordeciding whether conditions are safe is:
Depth (metres) multiplied by velocity (m/s) does not exceed a value of one.
This rule of thumb may be exceeded if a strong safety line can be installed across themetering section (Figure D-3).
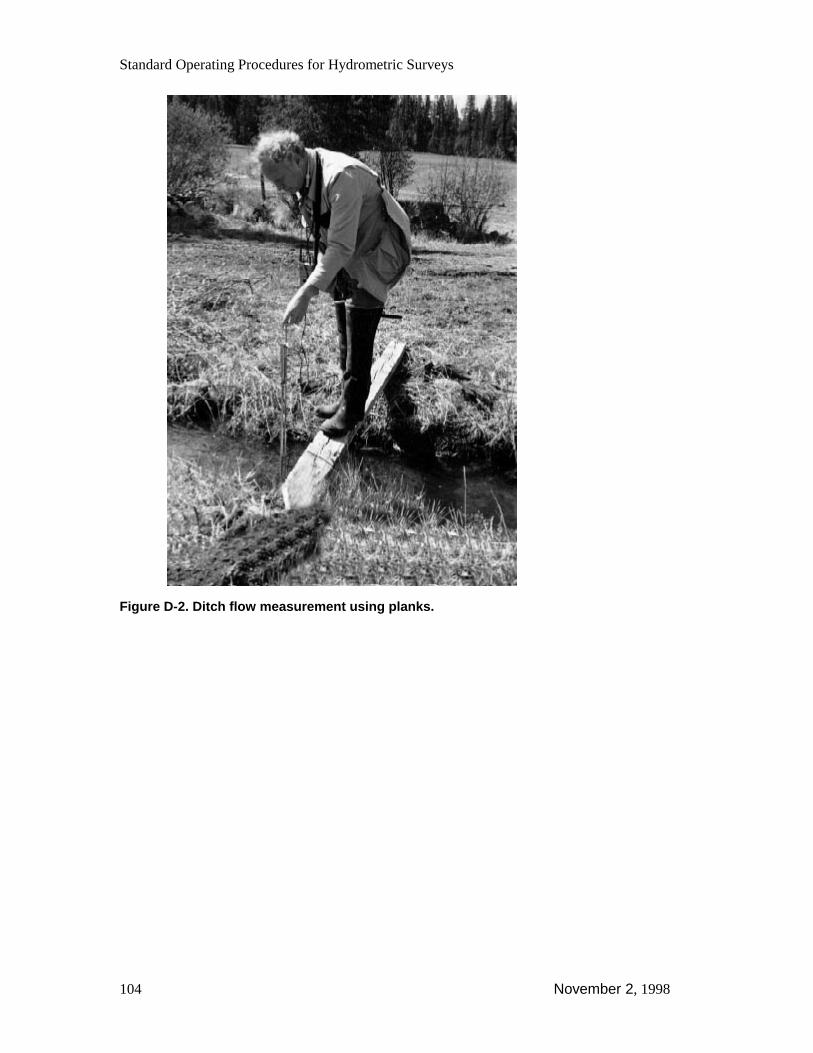
Standard Operating Procedures for Hydrometric Surveys
104 November 2, 1998
Figure D-2. Ditch flow measurement using planks.

D. Streamflow Measurement Procedures
November 2, 1998 105
Figure D-3. Measuring by wading, with safety line angled upstream, Granite Creeknear Tulameen.
D.2.1.3 Equipment Selection and Testing
If the metering section is very narrow or shallow, or if most of the verticals have depthsof <0.15 m, use a small current meter. The Price meter tends to over-register if thebuckets are only partially submerged; preferably, use it only where average depths are>0.15 m. Do not use an unmodified Price Pygmy meter in velocities under 0.5 m/s.
Test the current meter’s electrical circuit before making the measurement:
1. Attach the meter to the wading rod.2. Connect the electrical lead on the rod to one of the terminals on the meter contact.3. Attach the headset, beeper, or counter to the receptacle on the handle of the rod.4. Rotate the bucket wheel. If a headset or beeper is used, a series of sharp clicks or
beeps should be heard. With a counter, the rotor revolutions will register in theviewing window. (Note: See Section C.4.4.)
D.2.1.4 Locating the Wading Section
If the gauging station has been in operation for some time, a wading section for makingmeasurements will already have been established (Figure D-4). Inspect the wadingsection, and the reach immediately above and below it, to make sure it is still the mostsuitable.
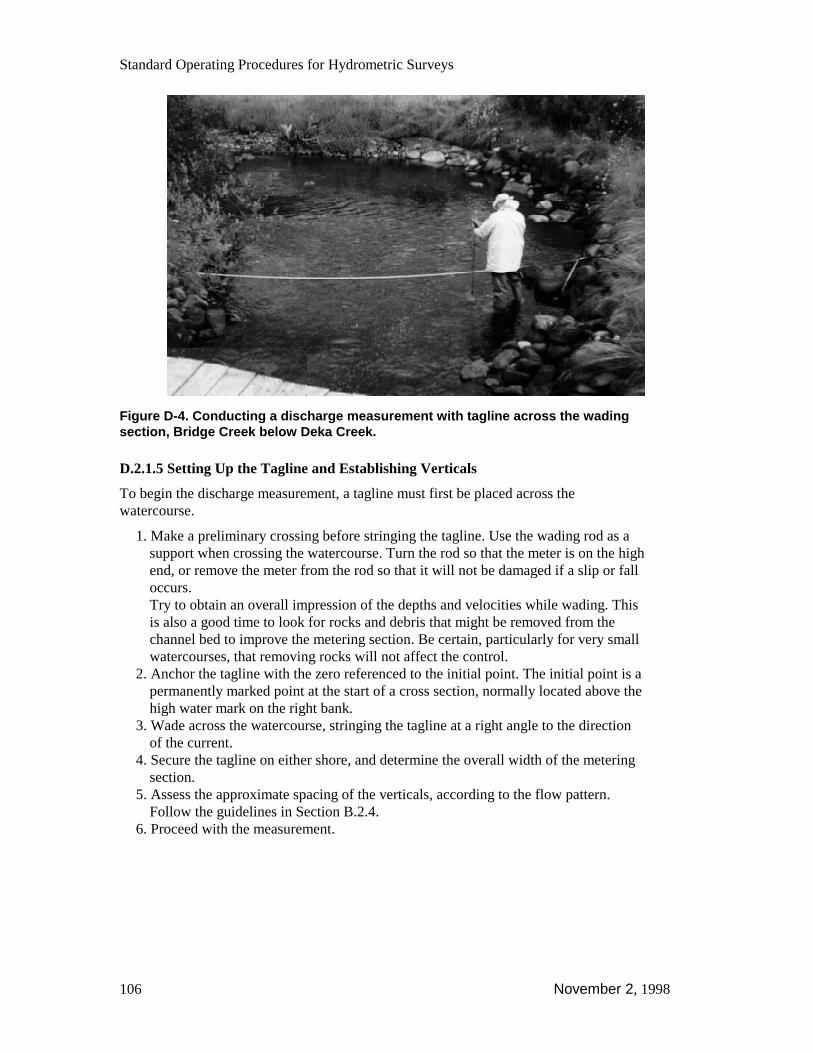
Standard Operating Procedures for Hydrometric Surveys
106 November 2, 1998
Figure D-4. Conducting a discharge measurement with tagline across the wadingsection, Bridge Creek below Deka Creek.
D.2.1.5 Setting Up the Tagline and Establishing Verticals
To begin the discharge measurement, a tagline must first be placed across thewatercourse.
1. Make a preliminary crossing before stringing the tagline. Use the wading rod as asupport when crossing the watercourse. Turn the rod so that the meter is on the highend, or remove the meter from the rod so that it will not be damaged if a slip or falloccurs.Try to obtain an overall impression of the depths and velocities while wading. Thisis also a good time to look for rocks and debris that might be removed from thechannel bed to improve the metering section. Be certain, particularly for very smallwatercourses, that removing rocks will not affect the control.
2. Anchor the tagline with the zero referenced to the initial point. The initial point is apermanently marked point at the start of a cross section, normally located above thehigh water mark on the right bank.
3. Wade across the watercourse, stringing the tagline at a right angle to the directionof the current.
4. Secure the tagline on either shore, and determine the overall width of the meteringsection.
5. Assess the approximate spacing of the verticals, according to the flow pattern.Follow the guidelines in Section B.2.4.
6. Proceed with the measurement.

D. Streamflow Measurement Procedures
November 2, 1998 107
D.2.1.6 Discharge Measurement Procedure: Mid-Section Method
The mid-section method of discharge measurement is described below, and illustrated inFigure D-5. Refer to Appendix II, Form AQU-03.
1. Record the starting time on Form RIC AQU-03.2. Record the tagline distance for the edge of the water. If there is a steep drop at the
edge of the stream, the first “vertical” depth and velocity observation should betaken close to the edge.
3. Move to the next vertical. Record the distance indicated by the numbered marker onthe tagline. Observe and record the depth.
4. Set the current meter to the correct depth to obtain the velocity.5. To obtain the velocity, count and record the number of revolutions the bucket wheel
makes for a duration of time between 40 and 70 seconds.6. Observe and record the time to the nearest 1/2 second.
To use the current meter rating table, the number of revolutions counted should beone of the 13 that are listed. Current meter rating tables are designed so that thevelocity in meters per second can be obtained directly, for a given number ofrevolution within the required time frame. The 13 choices of pre-selectedrevolutions are 5, 10, 15, 20, 30, 40, 50, 80, 100, 150, 200, 250, and 300.
7. If the procedure described above is not used, a double interpolation of both timeand count is necessary to use the table to compute velocity.
8. Repeat the above procedure until the watercourse is traversed and the measurementis completed.
9. After completing the measurement, note and record the time and water level.
Figure D-5. Mid-section method of discharge measurement.
D.2.1.7 Precautions and Tips
To obtain accurate measurements by wading, the technician must pay attention to detailand technique. If followed carefully, these suggestions will help obtain reliable results:
1. Position the tagline correctly. Take the time to ensure that the tagline is placed in aposition that is perpendicular to the direction of the current.Even when this precaution is taken, there will still be instances where angular flowoccurs. When this happens, record the cosine of the horizontal angle.

Standard Operating Procedures for Hydrometric Surveys
108 November 2, 1998
2. Improving the metering section. Where necessary, take the time to improve themetering section by removing boulders and debris from the metering section and thearea immediately above it. Remove weeds for a distance of about three times thedepth from the area upstream and downstream from the section. On smallerwatercourses it may be possible to construct small dikes to cut off sections ofshallow flows and dead water.After the modifications are made, be certain to allow sufficient time for conditions tostabilize before proceeding with the measurement. Note if the modifications have aninfluence on the gauge reading. All improvements to the metering section should becompleted before starting the measurement, i.e. do not make changes to the meteringsection (such as by moving rocks) during the course of the discharge measurement.
3. Spacing of Verticals. Obtain 20 - 25 observations of both depth and velocity for onecomplete measurement (Section D.3.1, Errors Affecting Accuracy). If the crosssection is narrow, do not space the verticals closer than 0.15 m when using the Price622AA meter because the distance between verticals must be greater than thediameter of the current meter bucket wheel.If the cross section is very narrow, use a small meter and space the verticals moreclosely. The small propeller meters are usually supplied with 50-mm diameterpropellers, and 30-mm interchangeable types are also available.
4. Position of the technician. The field technician’s position with respect to the currentmeter is very important when making a discharge measurement by wading. Thetechnician should stand to the side and downstream from the meter so as not toinfluence the velocity (Figure D-6). Studies show that the following position has theleast effect on the operation of the current meter: stand in a comfortable and safeplace facing either shore, and no less than 0.4-m downstream and to the side of thecurrent meter.
5. Position of the current meter. Hold the wading rod in a vertical position and thecurrent meter parallel to the direction of flow while making the velocity observation.Vertical axis meters - if the axis of the meter is not kept vertical, the meter will tendto under-register.Horizontal axis meters - many propellers are designed to compensate for angularflow. Consequently any deviation from the vertical position of the rod will introducean error in velocity.
6. Observing Velocities. If depths are sufficient, the 0.2 and 0.8 method should be usedfor observing velocities. It is quite easy to make the settings on the top settingwading rod.To set the 0.2 depth position on the rod, simply double the value of the observeddepth. Set the 0.8 depth position as one-half of the observed depth.Example: Observed depth = 0.96 m.For the 0.2 depth, set 1.92 on rod.For the 0.8 depth, set 0.48 on rod.Note: The 0.2-0.8 method is not entirely satisfactory if the channel bed is veryrough, irregular, or covered with aquatic growth. These conditions will oftenproduce erratic results for the observation at the 0.8 depth. In some situations,more reliable results will be obtained by computing the average velocity on thebasis of the 0.2 and 0.8 depths and averaging the computed value with thevelocity from the 0.6 depth. This is known as the three-point (3 Pt.) method.
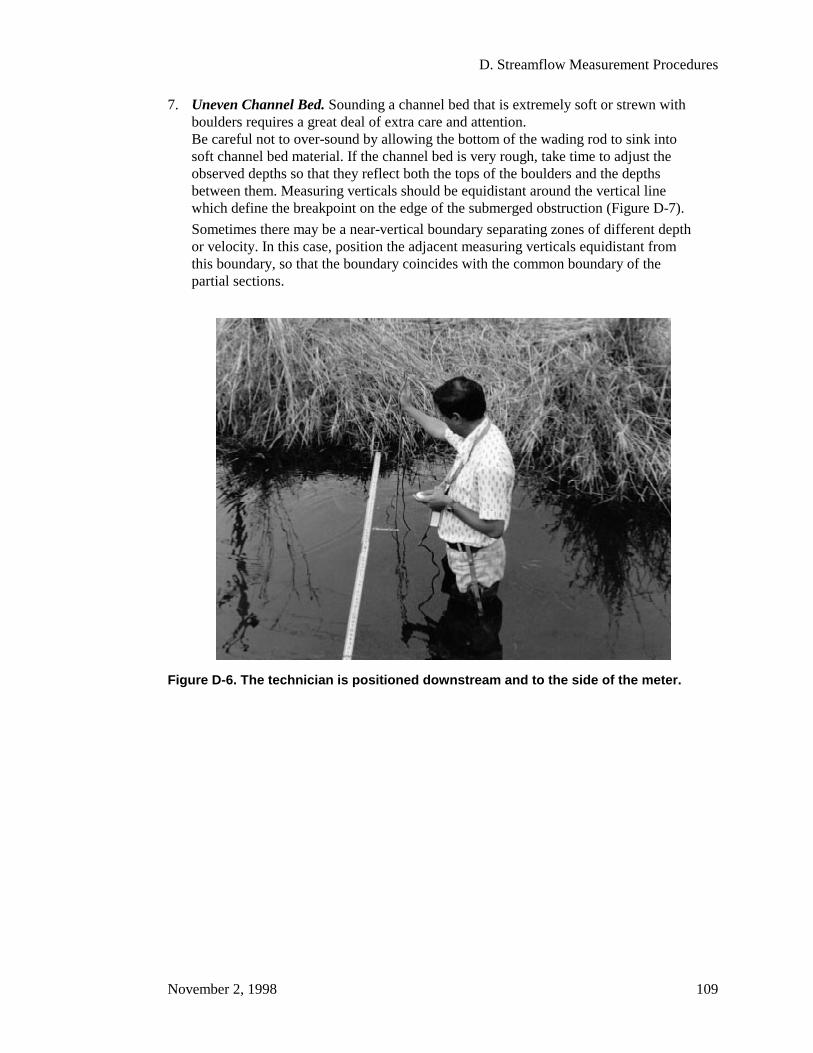
D. Streamflow Measurement Procedures
November 2, 1998 109
7. Uneven Channel Bed. Sounding a channel bed that is extremely soft or strewn withboulders requires a great deal of extra care and attention.Be careful not to over-sound by allowing the bottom of the wading rod to sink intosoft channel bed material. If the channel bed is very rough, take time to adjust theobserved depths so that they reflect both the tops of the boulders and the depthsbetween them. Measuring verticals should be equidistant around the vertical linewhich define the breakpoint on the edge of the submerged obstruction (Figure D-7).
Sometimes there may be a near-vertical boundary separating zones of different depthor velocity. In this case, position the adjacent measuring verticals equidistant fromthis boundary, so that the boundary coincides with the common boundary of thepartial sections.
Figure D-6. The technician is positioned downstream and to the side of the meter.

Standard Operating Procedures for Hydrometric Surveys
110 November 2, 1998
Figure D-7. Defining the breakpoint.
D.2.2 Measuring from a Bridge
If a watercourse can not be waded, discharge measurements can be made from a bridgeor cableway (Section D.2.3). Measurement cross sections under bridges are oftensatisfactory for current meter measurements, but cableway sections are usually superior.
Either a bridge rod (Figure D-8) or a cable/weight suspension system can be used toposition the current meter in the watercourse.
Figure D-8. Bridge rod in use on downstream side of bridge.
The cable supporting the sounding weight and current meter may be suspended from ahandline (Figures D-9 and D-10) or one of several models of sounding reels. Handlines
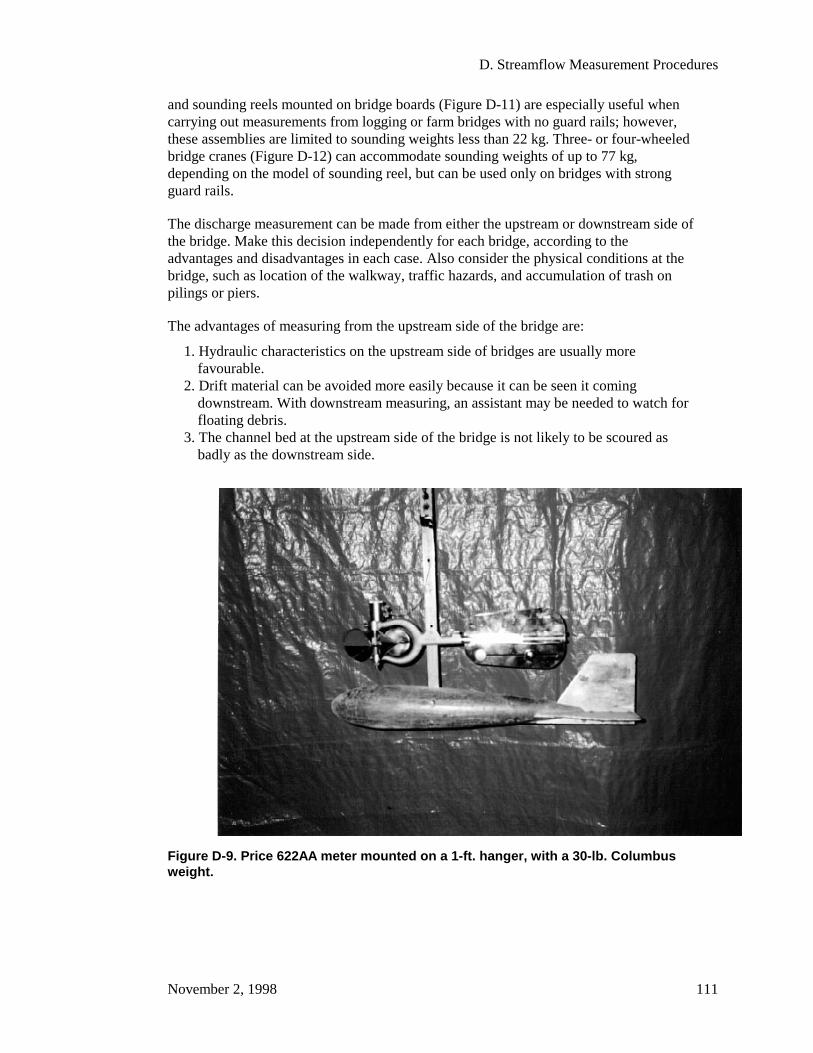
D. Streamflow Measurement Procedures
November 2, 1998 111
and sounding reels mounted on bridge boards (Figure D-11) are especially useful whencarrying out measurements from logging or farm bridges with no guard rails; however,these assemblies are limited to sounding weights less than 22 kg. Three- or four-wheeledbridge cranes (Figure D-12) can accommodate sounding weights of up to 77 kg,depending on the model of sounding reel, but can be used only on bridges with strongguard rails.
The discharge measurement can be made from either the upstream or downstream side ofthe bridge. Make this decision independently for each bridge, according to theadvantages and disadvantages in each case. Also consider the physical conditions at thebridge, such as location of the walkway, traffic hazards, and accumulation of trash onpilings or piers.
The advantages of measuring from the upstream side of the bridge are:
1. Hydraulic characteristics on the upstream side of bridges are usually morefavourable.
2. Drift material can be avoided more easily because it can be seen it comingdownstream. With downstream measuring, an assistant may be needed to watch forfloating debris.
3. The channel bed at the upstream side of the bridge is not likely to be scoured asbadly as the downstream side.
Figure D-9. Price 622AA meter mounted on a 1-ft. hanger, with a 30-lb. Columbusweight.
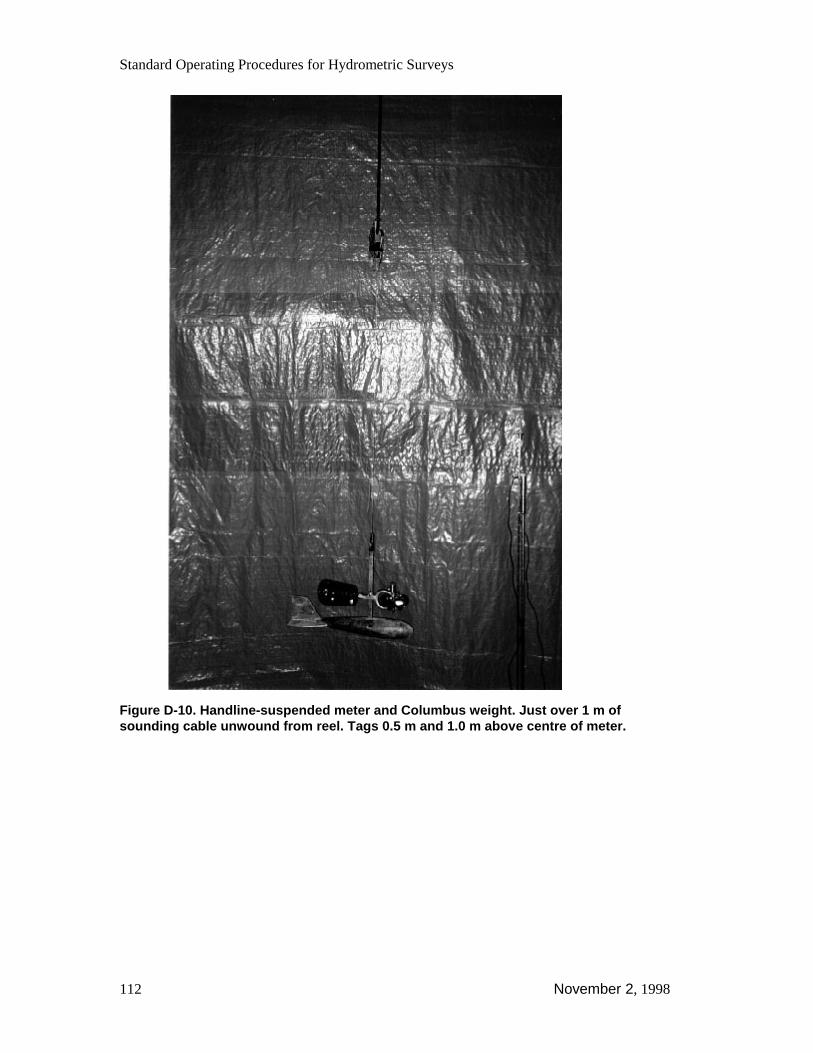
Standard Operating Procedures for Hydrometric Surveys
112 November 2, 1998
Figure D-10. Handline-suspended meter and Columbus weight. Just over 1 m ofsounding cable unwound from reel. Tags 0.5 m and 1.0 m above centre of meter.
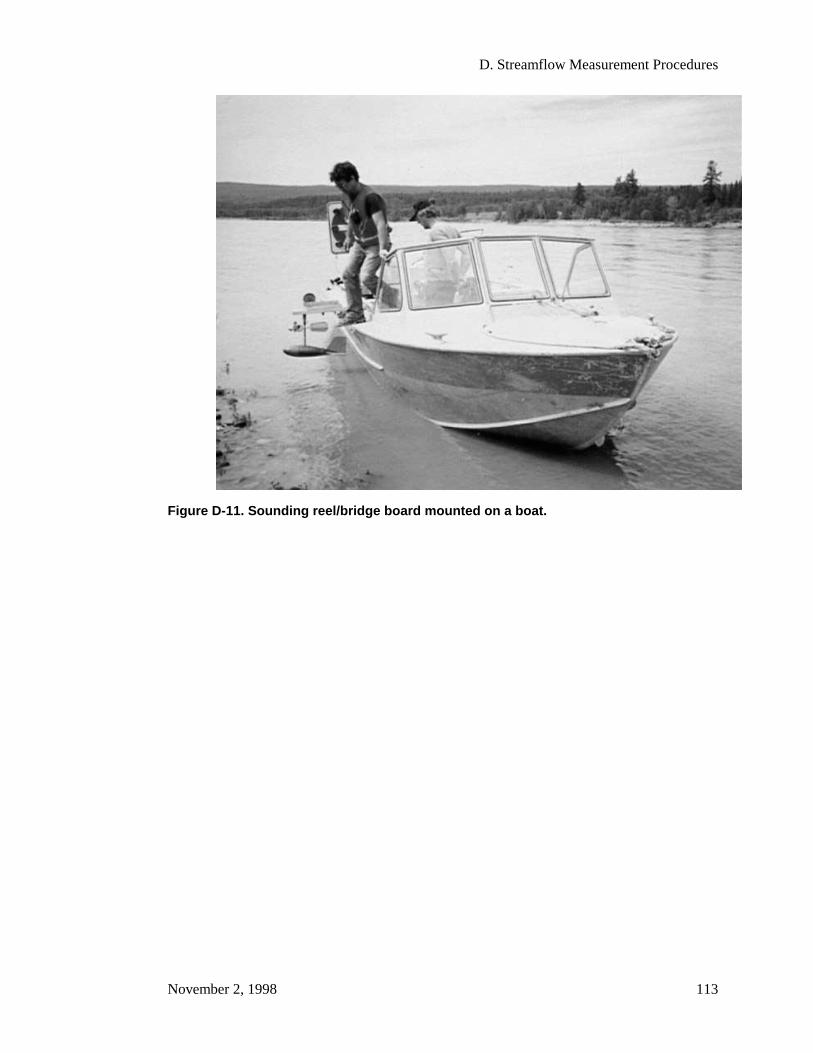
D. Streamflow Measurement Procedures
November 2, 1998 113
Figure D-11. Sounding reel/bridge board mounted on a boat.
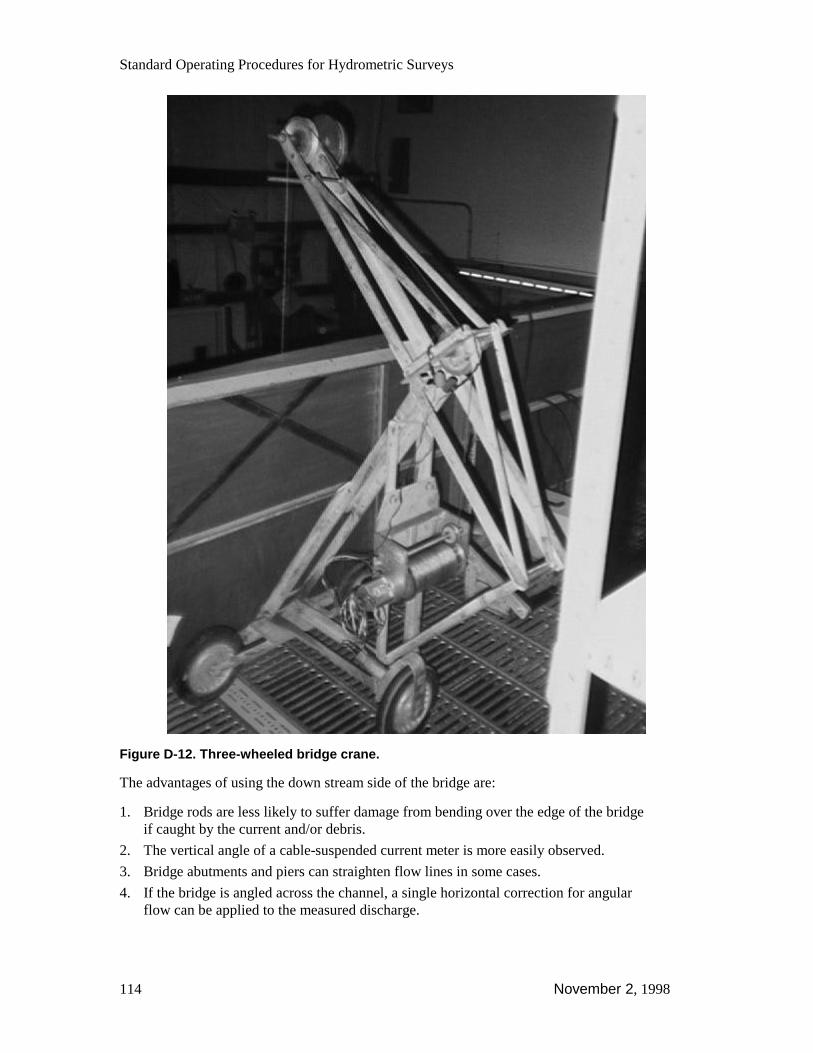
Standard Operating Procedures for Hydrometric Surveys
114 November 2, 1998
Figure D-12. Three-wheeled bridge crane.
The advantages of using the down stream side of the bridge are:
1. Bridge rods are less likely to suffer damage from bending over the edge of the bridgeif caught by the current and/or debris.
2. The vertical angle of a cable-suspended current meter is more easily observed.
3. Bridge abutments and piers can straighten flow lines in some cases.
4. If the bridge is angled across the channel, a single horizontal correction for angularflow can be applied to the measured discharge.

D. Streamflow Measurement Procedures
November 2, 1998 115
D.2.2.1 Measuring with a Bridge Rod1. Assemble sufficient sections of rod to reach the deepest point of the channel bed.
Probe the channel bed with the rod to determine the range of depths along themetering section. Then determine the number of outer rod sections required, basedon the following criteria:
a) To determine the depth, raise the meter to the surface, and read the graduatedinner rod where it emerges at the top of the location device. From this value,subtract the number of outer sections (1 m per section) to obtain the depth.
b) Multiply the depth by 0.2, and lower the meter to the obtained value. Againthis is done by subtracting the number of metric sections of outer rod.
c) The two values above represent the maximum range of readings to be madefrom the bridge deck. They also determine the number of inner and outer rodsections required.
2. Complete assembly of bridge rod and current meter. Attach two conductor electricalcables between meter and counter or headphones. Tape the cables to the outer rodsections at several points. Make sure the wires will not touch the propeller or metercups.
3. Depending on the type of site, stretch the tagline along the top of the bridge rail, theedge of the culvert headwall, or across the face of the culvert barrel.
4. Locate the initial point. It will usually be the bridge abutment, and should be on theright bank.
5. Prepare the discharge measurement field notes. From the initial exploration of depthand velocity distribution, decide on the spacing of the verticals and the mode ofmeasurement required, e.g. a 0.6 depth measurement if none of the depths exceed 1.0m (Section D.1.3.4, Observing Velocity).
6. Read the gauge. Note the time before starting the measurement.
7. Record the tagline distance from the initial point to the edge of the water. Record thedepth at water’s edge.
8. Position rod at the 1st vertical. Position the meter at the water surface with thepropeller or cups half submerged. Lock the locating device and read the graduatedrod at the top of the outer rod. Subtract the number of 1-m sections of outer rod andrecord distance from the initial point (station) and depth (Figure D-13).
9. Calculate the meter depth setting(s).
Note: Meter settings are referenced to the water surface. Therefore, whencalculating their values on a rod (measuring from the channel bed), use thereciprocal values of the 0.2, 0.6, and 0.8 methods. For example. to position themeter for a 0.6 measurement of velocity, multiply the observed depth by 0.4.

Standard Operating Procedures for Hydrometric Surveys
116 November 2, 1998
10. Set the meter at the required depth, allow it to stabilize, and start the counter orstopwatch. The number of revolutions divided by the interval in seconds producesthe value “n”.
11. Continue measuring distance, depth, and velocity along the cross section.
12. End the measurement at the water’s edge on the left bank. Record distance frominitial point (i.e. tagline distance), depth, time, and water level.
Note: The distance between the face of the structure and nearest vertical shouldnever be less than the diameter of the rotor or propeller of the meter, and thenonly when the technician can maintain precise control over the lower end of therod when it is being positioned.
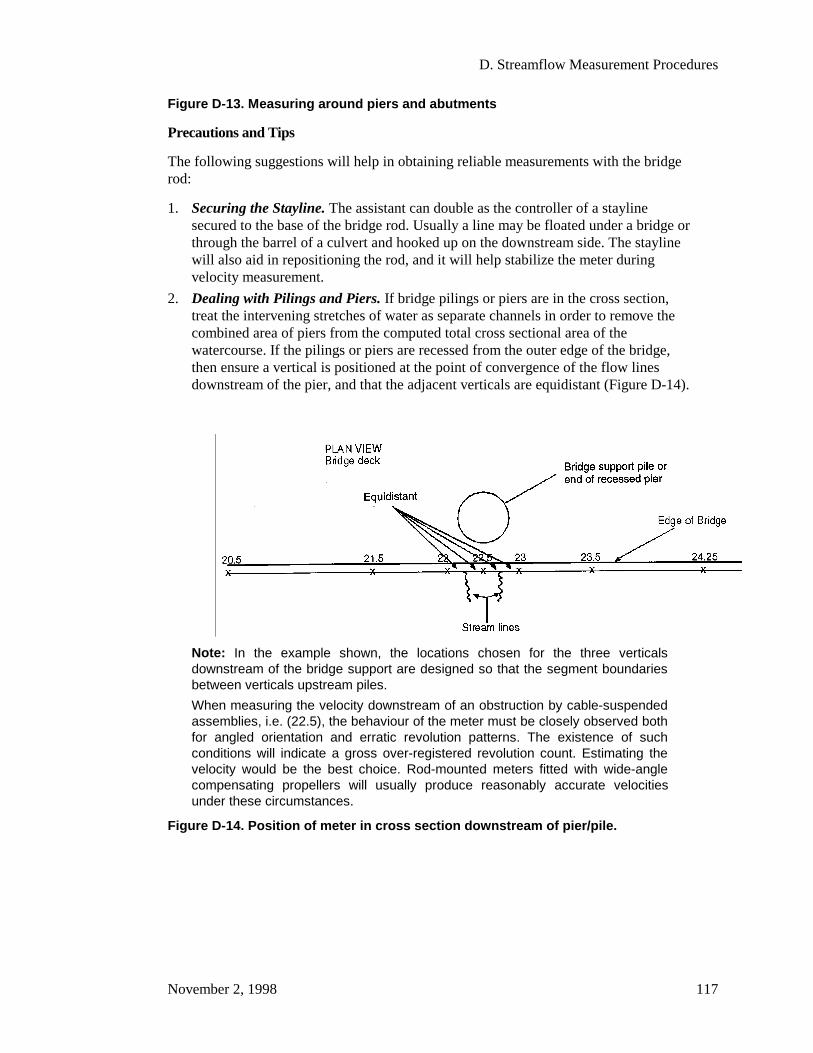
D. Streamflow Measurement Procedures
November 2, 1998 117
Figure D-13. Measuring around piers and abutments
Precautions and Tips
The following suggestions will help in obtaining reliable measurements with the bridgerod:
1. Securing the Stayline. The assistant can double as the controller of a staylinesecured to the base of the bridge rod. Usually a line may be floated under a bridge orthrough the barrel of a culvert and hooked up on the downstream side. The staylinewill also aid in repositioning the rod, and it will help stabilize the meter duringvelocity measurement.
2. Dealing with Pilings and Piers. If bridge pilings or piers are in the cross section,treat the intervening stretches of water as separate channels in order to remove thecombined area of piers from the computed total cross sectional area of thewatercourse. If the pilings or piers are recessed from the outer edge of the bridge,then ensure a vertical is positioned at the point of convergence of the flow linesdownstream of the pier, and that the adjacent verticals are equidistant (Figure D-14).
Note: In the example shown, the locations chosen for the three verticalsdownstream of the bridge support are designed so that the segment boundariesbetween verticals upstream piles.
When measuring the velocity downstream of an obstruction by cable-suspendedassemblies, i.e. (22.5), the behaviour of the meter must be closely observed bothfor angled orientation and erratic revolution patterns. The existence of suchconditions will indicate a gross over-registered revolution count. Estimating thevelocity would be the best choice. Rod-mounted meters fitted with wide-anglecompensating propellers will usually produce reasonably accurate velocitiesunder these circumstances.
Figure D-14. Position of meter in cross section downstream of pier/pile.

Standard Operating Procedures for Hydrometric Surveys
118 November 2, 1998
D.2.2.2 Measuring with a Cable-Suspended Current Meter
General
Another alternative to wading is to make discharge measurements when the current meteris suspended on a cable by a handline suspension (Figure D-15) or a reel suspension(Figure D-16).
Figure D-15. Handline in operation.
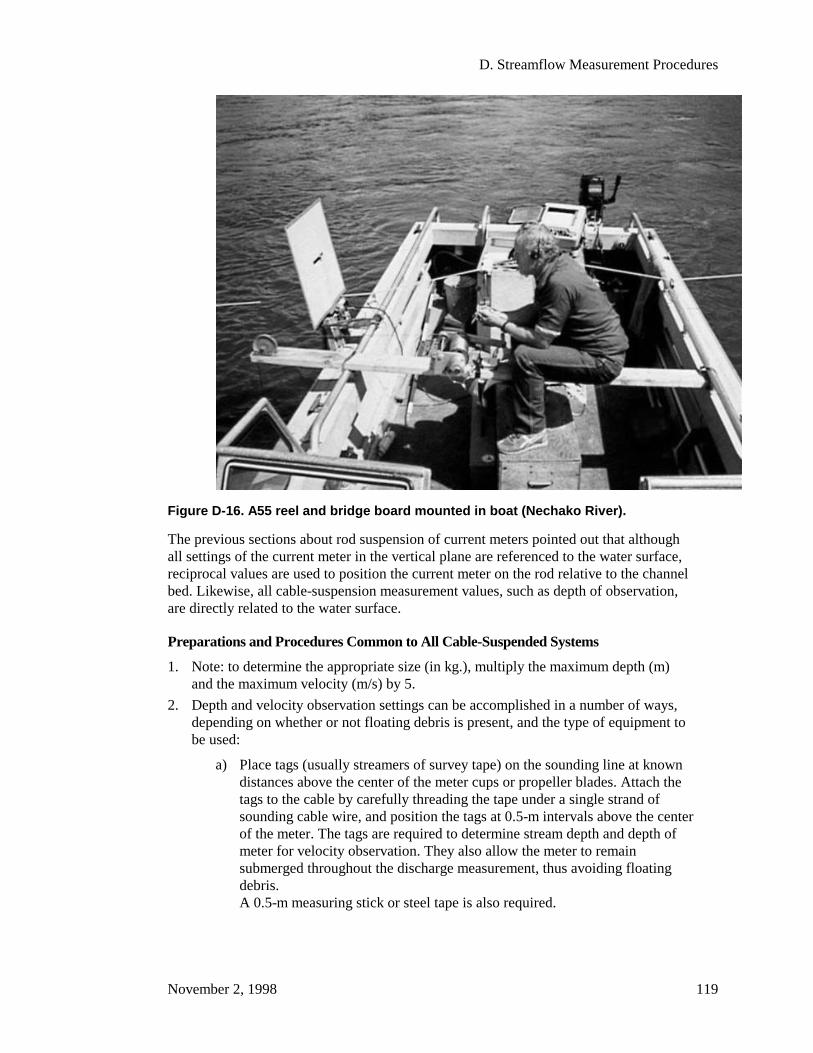
D. Streamflow Measurement Procedures
November 2, 1998 119
Figure D-16. A55 reel and bridge board mounted in boat (Nechako River).
The previous sections about rod suspension of current meters pointed out that althoughall settings of the current meter in the vertical plane are referenced to the water surface,reciprocal values are used to position the current meter on the rod relative to the channelbed. Likewise, all cable-suspension measurement values, such as depth of observation,are directly related to the water surface.
Preparations and Procedures Common to All Cable-Suspended Systems
1. Note: to determine the appropriate size (in kg.), multiply the maximum depth (m)and the maximum velocity (m/s) by 5.
2. Depth and velocity observation settings can be accomplished in a number of ways,depending on whether or not floating debris is present, and the type of equipment tobe used:
a) Place tags (usually streamers of survey tape) on the sounding line at knowndistances above the center of the meter cups or propeller blades. Attach thetags to the cable by carefully threading the tape under a single strand ofsounding cable wire, and position the tags at 0.5-m intervals above the centerof the meter. The tags are required to determine stream depth and depth ofmeter for velocity observation. They also allow the meter to remainsubmerged throughout the discharge measurement, thus avoiding floatingdebris.A 0.5-m measuring stick or steel tape is also required.
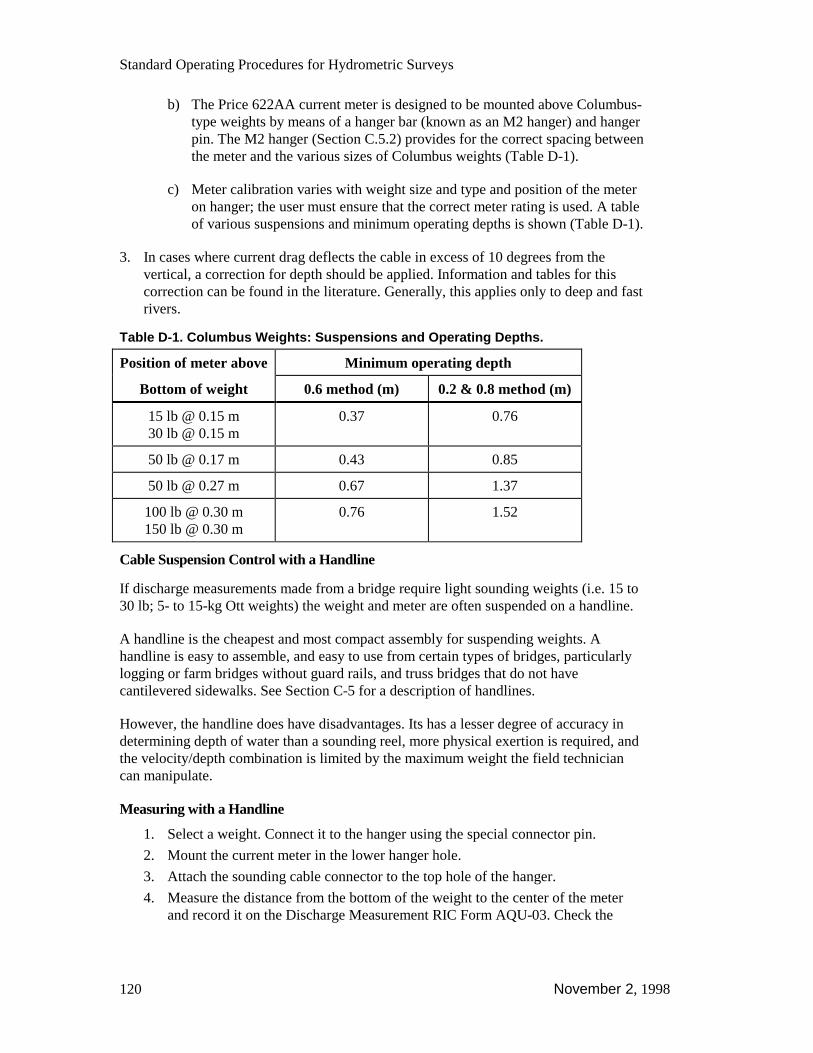
Standard Operating Procedures for Hydrometric Surveys
120 November 2, 1998
b) The Price 622AA current meter is designed to be mounted above Columbus-type weights by means of a hanger bar (known as an M2 hanger) and hangerpin. The M2 hanger (Section C.5.2) provides for the correct spacing betweenthe meter and the various sizes of Columbus weights (Table D-1).
c) Meter calibration varies with weight size and type and position of the meteron hanger; the user must ensure that the correct meter rating is used. A tableof various suspensions and minimum operating depths is shown (Table D-1).
3. In cases where current drag deflects the cable in excess of 10 degrees from thevertical, a correction for depth should be applied. Information and tables for thiscorrection can be found in the literature. Generally, this applies only to deep and fastrivers.
Table D-1. Columbus Weights: Suspensions and Operating Depths.
Position of meter above Minimum operating depth
Bottom of weight 0.6 method (m) 0.2 & 0.8 method (m)
15 lb @ 0.15 m30 lb @ 0.15 m
0.37 0.76
50 lb @ 0.17 m 0.43 0.85
50 lb @ 0.27 m 0.67 1.37
100 lb @ 0.30 m150 lb @ 0.30 m
0.76 1.52
Cable Suspension Control with a Handline
If discharge measurements made from a bridge require light sounding weights (i.e. 15 to30 lb; 5- to 15-kg Ott weights) the weight and meter are often suspended on a handline.
A handline is the cheapest and most compact assembly for suspending weights. Ahandline is easy to assemble, and easy to use from certain types of bridges, particularlylogging or farm bridges without guard rails, and truss bridges that do not havecantilevered sidewalks. See Section C-5 for a description of handlines.
However, the handline does have disadvantages. Its has a lesser degree of accuracy indetermining depth of water than a sounding reel, more physical exertion is required, andthe velocity/depth combination is limited by the maximum weight the field techniciancan manipulate.
Measuring with a Handline
1. Select a weight. Connect it to the hanger using the special connector pin.
2. Mount the current meter in the lower hanger hole.
3. Attach the sounding cable connector to the top hole of the hanger.
4. Measure the distance from the bottom of the weight to the center of the meterand record it on the Discharge Measurement RIC Form AQU-03. Check the
D. Streamflow Measurement Procedures
November 2, 1998 121
distance of sounding cable streamers (tags) from center of meter (normally 0.5 mintervals)
5. Stretch the tagline over cross section. Prepare the Discharge Measurement notessheet, noting gauge reading and time.
6. Connect headphones or counter to handline; spin meter, and check circuits.
7. Estimate or measure water depth at the deepest point on the cross section andunwind sufficient sounding cable from the reel (at least one tag marker should beshowing above the water).
8. Using the sounding line as a plumb-bob to define the water’s edge, record thehorizontal (tagline) distance and depth (depth may be zero).
9. Move assembly to the first selected vertical (as close as possible to the bridgeabutment), and start the measurement.Use the following method to measure depth and meter depth settings (Figure D-17).
10. To determine depth, first lower the sounding weight to the channel bed and thenraise the weight until one of the tags is at the water surface.Measure the distance that the weight is raised. Using a reference point on thebridge, measure along the rubber-covered cable with a steel tape or graduatedrod.Total depth of water = distance of the particular tag above the meter cups +distance the meter and weight were raised + distance from the bottom of theweight to the meter center.
11. To set the depth of observation for velocity, multiply the depth by 0.6, or 0.2 and0.8, and position the meter by means of the tag markers and measuring tape onrod. Weights up to 25 kg can be held in position by standing on the rubber-coated cable inside the bridge rail or guard.

Standard Operating Procedures for Hydrometric Surveys
122 November 2, 1998
Note: To avoid equipment damage, the vertical closest to the face of an abutmentor pier must be located a sufficient distance from the edge to allow for the lateralswing of the meter/weight assembly, and estimate the average depth andvelocity.
The width of the estimated discharge panel is two-thirds the distance betweenthe face of the structure and the nearest measured vertical.
Figure D-17. Spacing of verticals when measuring around piers.
Measuring with a Sounding Reel
A sounding reel is an alternative to using a handline to suspend the current meter in thewatercourse.
The steps for determining depth and position of the current meter in the vertical are thesame as described for the handline.
D. Streamflow Measurement Procedures
November 2, 1998 123
1. Select a weight. Connect it to the meter/weight hanger.
2. Measure and note the distance from the bottom of weight to the center of the currentmeter. If floating debris is present, attach a streamer tag to the cable 0.5 m above thecenter of the meter so that the meter can remain submerged.
3. To observe depth, lower the center of the meter to the water surface and set the depthcounter to zero. Lower the weight to the channel bed. Read the counter and add to itthe distance from bottom of weight to the center of meter. This is the observed depth.
4. To set the depth of observation for velocity, calculate the value for depth below thesurface (multiply depth by 0.2, 0.6, or 0.8). Raise the meter until the obtained valueis displayed in the counter.If debris is present, position the tag at the water surface and set the tag distanceabove the meter on the reel counter. Lower the weight to the channel bed and readthe counter.Depth = counter reading + distance from bottom of weight to center of meter +distance from center of meter to tag.
5. To set the depth of observation, raise the assembly until the counter registers thecalculated depth below the surface.
D.2.3 Measuring from a Bank-Controlled Cableway
Conducting the measurement with a cableway is generally preferred to doing it fromboats or from bridges with piers. The lengthy set up time required for boat measurementsis eliminated as are areas of disturbed flow caused by bridge abutments and piers. Safetyof personnel, and the possible need to employ a certified boat operator, are other factorsthat make cableways attractive.
Bank-controlled cableways employ a capstan drive arrangement that moves a traveleracross the river and positions the meter vertically and horizontally. They also send asignal from the meter through the suspension cable to the operator on shore, for velocitymeasurement. Cableways with cable cars for personnel are outside the scope of thismanual. See Section C-5 for a description of two kinds of bank-controlled cableways,and photographs.
Measuring with a Cableway
1. Record the size of weight and the position of the meter above the bottom of theweight or bottom feeler plate.
2. Locate the initial point. It will usually be located near the top of bank on the controlside of the watercourse.
3. Position the meter over the initial point, and set the horizontal displacement at zero.Move the meter assembly directly over the nearest water edge and note distance fromthe initial point. Do not touch the horizontal reset lever during the course of themeasurement.
4. Observe and record soundings to the nearest 2 cm at each vertical. Be careful not toover estimate depth by allowing the cable to extend beyond the point when thesounding weight initially touches bottom. The distribution of verticals must be inaccordance with that outlined in Section B.2.4.
5. At each vertical, set meter to appropriate depths for velocity measurement. Observeand record the time and revolutions of the current meter.
Standard Operating Procedures for Hydrometric Surveys
124 November 2, 1998
6. At the end of the measurement, record the time of completion and make some notesto identify the edge of the channel. Record any pertinent information that may havehad an effect on the measurement results.
Precautions and Tips
1. Marking the Initial Point. The initial point should be marked very clearly becauseall distances, observations of depth, and velocities must be referenced to this point.This information must be included in the field data book.
2. “Zeroing” the Meter. Soundings are usually made with the meter at the watersurface, that is, with the bottom half of the bucket wheel or propeller submerged andthe horizontal section of the tail assembly at the water surface. The distance betweenthe meter and the bottom of the weight must be added to the soundings indicated onthe reel counter to obtain the correct depth. The slight amount of drag on the meterand weight when the “meter is zero-ed” has a stabilizing effect that makes theprocess of sounding quicker and easier than when attempting to “zero” the bottom ofthe weight. There is also the convenience of not having to apply a correction eachtime the meter is positioned in the vertical.
3. Effects of Vertical Movement of the Meter. Some cables may undulate from thepulling motion required to move the traveler block from one vertical to the next, orfrom vigorous cranking movements when sounding with heavy weights. This motionmust be allowed to subside before carrying out the depth and velocity observations.This is of particular importance when measuring velocities below 0.75 m/s, becausethe effects of vertical movement on the current meter are significant in this range.
4. Direction of Flow. The direction of flow is often not perpendicular to the meteringsection. Even worse, the flow may be inconsistent throughout the section, or the flowmay change from vertical to vertical with the section, and vary with changes in stage.In these cases, measure the cosine value; make the appropriate correction for angularflow.
D.3 Post-Measurement Activities and DischargeMeasurement Computation
D.3.1 Errors Affecting Accuracy
The purpose of this section is to identify some of the common factors that lead toinaccuracies when observing widths, depths, and velocities. Inaccuracies can occurduring the measurement of any of these parameters through errors introduced bytechnique or the type of equipment used. Errors can be categorized as human, systematic,or random.
D.3.1.1 Width Measurement
Measuring overall stream width and defining individual verticals, using a measuring tapeor tagged nylon chain, can be done with precision and neither contributes to overall errorin a discharge measurement. Human error can be a factor when measuring permanentlymarked cross sections on bridge rails or other structures if unconventional spacing hasbeen employed. Wind can oscillate the tape and lead to movement of the tape anchoragepoints and/or mistakes in observing values.
D. Streamflow Measurement Procedures
November 2, 1998 125
Record keeping errors can occur during boat measurements when the boat is positionedby electronic or survey equipment operated on shore with the rest of the data recorded inthe boat. To avoid errors, good communication and post-measurement record comparisonare essential.
D.3.1.2 Depth Measurement
Depth observations made by rod are subject to random errors such as the sinking of therod into a soft streambed, failure to identify obstructions in the cross section betweensoundings, and incorrect reading of the graduated rod.
The opportunity for error is far greater when cable suspension systems are employed. Inaddition to the errors listed for rod measurements, certain techniques used in themeasurement process can result in errors in the recording of depth. The most obvious andmost common error is the failure to add the distance from the bottom of the weight to thecenter of the meter when the latter point of reference has been used to “zero” the reel orhandline at water surface. Other errors peculiar to the handline suspension occur as aresult of mistakes in the method of subdividing the distance between cable markers(streamers) and applying to obtain exact depths.
D.3.1.3 Measurement of Velocity
Other sources of significant error in a discharge measurement are those that relate to themeasurement of velocity. Among the more readily apparent are those associated with thecalibration of current meters, the direction of flow, the duration of the observation time,and the number of observation verticals as well as the number of observation points ineach vertical.
Calibration
The Province of British Columbia has maintained a standard, similar to the Water Surveyof Canada, that all current meters have individual calibrations. These are obtained bytowing the meters through a tank of still water at velocities of between 4.5 to 300 cm/s,and from this individual calibration curves are developed. Although it is generallyaccepted that this procedure is equivalent to the stream gauging situation where the meteris held in flowing water, there is some question about the validity of this assumptionwhen using the meter (particularly cup-type meters) under turbulent flow conditions.
Direction of Flow
Discharge measurement cross sections are usually chosen so that the flow isperpendicular to the cross section. Even though they are carefully selected, it is notalways possible to avoid oblique flows at some of the verticals. At these verticals thevelocities must be corrected by applying an appropriate cosine coefficient. Randomerrors may be introduced when observing the angle of flow if it is assumed that the angleobserved at or near the surface remains the same throughout the entire depth.
Other sources of error can be introduced when using rod suspensions and in particularwhen used in deep fast-flowing water. Although the current meter can be misalignedboth vertically and horizontally with the direction of flows, the most significant errorwill result from vertical misalignment. The current meter will under register if tilted

Standard Operating Procedures for Hydrometric Surveys
126 November 2, 1998
above or below the horizontal, and the magnitude of the error will depend upon both thevelocity of the water and the angle of departure.
Duration of Observation Time
Pulsations in velocity are evident in all streams even though flow conditions areessentially steady. Because pulsations are random in nature, the effects of pulsation willbe eliminated when velocities are observed for a sufficient length of time. In actualpractice during a discharge measurement, velocities are observed for relatively shortperiods of time. The expectation is that a sufficient number of observations will be madeso that pulsation effects will tend to cancel each other during the course of ameasurement. Studies have shown that at low velocities, pulsation effects are usuallygreatest. Studies have also shown that the optimum observation duration is between 40and 60 seconds and that accuracy decreases significantly if a duration of less than 30seconds is used; for durations longer than 60 seconds, the increase in accuracy isgenerally negligible.
Number of Observations
There are two ways in which the accuracy of a discharge measurement can besignificantly affected by the number and distribution of observation verticals. First, theobservation verticals are used to define the channel cross-sectional area. Appreciableerrors will be introduced if the number of observations made to define the cross sectionare not sufficient. This particular problem can be overcome by obtaining additional depthobservations.
Secondly, the velocity observations in the verticals are used to define the mean velocityin the cross section; therefore, the verticals should be spaced so that the velocitiesobserved are more representative of those in the preceding half panel and the followinghalf panel.
The spacing of observation verticals can be accomplished on the basis of either the equalflow method, the equal width method, or a combination. With the equal flow method, thewidth segment can change frequently, and using the mid-section method forcomputations the horizontal velocity profile tends to be distorted. That is, if the widthsegments change frequently, the observed velocities will not occur at the midpoint of thepanels.
A good compromise is to use the equal width method and to change the spacing ofverticals only a few times during a measurement to accommodate any significant changesin flow distribution.
Studies on measurement accuracy have shown that accuracy tends to be low when fewerthan 16 verticals are used but the improvement becomes negligible when more than 35verticals are used. All else being equal, the use of 20 - 25 verticals is consideredoptimum.
Number of Observation Points in a Vertical
The mean velocity in a vertical is normally obtained by measuring at one or two points inthat vertical. Comparing these observations with those obtained by some detailed method

D. Streamflow Measurement Procedures
November 2, 1998 127
(a mean of observations at every tenth of the depth, plus half the value observed at thesurface and half the value at the bottom), indicated that random errors do occur whendetermining the mean velocity in any given vertical. Furthermore, the one-point methodis usually not as accurate as the two-point method. Nevertheless, surface and bottomeffects become significant as the stream depths decrease, and when depths are less than0.8 m, the one-point method should be used.
D.3.1.4 Conclusions
Errors in the measurement of width, depth, and velocity as well as the lack of care inchoosing the number of verticals and observations in a vertical, all combine to reduce theoverall accuracy of a discharge measurement. To a large extent, human errors can beavoided by careful attention to detail and by adhering to established and proventechniques and routines. Systematic errors can be reduced significantly by propermaintenance and calibration of instruments and equipment, and by adequate training.However, random errors will always occur. A significant reduction in these errors can beachieved if the field technician obtaining the measurement can recognize the potentialproblem areas and can take the appropriate precautionary measures to avoid or minimizethem. One possible indication of measurement accuracy can be obtained by conductingseveral consecutive or simultaneous measurements, and by using different sets ofequipment and different techniques.
D.3.2 Mean Section Method
Prior to 1974 the Water Investigations Branch used another form of computation ofdischarge. This involved doubling the values of depth and velocity taken at the verticaland adding the value of depths and velocities of the preceding and following verticals.Twenty-five per cent of the sum of both depth and velocity was then used to calculate themean discharge using a width for this partial section of one half the distance from thepreceding vertical to one half the distance to the following vertical.
After a period in which check computations were carried out by computer programs andthe results of both mid-section and mean section were produced, it was determined that acomparison of the results using both methods produced differences of less than 1% inmost instances. The province adopted the mid-section method for all subsequentdischarge calculation.
D.3.3 Mid-Section Method
The mid-section method of computing discharge measurements is carried out as follows:
1. Observed depth at the vertical is considered to be the mean depth for the section orpanel.
2. It is assumed that the mean velocity at the observation vertical represents the meanvelocity for the section.
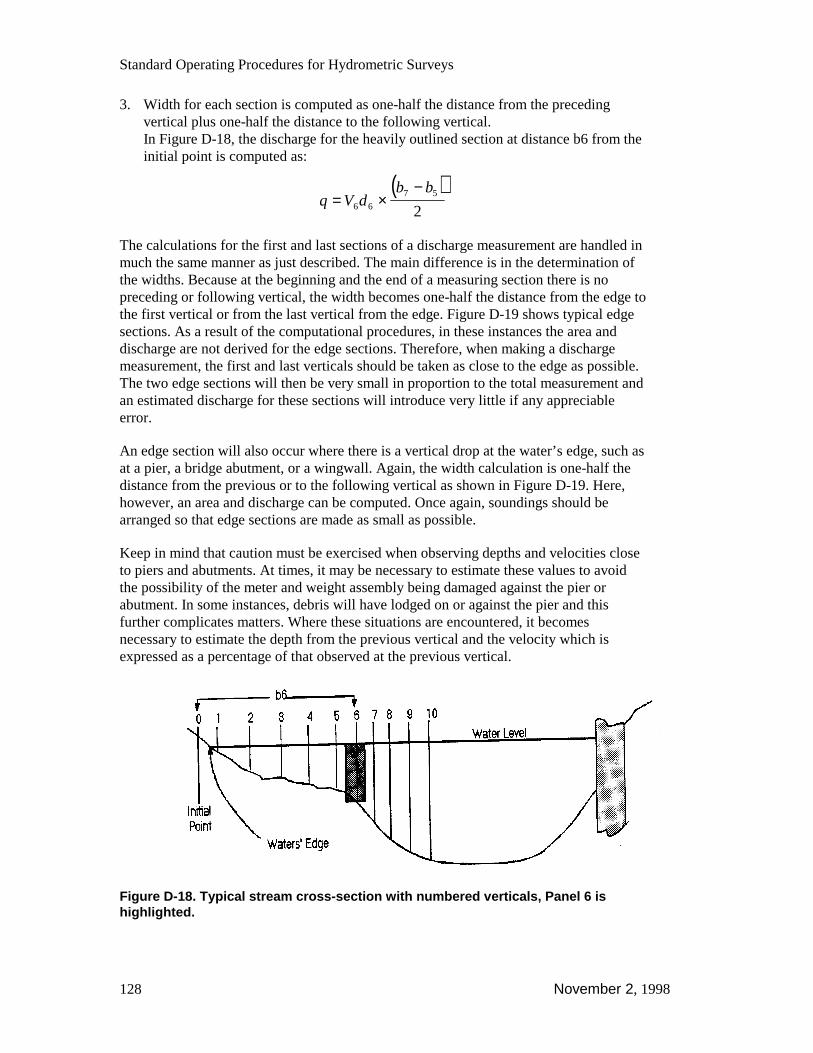
Standard Operating Procedures for Hydrometric Surveys
128 November 2, 1998
3. Width for each section is computed as one-half the distance from the precedingvertical plus one-half the distance to the following vertical.In Figure D-18, the discharge for the heavily outlined section at distance b6 from theinitial point is computed as:
( )q V d
b b= ×
−6 6
7 5
2
The calculations for the first and last sections of a discharge measurement are handled inmuch the same manner as just described. The main difference is in the determination ofthe widths. Because at the beginning and the end of a measuring section there is nopreceding or following vertical, the width becomes one-half the distance from the edge tothe first vertical or from the last vertical from the edge. Figure D-19 shows typical edgesections. As a result of the computational procedures, in these instances the area anddischarge are not derived for the edge sections. Therefore, when making a dischargemeasurement, the first and last verticals should be taken as close to the edge as possible.The two edge sections will then be very small in proportion to the total measurement andan estimated discharge for these sections will introduce very little if any appreciableerror.
An edge section will also occur where there is a vertical drop at the water’s edge, such asat a pier, a bridge abutment, or a wingwall. Again, the width calculation is one-half thedistance from the previous or to the following vertical as shown in Figure D-19. Here,however, an area and discharge can be computed. Once again, soundings should bearranged so that edge sections are made as small as possible.
Keep in mind that caution must be exercised when observing depths and velocities closeto piers and abutments. At times, it may be necessary to estimate these values to avoidthe possibility of the meter and weight assembly being damaged against the pier orabutment. In some instances, debris will have lodged on or against the pier and thisfurther complicates matters. Where these situations are encountered, it becomesnecessary to estimate the depth from the previous vertical and the velocity which isexpressed as a percentage of that observed at the previous vertical.
Figure D-18. Typical stream cross-section with numbered verticals, Panel 6 ishighlighted.
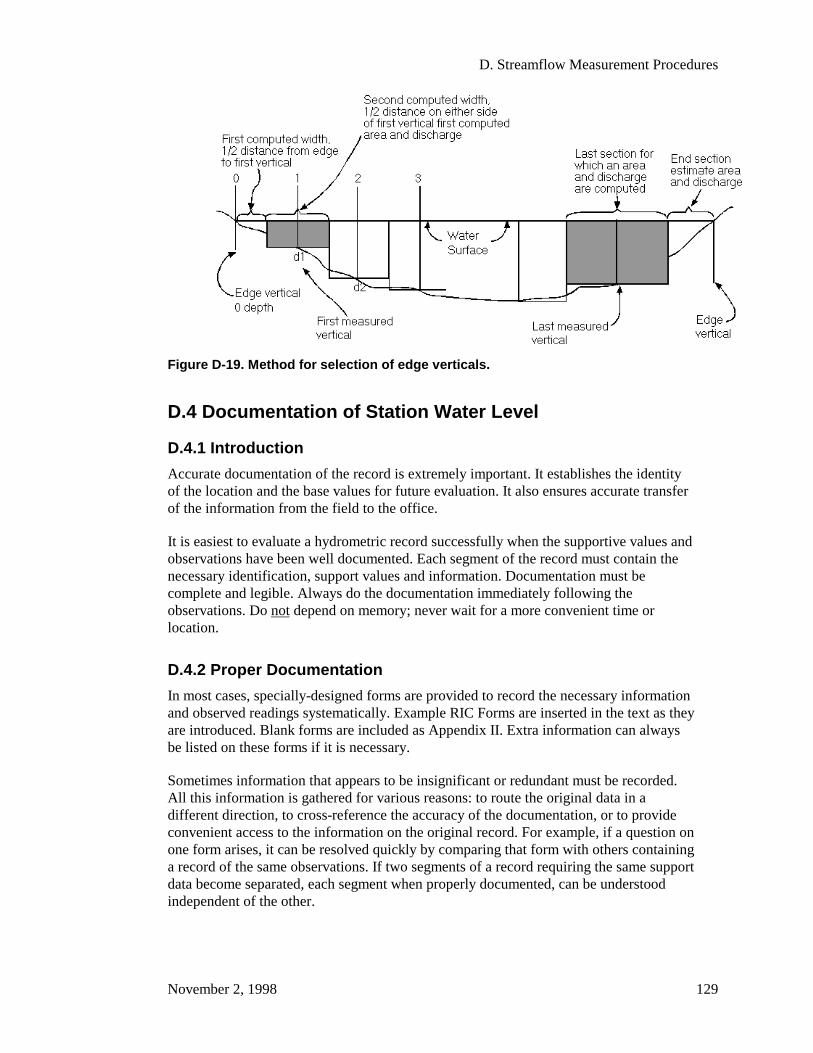
D. Streamflow Measurement Procedures
November 2, 1998 129
Figure D-19. Method for selection of edge verticals.
D.4 Documentation of Station Water Level
D.4.1 Introduction
Accurate documentation of the record is extremely important. It establishes the identityof the location and the base values for future evaluation. It also ensures accurate transferof the information from the field to the office.
It is easiest to evaluate a hydrometric record successfully when the supportive values andobservations have been well documented. Each segment of the record must contain thenecessary identification, support values and information. Documentation must becomplete and legible. Always do the documentation immediately following theobservations. Do not depend on memory; never wait for a more convenient time orlocation.
D.4.2 Proper Documentation
In most cases, specially-designed forms are provided to record the necessary informationand observed readings systematically. Example RIC Forms are inserted in the text as theyare introduced. Blank forms are included as Appendix II. Extra information can alwaysbe listed on these forms if it is necessary.
Sometimes information that appears to be insignificant or redundant must be recorded.All this information is gathered for various reasons: to route the original data in adifferent direction, to cross-reference the accuracy of the documentation, or to provideconvenient access to the information on the original record. For example, if a question onone form arises, it can be resolved quickly by comparing that form with others containinga record of the same observations. If two segments of a record requiring the same supportdata become separated, each segment when properly documented, can be understoodindependent of the other.

Standard Operating Procedures for Hydrometric Surveys
130 November 2, 1998
D.4.3 Station Log Form
Form AQU-06 Water Stage Recorder - Station Record for the Year ___ (Figure D-20)posted within the recorder shelter, provides a convenient record of observed data from allpast visits to the station. The Remarks column shows the method used for pastmeasurements and indicates a safe limit of stage for stream wading. Level checks of thegauges are noted, along with any necessary gauge correction. Update the form beforeleaving the site. The station log form, properly documented, provides a ready referenceto the station operation history.
D.4.4 Discharge Measurement Note
Make all field data entries on the meter note front sheet at the time of observation and.before leaving the site, complete the form properly. The time, gauge heights, and generalinformation recorded on this form establish the baseline data.
Figure D-20. Example of completed RIC Form AQU-06, Water Stage Recorder -Station Record for the Year _____
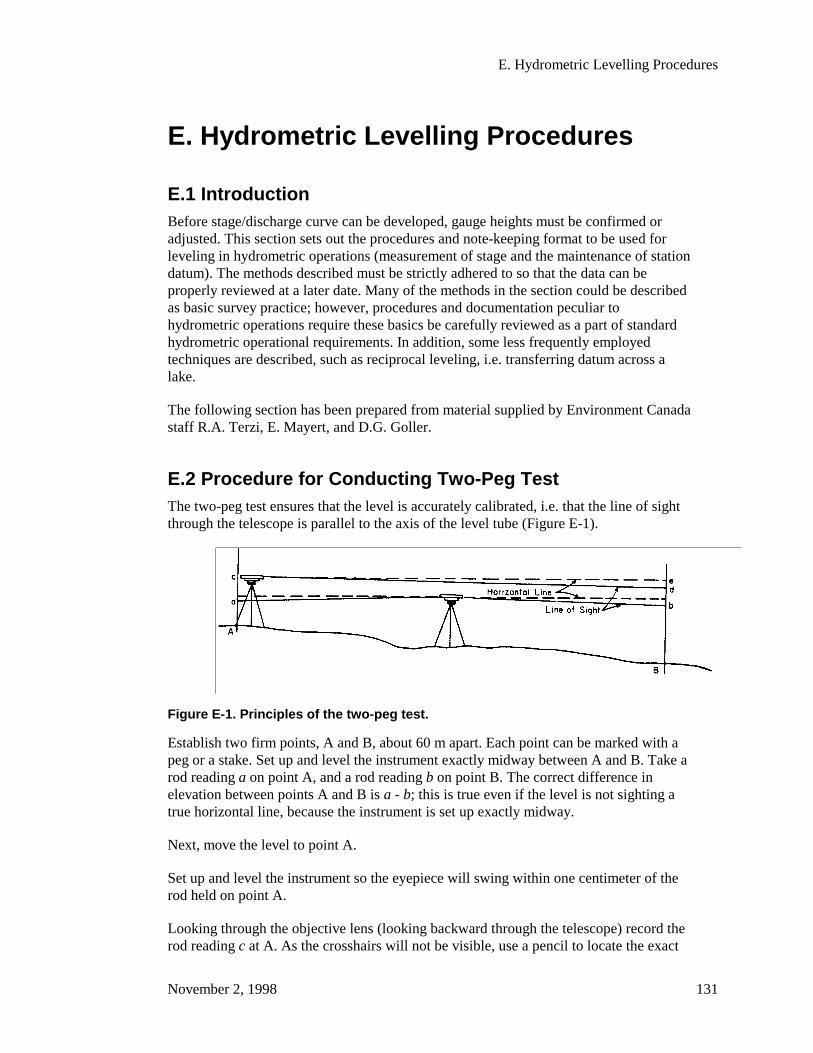
E. Hydrometric Levelling Procedures
November 2, 1998 131
E. Hydrometric Levelling Procedures
E.1 IntroductionBefore stage/discharge curve can be developed, gauge heights must be confirmed oradjusted. This section sets out the procedures and note-keeping format to be used forleveling in hydrometric operations (measurement of stage and the maintenance of stationdatum). The methods described must be strictly adhered to so that the data can beproperly reviewed at a later date. Many of the methods in the section could be describedas basic survey practice; however, procedures and documentation peculiar tohydrometric operations require these basics be carefully reviewed as a part of standardhydrometric operational requirements. In addition, some less frequently employedtechniques are described, such as reciprocal leveling, i.e. transferring datum across alake.
The following section has been prepared from material supplied by Environment Canadastaff R.A. Terzi, E. Mayert, and D.G. Goller.
E.2 Procedure for Conducting Two-Peg TestThe two-peg test ensures that the level is accurately calibrated, i.e. that the line of sightthrough the telescope is parallel to the axis of the level tube (Figure E-1).
Figure E-1. Principles of the two-peg test.
Establish two firm points, A and B, about 60 m apart. Each point can be marked with apeg or a stake. Set up and level the instrument exactly midway between A and B. Take arod reading a on point A, and a rod reading b on point B. The correct difference inelevation between points A and B is a - b; this is true even if the level is not sighting atrue horizontal line, because the instrument is set up exactly midway.
Next, move the level to point A.
Set up and level the instrument so the eyepiece will swing within one centimeter of therod held on point A.
Looking through the objective lens (looking backward through the telescope) record therod reading c at A. As the crosshairs will not be visible, use a pencil to locate the exact
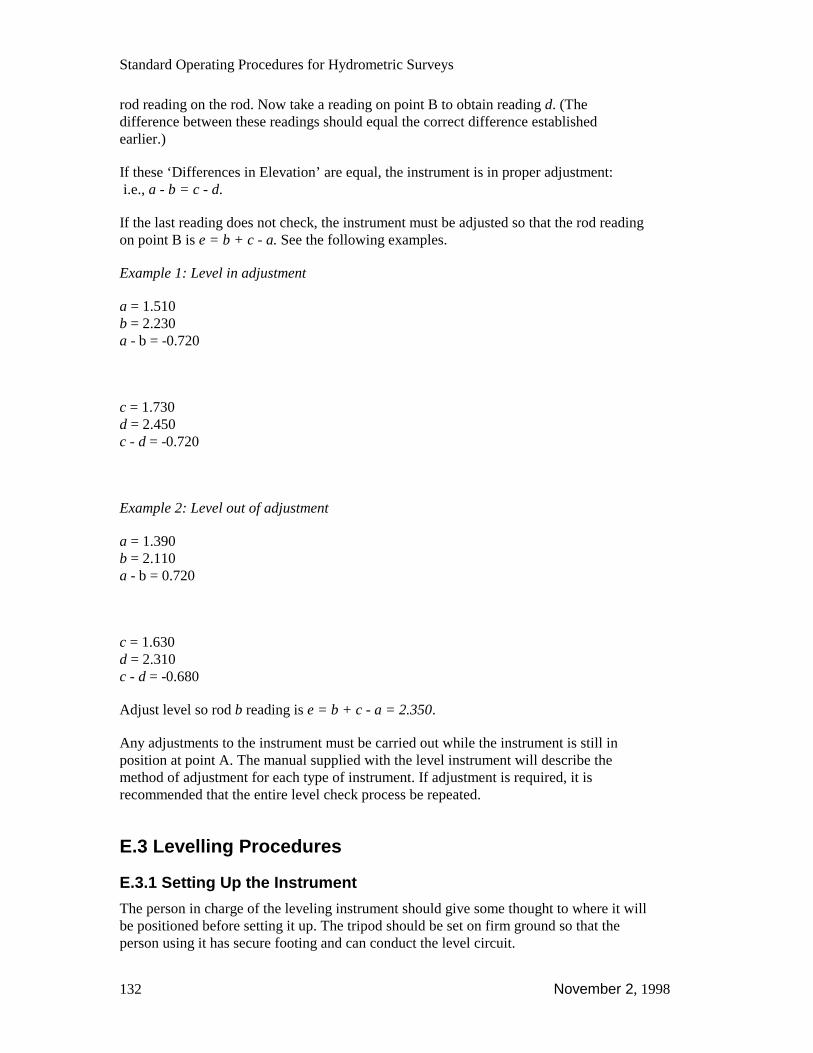
Standard Operating Procedures for Hydrometric Surveys
132 November 2, 1998
rod reading on the rod. Now take a reading on point B to obtain reading d. (Thedifference between these readings should equal the correct difference establishedearlier.)
If these ‘Differences in Elevation’ are equal, the instrument is in proper adjustment: i.e., a - b = c - d.
If the last reading does not check, the instrument must be adjusted so that the rod readingon point B is e = b + c - a. See the following examples.
Example 1: Level in adjustment
a = 1.510b = 2.230a - b = -0.720
c = 1.730d = 2.450c - d = -0.720
Example 2: Level out of adjustment
a = 1.390b = 2.110a - b = 0.720
c = 1.630d = 2.310c - d = -0.680
Adjust level so rod b reading is e = b + c - a = 2.350.
Any adjustments to the instrument must be carried out while the instrument is still inposition at point A. The manual supplied with the level instrument will describe themethod of adjustment for each type of instrument. If adjustment is required, it isrecommended that the entire level check process be repeated.
E.3 Levelling Procedures
E.3.1 Setting Up the Instrument
The person in charge of the leveling instrument should give some thought to where it willbe positioned before setting it up. The tripod should be set on firm ground so that theperson using it has secure footing and can conduct the level circuit.

E. Hydrometric Levelling Procedures
November 2, 1998 133
The level and tripod are placed in a desired location with the tripod legs spread wellapart and firmly pressed into the ground by standing on the feet at the base of the tripod.The tripod head should be nearly level with the telescope and at a convenient height forsighting. On hillsides, place one leg of the tripod uphill and two downhill for betterstability. If the tripod has a domed head, the instrument can be shifted so that the circularbubble is near level. Coarse level adjustment can be obtained by using the foot-screws onthe base so that the circular bubble can be carefully centered in the middle of its settingcircle.
The level must first be adjusted so the crosshairs are in focus for the operator, whichrequires the following steps. Point the telescope towards a uniformly light-colouredsurface, or a sheet of white paper. Turn the telescope eyepiece until the reticulecrosshairs appear sharp and absolutely black. Turn the eyepiece slowly until the imagestarts to go out of focus. A small rotation in the opposite direction will refocus the hairscorrectly. This setting corresponds to the technician’s eyesight; it is constant, butindividual to each technician.
The telescope can be pointed roughly at the leveling rod, by looking along the open sightand turning the instrument by hand. Set the vertical hair of the reticule cross along themiddle of the rod image by turning the horizontal adjustment screw. Turn the focusingknob until the image of the rod graduations are sharp. The observer should move his/hereye up and down and from side to side behind the eyepiece, to ensure parallax does notexist (there should be no movement between the staff image and the reticule cross whenviewed in slightly different positions). If such parallax is observed, the instrument mustbe refocused, as described in the previous paragraph. In the case of self-levelinginstruments, the line of sight is now horizontal and the rod is ready to be read.
With a tilting level, the line of sight must be set horizontally using the tubular bubble.Position the fixed reflector for optimum illumination of the tubular bubble as seenthrough the bubble viewing eyepiece. The split bubble image seen in that eyepiece mustbe set to coincidence, by turning the tilting knob below the eyepiece. When the bubbleends are far from coincidence. an arrow in the bubble image indicates the properdirection to turn the tilting screw to obtain coincidence. The split bubble should bechecked before each reading of the rod.
E.3.2 Positioning and Reading the Rod
The rod is positioned properly by placing it vertically on the point of a stable object. Therod must then be held plumb. The instrument person can tell if the rod is plumb in onedirection by observing if the rod is parallel to the vertical cross-hair, but he/she can nottell whether it is tipped forward or backward. Therefore, the rodperson should use a rodlevel to plumb the rod in this direction. If the rodperson does not have a rod level,plumbing of the rod can be accomplished by balancing the rod between two fingers (ifthere is no wind). Waving the rod slowly towards and away from the instrument andobserving the lowest reading on the rod is another method of ensuring that the rod isvertical, as in Figure E-2.

Standard Operating Procedures for Hydrometric Surveys
134 November 2, 1998
Figure E-2. Positioning the rod.
Errors created by not holding the rod plumb are much greater for readings taken near thetop of the rod than for those taken at the bottom.
When the instrument is properly leveled and the rod is in a vertical position, thetechnician observes and records the reading indicated by the horizontal crosshair on therod as seen through the telescope. To verify the accuracy of the reading, observe the splitbubble and the rod reading again.
The telescope reticule has stadia lines, one above and one below the centre crosshair.The average of the readings of stadia lines on the rod represents the actual horizontalreading. The difference of the two stadia readings multiplied by 100 represents thedistance between the instrument and the rod (Figure E-3).
E. Hydrometric Levelling Procedures
November 2, 1998 135
Figure E-3. Reading the rod height 3.456 m, distance 29.2 m, (Source: AutomaticLevel, Wild NAO, Instructions for Use, Manual G2 106e - IX.80, p.9).
Normally, rod readings to 0.002 m are sufficient. Reading to 0.001 m implies a degree ofaccuracy that does not exist and is generally inconsistent with the sensitivity of theequipment used to gather other stage data.
E.3.3 Level Notes
Recording accurate and complete field notes is the most important part of the levelingoperation. Notes and sketches constitute a permanent record of the survey, and it shouldbe possible for them to be interpreted with ease by anyone having a knowledge ofleveling. Non-standard notes that can be interpreted only by the note keeper areunacceptable.
The format for recording level notes during routine level checks of gauges and normalline or differential leveling between bench marks (with backsights and foresightsapproximately balanced) is shown in Figure E-4.

Standard Operating Procedures for Hydrometric Surveys
136 November 2, 1998
Figure E-4. Level notes between two bench marks, Muddy River at new gaugingstation.
Hydrometric level note forms are divided into columns for recording observations andcomputing elevations. The lower part of the level sheet, or an additional sheet, is used forrecording the necessary descriptive notes that must accompany the observation sheet.
When recording notes, enter the elevation of the bench mark or reference mark on the topline in the column headed Elevation. The bench mark identification number is entered inthe column headed Station, with any descriptive information recorded in the space at theright. Should it be necessary, an additional description sheet can be attached to the notes.On the top line, in the column headed BS (backsight), the reading obtained with theleveling rod held on the benchmark or point of known elevation is entered as thebacksight. The value for the column height of instrument HT.INST. or HI is computed byadding the backsight value to the known bench mark elevation. One line down, in thenext column, headed foresight (FS), the foresight reading for the point for which anelevation is to be determined is observed and recorded. Commonly called a turning point(TP), this value is then subtracted from the HI and the result is the elevation of theforesight point. This is entered in the elevation column and on the same line as theforesight just observed. When the instrument is moved, the new height of instrument isdetermined by a backsight on the TP. The observation and notes are continued in thismanner until the circuit is closed by leveling back to the original bench mark.
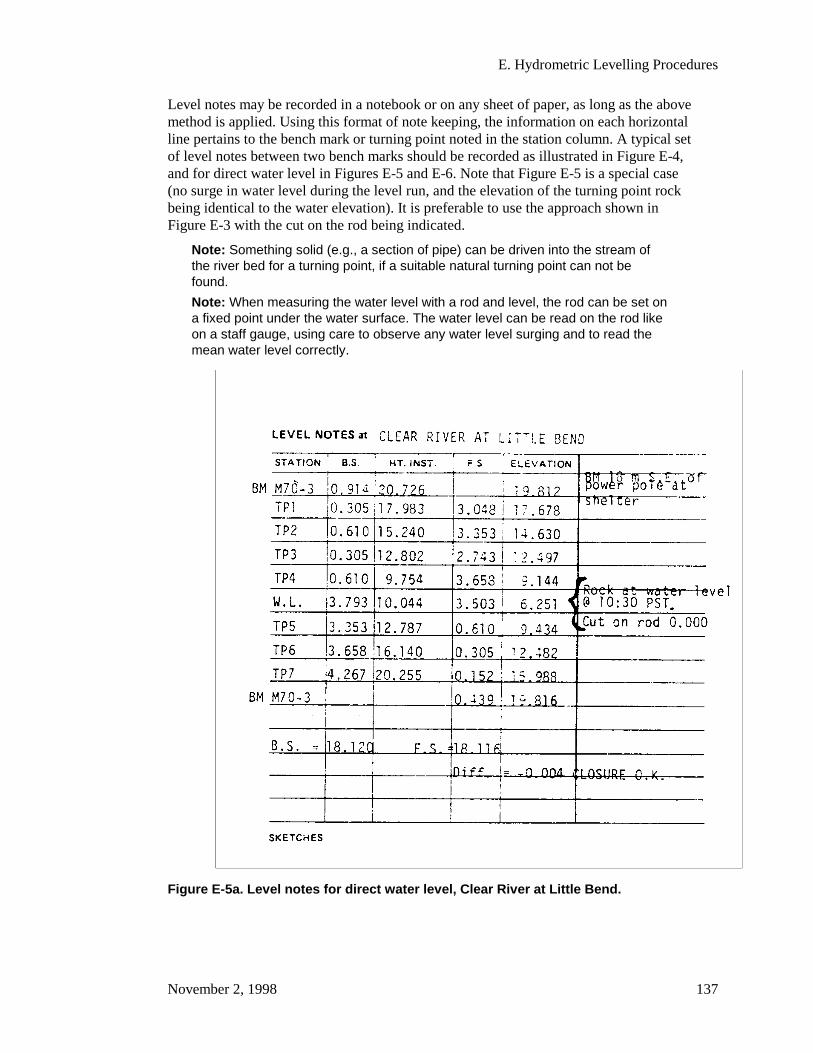
E. Hydrometric Levelling Procedures
November 2, 1998 137
Level notes may be recorded in a notebook or on any sheet of paper, as long as the abovemethod is applied. Using this format of note keeping, the information on each horizontalline pertains to the bench mark or turning point noted in the station column. A typical setof level notes between two bench marks should be recorded as illustrated in Figure E-4,and for direct water level in Figures E-5 and E-6. Note that Figure E-5 is a special case(no surge in water level during the level run, and the elevation of the turning point rockbeing identical to the water elevation). It is preferable to use the approach shown inFigure E-3 with the cut on the rod being indicated.
Note: Something solid (e.g., a section of pipe) can be driven into the stream ofthe river bed for a turning point, if a suitable natural turning point can not befound.
Note: When measuring the water level with a rod and level, the rod can be set ona fixed point under the water surface. The water level can be read on the rod likeon a staff gauge, using care to observe any water level surging and to read themean water level correctly.
Figure E-5a. Level notes for direct water level, Clear River at Little Bend.
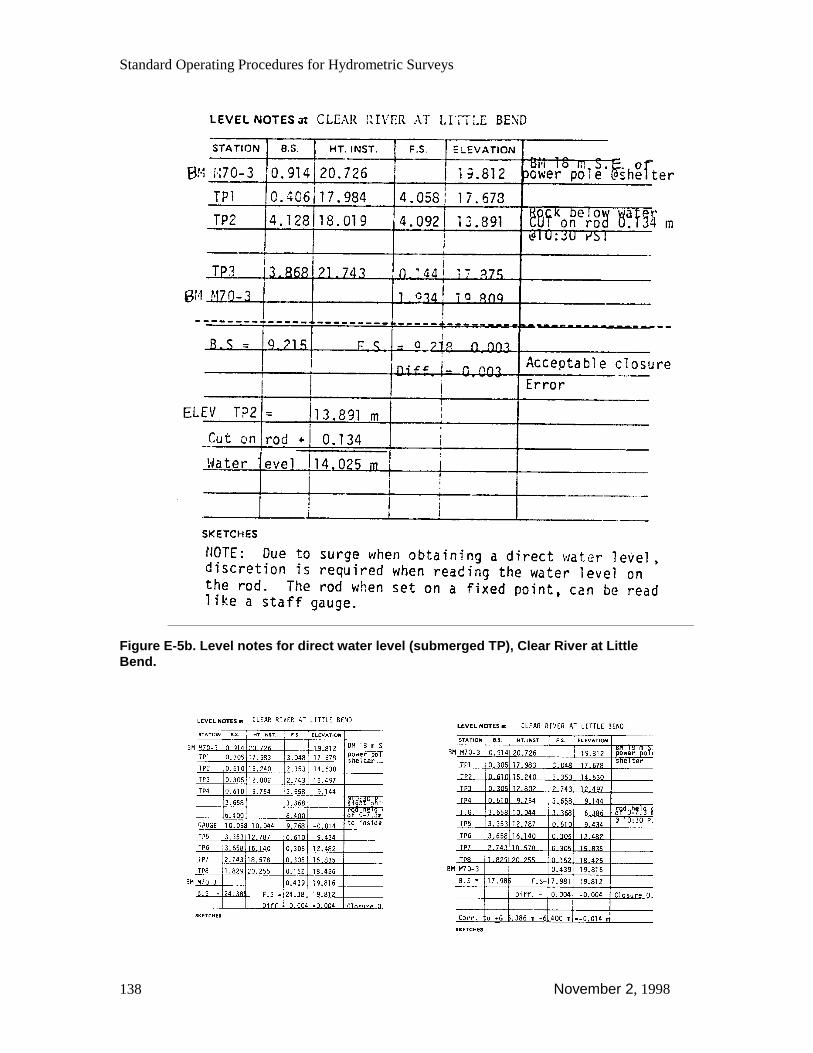
Standard Operating Procedures for Hydrometric Surveys
138 November 2, 1998
Figure E-5b. Level notes for direct water level (submerged TP), Clear River at LittleBend.
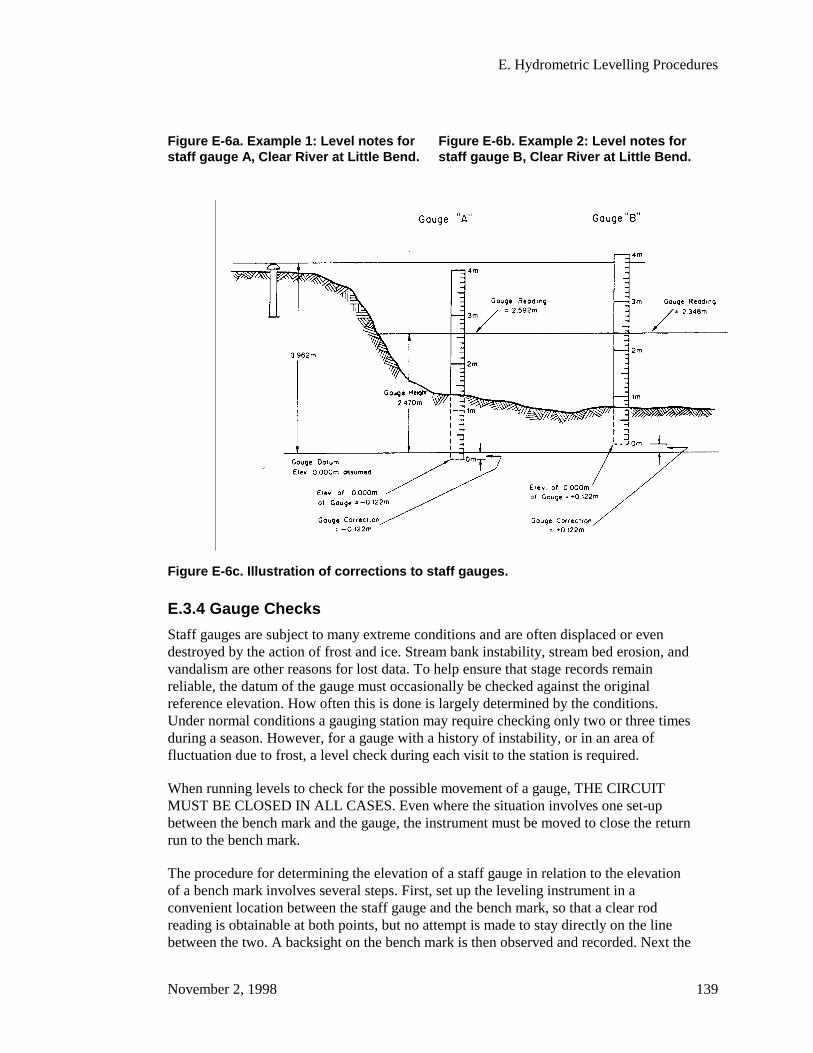
E. Hydrometric Levelling Procedures
November 2, 1998 139
Figure E-6a. Example 1: Level notes forstaff gauge A, Clear River at Little Bend.
Figure E-6b. Example 2: Level notes forstaff gauge B, Clear River at Little Bend.
Figure E-6c. Illustration of corrections to staff gauges.
E.3.4 Gauge Checks
Staff gauges are subject to many extreme conditions and are often displaced or evendestroyed by the action of frost and ice. Stream bank instability, stream bed erosion, andvandalism are other reasons for lost data. To help ensure that stage records remainreliable, the datum of the gauge must occasionally be checked against the originalreference elevation. How often this is done is largely determined by the conditions.Under normal conditions a gauging station may require checking only two or three timesduring a season. However, for a gauge with a history of instability, or in an area offluctuation due to frost, a level check during each visit to the station is required.
When running levels to check for the possible movement of a gauge, THE CIRCUITMUST BE CLOSED IN ALL CASES. Even where the situation involves one set-upbetween the bench mark and the gauge, the instrument must be moved to close the returnrun to the bench mark.
The procedure for determining the elevation of a staff gauge in relation to the elevationof a bench mark involves several steps. First, set up the leveling instrument in aconvenient location between the staff gauge and the bench mark, so that a clear rodreading is obtainable at both points, but no attempt is made to stay directly on the linebetween the two. A backsight on the bench mark is then observed and recorded. Next the
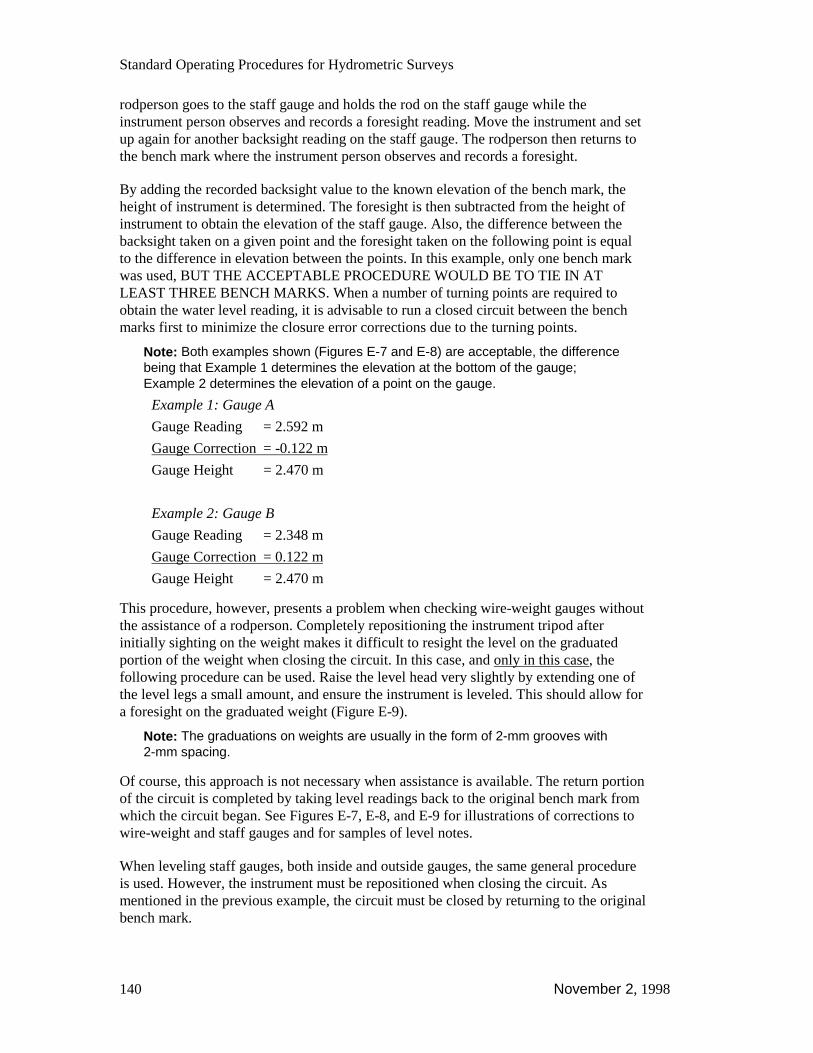
Standard Operating Procedures for Hydrometric Surveys
140 November 2, 1998
rodperson goes to the staff gauge and holds the rod on the staff gauge while theinstrument person observes and records a foresight reading. Move the instrument and setup again for another backsight reading on the staff gauge. The rodperson then returns tothe bench mark where the instrument person observes and records a foresight.
By adding the recorded backsight value to the known elevation of the bench mark, theheight of instrument is determined. The foresight is then subtracted from the height ofinstrument to obtain the elevation of the staff gauge. Also, the difference between thebacksight taken on a given point and the foresight taken on the following point is equalto the difference in elevation between the points. In this example, only one bench markwas used, BUT THE ACCEPTABLE PROCEDURE WOULD BE TO TIE IN ATLEAST THREE BENCH MARKS. When a number of turning points are required toobtain the water level reading, it is advisable to run a closed circuit between the benchmarks first to minimize the closure error corrections due to the turning points.
Note: Both examples shown (Figures E-7 and E-8) are acceptable, the differencebeing that Example 1 determines the elevation at the bottom of the gauge;Example 2 determines the elevation of a point on the gauge.
Example 1: Gauge A
Gauge Reading = 2.592 m
Gauge Correction = -0.122 m
Gauge Height = 2.470 m
Example 2: Gauge B
Gauge Reading = 2.348 m
Gauge Correction = 0.122 m
Gauge Height = 2.470 m
This procedure, however, presents a problem when checking wire-weight gauges withoutthe assistance of a rodperson. Completely repositioning the instrument tripod afterinitially sighting on the weight makes it difficult to resight the level on the graduatedportion of the weight when closing the circuit. In this case, and only in this case, thefollowing procedure can be used. Raise the level head very slightly by extending one ofthe level legs a small amount, and ensure the instrument is leveled. This should allow fora foresight on the graduated weight (Figure E-9).
Note: The graduations on weights are usually in the form of 2-mm grooves with2-mm spacing.
Of course, this approach is not necessary when assistance is available. The return portionof the circuit is completed by taking level readings back to the original bench mark fromwhich the circuit began. See Figures E-7, E-8, and E-9 for illustrations of corrections towire-weight and staff gauges and for samples of level notes.
When leveling staff gauges, both inside and outside gauges, the same general procedureis used. However, the instrument must be repositioned when closing the circuit. Asmentioned in the previous example, the circuit must be closed by returning to the originalbench mark.
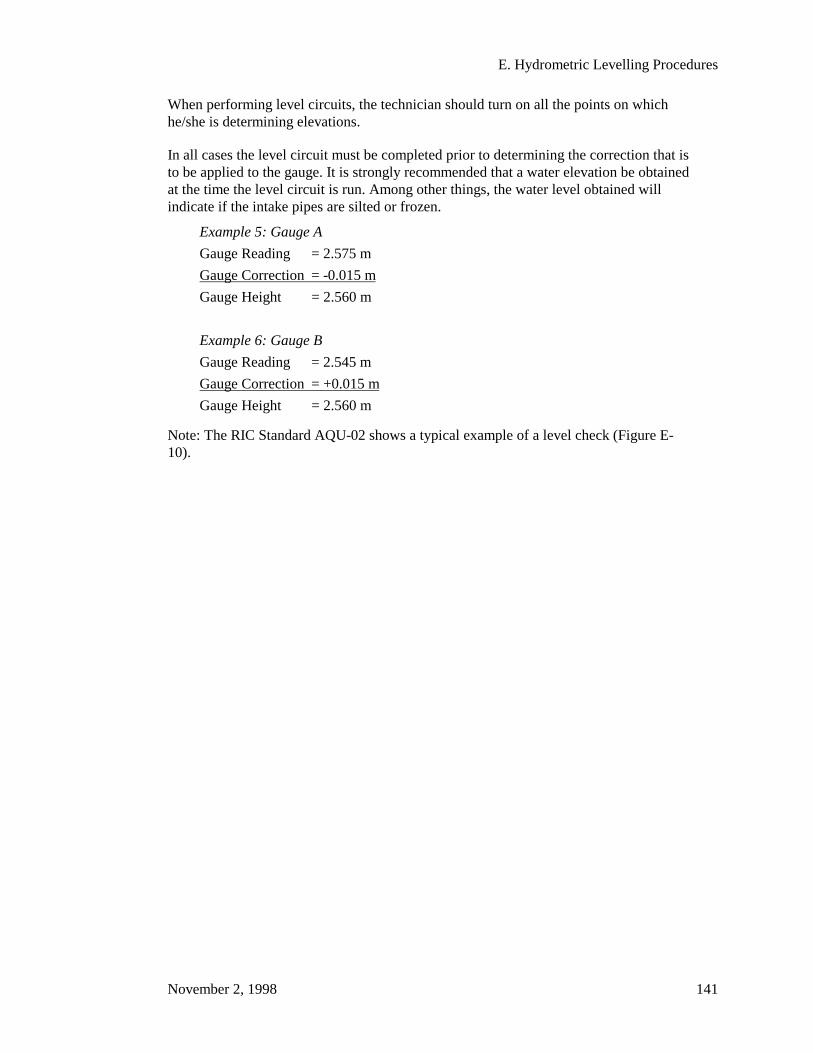
E. Hydrometric Levelling Procedures
November 2, 1998 141
When performing level circuits, the technician should turn on all the points on whichhe/she is determining elevations.
In all cases the level circuit must be completed prior to determining the correction that isto be applied to the gauge. It is strongly recommended that a water elevation be obtainedat the time the level circuit is run. Among other things, the water level obtained willindicate if the intake pipes are silted or frozen.
Example 5: Gauge A
Gauge Reading = 2.575 m
Gauge Correction = -0.015 m
Gauge Height = 2.560 m
Example 6: Gauge B
Gauge Reading = 2.545 m
Gauge Correction = +0.015 m
Gauge Height = 2.560 m
Note: The RIC Standard AQU-02 shows a typical example of a level check (Figure E-10).
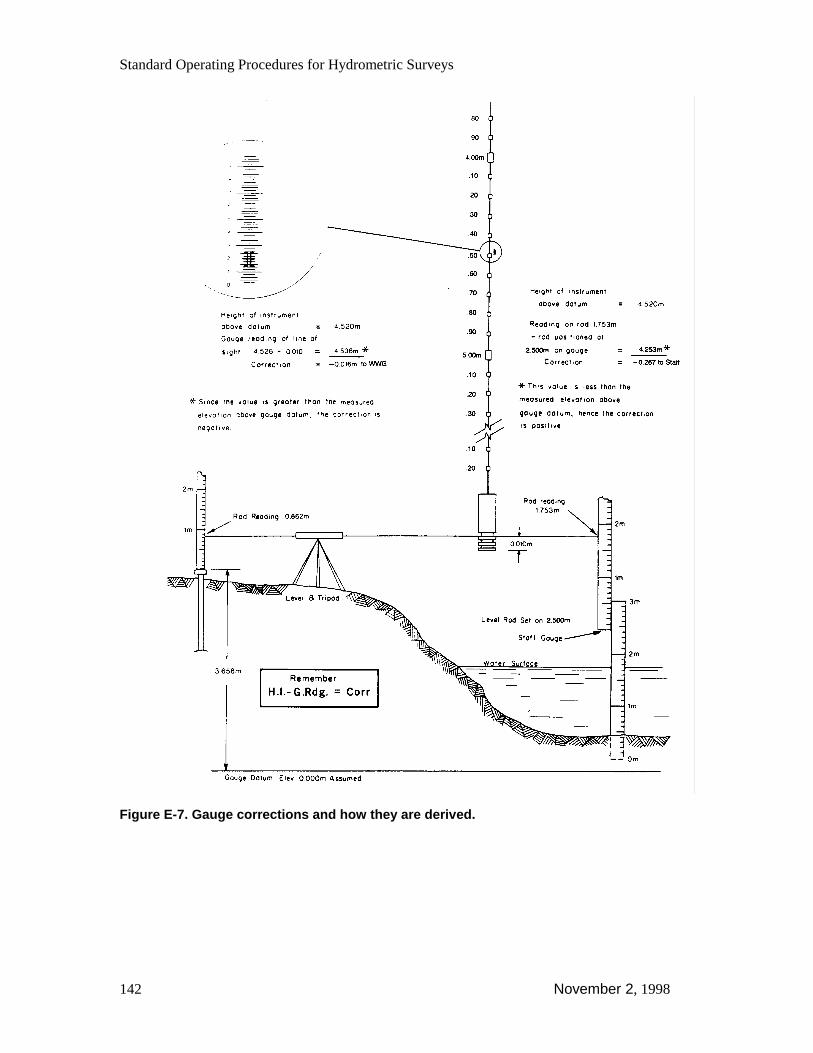
Standard Operating Procedures for Hydrometric Surveys
142 November 2, 1998
Figure E-7. Gauge corrections and how they are derived.

E. Hydrometric Levelling Procedures
November 2, 1998 143
Figure E-8a. Example 3: Sample levelnotes and illustration of wire-weightgauge corrections, Big River at LittleBend.
Figure E-8b. Example 4: Sample levelnotes and illustrations of wire-weightgauge corrections, Clear River at LittleBend.
Figure E-9. Wire-weight gauge corrections.
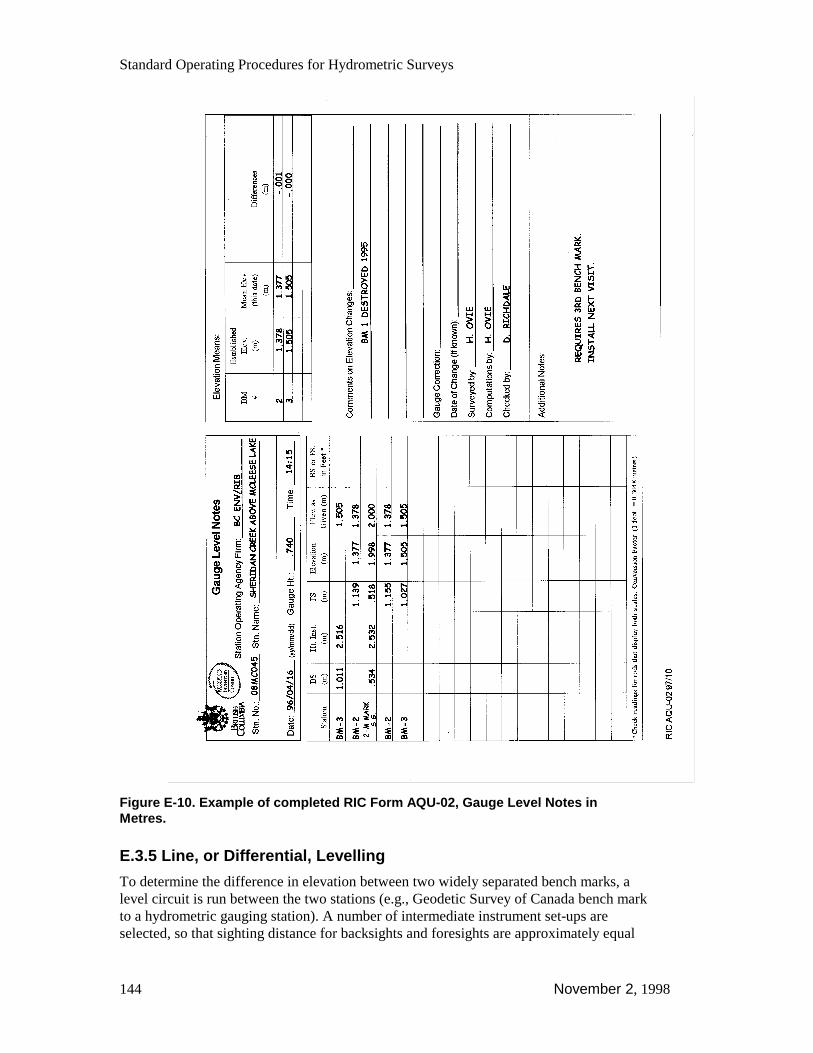
Standard Operating Procedures for Hydrometric Surveys
144 November 2, 1998
Figure E-10. Example of completed RIC Form AQU-02, Gauge Level Notes inMetres.
E.3.5 Line, or Differential, Levelling
To determine the difference in elevation between two widely separated bench marks, alevel circuit is run between the two stations (e.g., Geodetic Survey of Canada bench markto a hydrometric gauging station). A number of intermediate instrument set-ups areselected, so that sighting distance for backsights and foresights are approximately equal
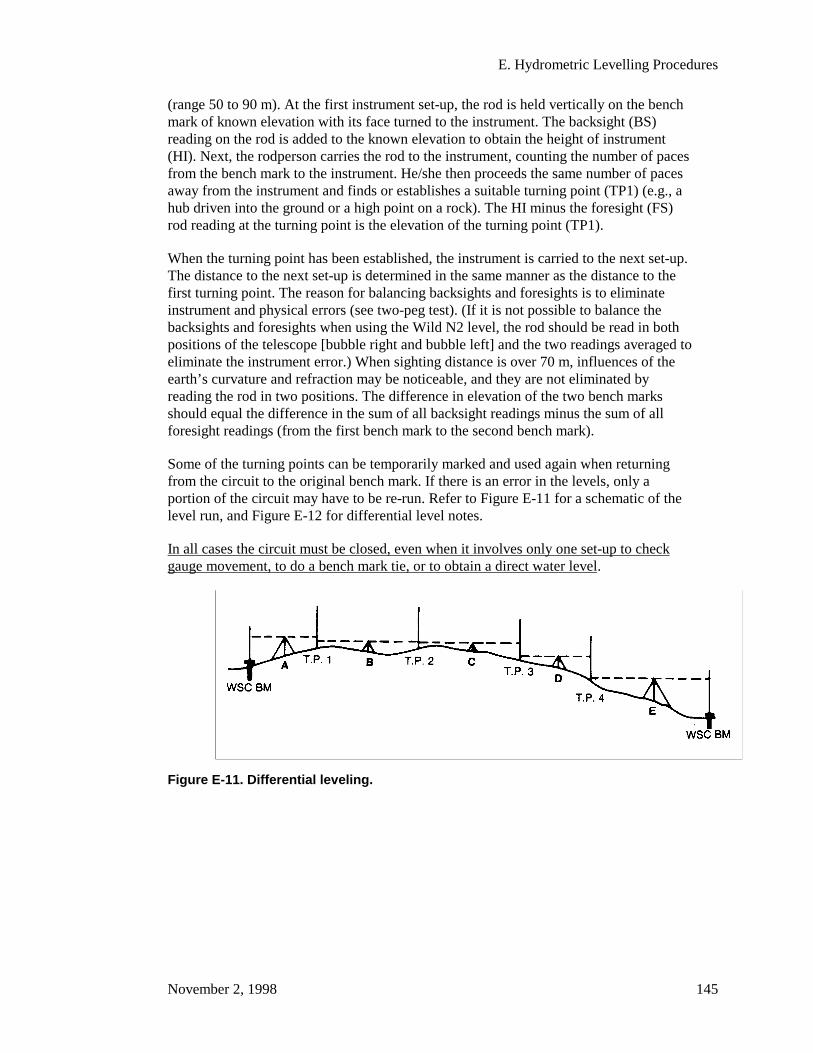
E. Hydrometric Levelling Procedures
November 2, 1998 145
(range 50 to 90 m). At the first instrument set-up, the rod is held vertically on the benchmark of known elevation with its face turned to the instrument. The backsight (BS)reading on the rod is added to the known elevation to obtain the height of instrument(HI). Next, the rodperson carries the rod to the instrument, counting the number of pacesfrom the bench mark to the instrument. He/she then proceeds the same number of pacesaway from the instrument and finds or establishes a suitable turning point (TP1) (e.g., ahub driven into the ground or a high point on a rock). The HI minus the foresight (FS)rod reading at the turning point is the elevation of the turning point (TP1).
When the turning point has been established, the instrument is carried to the next set-up.The distance to the next set-up is determined in the same manner as the distance to thefirst turning point. The reason for balancing backsights and foresights is to eliminateinstrument and physical errors (see two-peg test). (If it is not possible to balance thebacksights and foresights when using the Wild N2 level, the rod should be read in bothpositions of the telescope [bubble right and bubble left] and the two readings averaged toeliminate the instrument error.) When sighting distance is over 70 m, influences of theearth’s curvature and refraction may be noticeable, and they are not eliminated byreading the rod in two positions. The difference in elevation of the two bench marksshould equal the difference in the sum of all backsight readings minus the sum of allforesight readings (from the first bench mark to the second bench mark).
Some of the turning points can be temporarily marked and used again when returningfrom the circuit to the original bench mark. If there is an error in the levels, only aportion of the circuit may have to be re-run. Refer to Figure E-11 for a schematic of thelevel run, and Figure E-12 for differential level notes.
In all cases the circuit must be closed, even when it involves only one set-up to checkgauge movement, to do a bench mark tie, or to obtain a direct water level.
Figure E-11. Differential leveling.
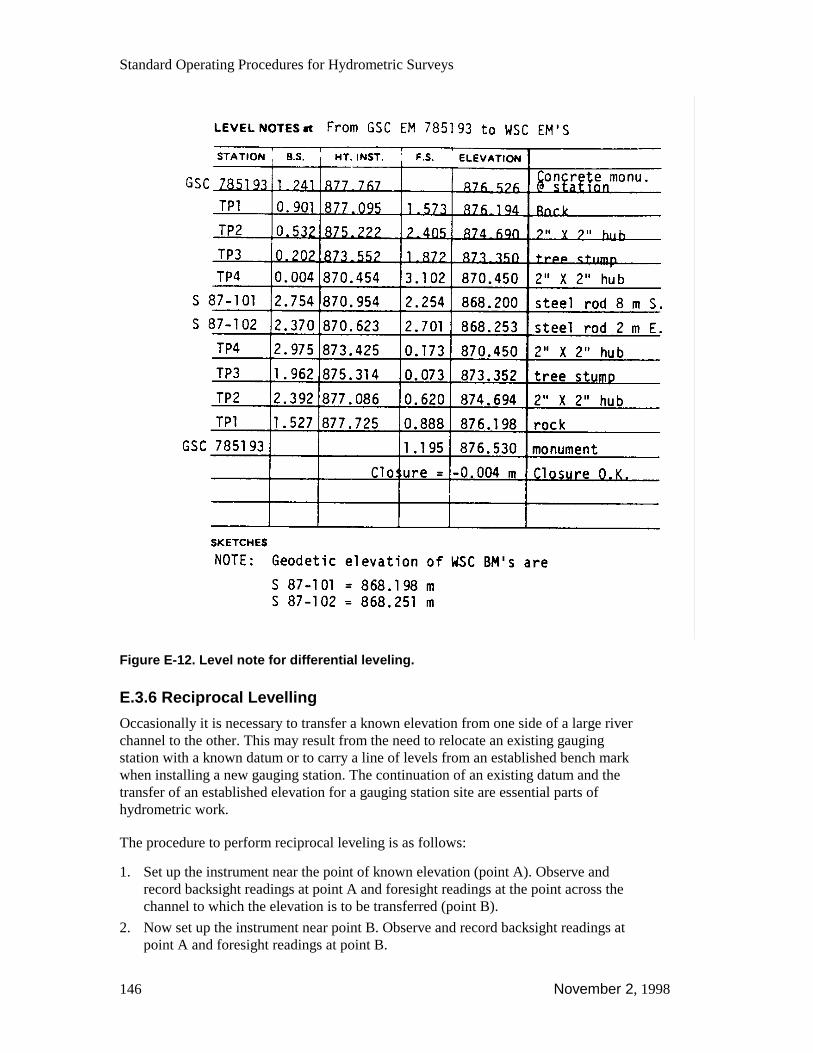
Standard Operating Procedures for Hydrometric Surveys
146 November 2, 1998
Figure E-12. Level note for differential leveling.
E.3.6 Reciprocal Levelling
Occasionally it is necessary to transfer a known elevation from one side of a large riverchannel to the other. This may result from the need to relocate an existing gaugingstation with a known datum or to carry a line of levels from an established bench markwhen installing a new gauging station. The continuation of an existing datum and thetransfer of an established elevation for a gauging station site are essential parts ofhydrometric work.
The procedure to perform reciprocal leveling is as follows:
1. Set up the instrument near the point of known elevation (point A). Observe andrecord backsight readings at point A and foresight readings at the point across thechannel to which the elevation is to be transferred (point B).
2. Now set up the instrument near point B. Observe and record backsight readings atpoint A and foresight readings at point B.

E. Hydrometric Levelling Procedures
November 2, 1998 147
3. Often the horizontal distance between points is large, making it necessary to fit a rodtarget on the distant rod. To obtain precise results, take a series of foresight readings,re-centering the bubble and re-setting the target after each observation.
4. The difference between the mean value of the backsight readings and the mean valueof the foresight readings is the difference in elevation of the two points.
Standard Operating Procedures for Hydrometric Surveys
148 November 2, 1998
This method of reciprocal leveling assumes that the conditions under which observationsare taken remain unchanged during the procedure. When leveling points are far apart,two factors may affect the accuracy of readings: unequal expansion of the instrumentparts and variations in atmospheric refraction. It is best to carry out this task on a cloudyday when temperature and atmospheric conditions remain constant; otherwise protect theinstrument from the sun’s rays. Complete the procedure in as short a time period aspossible.
E.3.7 Adjustment of Elevation
It can be assumed that the principal errors of leveling are accidental and that most of thelevel circuits run in hydrometric surveys are relatively short.
When a line of levels makes a complete circuit, almost invariably the final elevation ofthe initial bench mark as computed from the notes does not agree with the initialelevation. The difference in value between the bench mark’s known elevation and itscomputed elevation according to the level circuit is known as the error of closure. This isthe true error value incurred while running the level circuit. It is obvious that theelevation of the intermediate points established while running the circuit will also be inerror.
When significant errors of closure are experienced in level circuits over small distancessuch as the immediate vicinity of a hydrometric station, the survey should be repeated. Inthe case of a long distance circuit, there are statistical techniques for computingcorrections to intermediate points. These can be found in surveying texts.
E.3.8 Levelling Errors
One of the most important factors required to achieve accurate leveling is the skill of thefield technician. Field technicians must be aware of potential problems that will produceerrors in leveling and the steps necessary to limit them. The following list discussesmany of the common errors committed while performing leveling work:
1. Improper Adjustment of Instrument. This condition occurs when the line of sight isnot parallel to the axis of the level tube. This error can be minimized by carefuladjustment of the instrument and by balancing backsight and foresight distances.
2. Parallax. The eyepiece of the telescope must be adjusted until the crosshairs appearsharp and distinct. If there is an apparent movement of the crosshairs on the targetwith a corresponding slight movement of the observer’s eye (vertically orhorizontally), the condition of parallax exists. This condition can be reduced to anegligible quantity by careful focusing of the eyepiece on the objective lens.
Alternate procedure:
i. Focus the telescope to the greatest distance.ii. Tilt the level to view the sky.iii. Adjust eyepiece until crosshairs are as sharp as possible.iv. Note the reading on the dioptric refraction scale for further checks.v. Proceed to use the instrument.
E. Hydrometric Levelling Procedures
November 2, 1998 149
3. Inaccurate Reading of Rod. This error can be greatly reduced by using shorter sightsand by checking each reading before recording it.
4. Rod Not Plumb. A rod level can be used or the rod can be waved to eliminate thistype of error. When the rod is tipped backward, ensure that it still rests on the frontedge of the base.
5. Improper Turning Points. Turning points that are not both well defined and stableare potential sources of error. If reasonable care is exercised when selecting turningpoints that are both solid and have rounded tops, this error can be kept to a minimum.
6. Tubular Bubble Not Centered. The magnitude of this error will vary with thedistance between the instrument and the rod. It follows that the greater the distanceto be sighted, the greater the care that should be exercised when leveling theinstrument.
7. Settlement of the Instrument Tripod. Some settlement of the tripod is likely to occurwhen leveling over soft, muddy, or thawing ground. Under these conditionsbacksight and foresight observations should be made in quick succession in order tominimize any effect from the instrument settling.
8. Incorrect Rod Length. Level rod lengths should be checked periodically with a steeltape. Dirt or snow can become trapped in the sleeve of sectional rods which mayprevent sections from fitting together properly. Rods should be assembled andcarried so that the upper portion is never in contact with the ground.
9. Mud, Snow, or Ice Accumulation on Base of Rod. Mud, snow, or ice accumulationson the rod must be removed before each reading is taken so that level circuits willclose. Note that ice accumulation is sometimes unavoidable when obtaining directwater levels in the winter. Uniform wear of the rod base causes no error.

Standard Operating Procedures for Hydrometric Surveys
150 November 2, 1998
This page intentionally blank.

F. Rating Streams and Computing Discharge
November 2, 1998 151
F. Rating Streams and ComputingDischarge
F.1 IntroductionA thorough understanding of the relationship between stage and discharge is thefoundation of hydrometric work. This section details the steps involved in converting thefield data to actual flow data set to Provincial Standards.
Discharge is the volume of water flowing through a given cross section of a watercourseduring a given or implied time period. A measurement of discharge at a given point intime has limited value by itself because it does not allow determination of daily ormonthly flows or other flow parameters which are required to understand the streamflowregime. But for any stream location there is a correlation between water level anddischarge, that once established, allows one to record the water level, which is relativelyeasy to do on a continuous basis, and estimate discharge from this correlation (waterlevel, when recorded against a fixed reference is referred to as gauge height or stage).
Daily discharges are rarely measured directly because of the effort required. Onoccasion, when the effort is justified, it can be approximated by near continuousmetering.
This Section will describe the stage-discharge relation and attempt to portray itsimportance to the practice of hydrometric surveying.
F.2 Stage-Discharge RelationshipDaily or continuous discharge data can not practically be obtained directly. It is howeverpossible to obtain daily or continuous stage data and from that a continuous dischargerecord can be estimated based on this relationship of water level and flow. The result is acorrelation called the stage-discharge relationship.
To develop this relationship, discharge measurements are obtained at the gauging stationover the maximum range of gauge heights possible. A history of the relationship evolvesover time, as each discharge measurement and corresponding stage is plotted, and asmooth curve is drawn that best represents these points (Figure F-1). This curve isconverted to a table of discharge values for incremental gauge heights, which in turn isreferred to as a stage-discharge table. Daily or continuous discharge can be derived fromthis table using a daily or continuous stage record.
F.2.1 Development of a Stage-Discharge Rating Curve
The stage-discharge rating curve has historically been drawn by hand on standardarithmetical forms. This form has been adapted to the RIC Standards Program and isavailable as Form AQU-09 (Figure F-1).
Standard Operating Procedures for Hydrometric Surveys
152 November 2, 1998
Rating curve drawing can be performed mathematically by computer using standardgraphics software as well as more specific applications. But few hydrometric sites can bewell represented by this method and therefore computer fit curves are not acceptable forProvincial Standards. The reasons for the restriction against computer plots include:
Stream geometry changes with depth and requires more than one equation.
The relationship between plotted points is affected by chronological order. In amanual plot, dates are added and must be constantly referenced.
Confidence in data is not constant. Field personnel must give weight to themeasurements based on experience.
The difference between an errant measurement and a shift in the stage-dischargecurve is a grey area that is best resolved using skilled judgment when drawing thecurve manually.
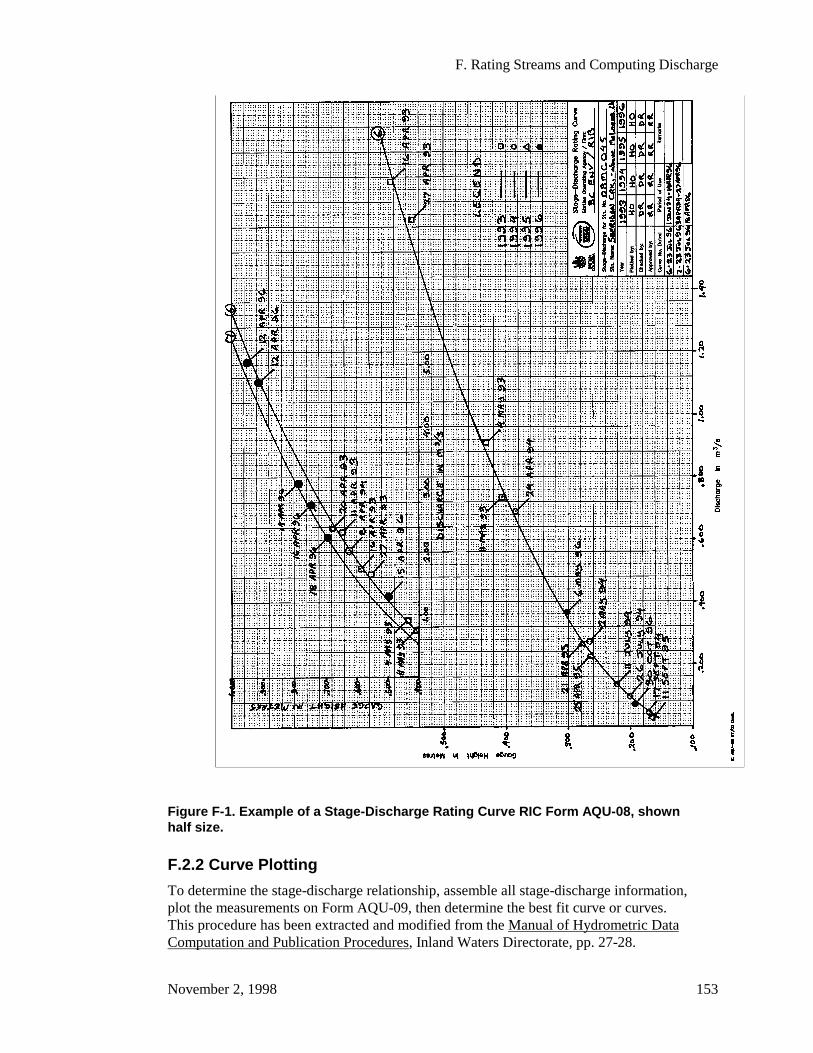
F. Rating Streams and Computing Discharge
November 2, 1998 153
Figure F-1. Example of a Stage-Discharge Rating Curve RIC Form AQU-08, shownhalf size.
F.2.2 Curve Plotting
To determine the stage-discharge relationship, assemble all stage-discharge information,plot the measurements on Form AQU-09, then determine the best fit curve or curves.This procedure has been extracted and modified from the Manual of Hydrometric DataComputation and Publication Procedures, Inland Waters Directorate, pp. 27-28.
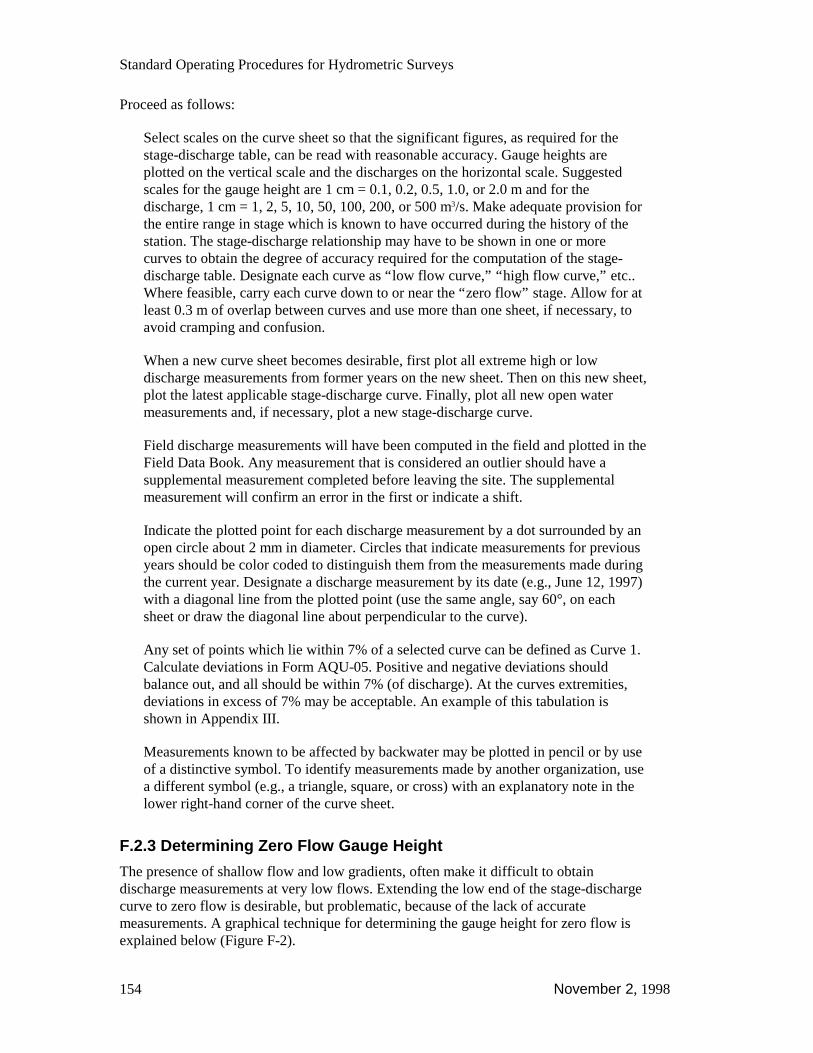
Standard Operating Procedures for Hydrometric Surveys
154 November 2, 1998
Proceed as follows:
Select scales on the curve sheet so that the significant figures, as required for thestage-discharge table, can be read with reasonable accuracy. Gauge heights areplotted on the vertical scale and the discharges on the horizontal scale. Suggestedscales for the gauge height are 1 cm = 0.1, 0.2, 0.5, 1.0, or 2.0 m and for thedischarge, 1 cm = 1, 2, 5, 10, 50, 100, 200, or 500 m3/s. Make adequate provision forthe entire range in stage which is known to have occurred during the history of thestation. The stage-discharge relationship may have to be shown in one or morecurves to obtain the degree of accuracy required for the computation of the stage-discharge table. Designate each curve as “low flow curve,” “high flow curve,” etc..Where feasible, carry each curve down to or near the “zero flow” stage. Allow for atleast 0.3 m of overlap between curves and use more than one sheet, if necessary, toavoid cramping and confusion.
When a new curve sheet becomes desirable, first plot all extreme high or lowdischarge measurements from former years on the new sheet. Then on this new sheet,plot the latest applicable stage-discharge curve. Finally, plot all new open watermeasurements and, if necessary, plot a new stage-discharge curve.
Field discharge measurements will have been computed in the field and plotted in theField Data Book. Any measurement that is considered an outlier should have asupplemental measurement completed before leaving the site. The supplementalmeasurement will confirm an error in the first or indicate a shift.
Indicate the plotted point for each discharge measurement by a dot surrounded by anopen circle about 2 mm in diameter. Circles that indicate measurements for previousyears should be color coded to distinguish them from the measurements made duringthe current year. Designate a discharge measurement by its date (e.g., June 12, 1997)with a diagonal line from the plotted point (use the same angle, say 60°, on eachsheet or draw the diagonal line about perpendicular to the curve).
Any set of points which lie within 7% of a selected curve can be defined as Curve 1.Calculate deviations in Form AQU-05. Positive and negative deviations shouldbalance out, and all should be within 7% (of discharge). At the curves extremities,deviations in excess of 7% may be acceptable. An example of this tabulation isshown in Appendix III.
Measurements known to be affected by backwater may be plotted in pencil or by useof a distinctive symbol. To identify measurements made by another organization, usea different symbol (e.g., a triangle, square, or cross) with an explanatory note in thelower right-hand corner of the curve sheet.
F.2.3 Determining Zero Flow Gauge Height
The presence of shallow flow and low gradients, often make it difficult to obtaindischarge measurements at very low flows. Extending the low end of the stage-dischargecurve to zero flow is desirable, but problematic, because of the lack of accuratemeasurements. A graphical technique for determining the gauge height for zero flow isexplained below (Figure F-2).
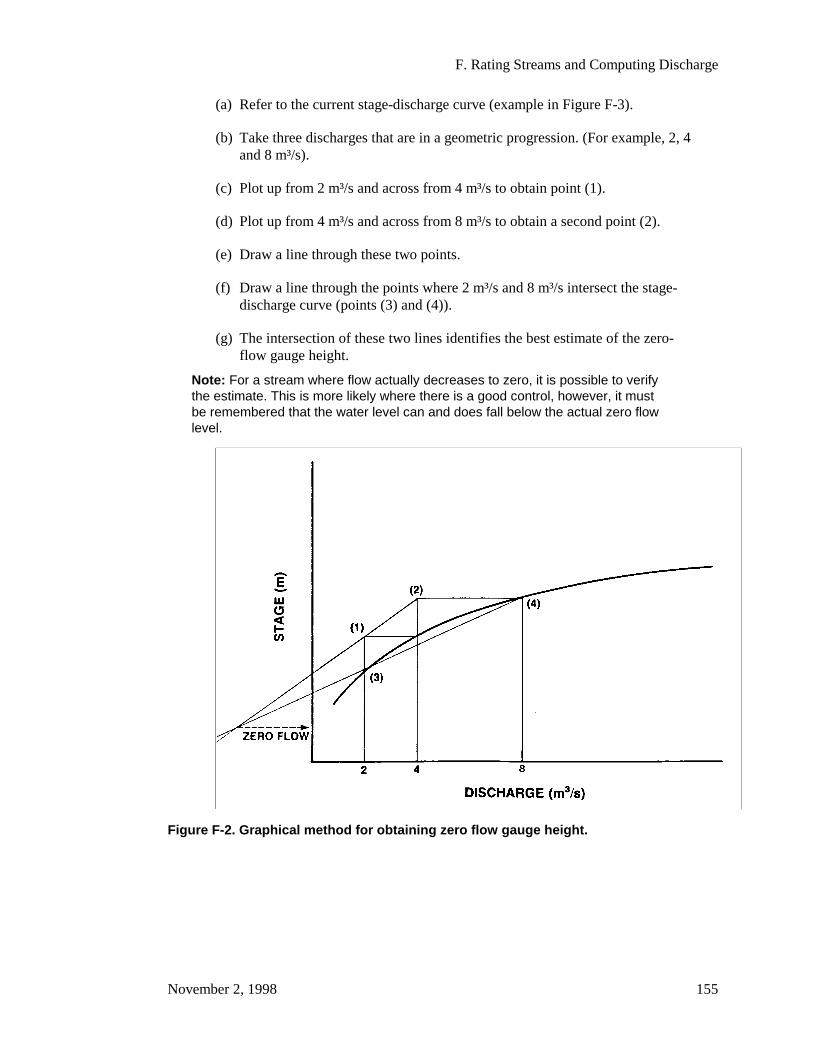
F. Rating Streams and Computing Discharge
November 2, 1998 155
(a) Refer to the current stage-discharge curve (example in Figure F-3).
(b) Take three discharges that are in a geometric progression. (For example, 2, 4and 8 m³/s).
(c) Plot up from 2 m³/s and across from 4 m³/s to obtain point (1).
(d) Plot up from 4 m³/s and across from 8 m³/s to obtain a second point (2).
(e) Draw a line through these two points.
(f) Draw a line through the points where 2 m³/s and 8 m³/s intersect the stage-discharge curve (points (3) and (4)).
(g) The intersection of these two lines identifies the best estimate of the zero-flow gauge height.
Note: For a stream where flow actually decreases to zero, it is possible to verifythe estimate. This is more likely where there is a good control, however, it mustbe remembered that the water level can and does fall below the actual zero flowlevel.
Figure F-2. Graphical method for obtaining zero flow gauge height.
Standard Operating Procedures for Hydrometric Surveys
156 November 2, 1998
Figure F-3. Typical stage-discharge table as extracted from the relevant curve.
F.2.4 Extending the Rating Curve
For relatively new stations with few discharge measurements, it is often desirable toextend the stage-discharge curve beyond the highest discharge measurement available.This can be accomplished with the use of double logarithmic plotting paper. Plot the fullrange of measured discharges against stage.
F. Rating Streams and Computing Discharge
November 2, 1998 157
In most cases, this logarithmic plot of measurements will form a straight line in the highflow range. This makes it a useful tool in extending curves beyond the highest dischargemeasurement. The “curve” as determined in the log plot is then transferred to thestandard stage discharge plot.
Discharges estimated by indirect methods may be used to confirm the high end of thecurve extension developed by the log plot. Indirect measurement of discharge isdetermined after the high water event has passed and involves engineering surveys todetermine the geometry of the channel, and the application of hydraulic formulae. Themost commonly used procedure is the slope-area method, which is described in variousengineering texts.
F.2.5 Curve Labelling
The stage-discharge curve must now be numbered and labelled. Use the followingprocedure:
(a) The first curve used in the first year of operation will usually be designated“Curve No. l.” However, another number, such as 31, may be selected ifdesired, but always increase curve numbers in chronological order of whenthe curve was derived.
(b) Use a diagonal line from the curve to the notation.
(c) Label any succeeding curves as “Curve No. 2,” “Curve No. 3,” etc. (or“Curve No. 32,” “Curve No. 33,” etc.).
(d) Enter the dates for the period of use of each curve in the space providedwithin the sheet title block.
F.2.6 Stage-Discharge Tables
Having established a best-fit curve, complete with zero flow stage, the next step is toprepare a stage-discharge table from the curve (Figure F-3). The following procedure isused to compile a stage-discharge table from the stage-discharge curve:
(a) Identify the number of the stage-discharge table as shown in Figure F-3, whichmust correspond to the stage-discharge curve number. The data processor’s initialsand the date the table was compiled are recorded as well.
(b) When compiling the stage-discharge table, deviate as little as possible from theexact coordinates, as indicated by the curve. Express discharges to at least thesame number of significant figures as required for daily discharges.
(c) When the stage-discharge table is completed, plot the values on the curve sheet toensure that the original delineation of the curve is consistent with the table.
(d) In some cases, a new stage-discharge curve is exactly the same as a former curvethrough part of the range in stage. In preparing the new stage-discharge table forthese areas, copy the data from the former table through the range of stage inwhich the new curve and the former curve are identical. Then compile the newtable in the range of stage where the two curves diverge. The new table will coverthe entire range of stage.

Standard Operating Procedures for Hydrometric Surveys
158 November 2, 1998
(e) If a stage-discharge curve is extended above or below the original range, the sameoriginal number and date identification may be used. However, an explanatorynote should be added on Form AQU-07, as well as the date when this extensionwas made. Note that this applies only if the curve is extended and not if it isrevised.
(f) Enter the dates in the space provided for the periods of use of each table.
F.2.7 Expanded Stage Discharge Table
For production of discharge data, it is recommended that the discharge figure betabulated to at least every 0.002 m of gauge height. Figure F-4 illustrates the expandedstage-discharge table format. This example was produced by digitizing a manually drawncurve.
F.2.8 Daily Discharges
F.2.8.1General
One of the basic objectives of a hydrometric technician’s work is to gather data for thedetermination of daily discharge. A detailed knowledge of the procedures involved inpreparation of these data to publishable standards is essential.
While several automated procedures have been developed for the computation of openwater discharges, the following sub-sections explain the procedures used in the manualpreparation of Daily Discharges. Procedural mistakes could well arise if one is not awareof the functions the computer is performing during automatic computations. To trulyunderstand the basic concepts of discharge computations, the procedures for manual dataprocessing must be understood.
Figure F-5 illustrates the steps involved from data collection through to data archiving.This chart, taken from Water Survey of Canada (Hydrometric Technician CareerDevelopment Program. 1990. Vol. 1-5), an Environment Canada training manual,demonstrates the complexity and large number of components involved in the process. Itcan be seen that gauge heights must be compiled. In the simplest case, a daily mean stage(or gauge height) is determined from the stage records. This is then used with the stage-discharge table to determine the daily mean discharge.
F.2.8.2Subdivided Day Method
Computation of Daily Mean Discharge
The daily mean gauge height is often used to compute the daily mean discharge, asdescribed above. However, a daily mean discharge determined directly from the dailymean gauge height may be in error for a number of reasons.
These reasons include:
(a) the rate of change as indicated by the shape of the stage hydrograph for the dayand the proportion of time during which the stage is relatively high or low; and
(b) the relative curvature in the stage-discharge curve in the range of stage recordedduring the day.
F. Rating Streams and Computing Discharge
November 2, 1998 159
To obtain a more accurate determination of the daily discharge, it may be necessary tosubdivide the day into two or more parts, determine the mean gauge height for each part,and determine the discharge for each mean gauge height. From these, compute theweighted mean discharge for the day. If the resultant weighted mean discharge differsfrom that determined using the mean gauge height by more than the selected allowablelimit of 2% for discharge above a predetermined amount, then subdivision is necessaryfor all similar conditions.
To determine whether it is necessary to subdivide, examine the data and select a fewsample days that may be critical because of the conditions listed in (a) to (b). Computethe daily mean discharge for these days: (1) from the daily mean gauge height, and (2) bysubdivision. A few tests of this nature will provide the necessary experience for theparticular station upon which to base future decisions regarding the necessity ofsubdivision.
Allowable Range TablesAllowable range tables may be used to determine if a day for a particular station needs tobe subdivided. The following trial and error procedure is used for drawing up allowablerange tables. A hypothetical example extracted from the Manual of Hydrometric DataComputation and Publication Procedures, page 27 (Environment Canada 1980), is usedto illustrate the procedure:
(a) From the stage-discharge table, select a range in stage during medium flow,for example, from 3.0 to 4.0 m.
Suppose that the discharge at gauge height 3.0 m equals 186 m³/s and thedischarge at gauge height 4.0 m equals 339 m³/s. The mean discharge for thisrange in stage would then equal 262 m³/s.
However, you observe that at a mean gauge height of 3.5 m, the discharge isonly 252 m³/s. This represents a difference of 4% (10 divided by 262 x 100)which is not allowable.
(b) Select a smaller range, for example from 3.0 to 3.4 m. Calculate the meandischarge for this range in stage. Compare the mean discharge with theactual discharge at the mean gauge height for this range. Now you get adifference of 1%. This is too low, but 3.0 to 3.6 m gives 2%, which issatisfactory.
(c) Now try a range between 4.0 and 4.6 m. This gives a 1% difference, which istoo low. Try between 4.0 and 5.0 m, which gives a 3% difference. Therefore,an allowable range of 0.8 m is about right.
(d) The range from 6.5 to 7.5 m will give 2%.
(e) After several such attempts, you will develop an approximate allowablerange table. When in doubt, subdivide.
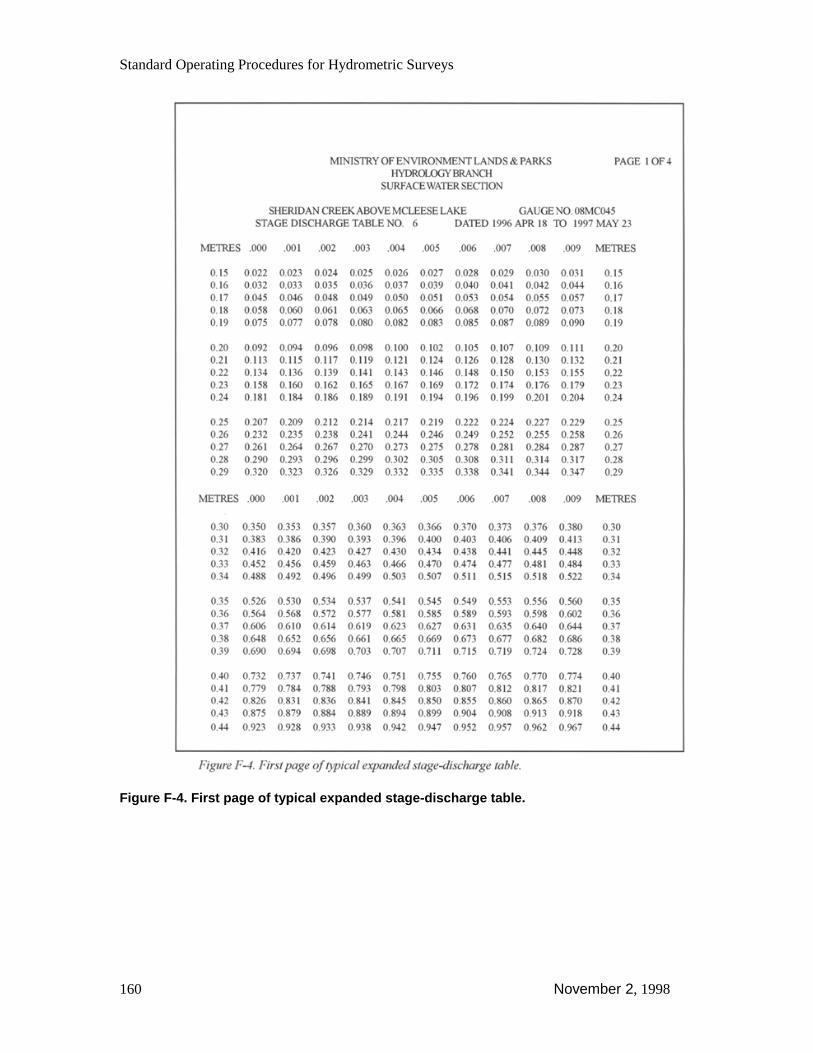
Standard Operating Procedures for Hydrometric Surveys
160 November 2, 1998
Figure F-4. First page of typical expanded stage-discharge table.
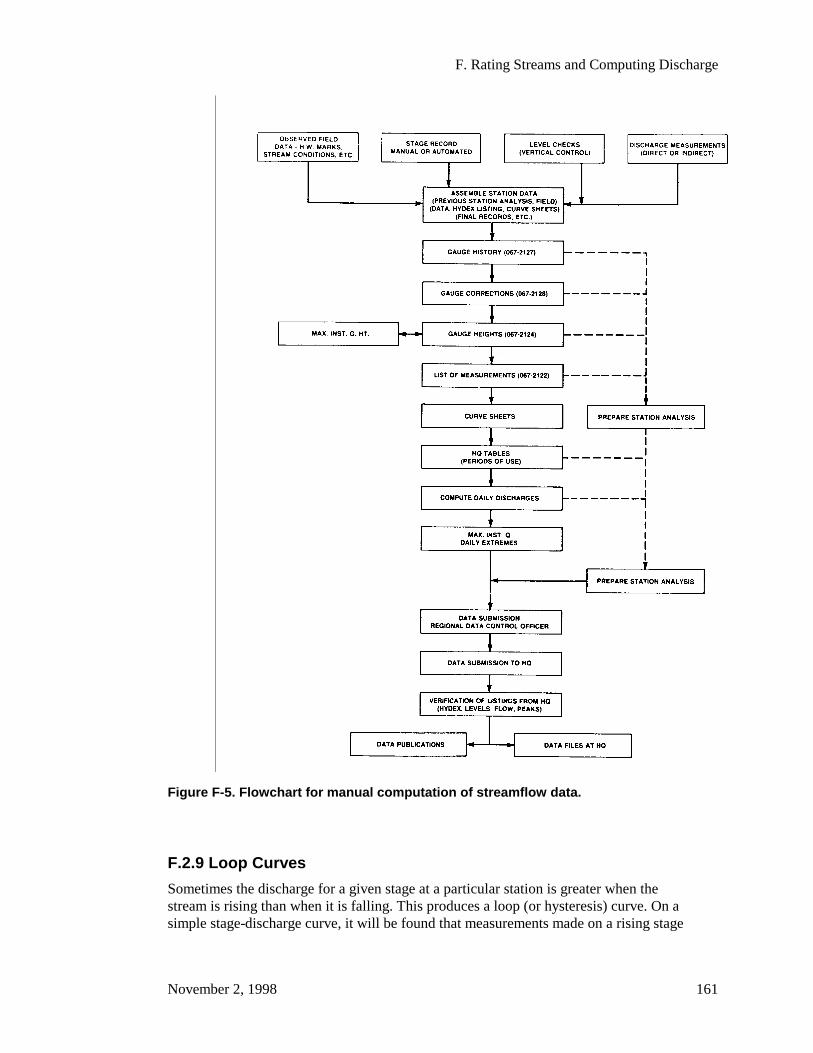
F. Rating Streams and Computing Discharge
November 2, 1998 161
Figure F-5. Flowchart for manual computation of streamflow data.
F.2.9 Loop Curves
Sometimes the discharge for a given stage at a particular station is greater when thestream is rising than when it is falling. This produces a loop (or hysteresis) curve. On asimple stage-discharge curve, it will be found that measurements made on a rising stage

Standard Operating Procedures for Hydrometric Surveys
162 November 2, 1998
tend to plot to the right of the curve, while those made on a falling stage tend to plot tothe left. As stated in Rantz et al. (1982, page 414):
The discharge measurements for individual flood waves will commonly describeindividual loops in the rating. In other words, “there will be a different loop for eachflood”. The departure of measurements from the rating curve for steady flow is ofsignificant magnitude only if the slope of the stream is relatively flat and the rate ofchange of discharge is rapid. For gauging stations where this scatter of dischargemeasurements does occur, the discharge rating must be developed by the application ofadjustment factors that relate steady flow to unsteady flow. (Unsteady flow refers todischarge at a site that changes appreciably with time, as in the passage of a flood wave.)An example of a stage-discharge curve of this type is shown in Figure F-6.
The detection and application of loop curves is limited to large rivers and thereforebeyond the scope of this RIC Manual.

F. Rating Streams and Computing Discharge
November 2, 1998 163
Figure F-6. Example of a stage-discharge loop.
F.3 Summary of Discharge Measurements AQU-05 Form
F.3.1 IntroductionNotes and records obtained in the field are the basis of the office computation ofhydrometric survey data. It is essential that all data be identified at every step in thecomputation process. Once the daily gauge heights have been determined the Summaryof Discharge Measurements Form AQU-05 must be completed for all dischargemeasurements obtained during the year.
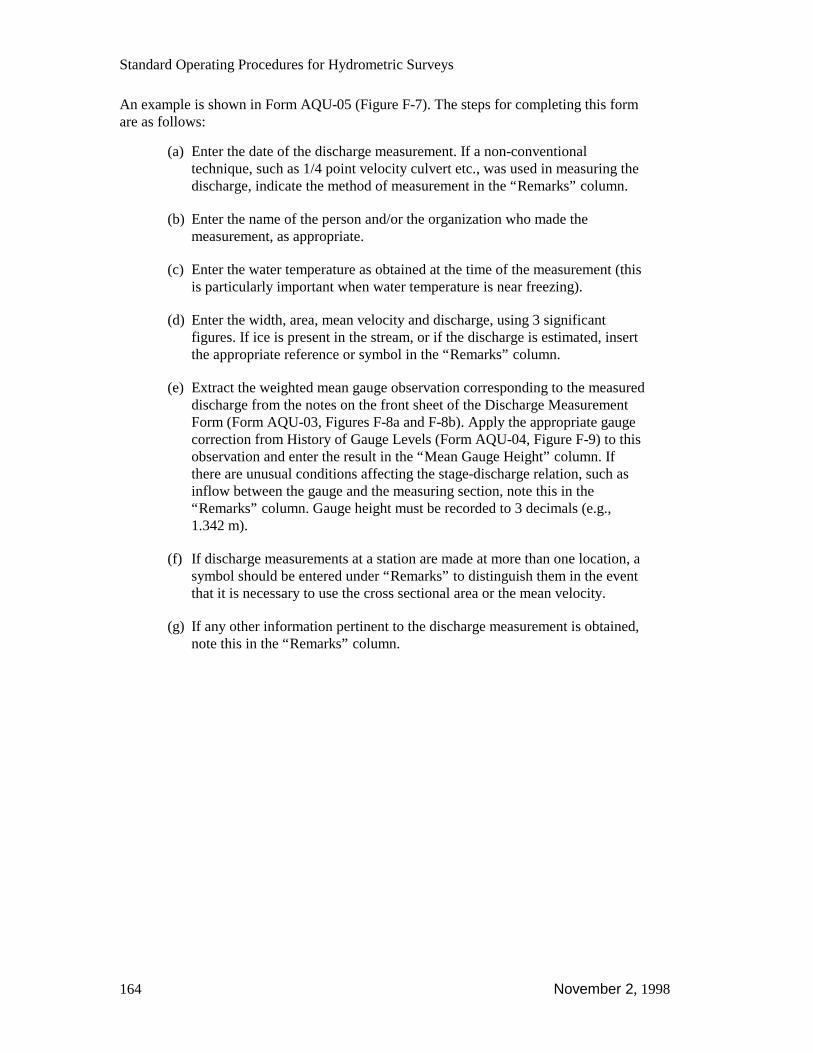
Standard Operating Procedures for Hydrometric Surveys
164 November 2, 1998
An example is shown in Form AQU-05 (Figure F-7). The steps for completing this formare as follows:
(a) Enter the date of the discharge measurement. If a non-conventionaltechnique, such as 1/4 point velocity culvert etc., was used in measuring thedischarge, indicate the method of measurement in the “Remarks” column.
(b) Enter the name of the person and/or the organization who made themeasurement, as appropriate.
(c) Enter the water temperature as obtained at the time of the measurement (thisis particularly important when water temperature is near freezing).
(d) Enter the width, area, mean velocity and discharge, using 3 significantfigures. If ice is present in the stream, or if the discharge is estimated, insertthe appropriate reference or symbol in the “Remarks” column.
(e) Extract the weighted mean gauge observation corresponding to the measureddischarge from the notes on the front sheet of the Discharge MeasurementForm (Form AQU-03, Figures F-8a and F-8b). Apply the appropriate gaugecorrection from History of Gauge Levels (Form AQU-04, Figure F-9) to thisobservation and enter the result in the “Mean Gauge Height” column. Ifthere are unusual conditions affecting the stage-discharge relation, such asinflow between the gauge and the measuring section, note this in the“Remarks” column. Gauge height must be recorded to 3 decimals (e.g.,1.342 m).
(f) If discharge measurements at a station are made at more than one location, asymbol should be entered under “Remarks” to distinguish them in the eventthat it is necessary to use the cross sectional area or the mean velocity.
(g) If any other information pertinent to the discharge measurement is obtained,note this in the “Remarks” column.
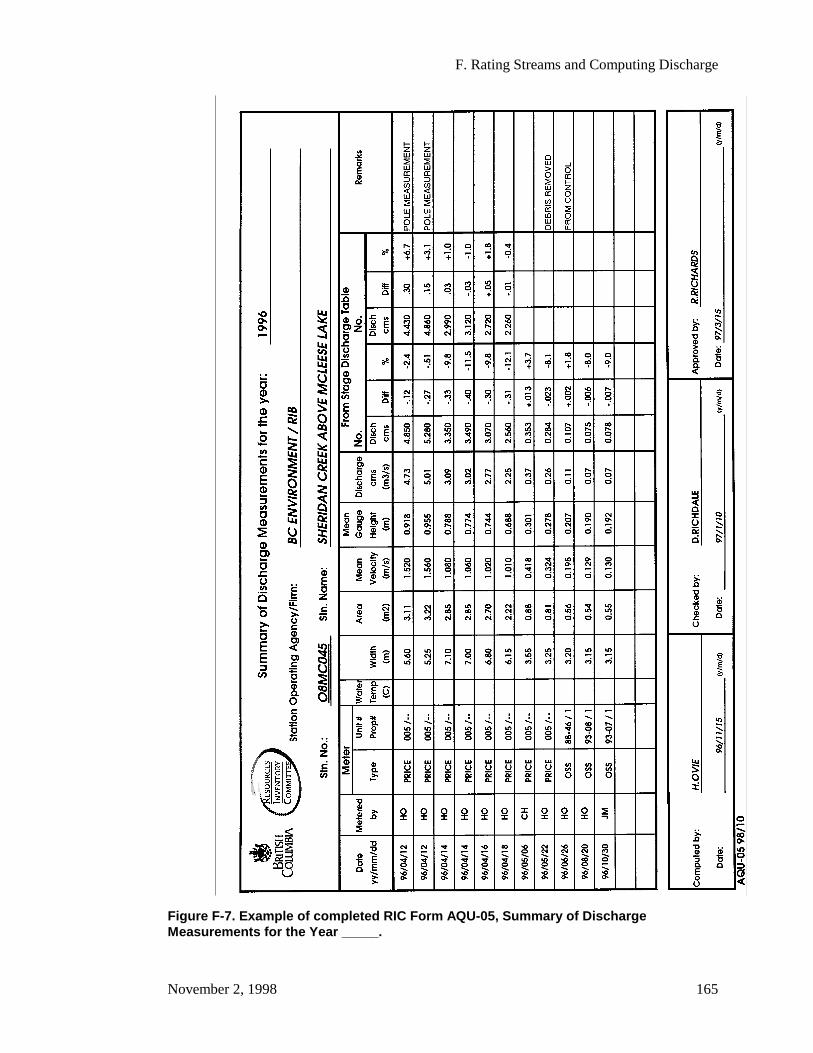
F. Rating Streams and Computing Discharge
November 2, 1998 165
Figure F-7. Example of completed RIC Form AQU-05, Summary of DischargeMeasurements for the Year _____.

Standard Operating Procedures for Hydrometric Surveys
166 November 2, 1998
Figure F-8a. Example of completed RIC Form AQU-03, Discharge Measurement(front).
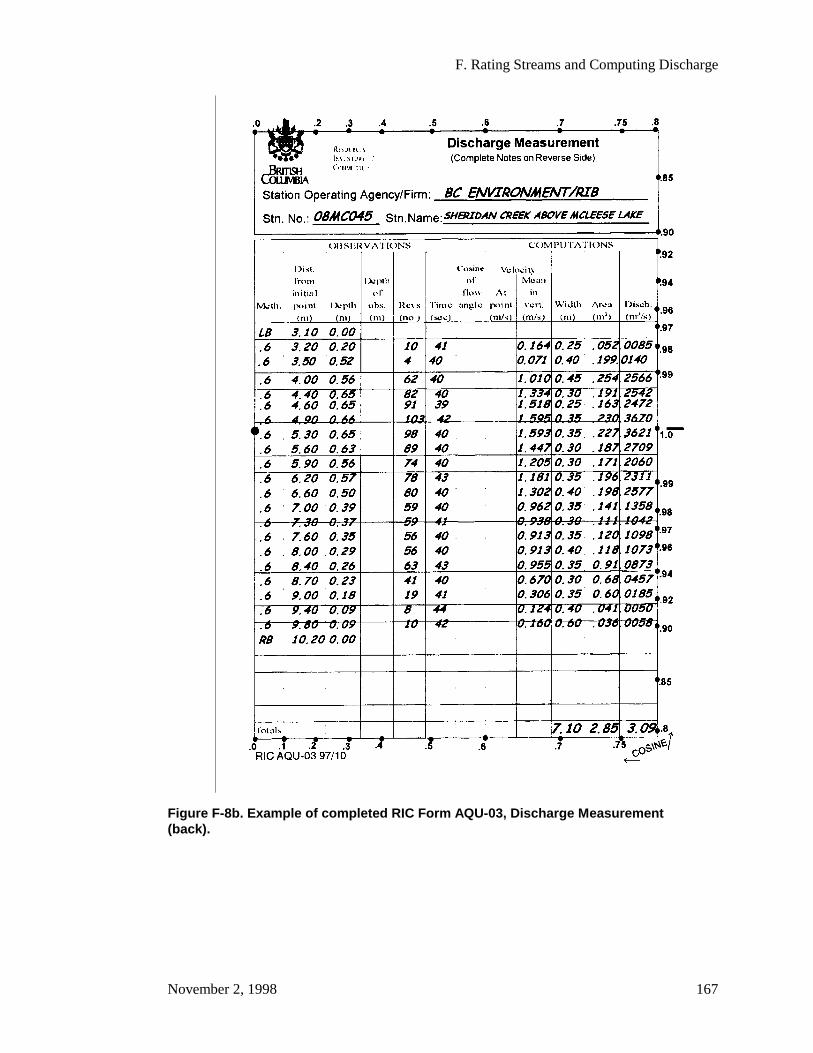
F. Rating Streams and Computing Discharge
November 2, 1998 167
Figure F-8b. Example of completed RIC Form AQU-03, Discharge Measurement(back).
Standard Operating Procedures for Hydrometric Surveys
168 November 2, 1998
Figure F-9. Example of completed RIC Form AQU-04, History of Gauge Level.
F.3.2 Shift and Backwater Corrections
F.3.2.1 General
A shift is defined as an alteration in the s-d relation caused by a change in the streamcontrol. The stage-discharge relation is not permanent at most stations but variesgradually or abruptly because of changes in the physical features of the control. If thechange in the rating persists, this is an indication that a new rating curve should beprepared for this period of time. If the change is of short duration and is easily reversible(e.g., an obstacle hung up on the control), the original rating curve is still effective but,during this period, shifts or adjustments must be applied to the recorded stage before
F. Rating Streams and Computing Discharge
November 2, 1998 169
determining the corresponding discharge. Frequent discharge measurements must bemade during any period to define the magnitude of the shift(s) when the condition is notcorrectable. For most gauging stations the stage-discharge curve represents the best-fit oraverage line and may not necessarily pass through all plotted points. That is, the stage-discharge relation is usually subject to minor random fluctuations.
Backwater is defined as a temporary rise in stage produced by an obstruction in thestream channel downstream of the gauge caused by ice, weeds, control structure, etc. Thedifference between the observed stage for a certain discharge and the stage as indicatedby the stage-discharge relation for the same discharge is reported as the backwater at thestation.
F.3.2.2 Computation of Shift and Backwater Corrections
The computation of shift and backwater corrections is as follows, (adapted from theManual of Hydrometric Data Computation and Publication Procedures, published byEnvironment Canada 1980):
(a) For many stations, a shift in the station control or a backwater condition may occur atcertain times during the year as a result of weed effect, beaver action or iceconditions. During such periods, shift or backwater corrections are determined fromavailable discharge measurements. These corrections are entered on Form AQU-05and used subsequently to compute daily corrections, which are applied in thedetermination of the daily discharges.
(b) However, apart from these measurements which plot off the curve for reasonsindicated above, most of the measurements will plot somewhat off the curve as aresult of normal scatter. For these, no correction is computed; however, it is normallyfound useful for purposes of expressing mathematically the degree of scatter toindicate for each measurement the percentage difference between measureddischarge and the discharge indicated by the stage-discharge relation. Thesepercentage differences are entered in the “Diff.” column on Form AQU-05. Ifdesired, these differences may be expressed in cubic metres per second instead ofpercentage for discharges less than about 0.005 m³/s.
(c) A discharge measurement made during the computation period may plot substantiallyoff the stage-discharge curve. It is recommended that discharge measurements becomputed and plotted on site and redone if it plots off the curve. This can oftendetermine if it is a bad measurement or if a shift has occurred. However, sometimesthe second measurement can not be done, or sometimes it is done and the departurecan not be explained. If, after careful analysis and review, no satisfactory cause of itsdeparture from the stage-discharge curve can be determined, the measurement shouldbe eliminated from use in the computation. In this instance, do not enter any figure inthe “Shift” or “Diff.” columns, but enter an explanatory note in the “Remarks”column on Form AQU-05, as well as on Station Analysis Form AQU-07. This shouldbe a rare occurrence for good hydrometric stations and experienced technicians.

Standard Operating Procedures for Hydrometric Surveys
170 November 2, 1998
F.3.2.3 Distribution of Shift and Backwater Corrections
Several methods of distributing shifts may be used. Two of the more common methodsare linear distribution by time and stage-shifting. These techniques will be brieflydiscussed here. A more comprehensive treatment of shifts may be found in Rantz et al.(1982), pages 354-360.
Linear Distribution By Time
If the date on which the change occurred is not known, assume that the change occurreduniformly and distribute the correction in accordance with one of the two followingmethods:
Divide the change in the correction by the number of days to find the “change perday”. For example: Suppose the correction was found to be +0.005 on March 20 and+0.009 on March 30. The number of days involved is 10 and the change in correctionis 0.004. The change per day is 0.0004. The corrections to be applied are shown to thenearest thousandth of a metre.
When the change is small and the number of days is large, the preferable method is todivide the number of days by the change in correction. For example:
A correction of +0.003 is applicable on May 25, but on October 15 is 0.006, aperiod of 144 days.
Solution: Three 0.001 m increments are applied at intervals of 48 days asfollows:
No change in correction will be applied during the first one-half interval of 24days, i.e., the correction +0.003 will be continued from May 25 to June 17; anincrease of 0.001 in the correction will be applied during each of the next twointervals of 48 days, i.e., a correction of +0.004 from June 18 to August 4 and+0.005 from August 5 to September 21.
The remaining 0.001 change will be applied during the remaining one-halfinterval, i.e., the final correction of +0.006 will be applied from September 22 toOctober 15.
Stage-Shifting
Stage-shifting is normally done because of a temporary, or short-term condition at agauging station. For example, perhaps a minor peak has occurred at a station, anddischarge measurements indicate a significant change to the stage-discharge curve athigher stages. A short time later, a major flood drastically alters the stage-dischargerelationship, requiring an entirely new stage-discharge curve. Instead of drawing twonew curves with accompanying rating tables, the minor peak may be stage-shifted, and anew curve can be drawn for conditions following the major flood.
F.3.3 Symbols and Footnotes
It is important that a uniform system of symbols and footnotes be used in the productionof daily discharge tabulations. The symbols (and footnotes) used by Environment Canadain the publication of Surface Water Data are set out below together with instructions ontheir use.
F. Rating Streams and Computing Discharge
November 2, 1998 171
The following has been adapted from the “Manual of Hydrometric Data Computationsand Publication Procedures”, pages 12 and 13.
(a) “A” - Manual GaugeUse this symbol during open water periods to identify the use of one or moremanual gauge observations to obtain a daily stage at a station where thewater stage recorder was temporarily out of operation. Enter this symbol tothe right of the daily discharge figure or to the right of the daily stage figureif no discharge data are shown. This symbol will also be used when the chartrecord is available for only part of a day. During a year when a recorder isinstalled, the symbol “A” will be used on all days prior to the chart recordsto identify manual gauge readings. Do not enter this symbol in any monthlyor annual summary data, except for the extremes in the annual summary, ifapplicable. Do not use this symbol during ice periods. However, a footnotewill be required if the recording gauge was not in operation in winterperiods. Use of this symbol must be accompanied by an appropriatereference in a footnote (i.e., A - Manual gauge). The symbols “B” or “E”have precedence over the symbol “A”.
(b) “B” - Ice ConditionsUse this symbol to indicate that ice conditions in the stream have altered theopen water stage-discharge relationship. The symbol is entered to the right ofthe daily discharge figure. This symbol will not be used for water level data.However, if it is required for specific stations, an appropriate explanationshould be given in the Station Analysis Form AQU-07. Do not enter thissymbol in any monthly or annual summary data except for the extremes inthe annual summary, if applicable. Use of this symbol must be accompaniedby an appropriate reference in a footnote (i.e., B - Ice conditions). Thesymbol “B” has precedence over the symbols “A” and “E”.
(c) “D” - DryUse this symbol to indicate that the stream or lake is “dry” or that there is nowater at the gauge. This symbol is used without a footnote in the gaugeheight column.
(d) “E” - EstimatedUse this symbol whenever the discharge during open water periods wasdetermined by some indirect method, such as interpolation, significant highstage extension, comparison with other streams, or by correlation withmeteorological data. If desired, the method of estimate may be given in afootnote. Enter this symbol to the right of the daily discharge or daily waterlevel figure. Do not use this symbol during ice periods. Do not enter thissymbol in any monthly or annual summary data except for the extremes inthe annual summary, if applicable. Use of this symbol must be accompaniedby an appropriate reference in a footnote (i.e., E - Estimated). The symbol“E” has precedence over the symbol “A”.
(e) In summary, although only the symbols “A”, “B”, “D”, or “E” will be used,only the symbols “A”, “B” or “E” will be accompanied by a footnote in thedata compilations or on printouts. For example, footnotes may be used if the
Standard Operating Procedures for Hydrometric Surveys
172 November 2, 1998
symbol applies to one or more periods, or to explain that the recording gaugewas not in operation during all or part of the winter period.
(f) The computer printouts for daily discharges and water levels will show asymbol for each day, where applicable.
F.3.4 Station Analysis
Although the Station Analysis Form AQU-07 will not be dealt with in this section, thereader should be aware that pertinent facts regarding the open water computations shouldbe noted for eventual inclusion in the station analysis.
For instance, the reasons for the distribution of the gauge and shift corrections, includingthe stage-shifting; the period of use of stage-discharge tables; etc.
In particular, any deviation from the commonly practiced computation procedure shouldbe tabulated in the station analysis.
F.3.5 Conclusion
This section has covered the derivation of stage-discharge curves and tables fromdischarge measurements, and the production of discharge data by combining stage dataand the stage-discharge relationship. The stage-discharge curve must be determined by amanual process in order to give appropriate weighting to the discharge data. After that,data may be processed manually or by computerized methods.
There are a number of specialized software packages for hydrometric data processing,and some users have adapted more general software such as spreadsheets for thispurpose. This section has described techniques as if data were being processed manually,as it is essential that the user be familiar with the rationale. Hydrometric computerpackages can expedite data processing, but do not replace the knowledge and skill of acompetent hydrometric technician. The judgments required at various stages of theprocess must be suitably documented, whether manual or computerized processing isused.

F. Rating Streams and Computing Discharge
November 2, 1998 173
This page intentionally blank.
Standard Operating Procedures for Hydrometric Surveys
174 November 2, 1998
G. Discharge Measurement Structures
G.1 IntroductionThis section is intended to serve as a guide to the selection and installation of permanentand semi-permanent structures with a predetermined rating. The sampling of commonpre-fabricated units included, each of which has been rated in laboratory test programs.In addition, all have effective discharge coefficients of less than 3% error when operatedwithin their modular range and the other limits of application have been satisfied. Withthe exception of larger rectangular weirs, the capacities of the structures described do notexceed 4 m³/s.
Larger units are available, but the cost of engineering and construction place thembeyond routine applications. The need for rating verification for these structures becomesmore important for the larger units or where the design is modified in any way.Reference to standard texts is recommended, as no details on the hydraulics or modularlimits are provided. (Discharge Measurement Structures. Edited by M.G. BOS. Publishedby International Institute for Land Reclamation and Improvement/ILRI PO Box 45, 6700AA Wageningen, The Netherlands.)
G.2 PurposeThe measurement of flow in natural streams is hampered by many factors, whichundermine the reliability of metering equipment. These conditions include:
• Remote locations interfering with regular and timely visits.• Access difficulty, steep banks, seasonal or poorly maintained roads.• Movable bed and high sediment transport conditions resulting in control shifts,
perhaps several during a single season.• Metering trips must be repeated frequently and not all are productive.• Poor metering sites, for example steep rocky gradients.• Shallow flows where normal metering equipment is not acceptable.
Rated structures can be used in such situations to minimize or eliminate many of theseproblems. The initial installations costs can be high for major installations, but must beevaluated against repeated metering which can also be expensive and all too frequentlywasted. The cost of buying and installing prefabricated structures can vary from about$2000 to $20 000, but can easily provide high quality data for many years with little orno metering.
G.3 DesignThe selection of alternate flow measurement methods, particularly if involving largerstreams with potentially destructive flows, should only be made after consultation withan hydraulic engineer or hydrometric specialist. These together with any largermeasuring structures require the services of a structural engineer for final design.
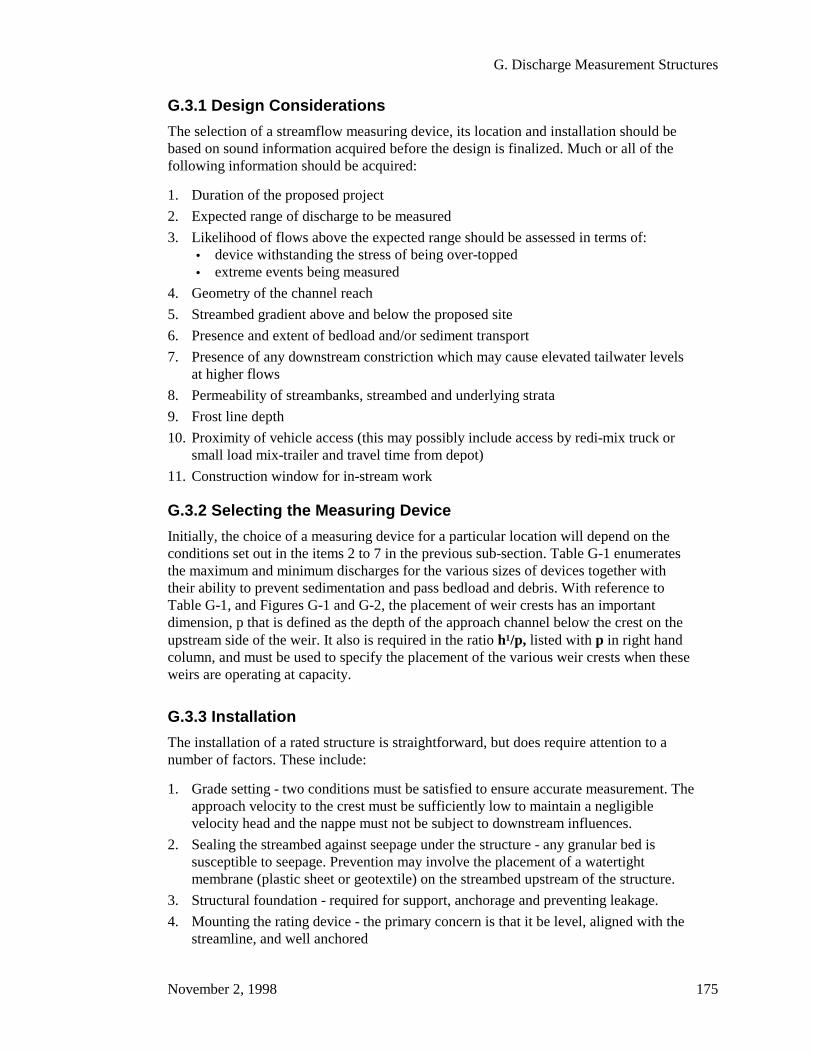
G. Discharge Measurement Structures
November 2, 1998 175
G.3.1 Design Considerations
The selection of a streamflow measuring device, its location and installation should bebased on sound information acquired before the design is finalized. Much or all of thefollowing information should be acquired:
1. Duration of the proposed project
2. Expected range of discharge to be measured
3. Likelihood of flows above the expected range should be assessed in terms of:• device withstanding the stress of being over-topped• extreme events being measured
4. Geometry of the channel reach
5. Streambed gradient above and below the proposed site
6. Presence and extent of bedload and/or sediment transport
7. Presence of any downstream constriction which may cause elevated tailwater levelsat higher flows
8. Permeability of streambanks, streambed and underlying strata
9. Frost line depth
10. Proximity of vehicle access (this may possibly include access by redi-mix truck orsmall load mix-trailer and travel time from depot)
11. Construction window for in-stream work
G.3.2 Selecting the Measuring Device
Initially, the choice of a measuring device for a particular location will depend on theconditions set out in the items 2 to 7 in the previous sub-section. Table G-1 enumeratesthe maximum and minimum discharges for the various sizes of devices together withtheir ability to prevent sedimentation and pass bedload and debris. With reference toTable G-1, and Figures G-1 and G-2, the placement of weir crests has an importantdimension, p that is defined as the depth of the approach channel below the crest on theupstream side of the weir. It also is required in the ratio h¹/p, listed with p in right handcolumn, and must be used to specify the placement of the various weir crests when theseweirs are operating at capacity.
G.3.3 Installation
The installation of a rated structure is straightforward, but does require attention to anumber of factors. These include:
1. Grade setting - two conditions must be satisfied to ensure accurate measurement. Theapproach velocity to the crest must be sufficiently low to maintain a negligiblevelocity head and the nappe must not be subject to downstream influences.
2. Sealing the streambed against seepage under the structure - any granular bed issusceptible to seepage. Prevention may involve the placement of a watertightmembrane (plastic sheet or geotextile) on the streambed upstream of the structure.
3. Structural foundation - required for support, anchorage and preventing leakage.
4. Mounting the rating device - the primary concern is that it be level, aligned with thestreamline, and well anchored
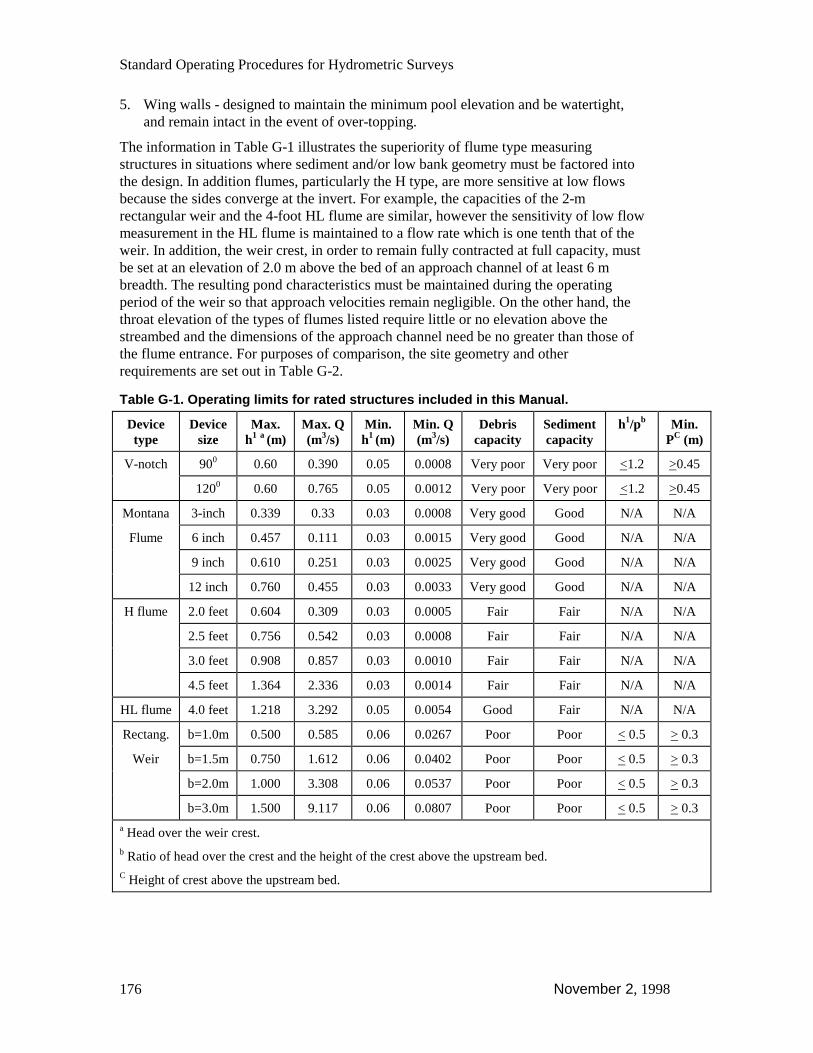
Standard Operating Procedures for Hydrometric Surveys
176 November 2, 1998
5. Wing walls - designed to maintain the minimum pool elevation and be watertight,and remain intact in the event of over-topping.
The information in Table G-1 illustrates the superiority of flume type measuringstructures in situations where sediment and/or low bank geometry must be factored intothe design. In addition flumes, particularly the H type, are more sensitive at low flowsbecause the sides converge at the invert. For example, the capacities of the 2-mrectangular weir and the 4-foot HL flume are similar, however the sensitivity of low flowmeasurement in the HL flume is maintained to a flow rate which is one tenth that of theweir. In addition, the weir crest, in order to remain fully contracted at full capacity, mustbe set at an elevation of 2.0 m above the bed of an approach channel of at least 6 mbreadth. The resulting pond characteristics must be maintained during the operatingperiod of the weir so that approach velocities remain negligible. On the other hand, thethroat elevation of the types of flumes listed require little or no elevation above thestreambed and the dimensions of the approach channel need be no greater than those ofthe flume entrance. For purposes of comparison, the site geometry and otherrequirements are set out in Table G-2.
Table G-1. Operating limits for rated structures included in this Manual.
Devicetype
Devicesize
Max.h1 a (m)
Max. Q(m3/s)
Min.h1 (m)
Min. Q(m3/s)
Debriscapacity
Sedimentcapacity
h1/pb Min.PC (m)
V-notch 900 0.60 0.390 0.05 0.0008 Very poor Very poor <1.2 >0.45
1200 0.60 0.765 0.05 0.0012 Very poor Very poor <1.2 >0.45
Montana 3-inch 0.339 0.33 0.03 0.0008 Very good Good N/A N/A
Flume 6 inch 0.457 0.111 0.03 0.0015 Very good Good N/A N/A
9 inch 0.610 0.251 0.03 0.0025 Very good Good N/A N/A
12 inch 0.760 0.455 0.03 0.0033 Very good Good N/A N/A
H flume 2.0 feet 0.604 0.309 0.03 0.0005 Fair Fair N/A N/A
2.5 feet 0.756 0.542 0.03 0.0008 Fair Fair N/A N/A
3.0 feet 0.908 0.857 0.03 0.0010 Fair Fair N/A N/A
4.5 feet 1.364 2.336 0.03 0.0014 Fair Fair N/A N/A
HL flume 4.0 feet 1.218 3.292 0.05 0.0054 Good Fair N/A N/A
Rectang. b=1.0m 0.500 0.585 0.06 0.0267 Poor Poor < 0.5> 0.3
Weir b=1.5m 0.750 1.612 0.06 0.0402 Poor Poor < 0.5> 0.3
b=2.0m 1.000 3.308 0.06 0.0537 Poor Poor < 0.5> 0.3
b=3.0m 1.500 9.117 0.06 0.0807 Poor Poor < 0.5> 0.3
a Head over the weir crest.b Ratio of head over the crest and the height of the crest above the upstream bed.C Height of crest above the upstream bed.
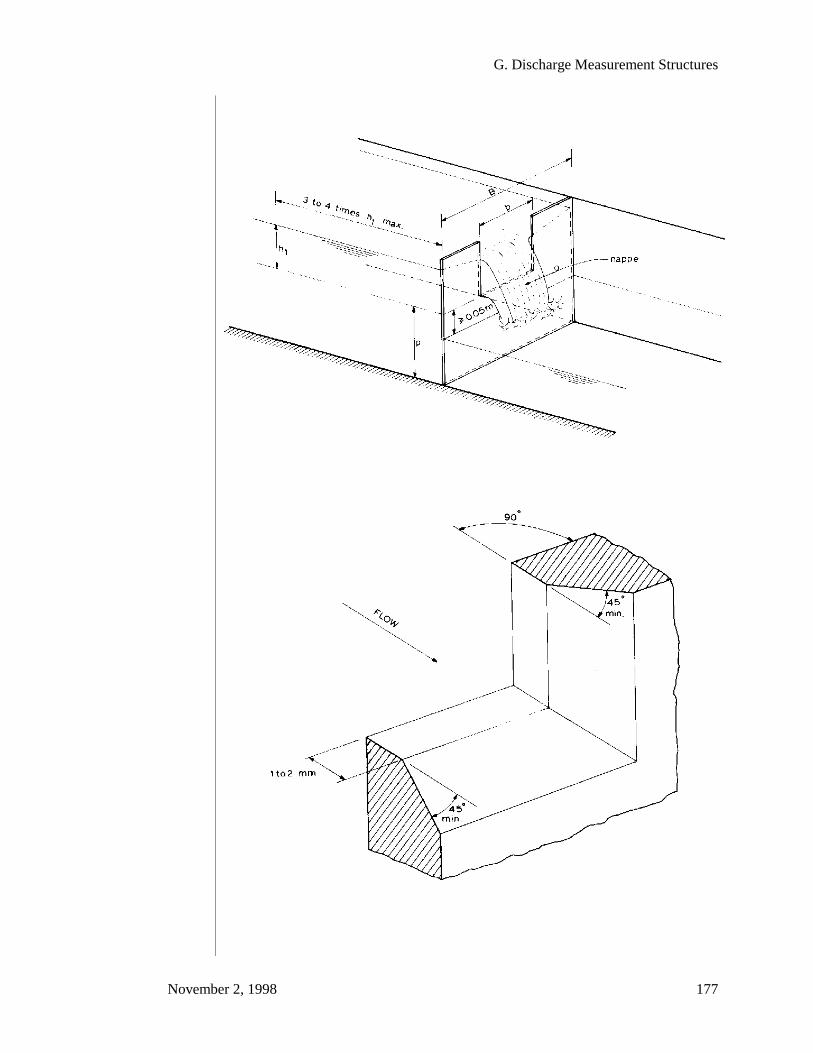
G. Discharge Measurement Structures
November 2, 1998 177

Standard Operating Procedures for Hydrometric Surveys
178 November 2, 1998
Figure G-1. Top - Rectangular sharp-nested weir (thin-plate weir). Bottom -Enlarged view of crest and side of rectangular sharp-crested weir.
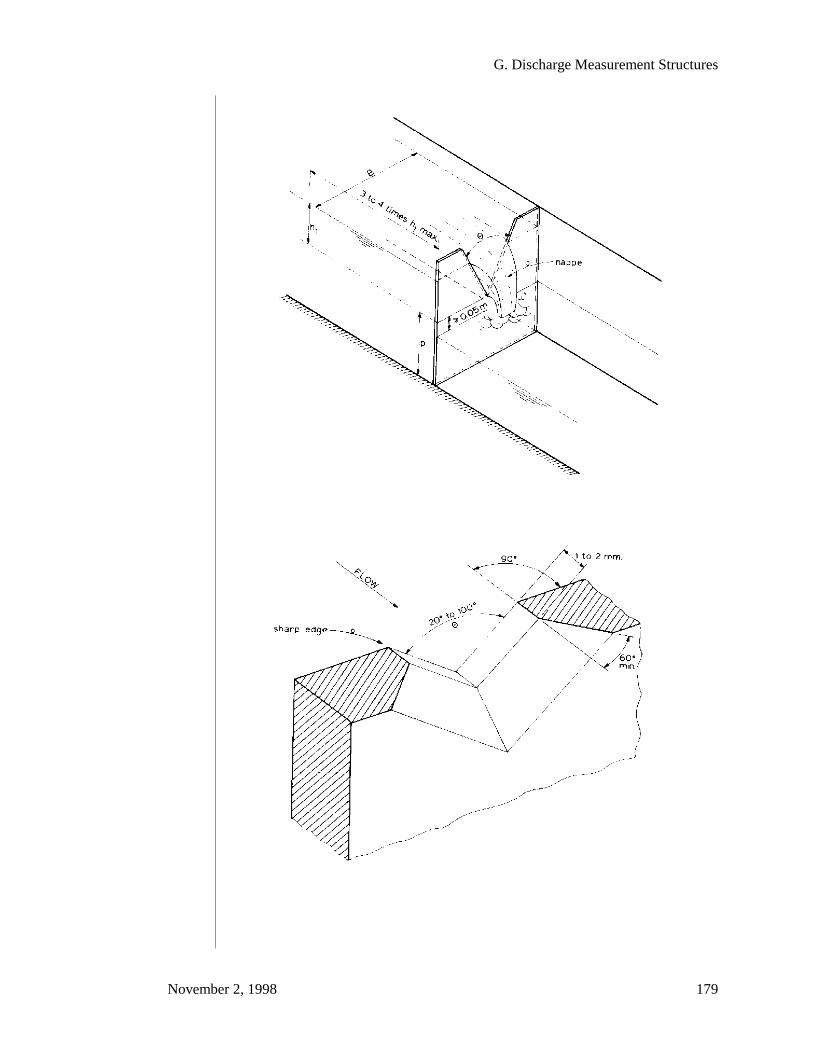
G. Discharge Measurement Structures
November 2, 1998 179
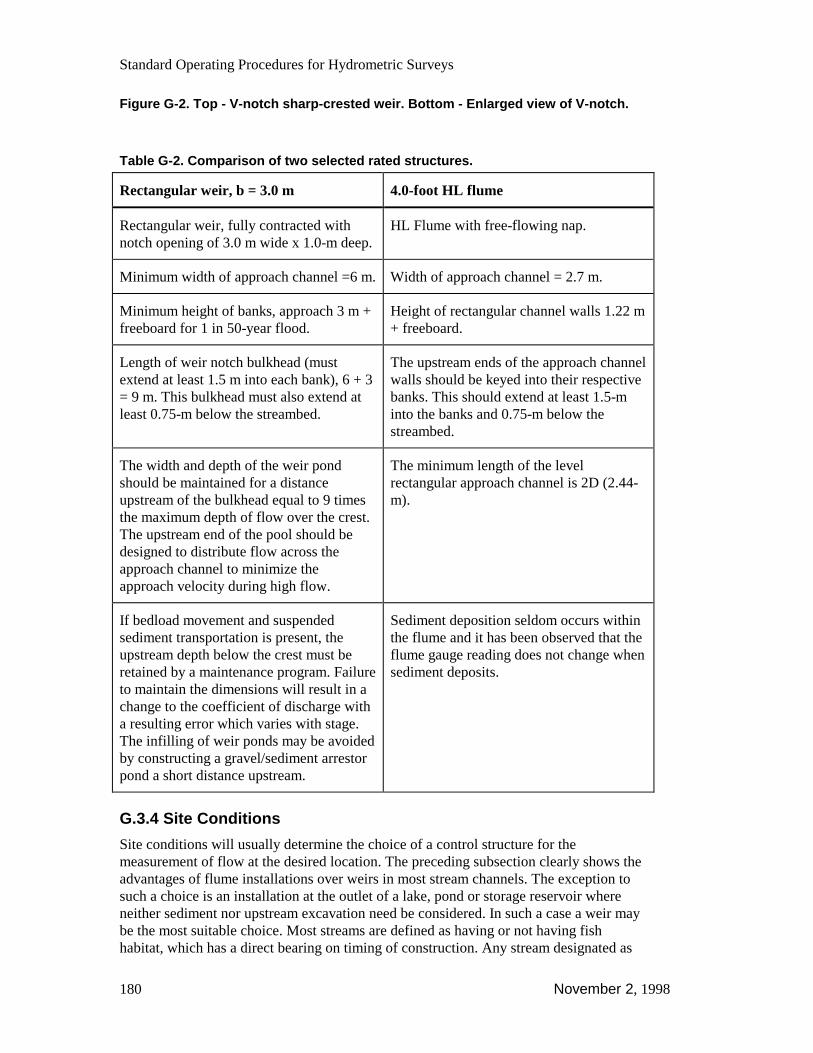
Standard Operating Procedures for Hydrometric Surveys
180 November 2, 1998
Figure G-2. Top - V-notch sharp-crested weir. Bottom - Enlarged view of V-notch.
Table G-2. Comparison of two selected rated structures.
Rectangular weir, b = 3.0 m 4.0-foot HL flume
Rectangular weir, fully contracted withnotch opening of 3.0 m wide x 1.0-m deep.
HL Flume with free-flowing nap.
Minimum width of approach channel =6 m. Width of approach channel = 2.7 m.
Minimum height of banks, approach 3 m +freeboard for 1 in 50-year flood.
Height of rectangular channel walls 1.22 m+ freeboard.
Length of weir notch bulkhead (mustextend at least 1.5 m into each bank), 6 + 3= 9 m. This bulkhead must also extend atleast 0.75-m below the streambed.
The upstream ends of the approach channelwalls should be keyed into their respectivebanks. This should extend at least 1.5-minto the banks and 0.75-m below thestreambed.
The width and depth of the weir pondshould be maintained for a distanceupstream of the bulkhead equal to 9 timesthe maximum depth of flow over the crest.The upstream end of the pool should bedesigned to distribute flow across theapproach channel to minimize theapproach velocity during high flow.
The minimum length of the levelrectangular approach channel is 2D (2.44-m).
If bedload movement and suspendedsediment transportation is present, theupstream depth below the crest must beretained by a maintenance program. Failureto maintain the dimensions will result in achange to the coefficient of discharge witha resulting error which varies with stage.The infilling of weir ponds may be avoidedby constructing a gravel/sediment arrestorpond a short distance upstream.
Sediment deposition seldom occurs withinthe flume and it has been observed that theflume gauge reading does not change whensediment deposits.
G.3.4 Site Conditions
Site conditions will usually determine the choice of a control structure for themeasurement of flow at the desired location. The preceding subsection clearly shows theadvantages of flume installations over weirs in most stream channels. The exception tosuch a choice is an installation at the outlet of a lake, pond or storage reservoir whereneither sediment nor upstream excavation need be considered. In such a case a weir maybe the most suitable choice. Most streams are defined as having or not having fishhabitat, which has a direct bearing on timing of construction. Any stream designated as
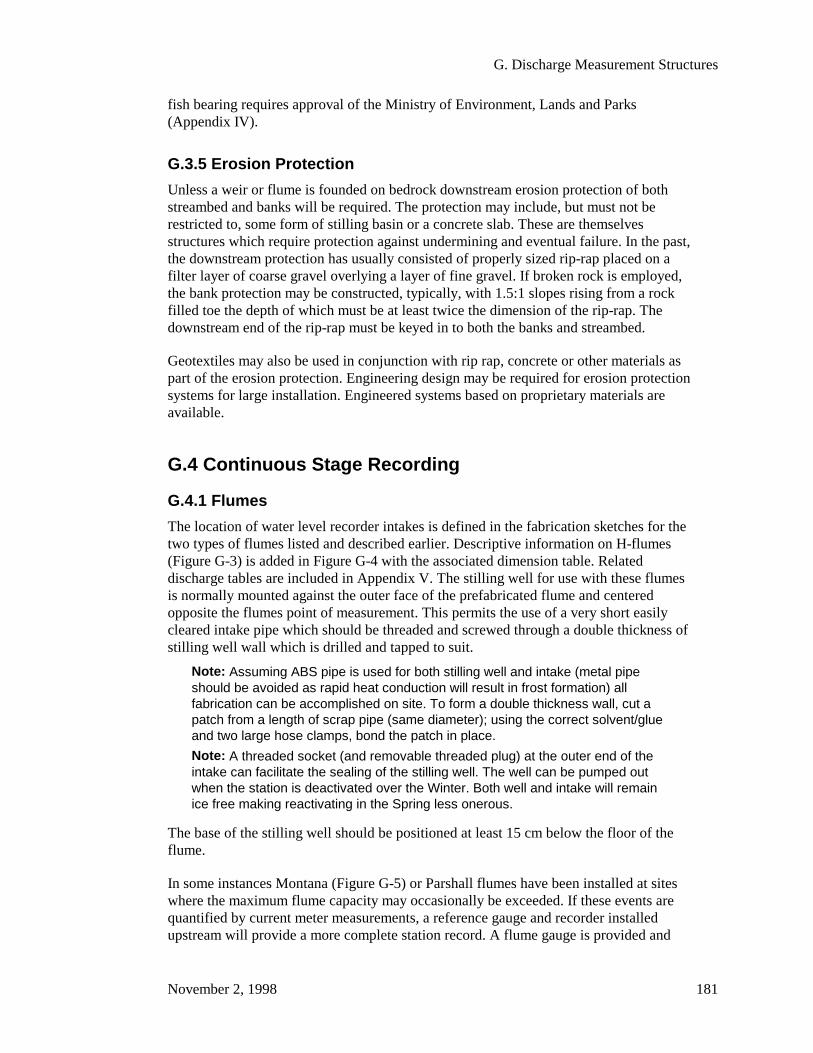
G. Discharge Measurement Structures
November 2, 1998 181
fish bearing requires approval of the Ministry of Environment, Lands and Parks(Appendix IV).
G.3.5 Erosion Protection
Unless a weir or flume is founded on bedrock downstream erosion protection of bothstreambed and banks will be required. The protection may include, but must not berestricted to, some form of stilling basin or a concrete slab. These are themselvesstructures which require protection against undermining and eventual failure. In the past,the downstream protection has usually consisted of properly sized rip-rap placed on afilter layer of coarse gravel overlying a layer of fine gravel. If broken rock is employed,the bank protection may be constructed, typically, with 1.5:1 slopes rising from a rockfilled toe the depth of which must be at least twice the dimension of the rip-rap. Thedownstream end of the rip-rap must be keyed in to both the banks and streambed.
Geotextiles may also be used in conjunction with rip rap, concrete or other materials aspart of the erosion protection. Engineering design may be required for erosion protectionsystems for large installation. Engineered systems based on proprietary materials areavailable.
G.4 Continuous Stage Recording
G.4.1 Flumes
The location of water level recorder intakes is defined in the fabrication sketches for thetwo types of flumes listed and described earlier. Descriptive information on H-flumes(Figure G-3) is added in Figure G-4 with the associated dimension table. Relateddischarge tables are included in Appendix V. The stilling well for use with these flumesis normally mounted against the outer face of the prefabricated flume and centeredopposite the flumes point of measurement. This permits the use of a very short easilycleared intake pipe which should be threaded and screwed through a double thickness ofstilling well wall which is drilled and tapped to suit.
Note: Assuming ABS pipe is used for both stilling well and intake (metal pipeshould be avoided as rapid heat conduction will result in frost formation) allfabrication can be accomplished on site. To form a double thickness wall, cut apatch from a length of scrap pipe (same diameter); using the correct solvent/glueand two large hose clamps, bond the patch in place.
Note: A threaded socket (and removable threaded plug) at the outer end of theintake can facilitate the sealing of the stilling well. The well can be pumped outwhen the station is deactivated over the Winter. Both well and intake will remainice free making reactivating in the Spring less onerous.
The base of the stilling well should be positioned at least 15 cm below the floor of theflume.
In some instances Montana (Figure G-5) or Parshall flumes have been installed at siteswhere the maximum flume capacity may occasionally be exceeded. If these events arequantified by current meter measurements, a reference gauge and recorder installedupstream will provide a more complete station record. A flume gauge is provided and
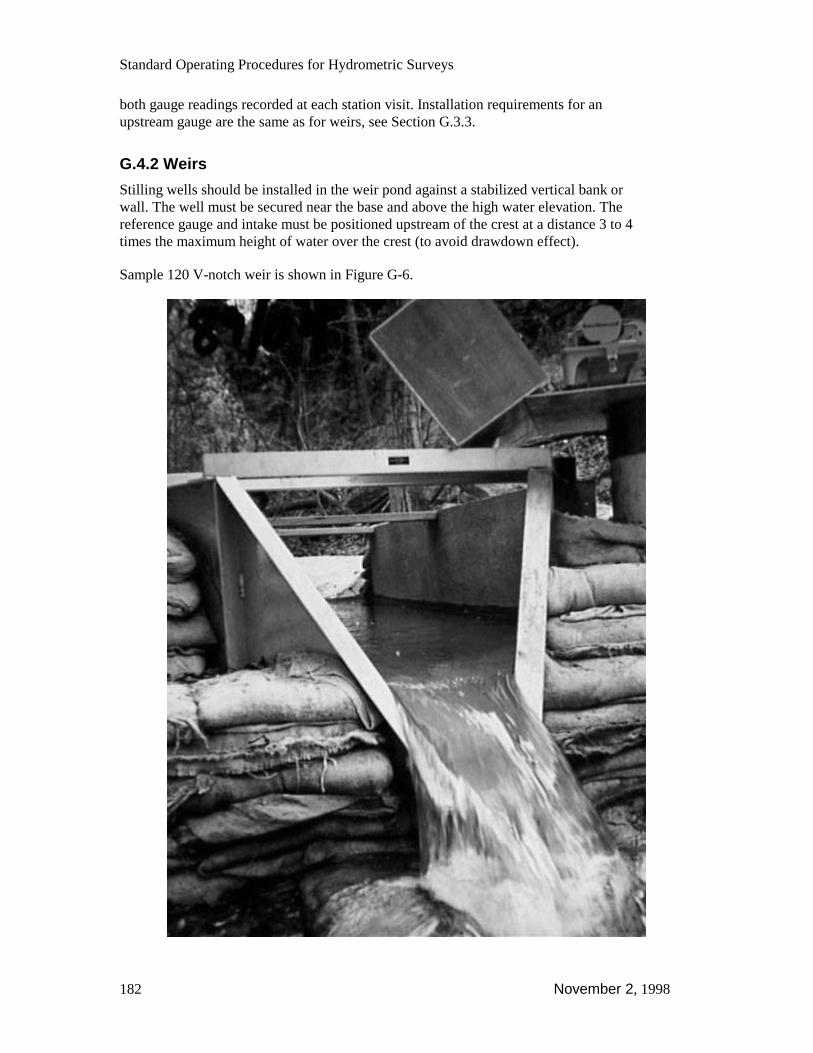
Standard Operating Procedures for Hydrometric Surveys
182 November 2, 1998
both gauge readings recorded at each station visit. Installation requirements for anupstream gauge are the same as for weirs, see Section G.3.3.
G.4.2 Weirs
Stilling wells should be installed in the weir pond against a stabilized vertical bank orwall. The well must be secured near the base and above the high water elevation. Thereference gauge and intake must be positioned upstream of the crest at a distance 3 to 4times the maximum height of water over the crest (to avoid drawdown effect).
Sample 120 V-notch weir is shown in Figure G-6.

G. Discharge Measurement Structures
November 2, 1998 183
Figure G-3. 2.5 foot H Flume set in concrete filled sacks. Cuisson Creek aboveGibraltar Mine.
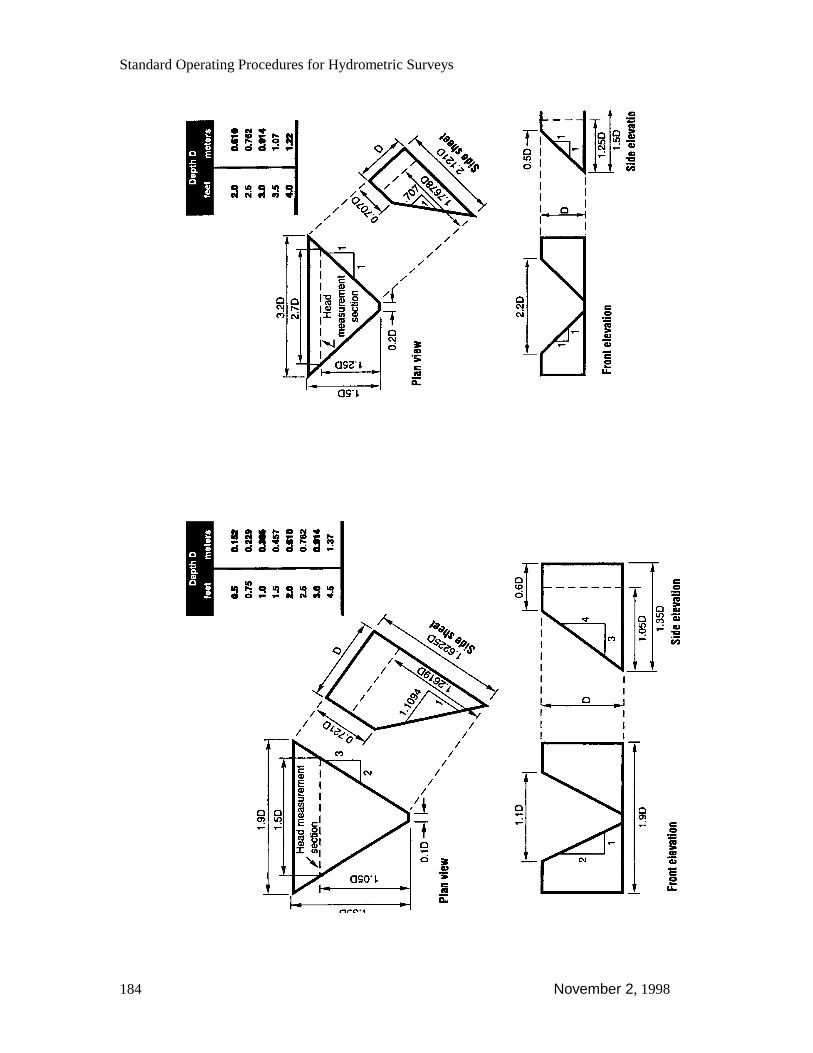
Standard Operating Procedures for Hydrometric Surveys
184 November 2, 1998
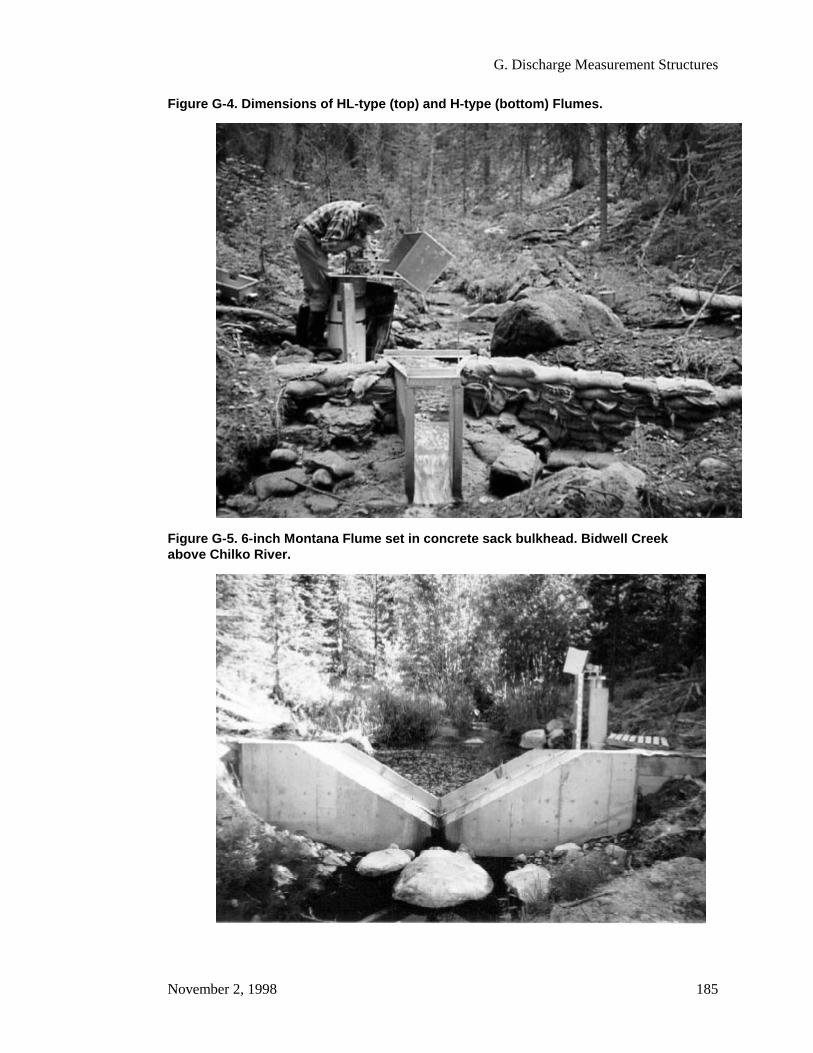
G. Discharge Measurement Structures
November 2, 1998 185
Figure G-4. Dimensions of HL-type (top) and H-type (bottom) Flumes.
Figure G-5. 6-inch Montana Flume set in concrete sack bulkhead. Bidwell Creekabove Chilko River.

Standard Operating Procedures for Hydrometric Surveys
186 November 2, 1998
Figure G-6. 120° stainless steel weir plate set in re-enforced concrete. WhiteheadCreek below Whitehead Lake (Summerland District water supply).
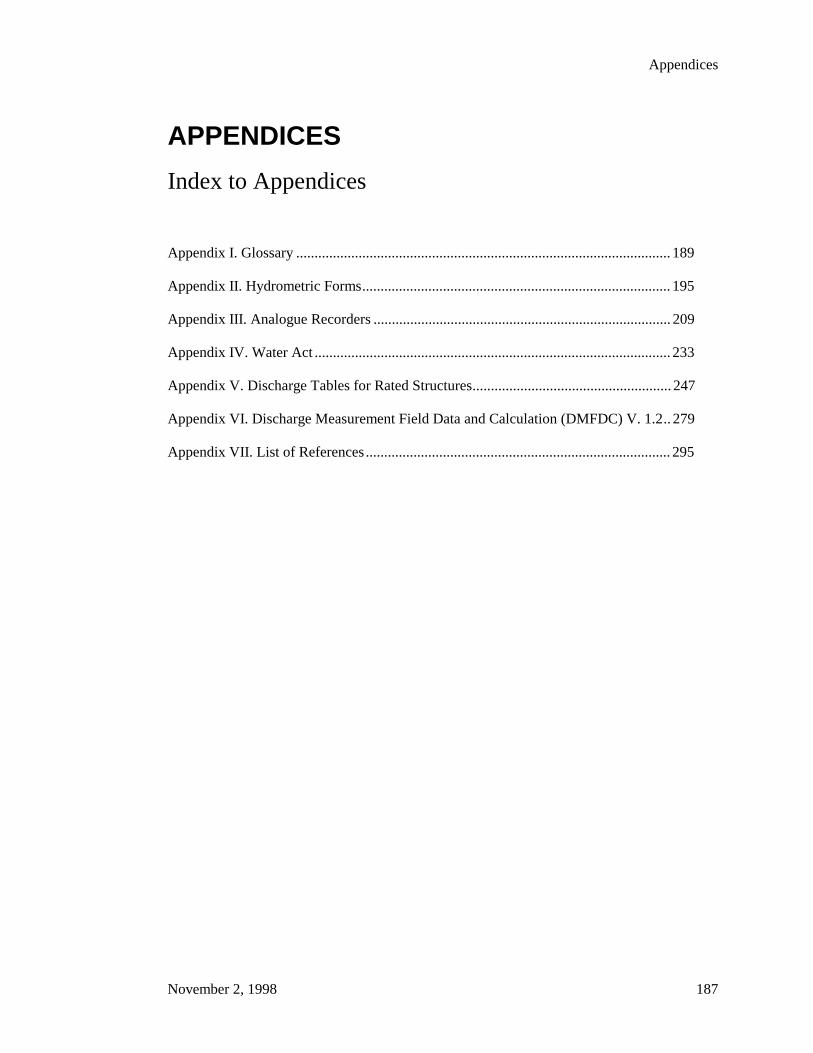
Appendices
November 2, 1998 187
APPENDICES
Index to Appendices
Appendix I. Glossary ...................................................................................................... 189
Appendix II. Hydrometric Forms.................................................................................... 195
Appendix III. Analogue Recorders................................................................................. 209
Appendix IV. Water Act ................................................................................................. 233
Appendix V. Discharge Tables for Rated Structures...................................................... 247
Appendix VI. Discharge Measurement Field Data and Calculation (DMFDC) V. 1.2..279
Appendix VII. List of References................................................................................... 295

Standard Operating Procedures for Hydrometric Surveys
188 November 2, 1998
This page intentionally blank.
Appendix I. Glossary
November 2, 1998 189
Appendix I. GlossaryThe following glossary of selected hydrometric terms makes use of ISO Standards towhich the reader is referred. All terms related to hydrometric operations, river hydraulicsand stream sedimentation are defined under ISO Standards (ISO T72: 1988(E)). Inaddition a Glossary of Aquatic terms, including Hydrometric references is published bythe Resources Inventory Committee.
Air line correction: The correction to the sounding line measurement corresponding tothat part of the sounding line above the liquid surface.
Approach channel: The reach of the channel upstream of the gauging structure in whichsuitable flow conditions shall be established to ensure correct gauging.
Backwater: A rise in stage produced by an obstruction in the stream channel caused byice, weeds, control structure, etc. It may be caused by channel storage for which thereservoir properties vary with the depth of flow at the given location. The differencebetween the observed stage for a certain discharge and the stage as indicated by thestage-discharge relation for the same discharge is reported as the backwater at thestation.
Bank, right or left: The margin of a channel as viewed facing downstream. Theexpression “right” or “left” applies similarly to right or left abutments, cableway towers,etc.
Bench mark: A permanent, fixed reference point for which the elevation is known. Itmay when practicable, be related to GSC datum.
Broad-crested weir: A weir of such crest length in the direction of flow that criticalflow occurs on the crest of the weir.
Control: The condition downstream from a gauging station that determines the stagedischarge relation. It may be a stretch of rapids, a weir or other artificial structure. In theabsence of such features, the control may be a less obvious condition such as aconvergence of the channel or even simply the resistance to flow through a downstreamreach. A shifting control exists where the stage-discharge relation tends to changebecause of impermanent bed or banks.
Crest stage gauge; A gauge, usually vertical, used to indicate a peak stage that hasoccurred since the previous setting.
Critical flow: The flow in which specific energy (depth of flow + velocity head) is aminimum for a given discharge; under this condition a small surface disturbance can nottravel upstream. The ratio of inertia to gravity forces (Froude Number) is equal to unity.
Critical-depth flume: A Venturi flume in which the flow changes from sub-criticalupstream to super-critical downstream in which the measurement of one water level, theupstream water level, allows a calculation of the discharge.
Standard Operating Procedures for Hydrometric Surveys
190 November 2, 1998
Cross section of a stream: A specified vertical plane through a stream bounded by thewetted perimeter and the free surface.
Discharge coefficient: A coefficient in the discharge equation, in general relating theactual discharge to a theoretical discharge.
Discharge, Q: The volume of liquid flowing through a cross section per unit of time. Itis not synonymous with “flow”.
Discharge measurement: The determination of the rate of discharge at a gauging stationon a stream, including an observation of ‘no flow’, which is classed as a dischargemeasurement.
Double-drum winch: A winch with two drums, one of which controls and measures thevertical displacement of hydrometric instruments and the other of which controls andmeasures the horizontal displacement of an unmanned cableway carriage.
Draw-down curve: The profile of the liquid surface when its surface slope exceeds thebed slope.
Drowned flow; submerged flow: The flow which is influenced by the water leveldownstream of the measuring structure.
Flat-V weir: A long-base weir with a triangular longitudinal profile. The height of thetriangle increases linearly from the middle of the channel to the abutment of the weir.
Float gauge: A manual gauge consisting of a float that rides on the water surface, risingand falling with the surface. The float’s movements are transmitted to an indicatingdevice.
Flood mark: A trace of any kind left by a flood on the banks, obstacles or flood plain. Itmay be used to determine the highest level attained by the water surface during the flood.
Flow: The movement of water in a channel without reference to rate, depth, etc.
Flume: A specially shaped open channel flow section that may be installed in a channelto measure discharge. Depending on the shape of the section, flumes may be termedParshall, Montana H-flumes, cut-throat, etc.
Free flow; modular flow: A flow which is not influenced by the level of waterdownstream of the measuring device.
Gauge correction: Any correction that must be applied to the gauge observation orgauge reading to obtain the correct gauge height.
Gauge datum: The elevation of the zero of the gauge (referenced to bench marks, orGSC datum) to which the level of the liquid surface is related.
Gauge height: The height of the water surface above the “Gauge datum”; it is usedinterchangeably with the terms “stage” and “water level”.
Appendix I. Glossary
November 2, 1998 191
Gauge observation; Gauge reading: An actual notation of the height of the watersurface as indicated by a gauge, it is the same as a “gauge height” only when the 0.000metre mark of the gauge is set at the “gauge datum”.
Gauging section; measuring section: The cross section of an open channel in the planeof which measurements of depth and velocity are made.
Gauging station: The complete installation at a measuring site where systematic recordsof water level and/or discharge are obtained.
Head on (or over) the weir: Elevation of the water above the lowest point of the crest,measured at a point upstream. The distance upstream for the point of measurementdepends on the type of weir used but is upstream of the transition zone from sub- tosupercritical flow at full weir flow.
Hydraulic jump: The sudden passage of water in an open channel from super-criticaldepth to sub-critical depth, accompanied by energy dissipation.
Hydraulic mean depth; hydraulic radius: The quotient of the wetted cross sectionalarea and the wetted perimeter.
Ice, Anchor: One of three types of ice formed in streams. This ice forms on thestreambed and results from loss of heat by radiation from the streambed to theatmosphere.
Ice, Frazil: One of three types of ice formed in streams. This consists of fine needles ofice which do not unite to form surface ice. Usually these needles float downstream andcome together in a slushy mass.
Ice, Surface: One of three types of ice formed in streams. It is formed on the surfaceeither as a fringe of shore ice or as a continuous ice cover from bank to bank.
Inclined gauge; ramp gauge: A gauge on a slope, generally graduated directly toindicate vertical gauge height.
Left [right] bank: The bank to the left [right) of an observer looking downstream.
Level check: The procedure followed to determine the movement of a gauge withrespect to the gauge datum.
Manual gauge: A non-recording type of gauge from which observations of stage areobtained.
Mean velocity at a cross section: The velocity at a given cross section of a stream,obtained by dividing the discharge by the cross sectional area of the stream at thatsection.
Mean velocity depth: The depth below the surface at which the mean velocity on avertical occurs.
Standard Operating Procedures for Hydrometric Surveys
192 November 2, 1998
Modular limit; point of incipient submergence: The condition of flow where a risingdownstream level just begins to affect the discharge.
Painting: This refers to the wide ink trace on water level recorder analogue charts that iscaused by short term water level fluctuations or by a malfunction in a recorder having agas purge system.
Panel: The area at a vertical defined by the depth at that vertical multiplied by one-halfof the distance between the preceding and the succeeding verticals.
Peak stage: The maximum instantaneous stage during a given period.
Point method (one-; two-; three-; five-; six-): Method of measuring the velocity in avertical by placing a current-meter at a number of designated points in the vertical.
Open channel: The longitudinal boundary surface consisting of the bed and banks orsides within which the liquid flows with a free surface. The term “channel” generallymeans the deep part of a river or other waterway, and its meaning is normally made clearby a descriptive term, either stated or implied, such as “low water” channel, “main”channel, “artificial” channel.
Reach: A length of open channel between two defined cross sections.
Reference current-meter: A current-meter which is immersed at a fixed position in thecross section during the carrying out of a discharge measurement. For slight changes indischarge during the gauging operation, it is assumed that the change in velocityindicated by the reference current-meter is proportional to the change in discharge.
Reference point: A point of known elevation from which measurements may be made toa water surface. It is also known as a “measuring point”.
Sensitivity (of the stage-discharge relation): A measure of the change in stage at agauging station due to a change in discharge. When a small increase in dischargeproduces a relatively large increase in stage, the relation is said to be sensitive. When alarge increase in discharge produces a relatively small increase in stage, the relation issaid to be insensitive.
Shift: A change in the stream control which alters the stage-discharge relationship. Thischange can be either temporary or permanent.
Slope-area measurement: A method of computing peak flow at a gauging station bydetermining the water surface profiles and channel dimensions over a short reach of astream.
Slope-area method: An indirect method of discharge estimation in a reach based on thesurface slope, the reach roughness, the wetted perimeter and flow areas of the variouscross sections in the reach.
Sounding: The operation of measuring the depth from the free surface to the bed.
Appendix I. Glossary
November 2, 1998 193
Stable [unstable] channel: A channel in which the bed and the sides remain stableunstable] over a substantial period of time and in which scour and deposition during therising and falling stages are negligible [appreciable].
Staff gauge: A manual gauge consisting of a graduated plate or rod that is set verticallyin streambed or attached to a solid structure.
Stage; gauge height; water level: The elevation of the free surface of a stream, lake orreservoir relative to a gauge-datum.
Stage: A general term used to describe the height of a water surface and, in a particularapplication, may be either a gauge height or a water elevation.
Stage-discharge relation: A curve, equation or table which expresses the relationbetween the stage and the discharge in an open channel at a given stream cross section.
Steady [unsteady] flow: Condition in which the discharge does not change [changes] inmagnitude with respect to time.
Stilling basin: A pool downstream of a structure in which the velocity and the energy ofthe flow are reduced.
Stilling well: A well [tube] connected with the stream in such a way as to permit themeasurement of the stage in relatively still conditions (natural surging dampened).
Stilling-well lag: During conditions of rising and falling stage in a channel, thedifference at a given time between the channel stage and the stilling-well stage.
Stream: The generic term for water flowing in an open channel, e.g., including creeksand rivers.
Stream gauging; All of the operations necessary for measuring discharge.
Sub-critical flow: The flow in which the Froude number is less than unity and surfacedisturbances can travel upstream.
Submergence ratio: The ratio of the downstream measured head to the upstream totalhead over a weir, the crest being taken as the datum.
Sub-surface float: A float with its greatest drag below the surface for measuring sub-surface velocities.
Super-critical flow: The flow in which the Froude number is greater than unity andsmall surface disturbances can not travel upstream.
Surface draw-down: The local lowering of the water surface in an approach channelcaused by the acceleration of the flow passing over an obstacle or through a control.
Surface float: A float with its greatest drag near the surface for measuring surfacevelocities.
Standard Operating Procedures for Hydrometric Surveys
194 November 2, 1998
Throat: The minimum cross sectional area within a flume. The throat may berectangular, trapezoidal, U-shaped or of another specially designed shape.
Triangular-profile weir: A long-base weir having a triangular longitudinal profile.
Uniform flow: Flow in which the depth and velocity remain constant with respect todistance along the channel. Uniform flow is possible only in a channel of constant crosssection.
Velocity-area method: Method of discharge determination deduced from the area of thecross section, bounded by the wetted perimeter and the free surface, and the integrationof the component velocities in the cross section.
Velocity of approach; approach velocity: The mean velocity in an open channel at aknown distance upstream of a measuring section.
Vertical: The vertical line in which velocity measurements or depth measurements aremade.
Vertical velocity coefficient: The coefficient applied to a single, or an equivalent single,velocity determination at any depth in a vertical to infer the mean velocity on thatvertical.
Wading rod: A light, hand-held, graduated, rigid rod, for sounding the depth andpositioning the current meter in order to measure the velocity in shallow streams suitablefor wading. It may also be used from boats or ice cover, at shallow depths.
Water level recorder: An instrument that records water levels in an analogue or digitalform. The recorder may be actuated by a float or by any one of several other sensortypes.
Weir: An overflow structure built across an open channel to measure the discharge inthe channel. Depending on the shape of the opening, weirs may be termed rectangular,trapezoidal, triangular, etc.
Wet line correction: The correction to the sounding line measurement corresponding tothat part of the sounding line below the liquid surface.
Wetted perimeter, P: The wetted boundary of an open channel at a specified section.
Wire-weight gauge: A gauge consisting essentially of a graduated wire or chain,weighted and lowered to make contact with the surface of the water. Contact with thewater surface is determined visually.
Appendix II. Hydrometric Forms
November 2, 1998 195
Appendix II. Hydrometric Forms
Figure II-1a. Form AQU-01 Description of Hydrometric Station (front)....................... 197
Figure II-1b. Form AQU-01 Description of Hydrometric Station (back)....................... 182
Figure II-2. Form AQU-02 Gauge Level Notes in Metres (front). ................................. 199
Figure II-3a. Form AQU-03 Discharge Measurement (front)......................................... 201
Figure II-3b. Form AQU-03 Discharge Measurement (back)......................................... 186
Figure II-4. Form AQU-04 History or Gauge Levels. .................................................... 203
Figure II-5. Form AQU-05 Summary of Discharge Measurements for the Year _____ 204
Figure II-6. Form AQU-06 Water Stage Recorder - Station Record for the Year _____205
Figure II-7. Form AQU-07 Station Analysis for the Year ______ ................................. 206
Figure II-8. Form AQU-08 Stage-Discharge Rating Curve (Reduced to half size)........ 207

Standard Operating Procedures for Hydrometric Surveys
196 November 2, 1998
This page intentionally blank.
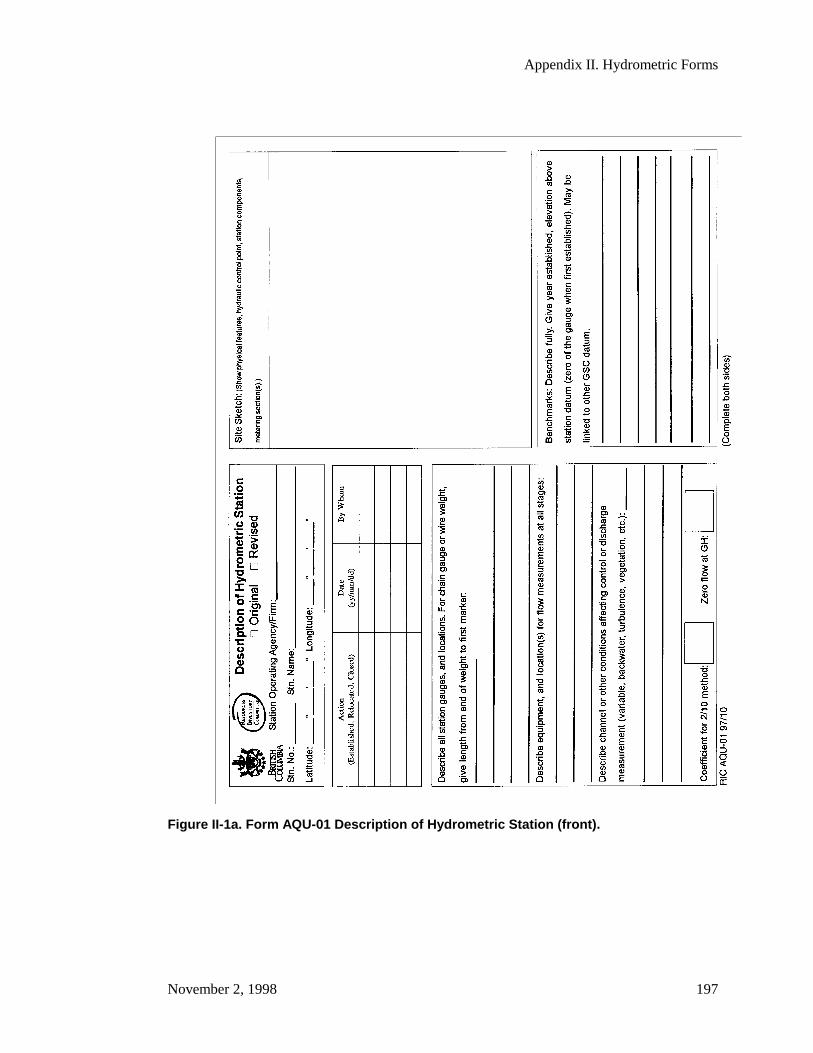
Appendix II. Hydrometric Forms
November 2, 1998 197
Figure II-1a. Form AQU-01 Description of Hydrometric Station (front).
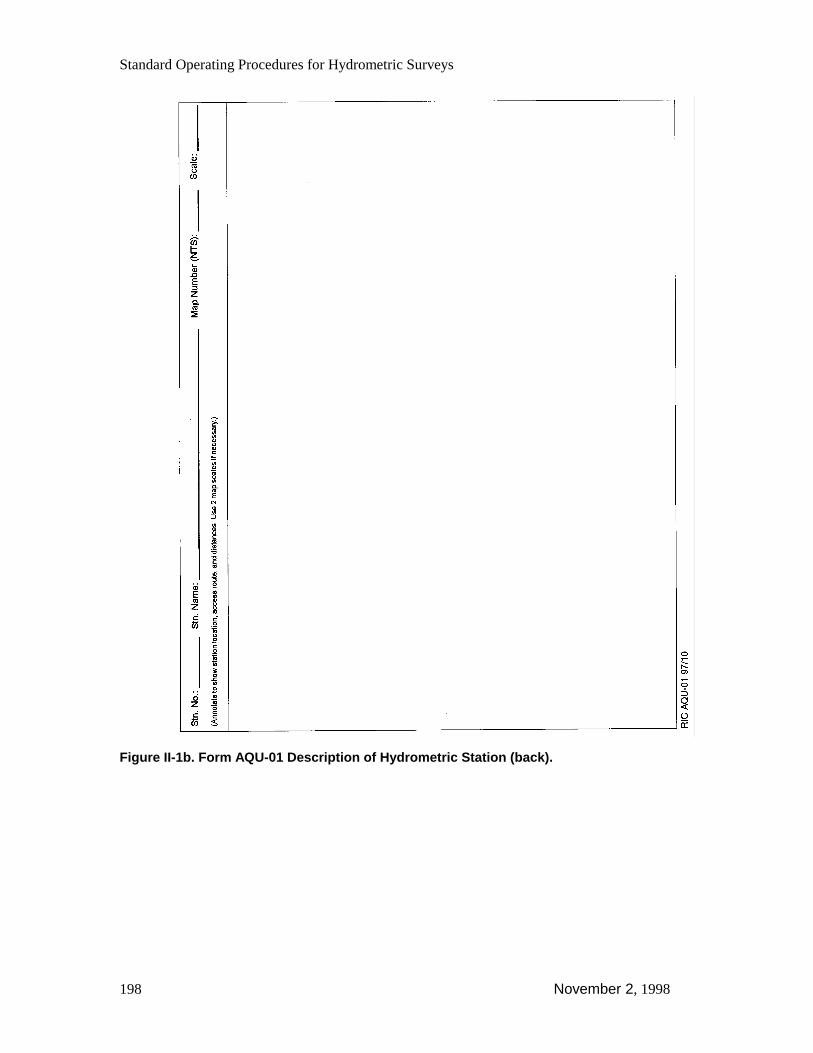
Standard Operating Procedures for Hydrometric Surveys
198 November 2, 1998
Figure II-1b. Form AQU-01 Description of Hydrometric Station (back).

Appendix II. Hydrometric Forms
November 2, 1998 199
Figure II-2. Form AQU-02 Gauge Level Notes in Metres (front).

Standard Operating Procedures for Hydrometric Surveys
200 November 2, 1998
This page intentionally blank.
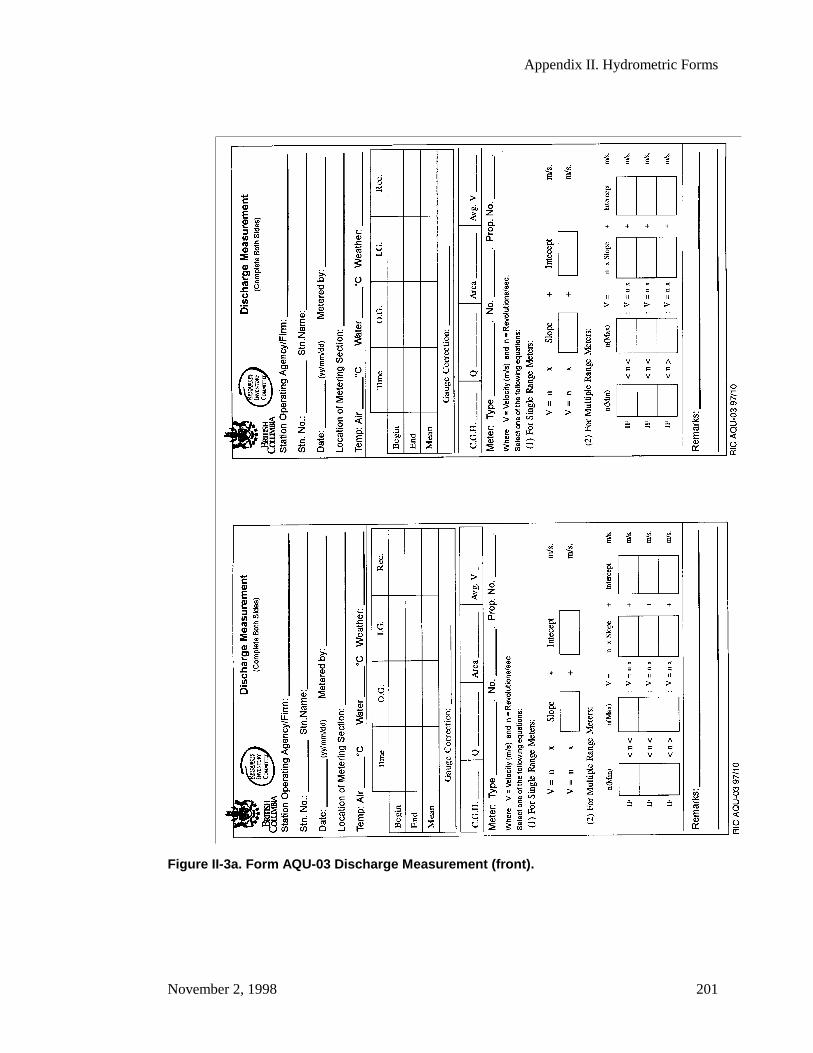
Appendix II. Hydrometric Forms
November 2, 1998 201
Figure II-3a. Form AQU-03 Discharge Measurement (front).
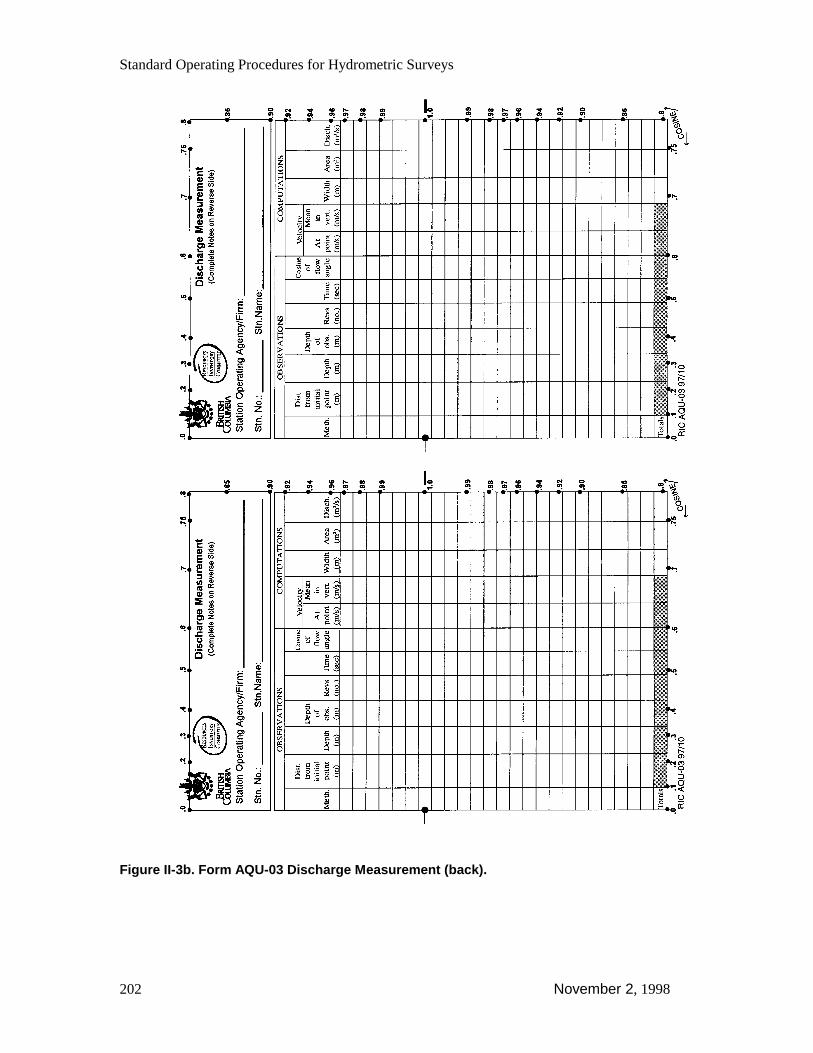
Standard Operating Procedures for Hydrometric Surveys
202 November 2, 1998
Figure II-3b. Form AQU-03 Discharge Measurement (back).

Appendix II. Hydrometric Forms
November 2, 1998 203
Figure II-4. Form AQU-04 History or Gauge Levels.
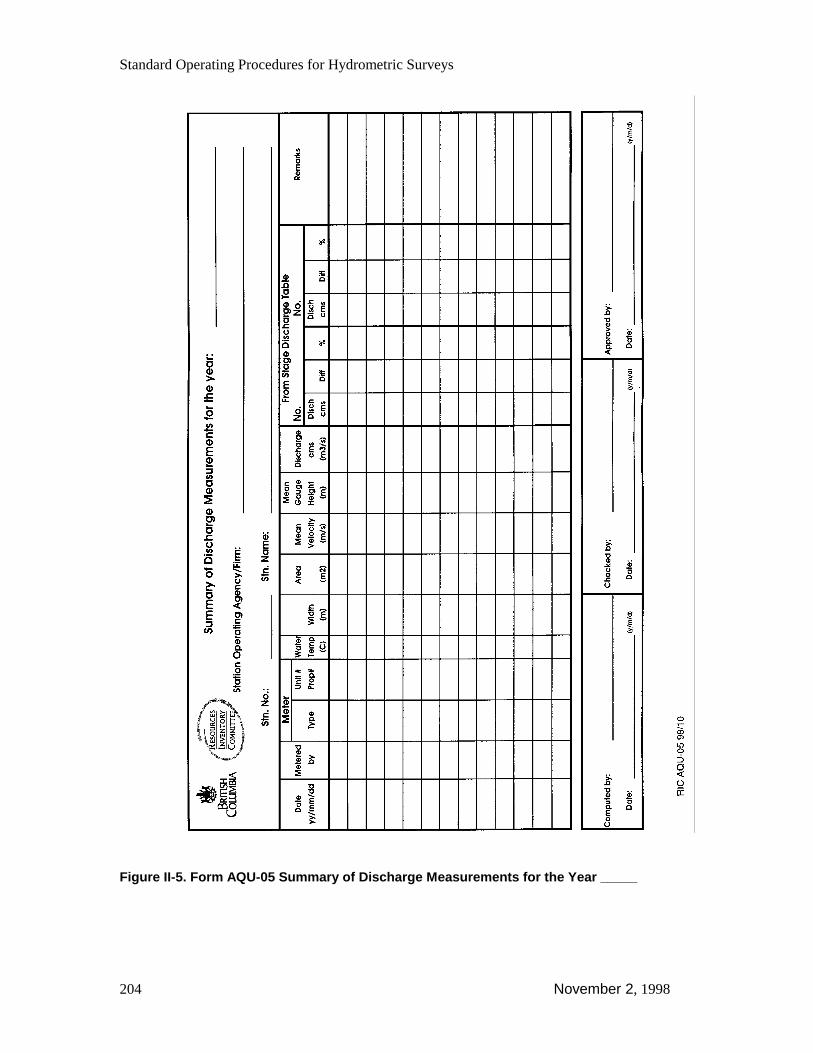
Standard Operating Procedures for Hydrometric Surveys
204 November 2, 1998
Figure II-5. Form AQU-05 Summary of Discharge Measurements for the Year _____
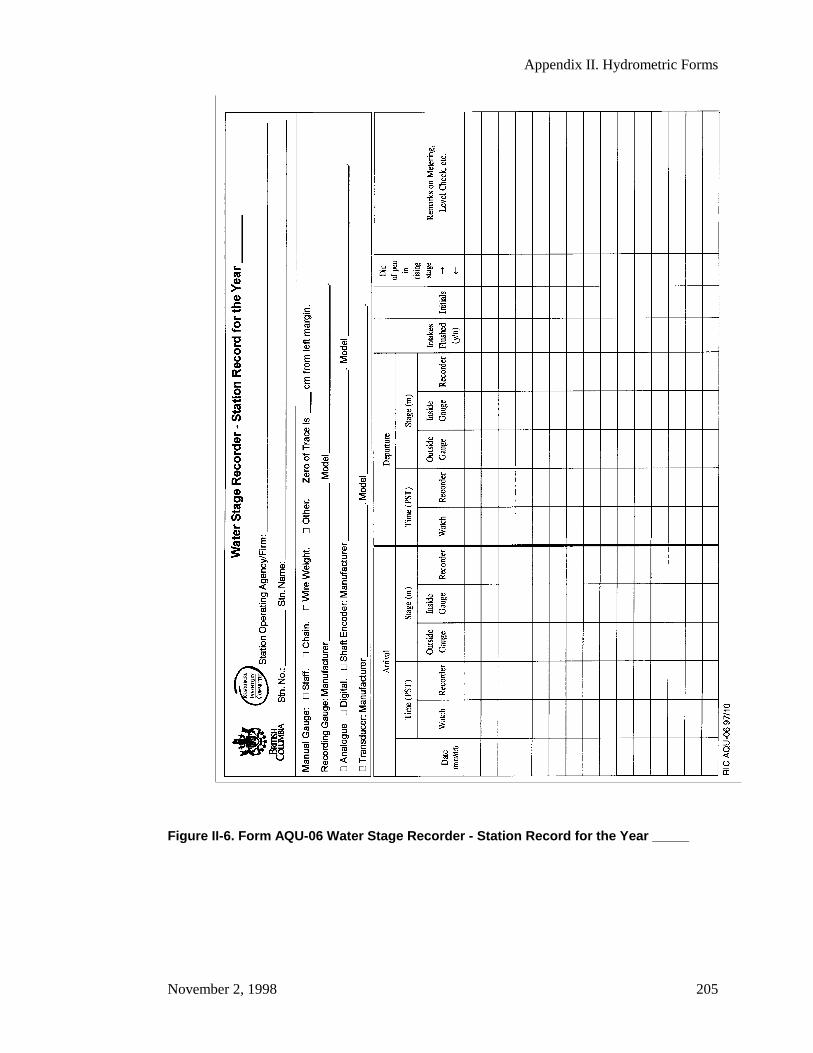
Appendix II. Hydrometric Forms
November 2, 1998 205
Figure II-6. Form AQU-06 Water Stage Recorder - Station Record for the Year _____
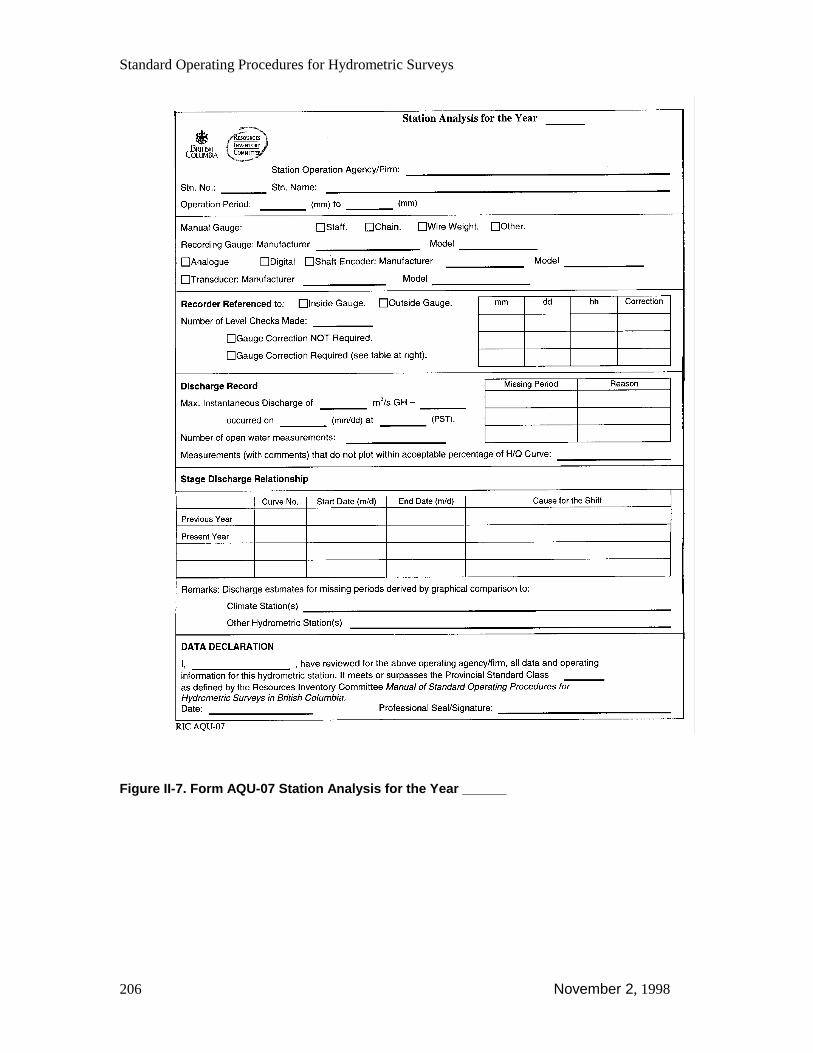
Standard Operating Procedures for Hydrometric Surveys
206 November 2, 1998
Figure II-7. Form AQU-07 Station Analysis for the Year ______
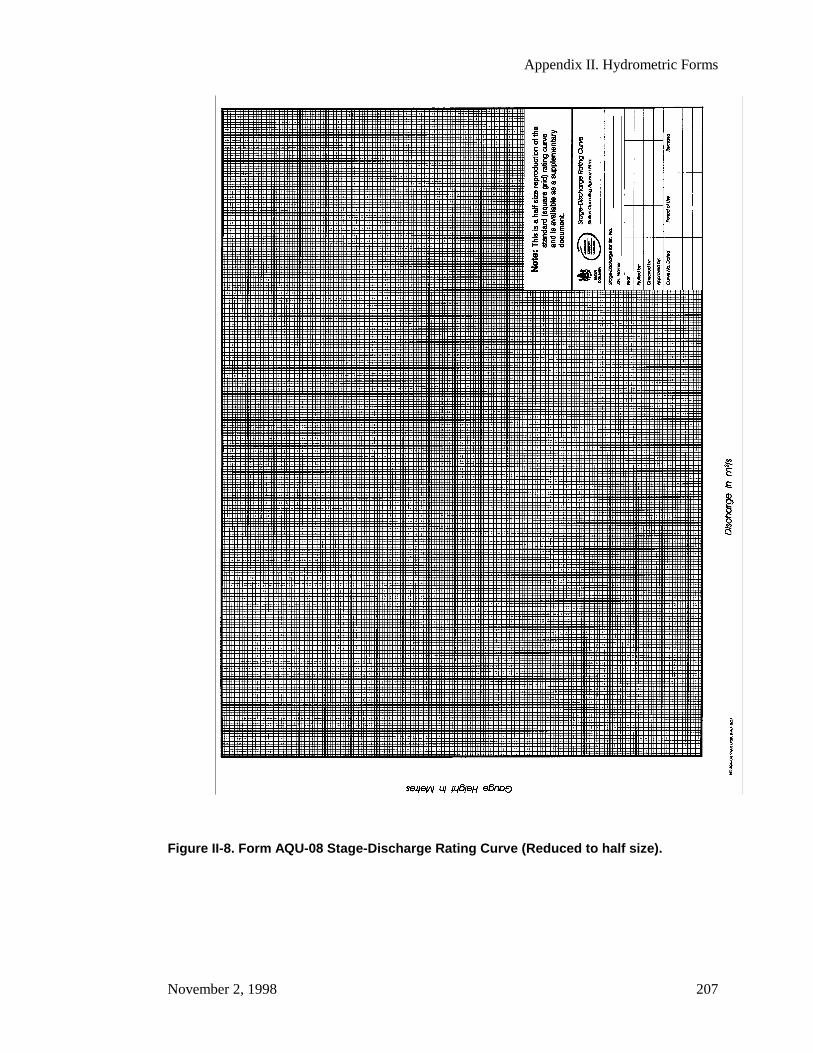
Appendix II. Hydrometric Forms
November 2, 1998 207
Figure II-8. Form AQU-08 Stage-Discharge Rating Curve (Reduced to half size).

Standard Operating Procedures for Hydrometric Surveys
208 November 2, 1998
This page intentionally blank.
Appendix III. Analogue Recorders
November 2, 1998 209
Appendix III. Analogue RecordersAppendix III-1. Type F Water Level Recorder
a) Description
The Type F recorder is a horizontal drum type, with unrestricted drum rotation. Theservice interval for the Type F is limited to 7- or 28-day periods, depending on thegearing.
Unless retrofitted with a data logger add-on (Figure III-1), the Type F recorder is notrecommended for general use in natural stream channels because it is difficult to extracthourly water level values during periods of significant change in stage. However,because the various water management agencies in BC own many Type F recorders,limited use of this existing equipment may be justified economically, e.g., to provide arecord of stage at lakes or reservoirs, or to provide a record of flow rates, for licensingpurposes, below diversion structures in rated channels designed to transport water at anear-constant rate.
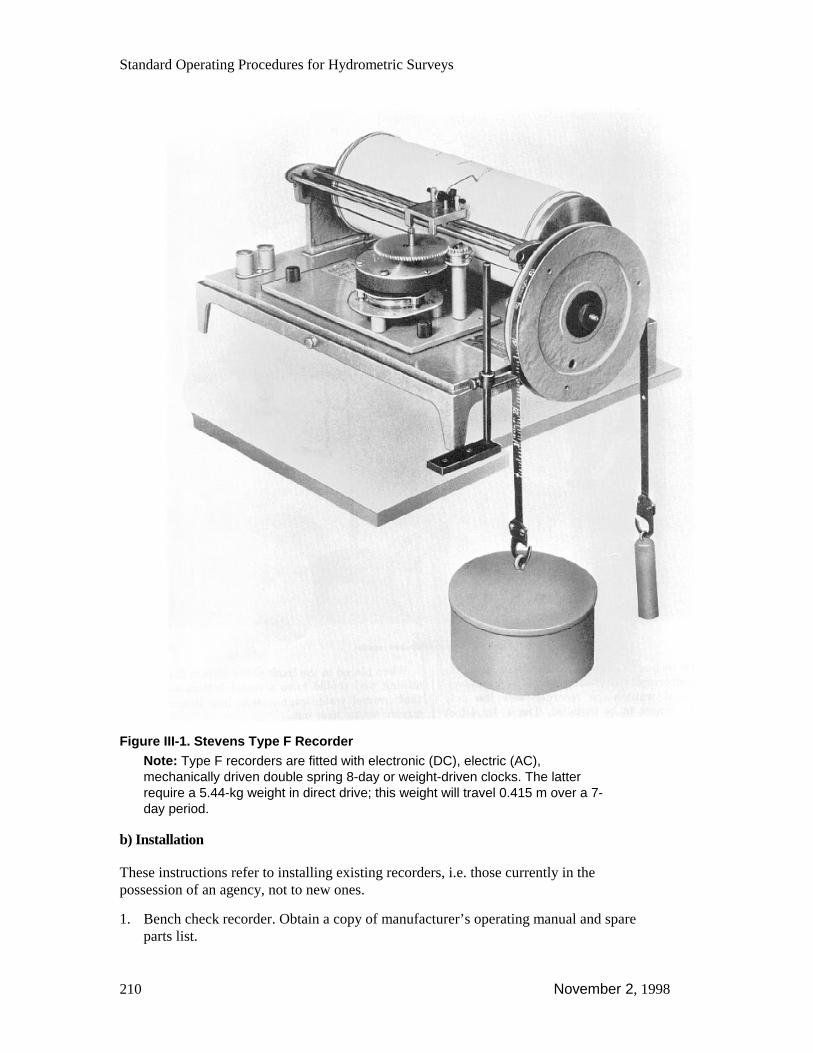
Standard Operating Procedures for Hydrometric Surveys
210 November 2, 1998
Figure III-1. Stevens Type F RecorderNote: Type F recorders are fitted with electronic (DC), electric (AC),mechanically driven double spring 8-day or weight-driven clocks. The latterrequire a 5.44-kg weight in direct drive; this weight will travel 0.415 m over a 7-day period.
b) Installation
These instructions refer to installing existing recorders, i.e. those currently in thepossession of an agency, not to new ones.
1. Bench check recorder. Obtain a copy of manufacturer’s operating manual and spareparts list.
Appendix III. Analogue Recorders
November 2, 1998 211
2. Endure all parts are in place and tested.
3. Check the condition of the braided copper wire that controls the lateral movement ofthe stylus carriage.
4. If the stylus is of the ink reservoir type, order a felt pen adapter and a supply ofcartridges.
5. Check the gear that controls movement between the float line pulley and the chartdrum. Normally the movement will be a 5:1 ratio, although finer definition may bedesirable for some applications.
6. Remove and service the clock (see servicing clocks, Appendix III-3).
7. If clock drive is weight driven mechanical, examine the weight suspension wire andsprung weight attachment clamp.
8. Check the condition of the float, ensure the float suspension cable or tape is ofsufficient length for the proposed location and that the counterweight matches thefloat size.
9. Order a supply of chart sheets, pen cartridges, and any replacement parts.
10. Bench test the recorder for several days on completion of maintenance. Observeclock accuracy and adjust as necessary. See section on clocks, part c of Appendix III-2.Note: There is a minimum internal diameter for the stilling well to provideclearance for the suspended float, counterweight, and clock weight. If amechanical weight-driven clock is to be used, the recorder shelter floor should beplaced at least 75 cm above the highest expected water level. If the weightbecomes submerged, the effective weight is reduced and so is the accuracy ofthe clock regulator. (Stilling Wells, Instrument Shelters, and Float Sizes arediscussed in Section C.2 and C.3.)
c) Data Logger Add-on
Type F graphic data recorders can be “converted” to produce electronic data by addingon a digital data logger. With the digital data logger add-on, the Type F becomes suitablefor where longer term data retrieval service visits are desirable. The chart record is notimproved in any way; however, the digital data logger will provide the necessarytime/water level definition.
Note: The constraints in the use of horizontal drum recorders indicated above donot apply to the European designed models in which the time base is drumrotation and the water level is recorded cross the length of the drum. Somemodels are fitted with a reverse recording mechanism offering unlimited stagerange. The commonly used time scale, 2 mm per hour, requires servicing every 8days.
Appendix III-2. Type A Water Level Recordera) Description
The Type A water level recorder is a continuous strip chart type, with stylus reversal.Type A recorders will operate under ideal conditions for up to 6 months.

Standard Operating Procedures for Hydrometric Surveys
212 November 2, 1998
The two Type A models are the A-35 and the A-71 recorder (Figure III-2); the modelsare essentially the same except A-35 has a metal casing and A-71 has a plastic casing.
The components described here are numbered in Figure III-3 . Strip chart A25,specifically produced for the Type A recorder, is wound onto a 22-mm outside diameteraluminium tube called a supply roll (33). Using a friction system, the strip chart ispropelled from the supply roll over a flat metal surface called the writing plate (15).From here it moves to an exactly aligned cylinder called the take-up cylinder (34). As thestrip chart travels over the writing plate, a marking stylus produces a continuous line.The stylus is fixed to a carriage (23) that travels along guide rails. These guide railsensure that the stylus moves continuously in a right angle direction to chart travel. Thecarriage moves along the guide rails by means of a continuous chain (31) meshed with adrive sprocket. The carriage drive has a reversal mechanism which allows the stylus tocontinue a rise or fall movement at the edge of the graduated chart margin.
Figure III-2. Stevens Type A-71 recorder mounted over a stilling wellImportant Note: The operating system was converted from Imperial to metricunits before 1980; compatible chart paper must be used, i.e. with the same time
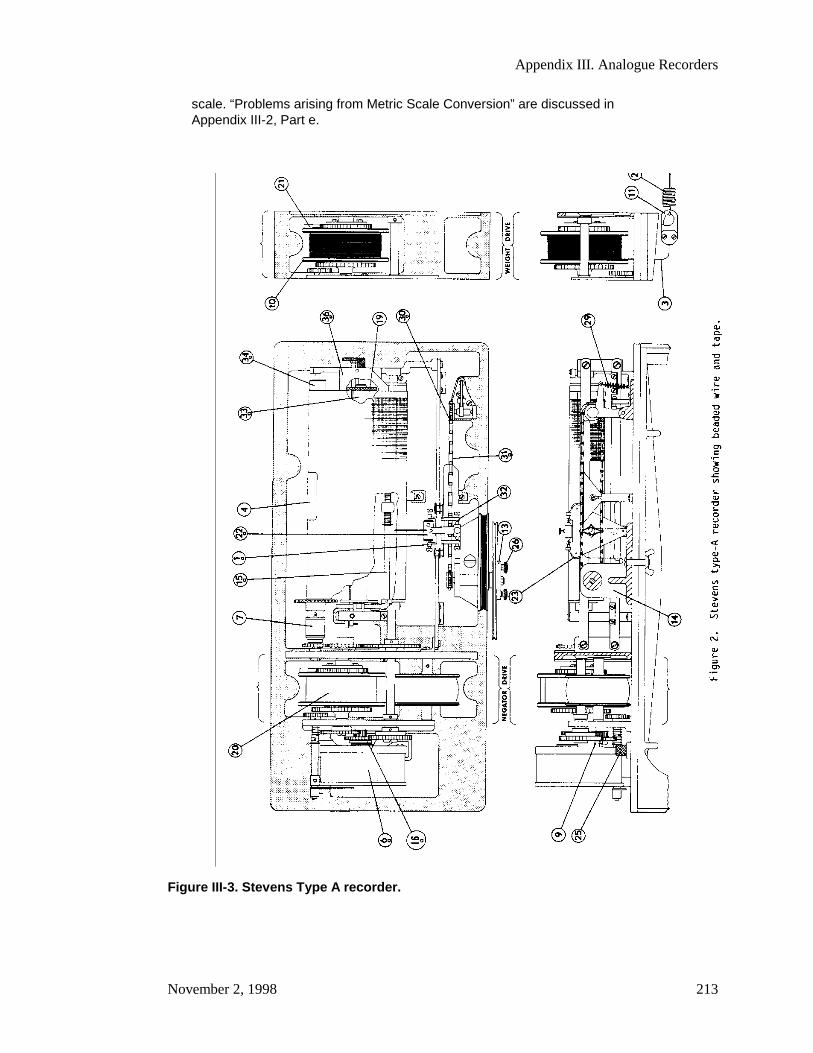
Appendix III. Analogue Recorders
November 2, 1998 213
scale. “Problems arising from Metric Scale Conversion” are discussed inAppendix III-2, Part e.
Figure III-3. Stevens Type A recorder.

Standard Operating Procedures for Hydrometric Surveys
214 November 2, 1998
b) Clockwork and Float Pulley Movement
The recorder requires two independent forces to establish the gauge height referenced totime. These forces are created by a clockwork (6) and a float counterweight (13).
Force is needed for the friction system to advance the strip chart. The force is regulatedby a clockwork which advances the paper in precise relation to time, using a suspendedweight, spring tension and electric motor or electronic timer.
Force is also needed so that the drive sprocket can produce motion in the continuouschain attached to the carriage and stylus. This power is generated through variation in thevertical movement of a float resting on a water surface. This movement is transferredthrough a flexible wire or tape, called a float line, which passes over the float pulley(13). It connects the float at one end and a counterweight at the other.
c) Clocks
A mechanical, electrical, or electronic clock regulates the rate that a strip chart travels indirect relation to the stylus trace of the water level. The accuracy of the stylus tracedepends on the accurate regulation of the speed at which the chart travels.
The mechanical clock is the most common regulator used. It can accurately regulate aconstant power source, but variations in the amount of power supplied will affect theaccuracy of regulation. If the weight becomes submerged, the effective weight is reducedand so is the accuracy of the clock regulator. The operating duration of a mechanicalclock depends upon the method used to provide the power. A weight-driven clockoperates as long as the gravitational force generated by the driving weight remains ineffect. A weight fall of 8 m powers the recorder chart drive for approximately 4.5months. The weight fall distance can be reduced through a combination of sheaves andby increasing the weight.
Figure III-4 illustrates several sheaf combinations.
Electronic clocks are DC-powered regulators which provide constant, precisely timedimpulses of torque to power the travel of the strip chart. Rate of advance may be selectedin multiples of 1.2 inches/day.
Electric clock regulators are AC-powered. They advance the strip chart in the samefashion as the electronic regulator; they depend on the quality and reliability of powerfrom a commercial source.
Mechanical, electronic, and electric clock regulators which mount directly on the Type Arecorder are interchangeable between recorders.
The clock is a precision instrument that requires careful handling and attention to detail.A more detailed explanation of clock drive systems, operation, removal, servicing, andre-installation is provided in Appendix III-4.
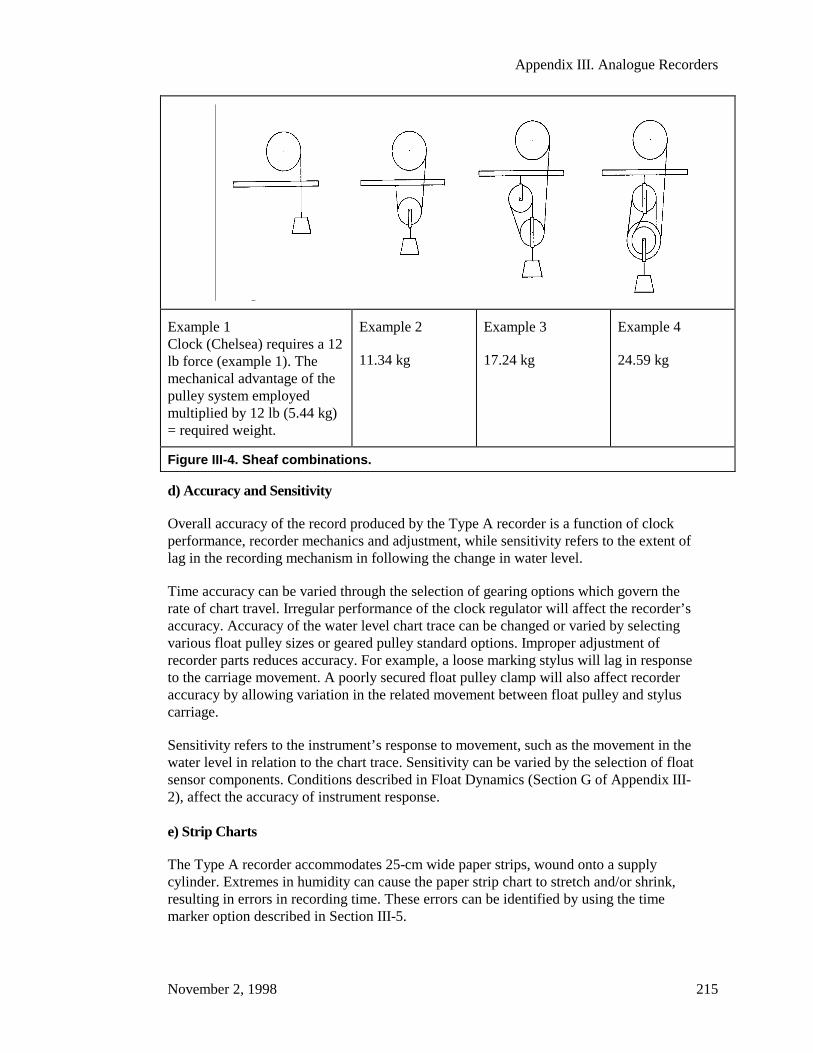
Appendix III. Analogue Recorders
November 2, 1998 215
Example 1Clock (Chelsea) requires a 12lb force (example 1). Themechanical advantage of thepulley system employedmultiplied by 12 lb (5.44 kg)= required weight.
Example 2
11.34 kg
Example 3
17.24 kg
Example 4
24.59 kg
Figure III-4. Sheaf combinations.
d) Accuracy and Sensitivity
Overall accuracy of the record produced by the Type A recorder is a function of clockperformance, recorder mechanics and adjustment, while sensitivity refers to the extent oflag in the recording mechanism in following the change in water level.
Time accuracy can be varied through the selection of gearing options which govern therate of chart travel. Irregular performance of the clock regulator will affect the recorder’saccuracy. Accuracy of the water level chart trace can be changed or varied by selectingvarious float pulley sizes or geared pulley standard options. Improper adjustment ofrecorder parts reduces accuracy. For example, a loose marking stylus will lag in responseto the carriage movement. A poorly secured float pulley clamp will also affect recorderaccuracy by allowing variation in the related movement between float pulley and styluscarriage.
Sensitivity refers to the instrument’s response to movement, such as the movement in thewater level in relation to the chart trace. Sensitivity can be varied by the selection of floatsensor components. Conditions described in Float Dynamics (Section G of Appendix III-2), affect the accuracy of instrument response.
e) Strip Charts
The Type A recorder accommodates 25-cm wide paper strips, wound onto a supplycylinder. Extremes in humidity can cause the paper strip chart to stretch and/or shrink,resulting in errors in recording time. These errors can be identified by using the timemarker option described in Section III-5.
Standard Operating Procedures for Hydrometric Surveys
216 November 2, 1998
Note: Problems Arising from Metric Scale Conversion
The Governments of Canada and British Columbia transformed its system ofweights and measures from the Imperial or English system to the SI system ofunits in 1977. All official government water measurements conducted since thenhave been done in the new system.
When Water Survey of Canada converted from Imperial to metric measure, allexisting A-35 (Figure III-5) and A-71 recorders on their inventory underwent ‘inhouse’ mechanical change in addition to the stage scale metric conversionsupplied by the manufacturer. The change included the machining of the chartdrive rollers so that the chart rate of travel would be 60 mm per 24 hours,matching a Canadian manufacturers chart paper scale, these chart rolls aredesignated MA25 (Figure III-5). Such recorders are identified by a readily visibleMMETRICO sticker and an ‘M’ stamped permanently into the end of the frictionroller.
Provincial government and other agencies continue to use the time scaleprovided by the factory which is 60.96 mm (2.4” ) per 24 hours (Figure III-6), and,the equivalent chart time scale paper. These chart rolls, with metric horizontalgraduations are designated A25 by the manufacturer, Leupold & Stevens, Inc.
Note: Using a 60 mm per day chart on a standard Steven’s metric recorder willproduce an accumulating time scale error of -23.5 minutes per day.
The A-71 is available in a choice of metric or Imperial units of measure. Be surethat any recorder received from a supplier provides the proper unit of stagemeasure.
Errors in recording water level occur when the strip chart shifts out of precise alignmentas it travels from the supply cylinder to the take-up cylinder. Identify this error by a markon the chart trace referenced at periodic intervals to actual water level. Minimize thiserror by carefully aligning the chart travel each time a chart is attached to the take-upcylinder. Errors in the water level trace may be significant, especially for deep stillingwells.
If the chart travels 60 (60.96) mm/day, the supply roll will last for approximately 400days.
The time scale is marked in hourly divisions with a bold solid line every 24 hours. Abold dashed line identifies 1200 hours and the light dashed lines identify the hours 0600and 1800 (Figure III-5).
Note: As the end of the chart supply approaches, a diagonal line appears on thechart indicating how many days remain in the chart supply. To determine thenumber of days remaining in the chart supply, multiply the distance (cm) betweenthe diagonal line and the left border of the chart by 4. For example, if the timescale is 60 mm per day, and the distance from the left border to the diagonal lineis 11.5 cm, there are about 46 days of chart paper remaining: 11.5 cm * 4days/cm = 46 days.

Appendix III. Analogue Recorders
November 2, 1998 217
Figure III-5. Graphic controls of Canada Ltd. Strip chart (60 mm/day) specified byEnvironment Canada.
Figure III-6. Stevens strip chart (60.96 mm/day).
The water level scale depends on gearing used to drive the stylus across the strip chart,which in turn depends on expected water level change and the recording sensitivity. Themost common chart scale used in British Columbia is 1 cm (chart) to 5 cm (water level).The water level scale is marked at 2-mm divisions with bold lines at 1-cm intervals. A350-mm circumference float pulley produces a scale of 1:5.
For flash flooding or tidal effect, a less sensitive scale may by used. For a scalerelationship of 1 cm (chart) to 10 cm (water level), the water level scale is marked at 2-mm divisions with bold lines at 2-cm intervals. Heavier lines accent the 10-cm intervals(Figure III-7). A 750-mm circumference float pulley produces a water level chart scale of1:10.
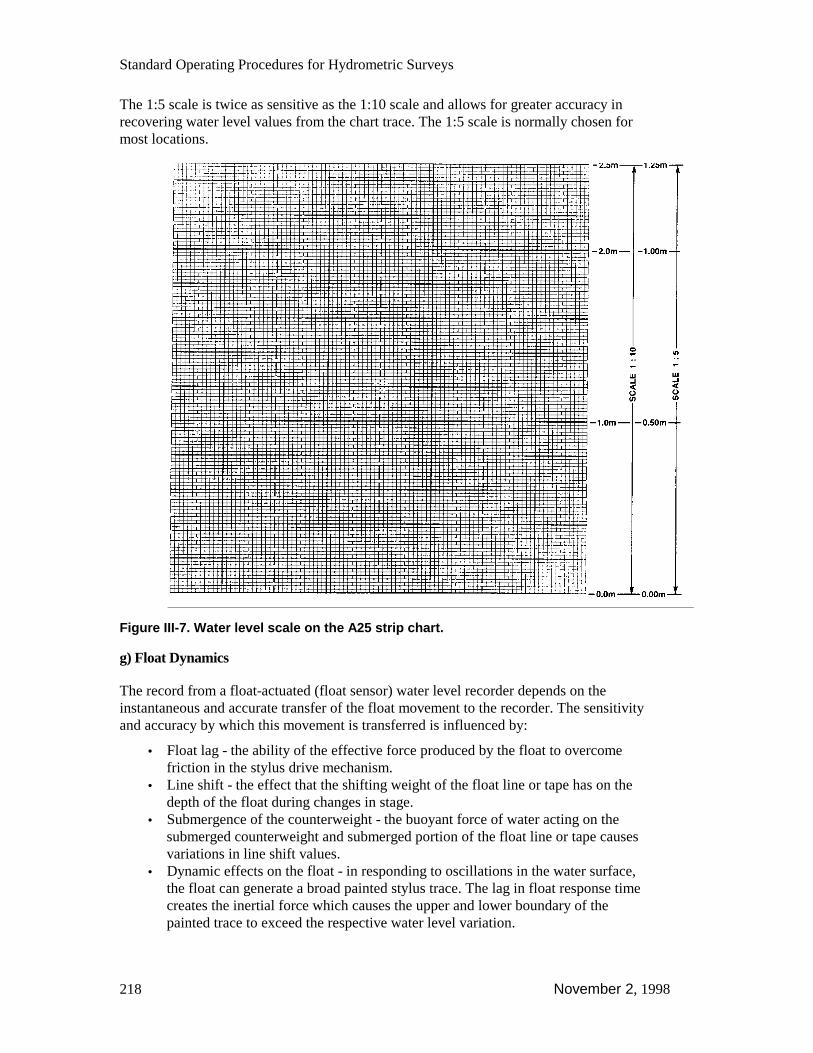
Standard Operating Procedures for Hydrometric Surveys
218 November 2, 1998
The 1:5 scale is twice as sensitive as the 1:10 scale and allows for greater accuracy inrecovering water level values from the chart trace. The 1:5 scale is normally chosen formost locations.
Figure III-7. Water level scale on the A25 strip chart.
g) Float Dynamics
The record from a float-actuated (float sensor) water level recorder depends on theinstantaneous and accurate transfer of the float movement to the recorder. The sensitivityand accuracy by which this movement is transferred is influenced by:
• Float lag - the ability of the effective force produced by the float to overcomefriction in the stylus drive mechanism.
• Line shift - the effect that the shifting weight of the float line or tape has on thedepth of the float during changes in stage.
• Submergence of the counterweight - the buoyant force of water acting on thesubmerged counterweight and submerged portion of the float line or tape causesvariations in line shift values.
• Dynamic effects on the float - in responding to oscillations in the water surface,the float can generate a broad painted stylus trace. The lag in float response timecreates the inertial force which causes the upper and lower boundary of thepainted trace to exceed the respective water level variation.
Appendix III. Analogue Recorders
November 2, 1998 219
To ensure accurate rotation of the float pulley in relation to the float movement, slippagebetween the float line and pulley must be prevented by using either beaded wire orperforated invar-steel tape.
h) Installation
The proper installation and set-up of the Type A analogue recorder is critical. Anyoversights will lead to measurement errors and failure of the operation. Therefore,careful attention should be given to all the following installation details:
1. Unpack the recorder at the instrument shelter.
2. Drill holes in the recorder shelf and in shelter floor to pass through the float line.Also drill a hole for the clock-weight line if the clock is weight driven. Label theholes “float” and “counterweight”. The recorder manufacturer provides a templatefor positioning the holes.
3. Position the recorder on the shelf. Level it using the adjustable legs. Screw the legsto the shelf so that the recorder can not move.
4. Install the float pulley by removing the hex nut on the front of the standard,unscrewing the retaining clamp and removing the washer. Place the float pulley (orsprocket if the recorder is actuated by a pressure sensor) on the shaft so that the flatside is to the recorder. Next, replace the washer, screw the retaining clamp on, andsecurely tighten the hex nut.
5. Pass the beaded cable through the holes in the shelf and floor, then attach the endhook for the float. Normally the float is on the left side of the pulley standard. If abeaded cable is used as a float line, position one bead so that it bears on the end hookclamp; this prevents slipping. Do not kink or tangle the beaded wire or tape.
6. To determine the correct line length, connect the counterweight and lower theassembly to the well bottom. Pass the tape line over the pulley and attach the float tothe tape line at the point of maximum possible travel. Ensure that the counterweightfalls freely to the minimum water level. The float and counterweight should passeach other without touching any obstructions in the well. Guide sheaves may have tobe installed to achieve this. For example, guide sheaves must be used when a 250-mm (10-inch diameter) float is installed on a recorder with a 1254 m diameter pulleywheel.
7. To install a new chart roll, detach the writing table (Figure III-3 (36)) and remove thesupply roll (Figure III-3 (33)). Next, remove the knurled washernut (Figure III-3(19)) from the end opposite the flange and remove the old core. Put the new chartpaper on the supply cylinder with the end flush against the flange. Next, tighten thewashernut so that the supply roll can not slip off the cylinder. Place the supply roll inits bearings with the flange to the left. Once the supply cylinder is in place, connectthe chart paper to the drive roller. To do this, make a right-angle crease in the paperabout 20 mm from the end. Feed the end of the paper underneath the drive roller sothat it passes between the drive roller and the friction rollers.Using the spring clamp, attach the end of the chart to the take-up roller. Roll somechart paper onto the take-up roller. Hold it taut to ensure that the paper is trackingsquarely.
8. Fill the recorder pen reservoir carefully, using the eyedropper provided. Do not fill itcompletely because ink expands in hot weather. Ink splashed on the pen carriage or
Standard Operating Procedures for Hydrometric Surveys
220 November 2, 1998
the rails of the pen carriage may cause sticking. If the ink does not flow freely, coverthe small breather hole with a finger and ‘pump’ on the fill hole with another finger.If this does not work, blow carefully on the fill hole until a small drop of ink appearsat the end of the pen. Clean the bore of the pen with the fine wire provided for thispurpose.
9. Check that the pen reversal mechanism operates properly by rotating the float pulley.Using the knurled nut on the pen holder, adjust the pen position so that the reversalpoints fall on the margins of the paper. Set the pen so that it is in direct drive. Thiswill permit the pen to move laterally across the width of the chart at a right angle tothe direction of chart feed. The pen will respond accurately during a rise in stagewithin the well. When the pen is set correctly, clamp the float pulley to the shaft bysimultaneously turning the two knurled nuts on the clamp in opposite directions. It isuseful to write the gauge reading of each paper margin on the edge of the metalwriting table, and to set the left margin of the paper at an exact metre reading. Thesereadings will change when the pen is reset.
10. For weight-driven recorders, guide the weight cable onto the drum so that it does notoverlap. Wind the weight up to the floor of the instrument shelter so that thesuspension spring is above the surface of the hole in the floor. Remove the clock andunwind enough cable to pass through the hole in the floor. Reinstall the clockcarefully to ensure that the wide flange of the rear clock hold-down nut depresses thelocking level.
11. To start the recorder clock, screw the crank handle into the end of the winding shaft.Wind the crank clockwise for weight-drive clocks and counter-clockwise for negator-spring drives. In the case of negator-spring drives, the crank must be pushed in toengage the winding mechanism; wind the spring until the warning mark (STOP) onthe spring appears. Do not wind the spring to its entire extent because the clock willnot operate. After winding the negator-spring clock, ensure that the pawl isdisengaged from the ratchet. The winding shaft should be pushed out by a spring sothat the pawl rides on the second uncut ratchet. Ensure that the winding gear isdisengaged by observing it from the front of the recorder. Never attempt to wind anegator spring when the clock has been removed. To start an electric clock, simplyplug it into a 115 V, 60 Hz electrical source.
12. To set the time clock, remove the tension on the paper take-up roller by pulling outthe knurled disc on the right side of the recorder and rotating it in a direction awayfrom the recorder. To take-up the slack in the paper, roll the chart to a time slot justshort of the correct setting and push the disc back in. The chart may then be rolled tothe correct time setting.
13. Rotate the float pulley enough to make an identifiable mark (about 10-mm long).Draw a line from the pen trace to a position over the small metal writing table underthe chart. Make the appropriate notations on the chart as shown in Figure III-8).
Note: Instrument Transportation
The transfer of recorders and other instruments by public transport is a routinerequirement that requires attention to detail. Before any shipments take place themanufacturer thoroughly bench-tests its recorders and adjusts the matchingclock to ensure that the chart speed is accurate. The shipping carton containsseparate packages for the float. float pulley, float tape or cable. connectors andcounterweight. It may also contain ink, oil, pencils and chart paper. Other partsand accessories may also be individually wrapped. Any manufacturer’s shipment
Appendix III. Analogue Recorders
November 2, 1998 221
should contain instrument’s ‘Instruction Manual’, which contains the packing list.Check the packing list to ensure that all items are accounted for and that therecorder serial number corresponds.
A factory-delivered recorder has all moving parts secured with twine. Removethis twine and any pieces of packing material. Refer to the ‘Instruction Manual’ toensure that the recorder is complete and operative. If possible. test the recorderfor a few days before placing it at the data collection site. When you are sure thatthe recorder is complete and in working order, it is then ready for field installation.
Instruments often require shipment, whether it is to a site, returning to the dealerfor service, and due care must be exercised to avoid damage and the resultingdowntime or other inconvenience. The procedure is as follows:
• Secure all the moving parts, elastic bands are as effective and easier to applythan twine, tape may cause other trouble and is not recommended
• Repackage it in the same way it was received
• Make sure that the clock winding handle and the float pulley assembly are intact
• If the recorder uses a weight-driven clock assembly, include the clock weightand spring
• Add ink or pen cartridges and a fresh strip chart to the package.
On the sealed shipping carton, clearly mark ‘Prepared for Installation’ and notethe type of clock drive (weight or negator spring). Attach a complete list ofcontents to help identify what additional components are needed before installingthe recorder on site.
Appendix III-4. Clock Removal and Servicinga) Servicing
Clock servicing or replacement is important to the operation of a hydrometric stationequipped with a mechanical recorder. The following instructions are intended tominimize the problems which can be anticipated:
1. Remove a clock by screwing the winding handle into position.
2. Push the winding shaft and wind it until the safety pawl drops into the engagedposition. If the safety pawl is not engaged, the weight-drive cable or negator springwill unwind uncontrollably, creating a serious hazard.
3. Remove the screws securing the clock to the recorder base. Slide out the clock, beingcareful not to disturb the safety pawl. Do not turn the winding handle when the clockis removed. Turning the winding handle releases the safety pawl which will result inthe uncontrolled unwinding of the negator spring.
4. Remount the clock, slip the clock base over the stud on the recorder base at themounting location. Wind the recorder drive to position the pins on the recorder timegear so they can enter the clock-drive bar slots. Slide the clock into position. Do notrelease the tension on the winding handle until the clock is in position. Install themounting screws first. then disengage the safety pawl.
5. Regulate the clock timing mechanism to correct for time error noted during the justconcluded time period by winding the recorder drive to engage the safety pawl, thenunscrew the back cover of the clock to expose the time adjusting nut and rotate the
Standard Operating Procedures for Hydrometric Surveys
222 November 2, 1998
knurled adjusting nut (a one quarter turn left will slow the clock by approximately 30seconds per day).Note: Mark mechanical clocks with permanent identification and keep aperformance and servicing record for each clock. Clean and oil the clock at leastonce every two years using a qualified clock repair service. Clocks operating atcold temperatures should be lubricated with “Moebius Syntalube Arctic” lubricantand be identified as ‘winterized.’ (Clock serial # is engraved on inner backingplate.)
AC Power Electric Clocks are used only where AC power is available. Accuracy dependson the continuity of 60 cycle AC power. If the power varies from 60 cycles or ismomentarily interrupted, the accuracy of the chart is affected. It is difficult to identifythese inaccuracies on the chart trace. Longer power interruptions often occur duringperiods when the data record is in increased demand. To remove and remount the electricclock requires no special precautions. Simply disconnect the power. unscrew the basemount. and slide the clock free. Reverse the procedure to remount. making sure the pinson the recorder time gear are engaged with the clock-drive bar slots.
The Quartz Timer regulator (DC electronic clock) requires a supply of the specified DCpower. The duration and accuracy of continuous operation depend on the quality of theelectronics and power supply continuity. Removal and remount are performed the sameway with the electric clock. No special precautions are necessary. Connecting the powersupply immediately activates the regulated chart travel. Follow manufacturer’sinstructions for selecting the proper time scale and ensure that specified voltages are notexceeded.
b) Negator-Spring Drive
A negator-spring drive (Figure III-9) is a power source used to drive the recorder chart. Itconsists of a length of spring-steel strap secured at one end to a storage drum. andsecured at the other end to a winding drum. When the spring strap is forcefully wound tothe winding drum, it stores energy. When the energy is released under the control of theclock regulator. the spring strap returns to the storage drum. Negator springs aredesigned to release a constant level of power for periods of 4.5 or 6 months as specifiedon the order.
The negator-spring drive is compact and fits neatly within the recorder cover. It allowsfor the use of the Type-A recorder where a weight drive is not possible or practical. Aweight-drive recorder can be converted to a negator drive recorder fairly easily.Unfortunately, the negator drive can cause serious injury and must be handled withcaution. The uncontrolled unwinding of a negator spring can be a frightening experience.It can also cause serious injury to the technician and damage to the recorder. If for anyreason the negator spring must be unwound, carefully follow these procedures:
1. Remove the mechanical clock as directed in Section Clock Removal & Servicing.
2. Remove the chart from the take-up cylinder.
3. Remove the writing plate and chart supply roll.
4. Grasp the chart-drive cylinder (the larger cylinder in front) firmly with the righthand.
5. Rotate the cylinder towards you slightly to remove tension on the safety pawl.
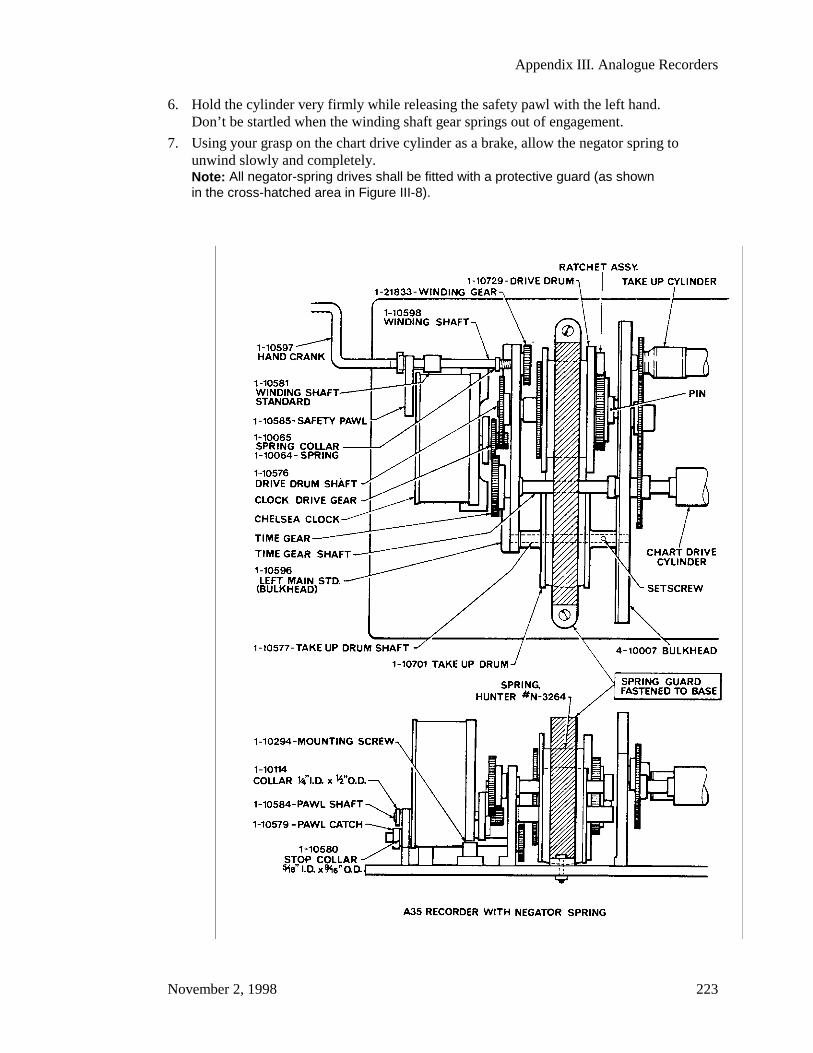
Appendix III. Analogue Recorders
November 2, 1998 223
6. Hold the cylinder very firmly while releasing the safety pawl with the left hand.Don’t be startled when the winding shaft gear springs out of engagement.
7. Using your grasp on the chart drive cylinder as a brake, allow the negator spring tounwind slowly and completely.Note: All negator-spring drives shall be fitted with a protective guard (as shownin the cross-hatched area in Figure III-8).
Standard Operating Procedures for Hydrometric Surveys
224 November 2, 1998
Figure III-8. Negator spring drive
Appendix III-5. Recorder Options and Accessoriesa) Options
Type-A Recorder:
• negator-spring drive• weight drive• electric synchronous motor drive• electronic regulator
Marking Stylus:
• liquid ink reservoir• felt tip pen (requires special mounting bracket)
Float Pulley:
• beaded wire• tape• pulley circumference 375 mm - chart scale 1.25 m (standard)• pulley circumference 750 mm - chart scale 2.50 m
Float Pulley Standard:
• gear equipped to provide specified chart scales• 0.25 m• 0.5 m• 5.00 m• 6.25 m• 12.50 m
Time Scale:
• 60.96 mm (2.4’’) per day standard. (Graphic Controls of Canada Ltd. 60 mm perday)
• gearing options depend on type of chart drive
b) Accessories
Time Marker (Figure III-9): With this accessory, an auxiliary pen makes a jog at certainelapsed time intervals by marking in the left margin of the chart. The action is controlledby the clock so that the jogs correspond to clock time and not to time divisions on thechart. These jogs serve as a basis for applying corrections to the graph for possible errorsdue to humidity effects. Under standard humidity conditions, these jogs are at 60.96 mmintervals. An adjustable actuating ring allows for the initial synchronization of the jogs(DC electronic clock) requires a with the major chart divisions.

Appendix III. Analogue Recorders
November 2, 1998 225
The time marker accessory can be purchased as a separate accessory for installation inthe field.
It mounts on the front of the left writing plate standard and is held by one screw andpositioned by a pin.
The actuator ring fits over the hub of the idler gear, with the slanted portion of theactuating tab situated on the side toward the chart.
Reversal Indicator (Figure III-10): This accessory eliminates possible confusion wheninterpreting graphs with reversals the margin. The indicator makes a continuous pen linein the right margin of the chart. When a stylus reversal occurs while the stage is stillchanging in the same direction, a jog is made in the line. This mark distinguishes a stylusreversal from a stage reversal. Short jogs in the pen line are made when the sprocketrotates clockwise, and long jogs appear when it rotates counterclockwise. The reversalindicator can be purchased as a separate accessory for installation in the field. It mountson the right standard just to the rear of the tracks.
It is positioned by a pin and held in place by a screw and nut. The relative lengths of theink-line jogs can be adjusted by loosening the lower set screw on the tripper arm hub androtating the hub slightly. The chain must have three operating pins, one for the styluscarriage and two for the reversal indicator. For recorders made prior to January 1969, itis necessary to purchase a new chain with the three operating pins.
Figure III-9. Recorder chart elapsed timemarker
Figure III-10. Marking stylus reversalindicator
Appendix III-6. Recorder Dismantling and Reassemblya) Partial Dismantling
Once you are familiar with the recorder in a friendly environment, on-site installationand servicing can be accomplished with greater confidence and ease.
Standard Operating Procedures for Hydrometric Surveys
226 November 2, 1998
Pen Carriage Assembly: (Assume the float pulley is engaged with the float cable ortape.) Mark the position of the upper guide rail before proceeding with the pen carriageassembly removal. To remove, disengage the pulley clamp by loosening the two knurledset screws. This allows free movement of the pen carriage assembly. Move the carriageto the centre and disengage the pin on the drive chain from the diamond-shaped slot atthe back of the carriage. Next, move the carriage to the extreme right of the guide railsand loosen the screw that secures the right end of the upper guide rail. The end of theguide rail may now be pushed slightly downward to free the carriage rollers from therails. Gently lift out the pen carriage. The drive chain may now be removed by slightlylifting the lever which applies spring tension to the right hand sprocket assembly.Disengage the chain from this sprocket and then the left sprocket. Remove the chain bylifting it up or sliding it out to the right along the recorder base.
b) Reassembly
Reverse the above procedure. When securing the upper guide rail. run the pen carriageonce or twice along the rails to ensure there is no restriction of movement and that therollers will not disengage.
Float Pulley: Standard: After removing the pen carriage and drive chain, remove thefloat pulley standard by unscrewing the wing nut under the recorder base and liftingupward on the standard. A gentle tap may be required to loosen it from the mountingalignment studs hidden under its base. Align the base with the mounting studs. press itfirmly in place, and replace the securing wing nut.
Note: How to Release Negator-Spring Tension
Refer to section b, ‘Negator-Spring of Appendix III-4 and follow the proceduredescribed for unwinding. USE CAUTION.
c) Time Scale Gearing
Provides a wide choice of chart travel rate (Figure III-11).
Individual gears are stamped with a number identifying the number of gear teeth. Theymay be used in combinations to provide the desired chart travel speed as shown in FigureIII-11.
Have one or more examples of gear combinations on hand for demonstration purposes.Demonstrate the proper tolerance of gear mesh. At room temperature, a slight movementof the gears should be noticed.
Before removing any gears ensure that the clock regulator is removed. If a negator springor clock-drive weight is used, they should be removed. It is not enough to simply havethe safety pawl engaged.
The gears are held in place by a slotted cap screw threaded to the end of the drivingshaft. For removal, simply detach the cap screw and slide the gears free. Uponreassembly or gear exchange, be certain to put all washers and shims in the proper order.Ensure that all gears are properly aligned and fully meshed. Test the recorder to makesure that the desired chart speed has been attained. Tie together, package, and properlyidentify all unused gearing combinations.
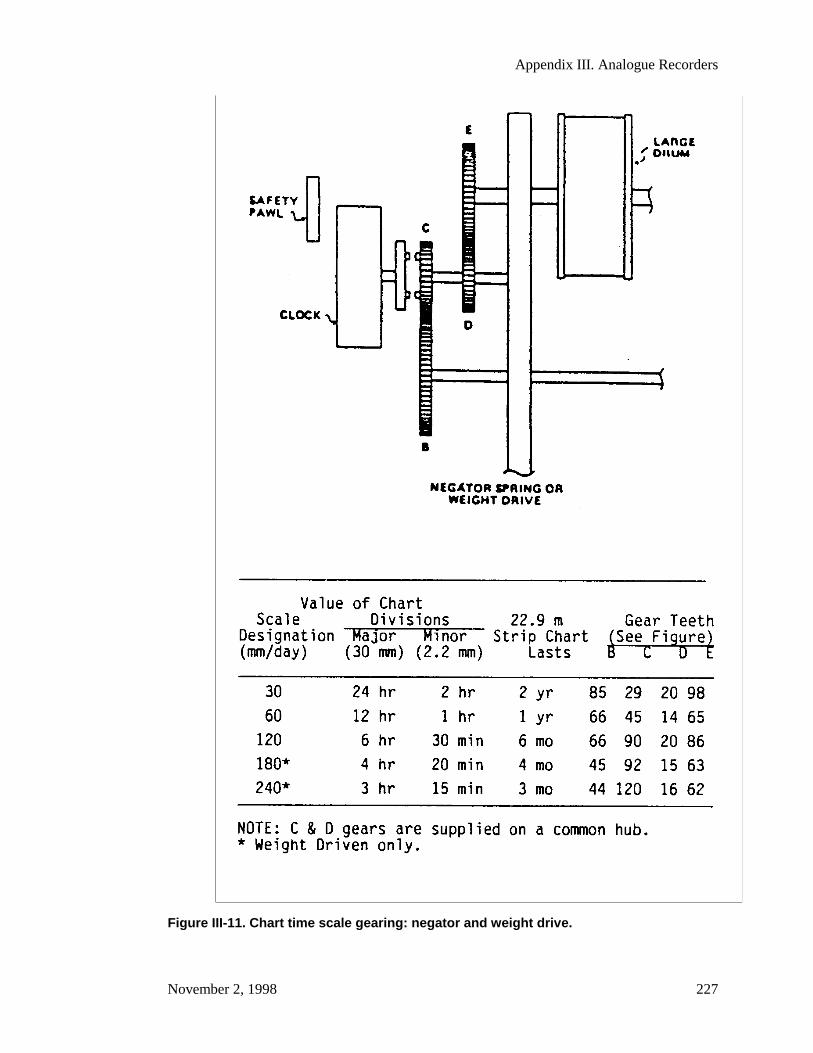
Appendix III. Analogue Recorders
November 2, 1998 227
Figure III-11. Chart time scale gearing: negator and weight drive.

Standard Operating Procedures for Hydrometric Surveys
228 November 2, 1998
d) Recorder Servicing
Service the recorder on each visit to the gauging station and remove the chart every fourto six weeks. Service the recorder immediately upon arriving at a site, then inspect itagain before leaving to ensure that the instrument is operating and that no mistakes havebeen made. The steps in servicing are:
1. Visually inspect the recorder installation to determine whether any malfunction ordamage has occurred. If the recorder clock has stopped, roll the chart forward beforedoing anything else. The vertical line at the end of the trace will show the range instage during the stoppage.
2. Read the manual gauges and annotate the chart, as described in step (12) in theprevious section on Installation. Observe the left side of the take-up roll to see if any‘coning’ of the paper has taken place. Do not reset the pen or advance the chartunless the record will be computed manually.
3. Flush the intake system by closing the appropriate valve(s) and by filling the flushtank with water from the well. Observe the change in water level and the recoveryrate when the valve(s) are reopened. If the water level in the well is slow to recover,more flushing may be required or repairs to the intake may be necessary. Intakesleading to a silty stream should be flushed on every visit.
4. Check the performance of any accessories in use, such as the reversal indicator,event marker, rain gauge or thermograph.
5. If the chart is to be removed, prepare to remove it by releasing the tension from thepaper take-up roller. The roller tension is controlled by the knurled disc on the rightside of the recorder. Pull the disc out and rotate it away from the recorder. Roll thechart forward so that there is about 100 mm of blank chart paper between the end ofthe record and the closest edge of the metal writing table. Cut off the chart paper atthe front of the writing table. Do this with a pencil point or similar blunt object toavoid cutting the writing table below. Knife marks or other scratches on the tablewill soon cause the table to rust and stick to the chart.
6. Now remove the chart from the take-up roller by unwinding it while the take-uproller is still in its receptacle. Unwinding the chart has two advantages over thesliding-twist method of removing the chart. It prevents the chart from binding on thetake-up roller and allows the technician to inspect the entire record obtained sincethe chart was last removed. Defects in the record, caused by a sticking float, pressuresystem malfunctions or other problems will be apparent on the chart. Correctiveaction may be taken before leaving the site.
7. Determine whether enough chart paper is available for use until the next plannedvisit to the station. Extra paper should be included for a margin of safety. Each smalldivision (2 mm) between the warning line and the edge of the chart indicates that aone-day supply of paper will be available at the conventional chart speed.
8. If it is necessary to install a new chart roll, detach the writing table and remove thesupply roll. Next, remove the knurled washer nut from the end opposite the flangeand remove the old core. Put the new chart paper on the supply cylinder with the endflush against the flange. Next, tighten the washer nut so that the supply roll can notslip off the cylinder. The supply roll may then be placed in its bearings with theflange to the left. Once the supply cylinder is in place. The chart paper can beconnected to the drive roller. To do this, make a right-angle crease in the paper about
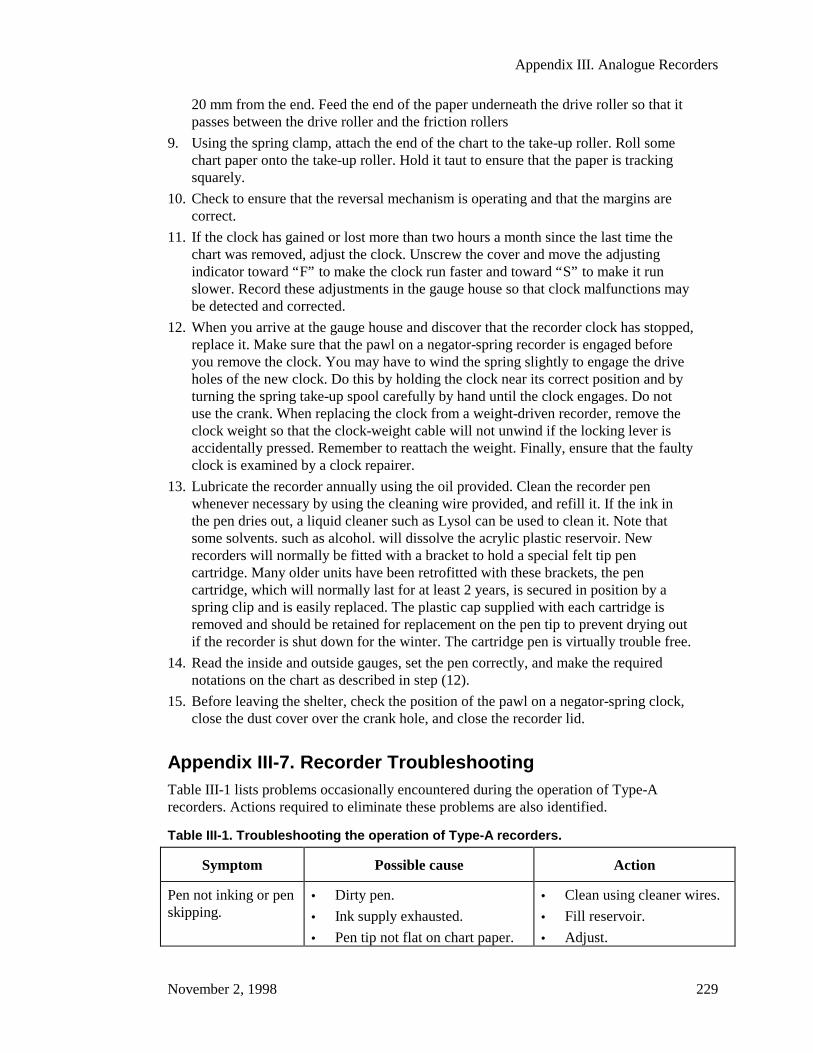
Appendix III. Analogue Recorders
November 2, 1998 229
20 mm from the end. Feed the end of the paper underneath the drive roller so that itpasses between the drive roller and the friction rollers
9. Using the spring clamp, attach the end of the chart to the take-up roller. Roll somechart paper onto the take-up roller. Hold it taut to ensure that the paper is trackingsquarely.
10. Check to ensure that the reversal mechanism is operating and that the margins arecorrect.
11. If the clock has gained or lost more than two hours a month since the last time thechart was removed, adjust the clock. Unscrew the cover and move the adjustingindicator toward “F” to make the clock run faster and toward “S” to make it runslower. Record these adjustments in the gauge house so that clock malfunctions maybe detected and corrected.
12. When you arrive at the gauge house and discover that the recorder clock has stopped,replace it. Make sure that the pawl on a negator-spring recorder is engaged beforeyou remove the clock. You may have to wind the spring slightly to engage the driveholes of the new clock. Do this by holding the clock near its correct position and byturning the spring take-up spool carefully by hand until the clock engages. Do notuse the crank. When replacing the clock from a weight-driven recorder, remove theclock weight so that the clock-weight cable will not unwind if the locking lever isaccidentally pressed. Remember to reattach the weight. Finally, ensure that the faultyclock is examined by a clock repairer.
13. Lubricate the recorder annually using the oil provided. Clean the recorder penwhenever necessary by using the cleaning wire provided, and refill it. If the ink inthe pen dries out, a liquid cleaner such as Lysol can be used to clean it. Note thatsome solvents. such as alcohol. will dissolve the acrylic plastic reservoir. Newrecorders will normally be fitted with a bracket to hold a special felt tip pencartridge. Many older units have been retrofitted with these brackets, the pencartridge, which will normally last for at least 2 years, is secured in position by aspring clip and is easily replaced. The plastic cap supplied with each cartridge isremoved and should be retained for replacement on the pen tip to prevent drying outif the recorder is shut down for the winter. The cartridge pen is virtually trouble free.
14. Read the inside and outside gauges, set the pen correctly, and make the requirednotations on the chart as described in step (12).
15. Before leaving the shelter, check the position of the pawl on a negator-spring clock,close the dust cover over the crank hole, and close the recorder lid.
Appendix III-7. Recorder TroubleshootingTable III-1 lists problems occasionally encountered during the operation of Type-Arecorders. Actions required to eliminate these problems are also identified.
Table III-1. Troubleshooting the operation of Type-A recorders.
Symptom Possible cause Action
Pen not inking or penskipping.
• Dirty pen.
• Ink supply exhausted.
• Pen tip not flat on chart paper.
• Clean using cleaner wires.
• Fill reservoir.
• Adjust.
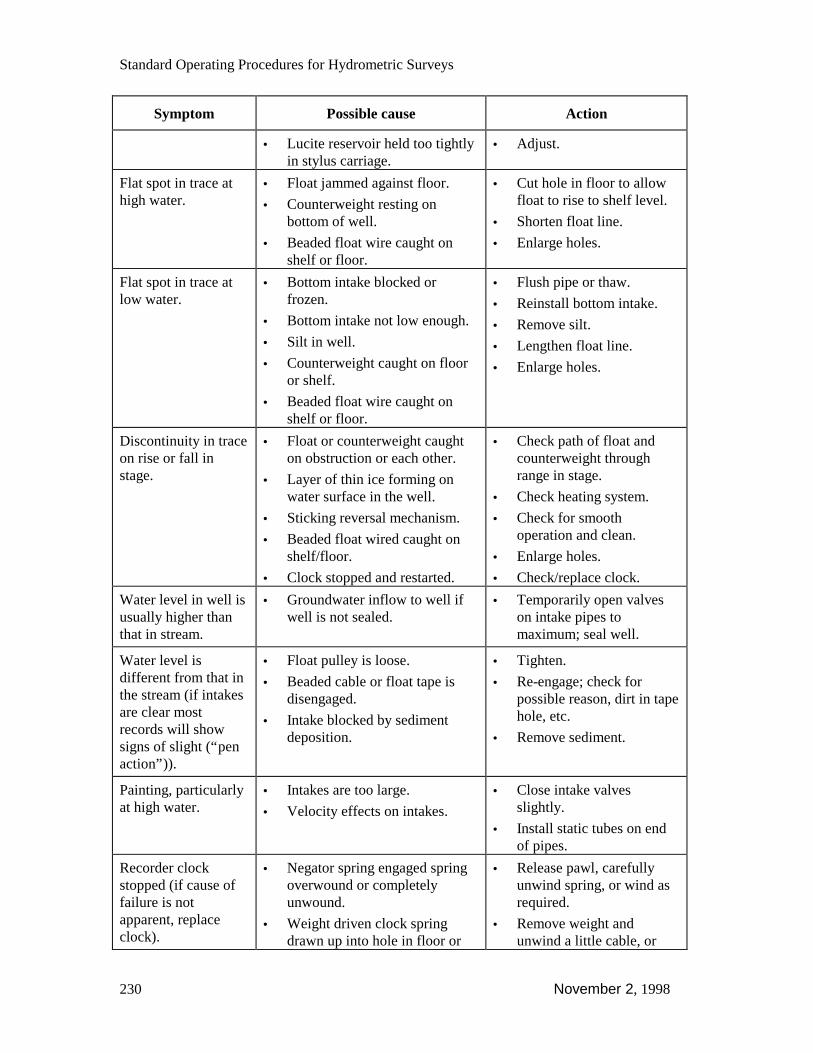
Standard Operating Procedures for Hydrometric Surveys
230 November 2, 1998
Symptom Possible cause Action
• Lucite reservoir held too tightlyin stylus carriage.
• Adjust.
Flat spot in trace athigh water.
• Float jammed against floor.
• Counterweight resting onbottom of well.
• Beaded float wire caught onshelf or floor.
• Cut hole in floor to allowfloat to rise to shelf level.
• Shorten float line.
• Enlarge holes.
Flat spot in trace atlow water.
• Bottom intake blocked orfrozen.
• Bottom intake not low enough.
• Silt in well.
• Counterweight caught on flooror shelf.
• Beaded float wire caught onshelf or floor.
• Flush pipe or thaw.
• Reinstall bottom intake.
• Remove silt.
• Lengthen float line.
• Enlarge holes.
Discontinuity in traceon rise or fall instage.
• Float or counterweight caughton obstruction or each other.
• Layer of thin ice forming onwater surface in the well.
• Sticking reversal mechanism.
• Beaded float wired caught onshelf/floor.
• Clock stopped and restarted.
• Check path of float andcounterweight throughrange in stage.
• Check heating system.
• Check for smoothoperation and clean.
• Enlarge holes.
• Check/replace clock.
Water level in well isusually higher thanthat in stream.
• Groundwater inflow to well ifwell is not sealed.
• Temporarily open valveson intake pipes tomaximum; seal well.
Water level isdifferent from that inthe stream (if intakesare clear mostrecords will showsigns of slight (“penaction”)).
• Float pulley is loose.
• Beaded cable or float tape isdisengaged.
• Intake blocked by sedimentdeposition.
• Tighten.
• Re-engage; check forpossible reason, dirt in tapehole, etc.
• Remove sediment.
Painting, particularlyat high water.
• Intakes are too large.
• Velocity effects on intakes.
• Close intake valvesslightly.
• Install static tubes on endof pipes.
Recorder clockstopped (if cause offailure is notapparent, replaceclock).
• Negator spring engaged springoverwound or completelyunwound.
• Weight driven clock springdrawn up into hole in floor or
• Release pawl, carefullyunwind spring, or wind asrequired.
• Remove weight andunwind a little cable, or

Appendix III. Analogue Recorders
November 2, 1998 231
Symptom Possible cause Action
shelf, or weight dropped to itsfull extent.
• Electric clock-power a step inthe trace.
• Extreme cold temperatures.
wind cable as required.
• Check circuit breaker,supply voltage.
• Lubricate using arcticlubricant, or heat therecorder.
Take-up cylinderfalls from mounts.
• Corrosion or dirt on cylinder-mounting saddle.
• Incorrect torque input fromnegator spring or drop weight.
• Clean and polish with fineemery paper, lubricateslightly.
• Check torque, should be300.380 mNm (42.54 oz.in.).
Clock runs extremelyfast.
• Drive roll not engaged, take-uproll is pulling.
• Recorder clutch dirty.
• Ensure rubber rollers thatengage paper through driveroller are in contact.
• Clean.
Clock stops within afew hours.
• Poor meshing of clock driveyoke with time gear pins.
• Safety pawl gear engaged.
• Check for properengagement of pins to yokeand possible binding;enlarge slots in clock driveyoke.
• Make sure that the safetypawl is disengaged beforeleaving the station.

Standard Operating Procedures for Hydrometric Surveys
232 November 2, 1998
This page intentionally blank.
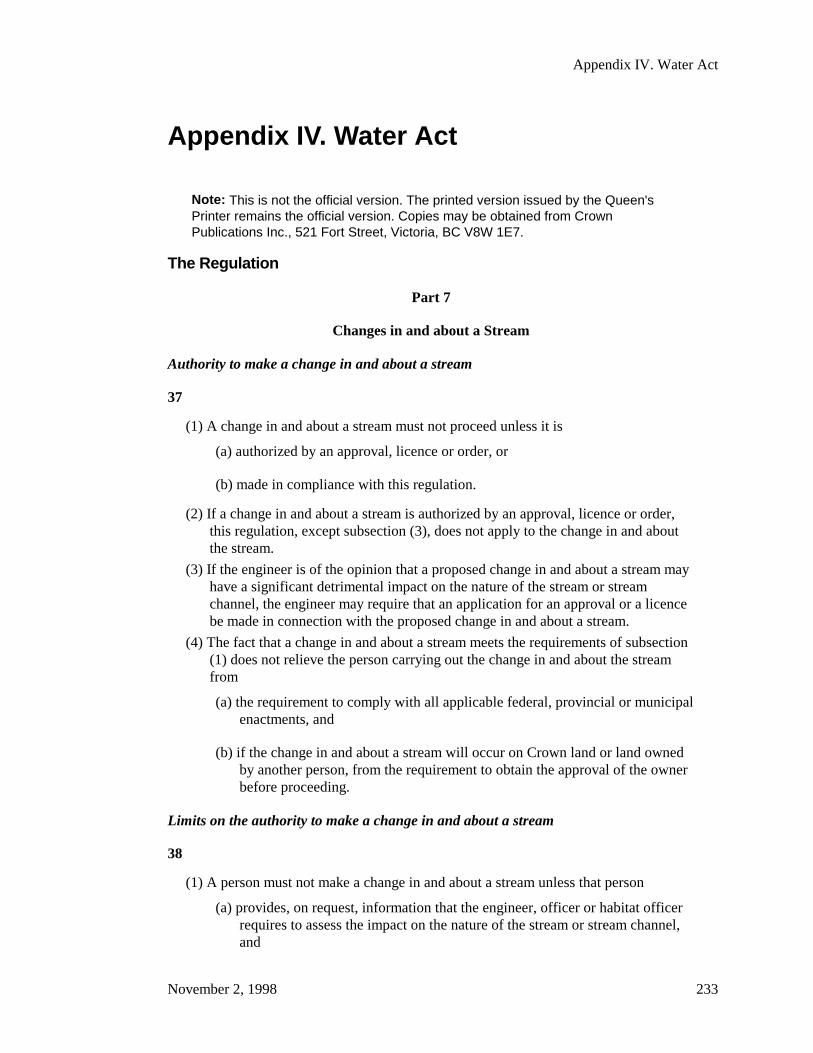
Appendix IV. Water Act
November 2, 1998 233
Appendix IV. Water Act
Note: This is not the official version. The printed version issued by the Queen'sPrinter remains the official version. Copies may be obtained from CrownPublications Inc., 521 Fort Street, Victoria, BC V8W 1E7.
The Regulation
Part 7
Changes in and about a Stream
Authority to make a change in and about a stream
37
(1) A change in and about a stream must not proceed unless it is
(a) authorized by an approval, licence or order, or
(b) made in compliance with this regulation.
(2) If a change in and about a stream is authorized by an approval, licence or order,this regulation, except subsection (3), does not apply to the change in and aboutthe stream.
(3) If the engineer is of the opinion that a proposed change in and about a stream mayhave a significant detrimental impact on the nature of the stream or streamchannel, the engineer may require that an application for an approval or a licencebe made in connection with the proposed change in and about a stream.
(4) The fact that a change in and about a stream meets the requirements of subsection(1) does not relieve the person carrying out the change in and about the streamfrom
(a) the requirement to comply with all applicable federal, provincial or municipalenactments, and
(b) if the change in and about a stream will occur on Crown land or land ownedby another person, from the requirement to obtain the approval of the ownerbefore proceeding.
Limits on the authority to make a change in and about a stream
38
(1) A person must not make a change in and about a stream unless that person
(a) provides, on request, information that the engineer, officer or habitat officerrequires to assess the impact on the nature of the stream or stream channel,and

Standard Operating Procedures for Hydrometric Surveys
234 November 2, 1998
(b) once commenced, completes the change without delay except if a delay isnecessary to preserve the nature of the stream or stream channel.
(2) A change in and about a stream must be designed, constructed and maintained insuch a manner that the change does not pose a significant danger to life, propertyor the environment.
Failure to comply with this regulation when making a change in and about a stream
39 In addition to other remedies or penalties that may be imposed on a person who makesa change in and about a stream that does not comply with this regulation, the person must
(a) within 72 hours report the non-compliance to the closest regional office ofthe Ministry of Environment, Lands and Parks, and
(b) to remedy the non-compliance,
(i) take the measures the engineer specifies, and
(ii) comply with the terms and conditions described in section 42 that ahabitat officer specifies.
Notification
40
(1) A person must not make a change in and about a stream unless that person
(a) notifies a habitat officer of the region of the Ministry of Environment, Landsand Parks in which the change in and about a stream will be located, byproviding the information specified in the notification form available fromthe ministry, of the particulars of the proposed change at least 45 days priorto commencing to make the change, and
(b) obtains from a habitat officer the terms and conditions described in section42 on which the change can proceed prior to commencing to make thechange.
(2) Despite subsection (1), if a habitat officer has not contacted the person givingnotice under subsection (1) (a) within 45 days of the receipt of the notice by ahabitat officer, the person may proceed to make the change.
(3) A person who makes a change in and about a stream under section 44 (o) to (t)does not have to comply with subsection (1).
(4) A person who makes a change in and about a stream under section 44 (o) or (p)must
(a) within 72 hours report the change to a habitat officer, and
(b) take the measures the engineer specifies and comply with the terms andconditions described in section 42 that a habitat officer specifies respectingthe change.
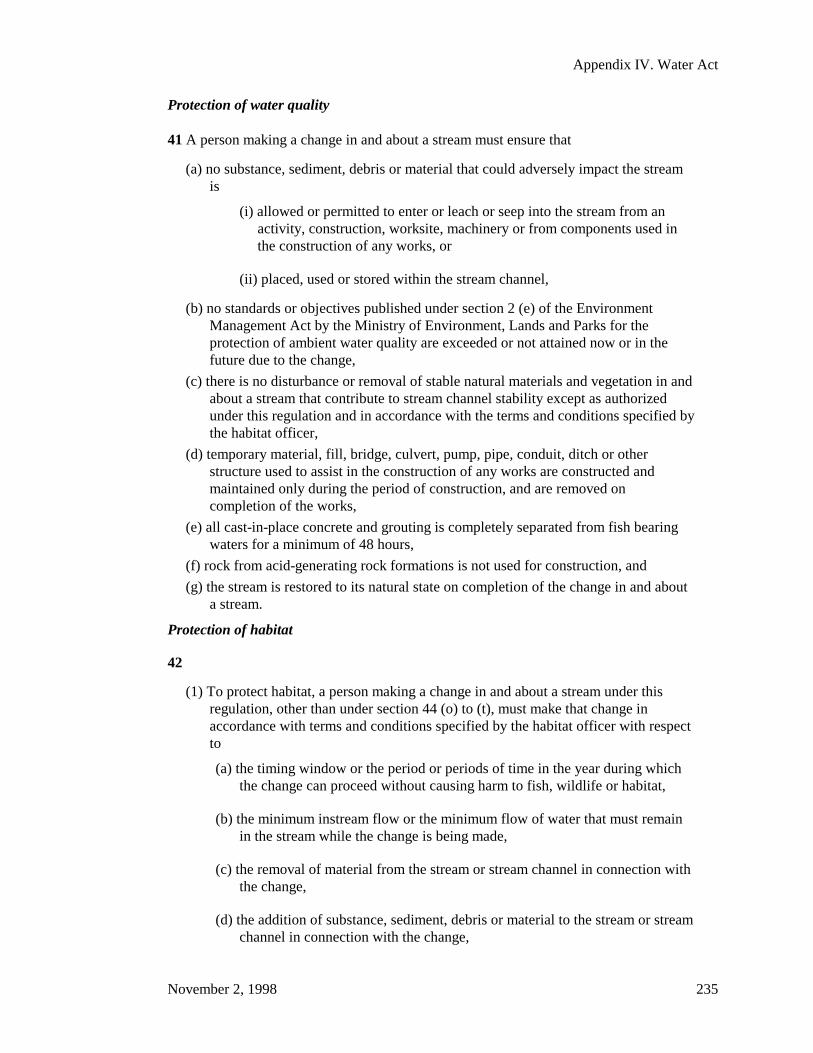
Appendix IV. Water Act
November 2, 1998 235
Protection of water quality
41 A person making a change in and about a stream must ensure that
(a) no substance, sediment, debris or material that could adversely impact the streamis
(i) allowed or permitted to enter or leach or seep into the stream from anactivity, construction, worksite, machinery or from components used inthe construction of any works, or
(ii) placed, used or stored within the stream channel,
(b) no standards or objectives published under section 2 (e) of the EnvironmentManagement Act by the Ministry of Environment, Lands and Parks for theprotection of ambient water quality are exceeded or not attained now or in thefuture due to the change,
(c) there is no disturbance or removal of stable natural materials and vegetation in andabout a stream that contribute to stream channel stability except as authorizedunder this regulation and in accordance with the terms and conditions specified bythe habitat officer,
(d) temporary material, fill, bridge, culvert, pump, pipe, conduit, ditch or otherstructure used to assist in the construction of any works are constructed andmaintained only during the period of construction, and are removed oncompletion of the works,
(e) all cast-in-place concrete and grouting is completely separated from fish bearingwaters for a minimum of 48 hours,
(f) rock from acid-generating rock formations is not used for construction, and
(g) the stream is restored to its natural state on completion of the change in and abouta stream.
Protection of habitat
42
(1) To protect habitat, a person making a change in and about a stream under thisregulation, other than under section 44 (o) to (t), must make that change inaccordance with terms and conditions specified by the habitat officer with respectto
(a) the timing window or the period or periods of time in the year during whichthe change can proceed without causing harm to fish, wildlife or habitat,
(b) the minimum instream flow or the minimum flow of water that must remainin the stream while the change is being made,
(c) the removal of material from the stream or stream channel in connection withthe change,
(d) the addition of substance, sediment, debris or material to the stream or streamchannel in connection with the change,
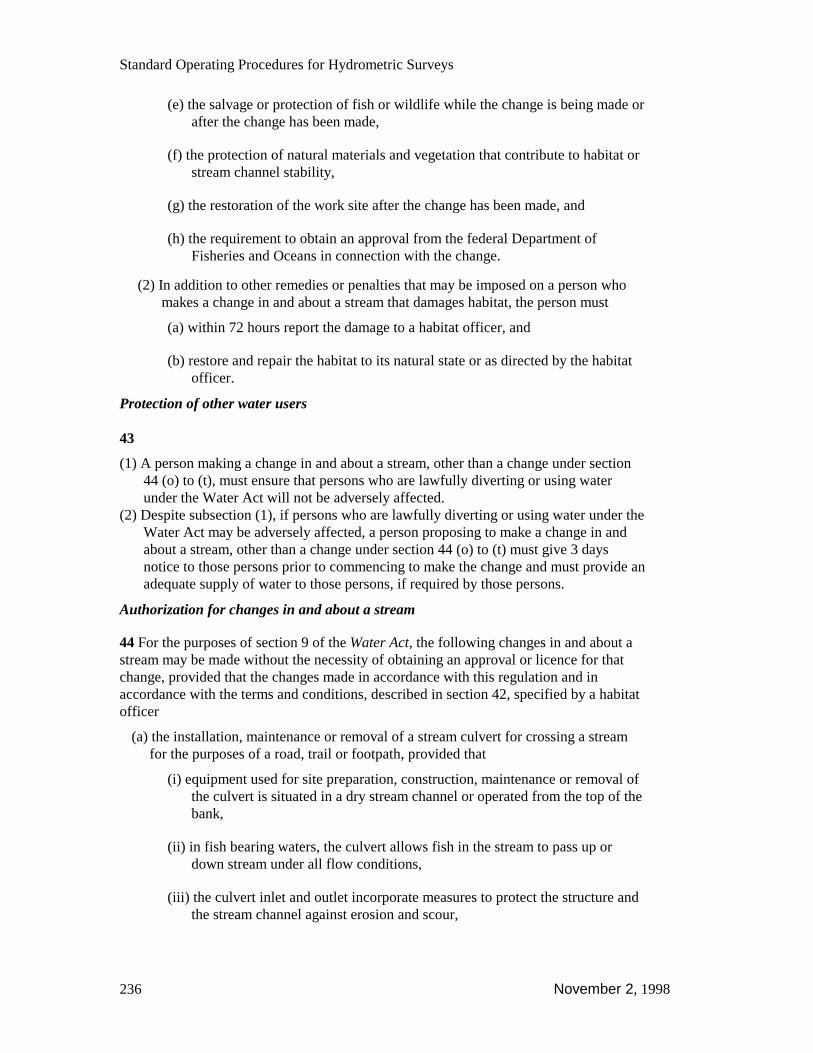
Standard Operating Procedures for Hydrometric Surveys
236 November 2, 1998
(e) the salvage or protection of fish or wildlife while the change is being made orafter the change has been made,
(f) the protection of natural materials and vegetation that contribute to habitat orstream channel stability,
(g) the restoration of the work site after the change has been made, and
(h) the requirement to obtain an approval from the federal Department ofFisheries and Oceans in connection with the change.
(2) In addition to other remedies or penalties that may be imposed on a person whomakes a change in and about a stream that damages habitat, the person must
(a) within 72 hours report the damage to a habitat officer, and
(b) restore and repair the habitat to its natural state or as directed by the habitatofficer.
Protection of other water users
43
(1) A person making a change in and about a stream, other than a change under section44 (o) to (t), must ensure that persons who are lawfully diverting or using waterunder the Water Act will not be adversely affected.
(2) Despite subsection (1), if persons who are lawfully diverting or using water under theWater Act may be adversely affected, a person proposing to make a change in andabout a stream, other than a change under section 44 (o) to (t) must give 3 daysnotice to those persons prior to commencing to make the change and must provide anadequate supply of water to those persons, if required by those persons.
Authorization for changes in and about a stream
44 For the purposes of section 9 of the Water Act, the following changes in and about astream may be made without the necessity of obtaining an approval or licence for thatchange, provided that the changes made in accordance with this regulation and inaccordance with the terms and conditions, described in section 42, specified by a habitatofficer
(a) the installation, maintenance or removal of a stream culvert for crossing a streamfor the purposes of a road, trail or footpath, provided that
(i) equipment used for site preparation, construction, maintenance or removal ofthe culvert is situated in a dry stream channel or operated from the top of thebank,
(ii) in fish bearing waters, the culvert allows fish in the stream to pass up ordown stream under all flow conditions,
(iii) the culvert inlet and outlet incorporate measures to protect the structure andthe stream channel against erosion and scour,

Appendix IV. Water Act
November 2, 1998 237
(iv) if debris cannot safely pass, provision is made to prevent the entrance ofdebris into the culvert,
(v) the installation, maintenance or removal does not destabilize the streamchannel,
(vi) the culvert and its approach roads do not produce a backwater effect orincrease the head of the stream,
(vii) the culvert capacity is equivalent to the hydraulic capacity of the streamchannel or is capable of passing the 1 in 200 year maximum daily flowwithout the water level at the culvert inlet exceeding the top of the culvert,
(viii) the culvert has a minimum equivalent diameter of 600 mm,
(ix) a culvert having an equivalent diameter of 2 metres or greater, or having adesign capacity to pass a flow of more than 6 cubic metres a second, isdesigned by a professional engineer and constructed in conformance withthat design,
(x) the culvert is installed in a manner which will permit the removal of obstaclesand debris within the culvert and at the culvert ends,
(xi) the stream channel, located outside the cleared width, is not altered,
(xii) embankment fill materials do not and will not encroach on culvert inlets andoutlets,
(xiii) the culvert has a depth of fill cover which is at least 300 mm or as requiredby the culvert manufacturer’s specifications,
(xiv) the maximum fill heights above the top of the culvert do not exceed 2 m,and
(xv) the culvert material meets the standards of the Canadian StandardsAssociation;
(b) the construction, maintenance or removal of a clear span bridge, provided that
(i) the bridge and its approach roads do not produce a back water effect orincrease the head in the stream,
(ii) the equipment used for construction, including site preparation, maintenanceor removal of the bridge is situated in a dry stream channel or is operatedfrom the top of the bank,
(iii) the hydraulic capacity of the bridge is equivalent to the hydraulic capacity ofthe stream channel, or is capable of passing the 1 in 200 year maximum dailyflow, and the height of the underside of the bridge is also adequate toprovide free passage of flood debris and ice flows, and

Standard Operating Procedures for Hydrometric Surveys
238 November 2, 1998
(iv) the bridge material meets the standards of the Canadian StandardsAssociation, as applicable;
(c) the construction or maintenance of a pipeline crossing, provided that
(i) the pipeline and associated works are installed in a dry stream channel at adepth so that the top of the pipe is at least 1 metre below the lowest elevationof the bed of the stream, and
(ii) in the case of an aerial crossing, the crossing is constructed in accordancewith the requirements prescribed in paragraph (b) for clear span bridges;
(d) the construction, maintenance or removal of a pier or wharf in a stream, providedthat the ebb and flow of water and movement of material under the influence ofwaves or currents is not obstructed and that the requirements under section 37 (4)are met;
(e) the construction, maintenance or removal of a flow or water level measuring devicein a stream by the Crown in right of either Canada or British Columbia, or theiragents;
(f) the construction or removal of a fish fence, screen or fish or game guard across astream by the Crown in right of either Canada or British Columbia, or their agents,provided that it is designed, constructed, maintained or used so as not to obstructthe flow of water in the stream;
(g) the restoration or maintenance of a stream channel by British Columbia or itsagents;
(h) the restoration or maintenance of a stream channel by a municipality;(i) the mechanical or manual cutting of annual vegetation within a stream channel;(j) the restoration or maintenance of fish habitat by the Crown in right of either Canada
or British Columbia, or their agents;(k) the repair or maintenance of existing dikes or existing erosion protection works to
their original state, provided that the dikes or works were functional during theprevious year;
(l) the construction or maintenance of storm sewer outfalls, provided that the stormsewer outfall is designed by a professional engineer, and constructed, maintainedand used so as not to obstruct the flow of water in the stream or to cause erosion orscour in the stream;
(m) the mechanical or manual control of Eurasian water milfoil and other aquaticvegetation by a landowner, a municipality or a local authority;
(n) the construction or maintenance of ice bridges, winter fords or snowfills,
(i) provided that the materials used are removed from the stream channel beforeice breakup and that only clean ice and snow are used, and
(ii) in the case of ice bridges, provided any logs, timbers and other structuralmaterials used can be removed in a safe manner;
(o) the construction or placement of erosion protection works or flood protectionworks during a flood emergency, but not including restoration works, declaredunder the Emergency Program Act, under the direction of the Crown in right ofBritish Columbia, or its agents, or by a municipality;
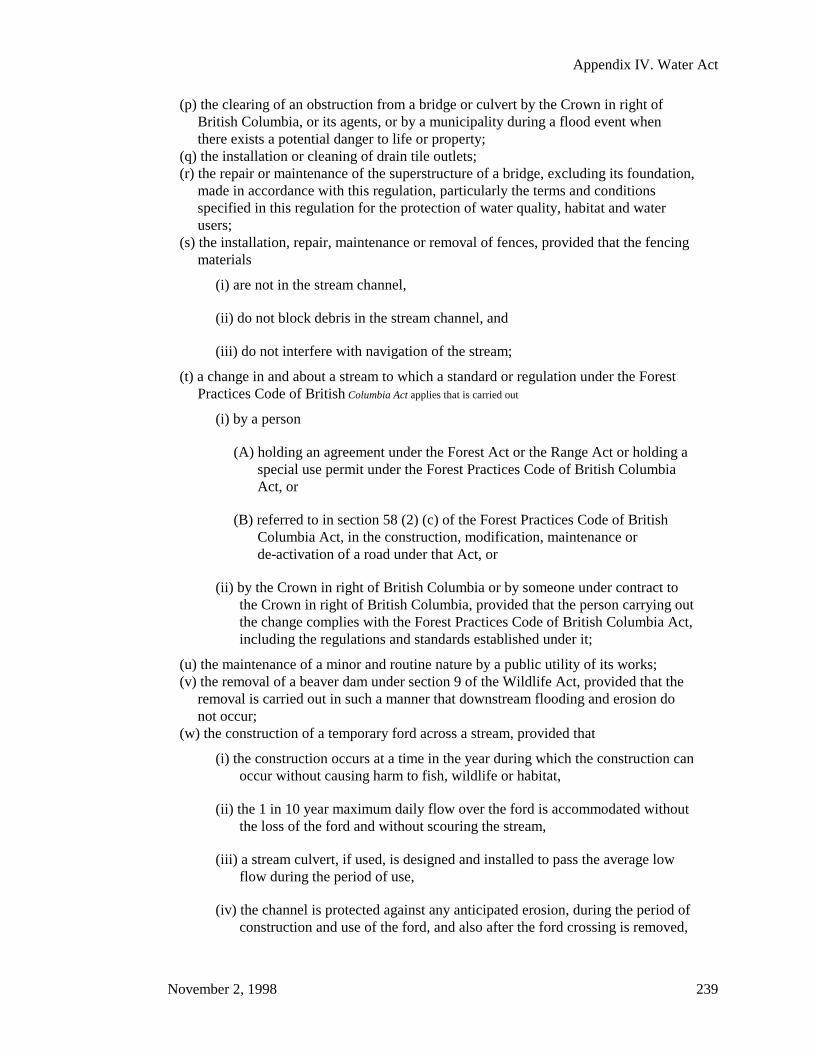
Appendix IV. Water Act
November 2, 1998 239
(p) the clearing of an obstruction from a bridge or culvert by the Crown in right ofBritish Columbia, or its agents, or by a municipality during a flood event whenthere exists a potential danger to life or property;
(q) the installation or cleaning of drain tile outlets;(r) the repair or maintenance of the superstructure of a bridge, excluding its foundation,
made in accordance with this regulation, particularly the terms and conditionsspecified in this regulation for the protection of water quality, habitat and waterusers;
(s) the installation, repair, maintenance or removal of fences, provided that the fencingmaterials
(i) are not in the stream channel,
(ii) do not block debris in the stream channel, and
(iii) do not interfere with navigation of the stream;
(t) a change in and about a stream to which a standard or regulation under the ForestPractices Code of British Columbia Act applies that is carried out
(i) by a person
(A) holding an agreement under the Forest Act or the Range Act or holding aspecial use permit under the Forest Practices Code of British ColumbiaAct, or
(B) referred to in section 58 (2) (c) of the Forest Practices Code of BritishColumbia Act, in the construction, modification, maintenance orde-activation of a road under that Act, or
(ii) by the Crown in right of British Columbia or by someone under contract tothe Crown in right of British Columbia, provided that the person carrying outthe change complies with the Forest Practices Code of British Columbia Act,including the regulations and standards established under it;
(u) the maintenance of a minor and routine nature by a public utility of its works;(v) the removal of a beaver dam under section 9 of the Wildlife Act, provided that the
removal is carried out in such a manner that downstream flooding and erosion donot occur;
(w) the construction of a temporary ford across a stream, provided that
(i) the construction occurs at a time in the year during which the construction canoccur without causing harm to fish, wildlife or habitat,
(ii) the 1 in 10 year maximum daily flow over the ford is accommodated withoutthe loss of the ford and without scouring the stream,
(iii) a stream culvert, if used, is designed and installed to pass the average lowflow during the period of use,
(iv) the channel is protected against any anticipated erosion, during the period ofconstruction and use of the ford, and also after the ford crossing is removed,
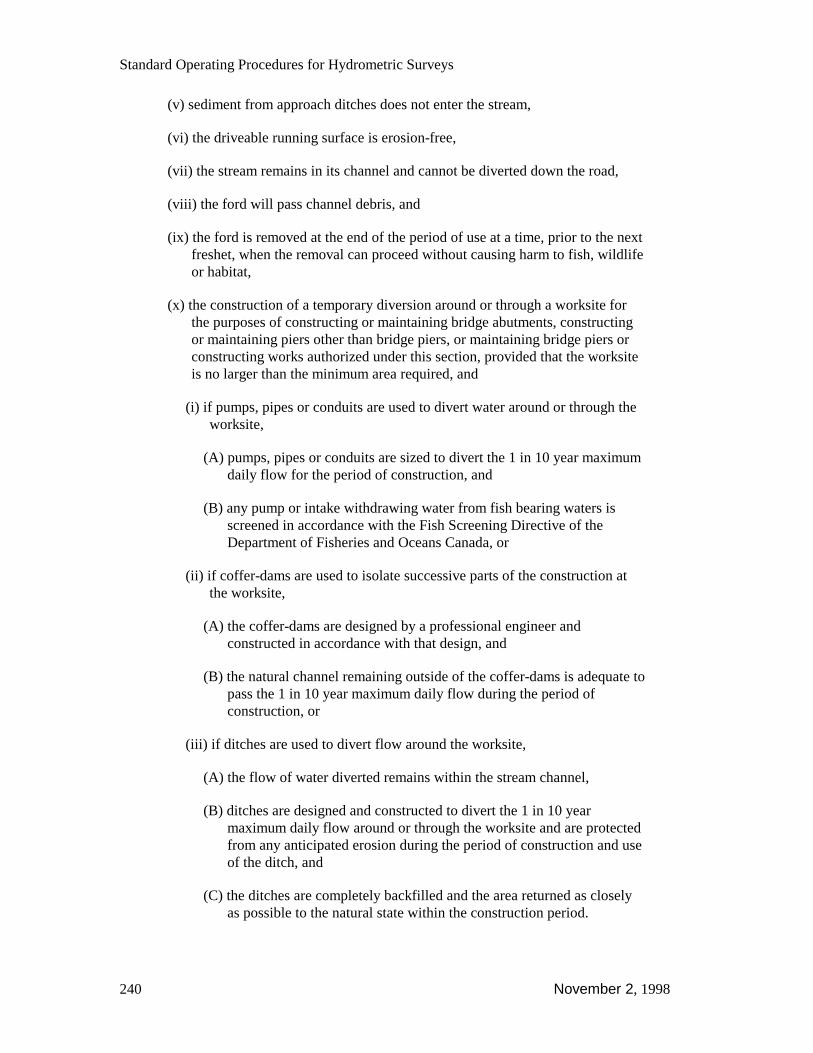
Standard Operating Procedures for Hydrometric Surveys
240 November 2, 1998
(v) sediment from approach ditches does not enter the stream,
(vi) the driveable running surface is erosion-free,
(vii) the stream remains in its channel and cannot be diverted down the road,
(viii) the ford will pass channel debris, and
(ix) the ford is removed at the end of the period of use at a time, prior to the nextfreshet, when the removal can proceed without causing harm to fish, wildlifeor habitat,
(x) the construction of a temporary diversion around or through a worksite forthe purposes of constructing or maintaining bridge abutments, constructingor maintaining piers other than bridge piers, or maintaining bridge piers orconstructing works authorized under this section, provided that the worksiteis no larger than the minimum area required, and
(i) if pumps, pipes or conduits are used to divert water around or through theworksite,
(A) pumps, pipes or conduits are sized to divert the 1 in 10 year maximumdaily flow for the period of construction, and
(B) any pump or intake withdrawing water from fish bearing waters isscreened in accordance with the Fish Screening Directive of theDepartment of Fisheries and Oceans Canada, or
(ii) if coffer-dams are used to isolate successive parts of the construction atthe worksite,
(A) the coffer-dams are designed by a professional engineer andconstructed in accordance with that design, and
(B) the natural channel remaining outside of the coffer-dams is adequate topass the 1 in 10 year maximum daily flow during the period ofconstruction, or
(iii) if ditches are used to divert flow around the worksite,
(A) the flow of water diverted remains within the stream channel,
(B) ditches are designed and constructed to divert the 1 in 10 yearmaximum daily flow around or through the worksite and are protectedfrom any anticipated erosion during the period of construction and useof the ditch, and
(C) the ditches are completely backfilled and the area returned as closelyas possible to the natural state within the construction period.

Appendix IV. Water Act
November 2, 1998 241
Note: A full discussion of the Regulation is found in A User’s Guide to Working Inand Around Water: Regulation Under British Columbia’s Water Act - June, 1997.Water Management Branch, BC Ministry of Environment. 23pp.
Note: This is not the official version. The printed version issued by the Queen'sPrinter remains the official version. Copies may be obtained from CrownPublications Inc., 521 Fort Street, Victoria, BC V8W 1E7.

Standard Operating Procedures for Hydrometric Surveys
242 November 2, 1998
Notification for Proposed Works and Changes In and About a Streamunder the Section 9 Regulation of the Water Act
Please refer to the application guidelines when completing this Notification Form
1. Applicant Name: ______________________________________________________
Address: ________________________________________________________________
City & Province: _________________________________________________________
Postal Code: ________________ Phone:____________________
2. Location of Works:
Stream Name: ___________________________________________________________
Location on Stream: ______________________________________________________
What stream\river\lake does it flow into?: _____________________________________
Address, if different from above: ____________________________________________
Legal description of property: _______________________________________________
3. Sketch Plan: attach a drawing showing lot boundaries, location of proposed works,stream direction and flow and location of buildings.
4. Proposed Timing:
Start (day/month/year): _____________________
Finish (day/month/year): ____________________
5. Type of Works (Check appropriate line):
____ Road crossing culvert
____ Pipeline crossing in a naturally dry channel
____ Cutting annual vegetation
____ Storm sewer outfalls
____ Existing dike or erosion protection works repair or maintenance
____ Routine maintenance by a public utility
____ Fish habitat restoration or maintenance by government
____ Stream channel restoration or maintenance by a municipality or the province
____ Fish fences or screens, fish or game guards by government
____ Flow or water level measuring device by government
____ Clear span bridge
____ Pier or wharf
____ Ice bridge or winter ford
____ Aquatic vegetation control
Dimensions of the proposed works: Length: _____ Width: ______ Diameter: _______
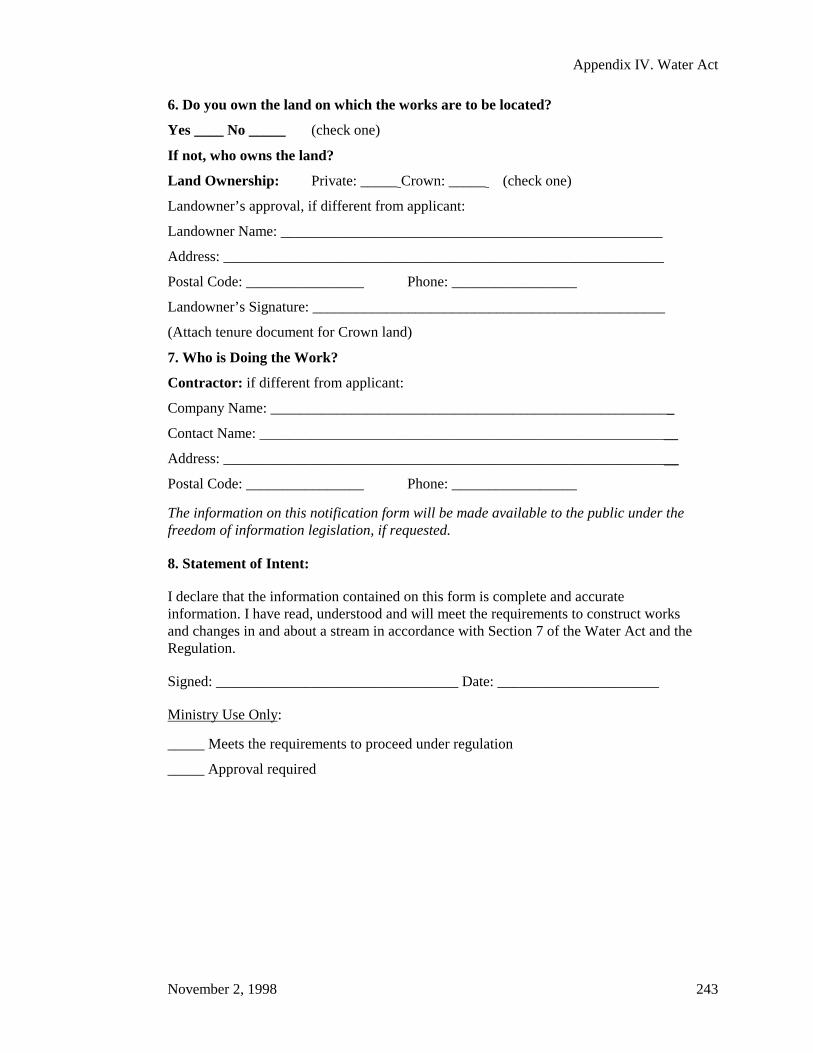
Appendix IV. Water Act
November 2, 1998 243
6. Do you own the land on which the works are to be located?
Yes ____ No _____ (check one)
If not, who owns the land?
Land Ownership: Private: _____ Crown: _____ (check one)
Landowner’s approval, if different from applicant:
Landowner Name: ____________________________________________________
Address: ____________________________________________________________
Postal Code: ________________ Phone: _________________
Landowner’s Signature: ________________________________________________
(Attach tenure document for Crown land)
7. Who is Doing the Work?
Contractor: if different from applicant:
Company Name: _______________________________________________________
Contact Name: _________________________________________________________
Address: ______________________________________________________________
Postal Code: ________________ Phone: _________________
The information on this notification form will be made available to the public under thefreedom of information legislation, if requested.
8. Statement of Intent:
I declare that the information contained on this form is complete and accurateinformation. I have read, understood and will meet the requirements to construct worksand changes in and about a stream in accordance with Section 7 of the Water Act and theRegulation.
Signed: _________________________________ Date: ______________________
Ministry Use Only:
_____ Meets the requirements to proceed under regulation
_____ Approval required
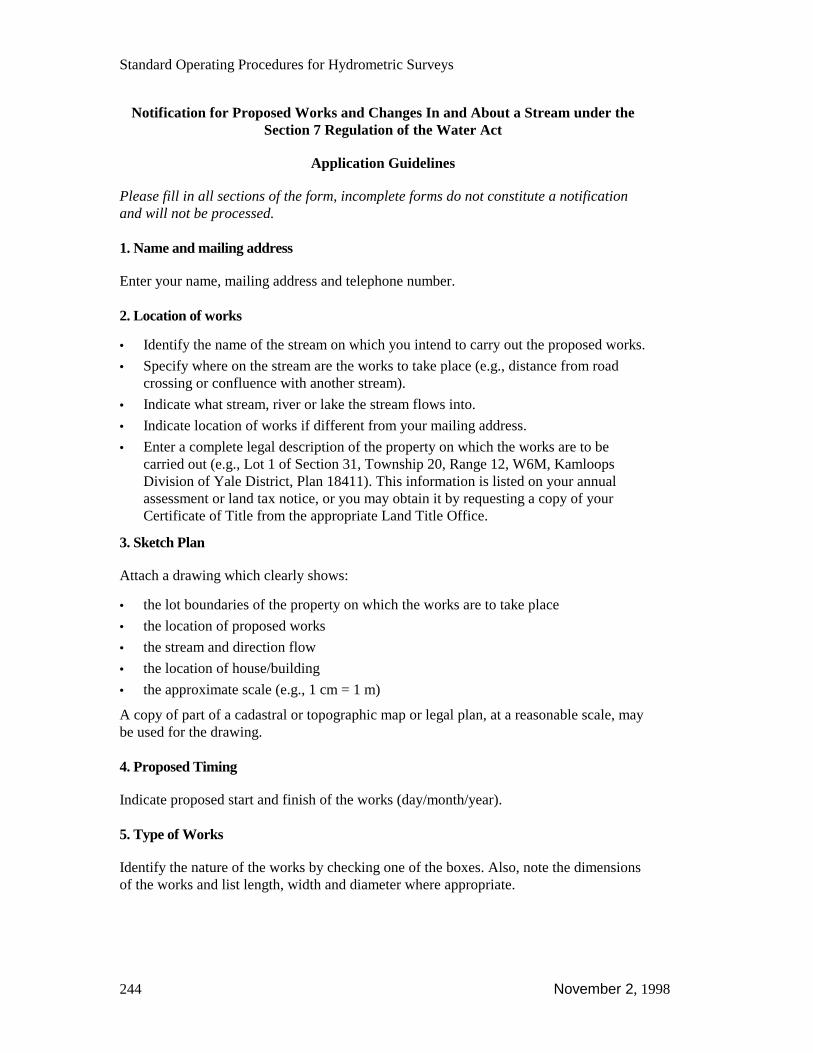
Standard Operating Procedures for Hydrometric Surveys
244 November 2, 1998
Notification for Proposed Works and Changes In and About a Stream under theSection 7 Regulation of the Water Act
Application Guidelines
Please fill in all sections of the form, incomplete forms do not constitute a notificationand will not be processed.
1. Name and mailing address
Enter your name, mailing address and telephone number.
2. Location of works
• Identify the name of the stream on which you intend to carry out the proposed works.
• Specify where on the stream are the works to take place (e.g., distance from roadcrossing or confluence with another stream).
• Indicate what stream, river or lake the stream flows into.
• Indicate location of works if different from your mailing address.
• Enter a complete legal description of the property on which the works are to becarried out (e.g., Lot 1 of Section 31, Township 20, Range 12, W6M, KamloopsDivision of Yale District, Plan 18411). This information is listed on your annualassessment or land tax notice, or you may obtain it by requesting a copy of yourCertificate of Title from the appropriate Land Title Office.
3. Sketch Plan
Attach a drawing which clearly shows:
• the lot boundaries of the property on which the works are to take place
• the location of proposed works
• the stream and direction flow
• the location of house/building
• the approximate scale (e.g., 1 cm = 1 m)
A copy of part of a cadastral or topographic map or legal plan, at a reasonable scale, maybe used for the drawing.
4. Proposed Timing
Indicate proposed start and finish of the works (day/month/year).
5. Type of Works
Identify the nature of the works by checking one of the boxes. Also, note the dimensionsof the works and list length, width and diameter where appropriate.
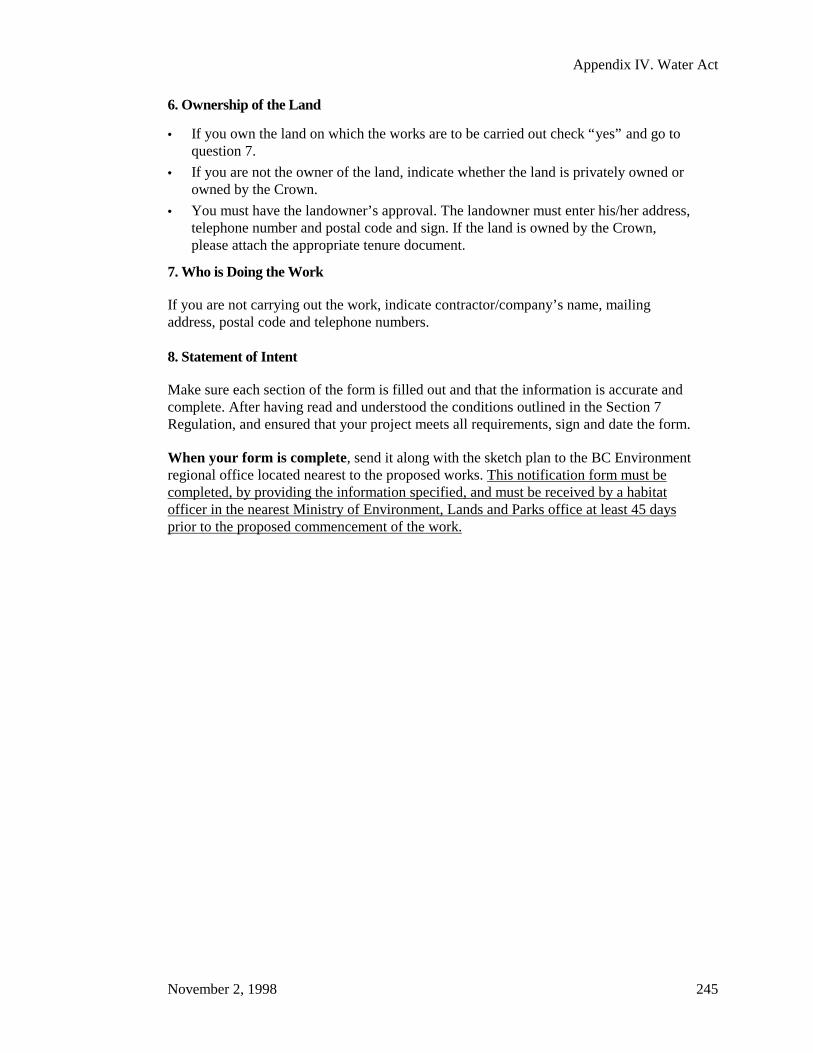
Appendix IV. Water Act
November 2, 1998 245
6. Ownership of the Land
• If you own the land on which the works are to be carried out check “yes” and go toquestion 7.
• If you are not the owner of the land, indicate whether the land is privately owned orowned by the Crown.
• You must have the landowner’s approval. The landowner must enter his/her address,telephone number and postal code and sign. If the land is owned by the Crown,please attach the appropriate tenure document.
7. Who is Doing the Work
If you are not carrying out the work, indicate contractor/company’s name, mailingaddress, postal code and telephone numbers.
8. Statement of Intent
Make sure each section of the form is filled out and that the information is accurate andcomplete. After having read and understood the conditions outlined in the Section 7Regulation, and ensured that your project meets all requirements, sign and date the form.
When your form is complete, send it along with the sketch plan to the BC Environmentregional office located nearest to the proposed works. This notification form must becompleted, by providing the information specified, and must be received by a habitatofficer in the nearest Ministry of Environment, Lands and Parks office at least 45 daysprior to the proposed commencement of the work.

Standard Operating Procedures for Hydrometric Surveys
246 November 2, 1998
This page intentionally blank.
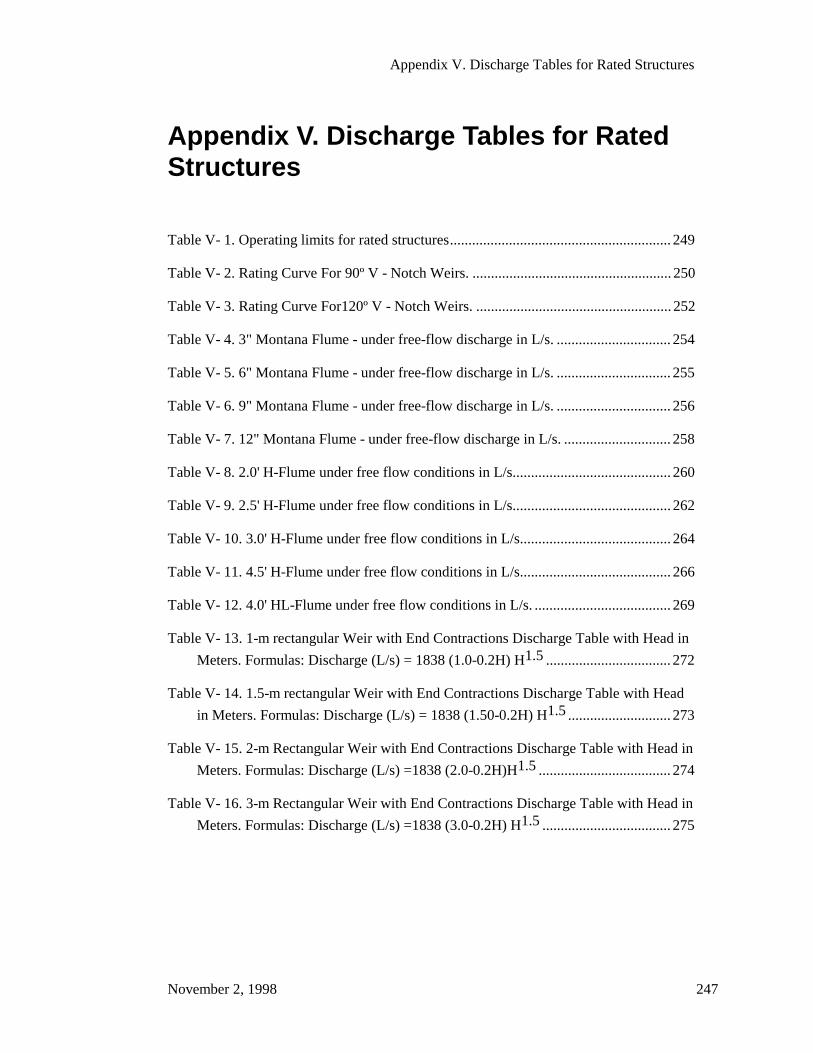
Appendix V. Discharge Tables for Rated Structures
November 2, 1998 247
Appendix V. Discharge Tables for RatedStructures
Table V- 1. Operating limits for rated structures............................................................ 249
Table V- 2. Rating Curve For 90º V - Notch Weirs. ...................................................... 250
Table V- 3. Rating Curve For120º V - Notch Weirs. ..................................................... 252
Table V- 4. 3" Montana Flume - under free-flow discharge in L/s. ............................... 254
Table V- 5. 6" Montana Flume - under free-flow discharge in L/s. ............................... 255
Table V- 6. 9" Montana Flume - under free-flow discharge in L/s. ............................... 256
Table V- 7. 12" Montana Flume - under free-flow discharge in L/s. ............................. 258
Table V- 8. 2.0' H-Flume under free flow conditions in L/s........................................... 260
Table V- 9. 2.5' H-Flume under free flow conditions in L/s........................................... 262
Table V- 10. 3.0' H-Flume under free flow conditions in L/s......................................... 264
Table V- 11. 4.5' H-Flume under free flow conditions in L/s......................................... 266
Table V- 12. 4.0' HL-Flume under free flow conditions in L/s. ..................................... 269
Table V- 13. 1-m rectangular Weir with End Contractions Discharge Table with Head in
Meters. Formulas: Discharge (L/s) = 1838 (1.0-0.2H) H1.5.................................. 272
Table V- 14. 1.5-m rectangular Weir with End Contractions Discharge Table with Head
in Meters. Formulas: Discharge (L/s) = 1838 (1.50-0.2H) H1.5............................ 273
Table V- 15. 2-m Rectangular Weir with End Contractions Discharge Table with Head in
Meters. Formulas: Discharge (L/s) =1838 (2.0-0.2H)H1.5.................................... 274
Table V- 16. 3-m Rectangular Weir with End Contractions Discharge Table with Head in
Meters. Formulas: Discharge (L/s) =1838 (3.0-0.2H) H1.5................................... 275

Standard Operating Procedures for Hydrometric Surveys
248 November 2, 1998
This page intentionally blank.
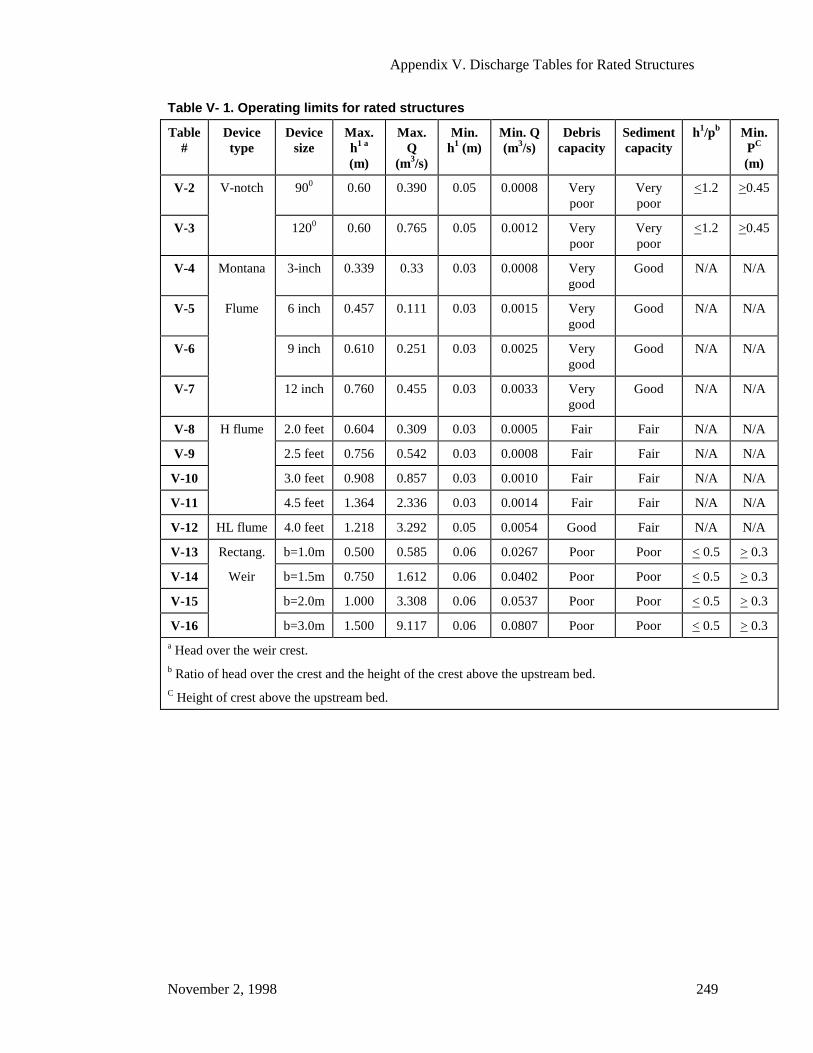
Appendix V. Discharge Tables for Rated Structures
November 2, 1998 249
Table V- 1. Operating limits for rated structures
Table#
Devicetype
Devicesize
Max.h1 a
(m)
Max.Q
(m3/s)
Min.h1 (m)
Min. Q(m3/s)
Debriscapacity
Sedimentcapacity
h1/pb Min.PC
(m)
V-2 V-notch 900 0.60 0.390 0.05 0.0008 Verypoor
Verypoor
<1.2 >0.45
V-3 1200 0.60 0.765 0.05 0.0012 Verypoor
Verypoor
<1.2 >0.45
V-4 Montana 3-inch 0.339 0.33 0.03 0.0008 Verygood
Good N/A N/A
V-5 Flume 6 inch 0.457 0.111 0.03 0.0015 Verygood
Good N/A N/A
V-6 9 inch 0.610 0.251 0.03 0.0025 Verygood
Good N/A N/A
V-7 12 inch 0.760 0.455 0.03 0.0033 Verygood
Good N/A N/A
V-8 H flume 2.0 feet 0.604 0.309 0.03 0.0005 Fair Fair N/A N/A
V-9 2.5 feet 0.756 0.542 0.03 0.0008 Fair Fair N/A N/A
V-10 3.0 feet 0.908 0.857 0.03 0.0010 Fair Fair N/A N/A
V-11 4.5 feet 1.364 2.336 0.03 0.0014 Fair Fair N/A N/A
V-12 HL flume 4.0 feet 1.218 3.292 0.05 0.0054 Good Fair N/A N/A
V-13 Rectang. b=1.0m 0.500 0.585 0.06 0.0267 Poor Poor < 0.5> 0.3
V-14 Weir b=1.5m 0.750 1.612 0.06 0.0402 Poor Poor < 0.5> 0.3
V-15 b=2.0m 1.000 3.308 0.06 0.0537 Poor Poor < 0.5> 0.3
V-16 b=3.0m 1.500 9.117 0.06 0.0807 Poor Poor < 0.5> 0.3
a Head over the weir crest.b Ratio of head over the crest and the height of the crest above the upstream bed.C Height of crest above the upstream bed.

Standard Operating Procedures for Hydrometric Surveys
250 November 2, 1998
Table V- 2. Rating Curve For 90º V - Notch Weirs.
Discharge (m3/s) for specified head (m) for fully contracted weir.
Head 0.000 0.001 0.002 0.003 0.004 0.005 0.006 0.007 0.008 0.0090.050 0.0008 0.0008 0.0008 0.0009 0.0009 0.0010 0.0010 0.0011 0.0011 0.00120.060 0.0012 0.0013 0.0013 0.0014 0.0014 0.0015 0.0015 0.0016 0.0017 0.00170.070 0.0018 0.0018 0.0019 0.0020 0.0020 0.0021 0.0022 0.0023 0.0023 0.00240.080 0.0025 0.0026 0.0026 0.0027 0.0028 0.0029 0.0030 0.0031 0.0031 0.00320.090 0.0033 0.0034 0.0035 0.0036 0.0037 0.0038 0.0039 0.0040 0.0041 0.00420.100 0.0043 0.0044 0.0046 0.0047 0.0048 0.0049 0.0050 0.0051 0.0053 0.0054
0.110 0.0055 0.0056 0.0058 0.0059 0.0060 0.0061 0.0063 0.0064 0.0066 0.00670.120 0.0068 0.0070 0.0071 0.0073 0.0074 0.0076 0.0077 0.0079 0.0080 0.00820.130 0.0083 0.0085 0.0087 0.0088 0.0090 0.0092 0.0093 0.0095 0.0097 0.00990.140 0.0100 0.0102 0.0104 0.0106 0.0108 0.0110 0.0112 0.0114 0.0115 0.01170.150 0.0119 0.0121 0.0123 0.0125 0.0128 0.0130 0.0132 0.0134 0.0136 0.01380.160 0.0140 0.0142 0.0145 0.0147 0.0149 0.0152 0.0154 0.0156 0.0158 0.01610.170 0.0163 0.0166 0.0168 0.0171 0.0173 0.0176 0.0178 0.0181 0.0183 0.01860.180 0.0188 0.0191 0.0194 0.0196 0.0199 0.0202 0.0204 0.0207 0.0210 0.02130.190 0.0216 0.0218 0.0221 0.0224 0.0227 0.0230 0.0233 0.0236 0.0239 0.02420.200 0.0245 0.0248 0.0251 0.0254 0.0258 0.0261 0.0264 0.0267 0.0270 0.0274
0.210 0.0277 0.0280 0.0284 0.0287 0.0290 0.0294 0.0297 0.0301 0.0304 0.03070.220 0.0311 0.0315 0.0318 0.0322 0.0325 0.0329 0.0333 0.0336 0.0340 0.03440.230 0.0348 0.0351 0.0355 0.0359 0.0363 0.0367 0.0371 0.0375 0.0379 0.03830.240 0.0387 0.0391 0.0395 0.0399 0.0403 0.0407 0.0411 0.0415 0.0420 0.04240.250 0.0428 0.0432 0.0437 0.0441 0.0445 0.0450 0.0454 0.0459 0.0463 0.04680.260 0.0472 0.0477 0.0481 0.0486 0.0491 0.0495 0.0500 0.0505 0.0509 0.05140.270 0.0519 0.0524 0.0529 0.0533 0.0538 0.0543 0.0548 0.0553 0.0558 0.05630.280 0.0568 0.0573 0.0579 0.0584 0.0589 0.0594 0.0599 0.0605 0.0610 0.06150.290 0.0620 0.0626 0.0631 0.0637 0.0642 0.0648 0.0653 0.0659 0.0664 0.06700.300 0.0675 0.0681 0.0687 0.0692 0.0698 0.0704 0.0710 0.0715 0.0721 0.0726
0.310 0.0733 0.0739 0.0745 0.0751 0.0757 0.0763 0.0769 0.0775 0.0781 0.07860.320 0.0794 0.0800 0.0806 0.0812 0.0819 0.0825 0.0831 0.0838 0.0844 0.08490.330 0.0857 0.0864 0.0870 0.0877 0.0883 0.0890 0.0897 0.0903 0.0910 0.09150.340 0.0923 0.0930 0.0937 0.0944 0.0951 0.0958 0.0965 0.0972 0.0979 0.09840.350 0.0993 0.1000 0.1007 0.1014 0.1021 0.1029 0.1036 0.1043 0.1051 0.10560.360 0.1065 0.1073 0.1080 0.1088 0.1095 0.1103 0.1110 0.1118 0.1125 0.11310.370 0.1141 0.1149 0.1156 0.1164 0.1172 0.1180 0.1188 0.1196 0.1204 0.12100.380 0.1219 0.1228 0.1236 0.1244 0.1252 0.1260 0.1268 0.1276 0.1285 0.12910.390 0.1301 0.1310 0.1318 0.1326 0.1335 0.1343 0.1352 0.1360 0.1369 0.13760.400 0.1386 0.1395 0.1404 0.1412 0.1421 0.1430 0.1439 0.1448 0.1457 0.1464

Appendix V. Discharge Tables for Rated Structures
November 2, 1998 251
Head 0.000 0.001 0.002 0.003 0.004 0.005 0.006 0.007 0.008 0.0090.410 0.1475 0.1484 0.1493 0.1502 0.1511 0.1520 0.1529 0.1538 0.1548 0.15550.420 0.1566 0.1576 0.1585 0.1594 0.1604 0.1613 0.1623 0.1632 0.1642 0.16490.430 0.1661 0.1671 0.1680 0.1690 0.1700 0.1710 0.1720 0.1730 0.1739 0.17470.440 0.1759 0.1769 0.1779 0.1789 0.1800 0.1810 0.1820 0.1830 0.1840 0.18480.450 0.1861 0.1871 0.1882 0.1892 0.1903 0.1913 0.1924 0.1934 0.1945 0.19530.460 0.1966 0.1977 0.1988 0.1998 0.2009 0.2020 0.2031 0.2042 0.2053 0.20610.470 0.2075 0.2086 0.2097 0.2108 0.2119 0.2130 0.2142 0.2153 0.2164 0.21720.480 0.2187 0.2198 0.2210 0.2221 0.2233 0.2244 0.2256 0.2267 0.2279 0.22870.490 0.2303 0.2314 0.2326 0.2338 0.2350 0.2362 0.2374 0.2386 0.2398 0.24060.500 0.2422 0.2434 0.2446 0.2458 0.2471 0.2483 0.2495 0.2507 0.2520 0.2529
0.510 0.2545 0.2557 0.2570 0.2582 0.2595 0.2608 0.2620 0.2633 0.2646 0.26550.520 0.2671 0.2684 0.2697 0.2710 0.2723 0.2736 0.2749 0.2762 0.2775 0.27840.530 0.2802 0.2815 0.2828 0.2841 0.2855 0.2868 0.2882 0.2895 0.2909 0.29180.540 0.2936 0.2949 0.2963 0.2977 0.2990 0.3004 0.3018 0.3032 0.3046 0.30550.550 0.3073 0.3087 0.3101 0.3116 0.3130 0.3144 0.3158 0.3172 0.3186 0.31960.560 0.3215 0.3229 0.3244 0.3258 0.3273 0.3287 0.3302 0.3316 0.3331 0.33410.570 0.3361 0.3375 0.3390 0.3405 0.3420 0.3435 0.3450 0.3465 0.3480 0.34900.580 0.3510 0.3525 0.3540 0.3555 0.3571 0.3586 0.3601 0.3617 0.3632 0.36420.590 0.3663 0.3679 0.3694 0.3710 0.3726 0.3741 0.3757 0.3773 0.3789 0.37990.600 0.3820 0.3836 0.3852 0.3868 0.3884 0.3900 0.3917 0.3933 0.3949 0.3959
0.610 0.3981 0.3998 0.4014 0.4031 0.4047 0.4064 0.4080 0.4097 0.4113 0.41240.620 0.4147 0.4163 0.4180 0.4197 0.4214 0.4231 0.4248 0.4265 0.4282 0.42930.630 0.4316 0.4333 0.4350 0.4367 0.4385 0.4402 0.4419 0.4437 0.4454 0.44650.640 0.4489 0.4507 0.4524 0.4542 0.4560 0.4577 0.4595 0.4613 0.4631 0.46420.650 0.4667 0.4685 0.4703 0.4721 0.4739 0.4757 0.4775 0.4793 0.4812 0.48230.660 0.4848 0.4867 0.4885 0.4903 0.4922 0.4941 0.4959 0.4978 0.4996 0.50080.670 0.5034 0.5053 0.5072 0.5090 0.5109 0.5128 0.5147 0.5166 0.5186 0.51970.680 0.5224 0.5243 0.5262 0.5282 0.5301 0.5320 0.5340 0.5359 0.5379 0.53910.690 0.5418 0.5438 0.5457 0.5477 0.5497 0.5517 0.5537 0.5557 0.5576 0.55880.700 0.5616 0.5637 0.5657 0.5677 0.5697 0.5717 0.5738 0.5758 0.5778 0.5790
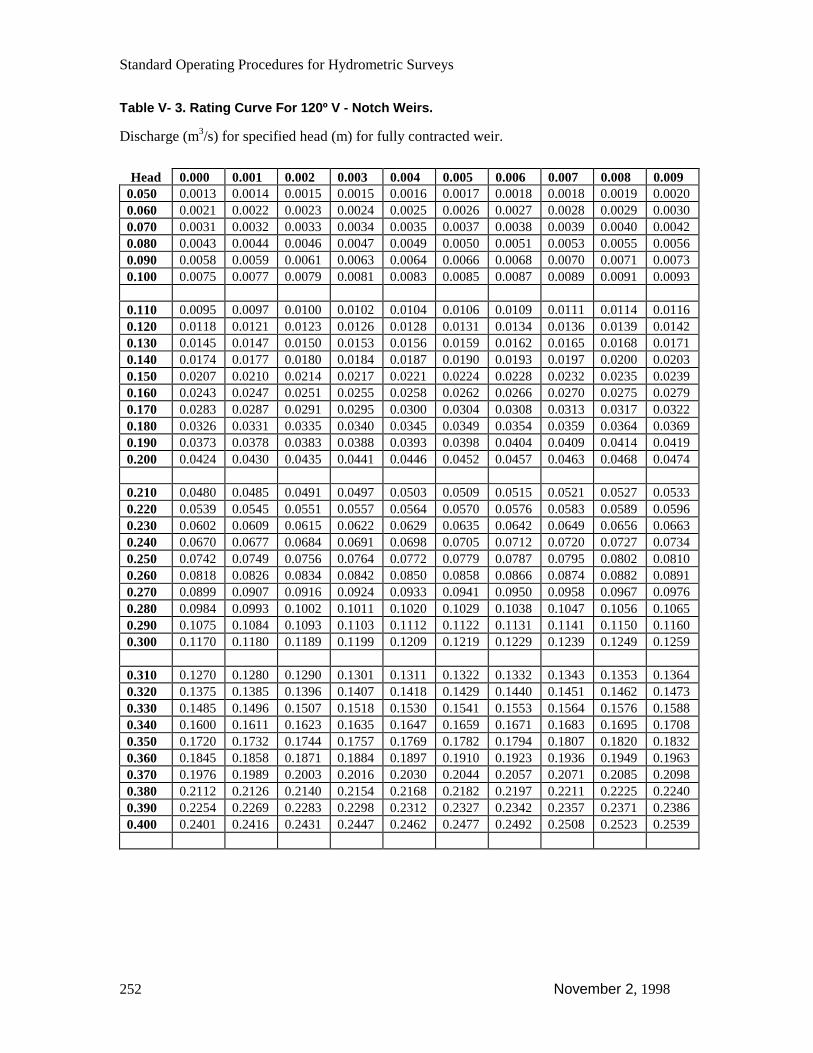
Standard Operating Procedures for Hydrometric Surveys
252 November 2, 1998
Table V- 3. Rating Curve For 120º V - Notch Weirs.
Discharge (m3/s) for specified head (m) for fully contracted weir.
Head 0.000 0.001 0.002 0.003 0.004 0.005 0.006 0.007 0.008 0.0090.050 0.0013 0.0014 0.0015 0.0015 0.0016 0.0017 0.0018 0.0018 0.0019 0.00200.060 0.0021 0.0022 0.0023 0.0024 0.0025 0.0026 0.0027 0.0028 0.0029 0.00300.070 0.0031 0.0032 0.0033 0.0034 0.0035 0.0037 0.0038 0.0039 0.0040 0.00420.080 0.0043 0.0044 0.0046 0.0047 0.0049 0.0050 0.0051 0.0053 0.0055 0.00560.090 0.0058 0.0059 0.0061 0.0063 0.0064 0.0066 0.0068 0.0070 0.0071 0.00730.100 0.0075 0.0077 0.0079 0.0081 0.0083 0.0085 0.0087 0.0089 0.0091 0.0093
0.110 0.0095 0.0097 0.0100 0.0102 0.0104 0.0106 0.0109 0.0111 0.0114 0.01160.120 0.0118 0.0121 0.0123 0.0126 0.0128 0.0131 0.0134 0.0136 0.0139 0.01420.130 0.0145 0.0147 0.0150 0.0153 0.0156 0.0159 0.0162 0.0165 0.0168 0.01710.140 0.0174 0.0177 0.0180 0.0184 0.0187 0.0190 0.0193 0.0197 0.0200 0.02030.150 0.0207 0.0210 0.0214 0.0217 0.0221 0.0224 0.0228 0.0232 0.0235 0.02390.160 0.0243 0.0247 0.0251 0.0255 0.0258 0.0262 0.0266 0.0270 0.0275 0.02790.170 0.0283 0.0287 0.0291 0.0295 0.0300 0.0304 0.0308 0.0313 0.0317 0.03220.180 0.0326 0.0331 0.0335 0.0340 0.0345 0.0349 0.0354 0.0359 0.0364 0.03690.190 0.0373 0.0378 0.0383 0.0388 0.0393 0.0398 0.0404 0.0409 0.0414 0.04190.200 0.0424 0.0430 0.0435 0.0441 0.0446 0.0452 0.0457 0.0463 0.0468 0.0474
0.210 0.0480 0.0485 0.0491 0.0497 0.0503 0.0509 0.0515 0.0521 0.0527 0.05330.220 0.0539 0.0545 0.0551 0.0557 0.0564 0.0570 0.0576 0.0583 0.0589 0.05960.230 0.0602 0.0609 0.0615 0.0622 0.0629 0.0635 0.0642 0.0649 0.0656 0.06630.240 0.0670 0.0677 0.0684 0.0691 0.0698 0.0705 0.0712 0.0720 0.0727 0.07340.250 0.0742 0.0749 0.0756 0.0764 0.0772 0.0779 0.0787 0.0795 0.0802 0.08100.260 0.0818 0.0826 0.0834 0.0842 0.0850 0.0858 0.0866 0.0874 0.0882 0.08910.270 0.0899 0.0907 0.0916 0.0924 0.0933 0.0941 0.0950 0.0958 0.0967 0.09760.280 0.0984 0.0993 0.1002 0.1011 0.1020 0.1029 0.1038 0.1047 0.1056 0.10650.290 0.1075 0.1084 0.1093 0.1103 0.1112 0.1122 0.1131 0.1141 0.1150 0.11600.300 0.1170 0.1180 0.1189 0.1199 0.1209 0.1219 0.1229 0.1239 0.1249 0.1259
0.310 0.1270 0.1280 0.1290 0.1301 0.1311 0.1322 0.1332 0.1343 0.1353 0.13640.320 0.1375 0.1385 0.1396 0.1407 0.1418 0.1429 0.1440 0.1451 0.1462 0.14730.330 0.1485 0.1496 0.1507 0.1518 0.1530 0.1541 0.1553 0.1564 0.1576 0.15880.340 0.1600 0.1611 0.1623 0.1635 0.1647 0.1659 0.1671 0.1683 0.1695 0.17080.350 0.1720 0.1732 0.1744 0.1757 0.1769 0.1782 0.1794 0.1807 0.1820 0.18320.360 0.1845 0.1858 0.1871 0.1884 0.1897 0.1910 0.1923 0.1936 0.1949 0.19630.370 0.1976 0.1989 0.2003 0.2016 0.2030 0.2044 0.2057 0.2071 0.2085 0.20980.380 0.2112 0.2126 0.2140 0.2154 0.2168 0.2182 0.2197 0.2211 0.2225 0.22400.390 0.2254 0.2269 0.2283 0.2298 0.2312 0.2327 0.2342 0.2357 0.2371 0.23860.400 0.2401 0.2416 0.2431 0.2447 0.2462 0.2477 0.2492 0.2508 0.2523 0.2539
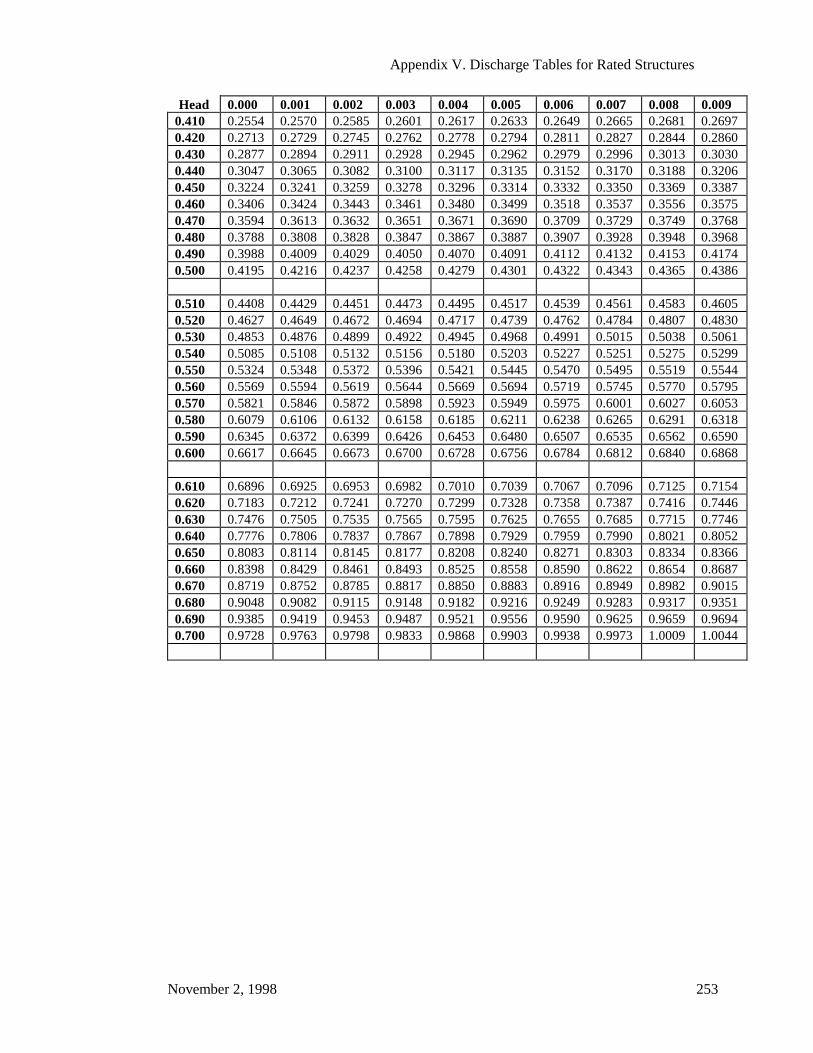
Appendix V. Discharge Tables for Rated Structures
November 2, 1998 253
Head 0.000 0.001 0.002 0.003 0.004 0.005 0.006 0.007 0.008 0.0090.410 0.2554 0.2570 0.2585 0.2601 0.2617 0.2633 0.2649 0.2665 0.2681 0.26970.420 0.2713 0.2729 0.2745 0.2762 0.2778 0.2794 0.2811 0.2827 0.2844 0.28600.430 0.2877 0.2894 0.2911 0.2928 0.2945 0.2962 0.2979 0.2996 0.3013 0.30300.440 0.3047 0.3065 0.3082 0.3100 0.3117 0.3135 0.3152 0.3170 0.3188 0.32060.450 0.3224 0.3241 0.3259 0.3278 0.3296 0.3314 0.3332 0.3350 0.3369 0.33870.460 0.3406 0.3424 0.3443 0.3461 0.3480 0.3499 0.3518 0.3537 0.3556 0.35750.470 0.3594 0.3613 0.3632 0.3651 0.3671 0.3690 0.3709 0.3729 0.3749 0.37680.480 0.3788 0.3808 0.3828 0.3847 0.3867 0.3887 0.3907 0.3928 0.3948 0.39680.490 0.3988 0.4009 0.4029 0.4050 0.4070 0.4091 0.4112 0.4132 0.4153 0.41740.500 0.4195 0.4216 0.4237 0.4258 0.4279 0.4301 0.4322 0.4343 0.4365 0.4386
0.510 0.4408 0.4429 0.4451 0.4473 0.4495 0.4517 0.4539 0.4561 0.4583 0.46050.520 0.4627 0.4649 0.4672 0.4694 0.4717 0.4739 0.4762 0.4784 0.4807 0.48300.530 0.4853 0.4876 0.4899 0.4922 0.4945 0.4968 0.4991 0.5015 0.5038 0.50610.540 0.5085 0.5108 0.5132 0.5156 0.5180 0.5203 0.5227 0.5251 0.5275 0.52990.550 0.5324 0.5348 0.5372 0.5396 0.5421 0.5445 0.5470 0.5495 0.5519 0.55440.560 0.5569 0.5594 0.5619 0.5644 0.5669 0.5694 0.5719 0.5745 0.5770 0.57950.570 0.5821 0.5846 0.5872 0.5898 0.5923 0.5949 0.5975 0.6001 0.6027 0.60530.580 0.6079 0.6106 0.6132 0.6158 0.6185 0.6211 0.6238 0.6265 0.6291 0.63180.590 0.6345 0.6372 0.6399 0.6426 0.6453 0.6480 0.6507 0.6535 0.6562 0.65900.600 0.6617 0.6645 0.6673 0.6700 0.6728 0.6756 0.6784 0.6812 0.6840 0.6868
0.610 0.6896 0.6925 0.6953 0.6982 0.7010 0.7039 0.7067 0.7096 0.7125 0.71540.620 0.7183 0.7212 0.7241 0.7270 0.7299 0.7328 0.7358 0.7387 0.7416 0.74460.630 0.7476 0.7505 0.7535 0.7565 0.7595 0.7625 0.7655 0.7685 0.7715 0.77460.640 0.7776 0.7806 0.7837 0.7867 0.7898 0.7929 0.7959 0.7990 0.8021 0.80520.650 0.8083 0.8114 0.8145 0.8177 0.8208 0.8240 0.8271 0.8303 0.8334 0.83660.660 0.8398 0.8429 0.8461 0.8493 0.8525 0.8558 0.8590 0.8622 0.8654 0.86870.670 0.8719 0.8752 0.8785 0.8817 0.8850 0.8883 0.8916 0.8949 0.8982 0.90150.680 0.9048 0.9082 0.9115 0.9148 0.9182 0.9216 0.9249 0.9283 0.9317 0.93510.690 0.9385 0.9419 0.9453 0.9487 0.9521 0.9556 0.9590 0.9625 0.9659 0.96940.700 0.9728 0.9763 0.9798 0.9833 0.9868 0.9903 0.9938 0.9973 1.0009 1.0044
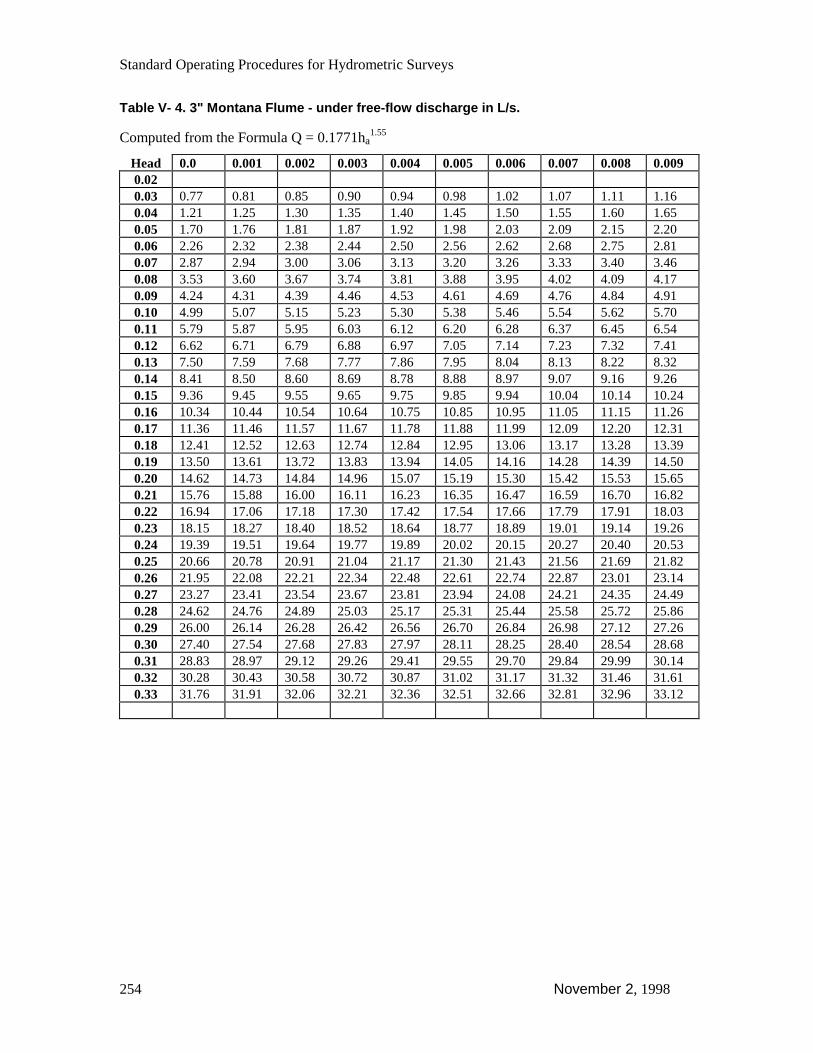
Standard Operating Procedures for Hydrometric Surveys
254 November 2, 1998
Table V- 4. 3" Montana Flume - under free-flow discharge in L/s.
Computed from the Formula Q = 0.1771ha1.55
Head 0.0 0.001 0.002 0.003 0.004 0.005 0.006 0.007 0.008 0.0090.020.03 0.77 0.81 0.85 0.90 0.94 0.98 1.02 1.07 1.11 1.160.04 1.21 1.25 1.30 1.35 1.40 1.45 1.50 1.55 1.60 1.650.05 1.70 1.76 1.81 1.87 1.92 1.98 2.03 2.09 2.15 2.200.06 2.26 2.32 2.38 2.44 2.50 2.56 2.62 2.68 2.75 2.810.07 2.87 2.94 3.00 3.06 3.13 3.20 3.26 3.33 3.40 3.460.08 3.53 3.60 3.67 3.74 3.81 3.88 3.95 4.02 4.09 4.170.09 4.24 4.31 4.39 4.46 4.53 4.61 4.69 4.76 4.84 4.910.10 4.99 5.07 5.15 5.23 5.30 5.38 5.46 5.54 5.62 5.700.11 5.79 5.87 5.95 6.03 6.12 6.20 6.28 6.37 6.45 6.540.12 6.62 6.71 6.79 6.88 6.97 7.05 7.14 7.23 7.32 7.410.13 7.50 7.59 7.68 7.77 7.86 7.95 8.04 8.13 8.22 8.320.14 8.41 8.50 8.60 8.69 8.78 8.88 8.97 9.07 9.16 9.260.15 9.36 9.45 9.55 9.65 9.75 9.85 9.94 10.04 10.14 10.240.16 10.34 10.44 10.54 10.64 10.75 10.85 10.95 11.05 11.15 11.260.17 11.36 11.46 11.57 11.67 11.78 11.88 11.99 12.09 12.20 12.310.18 12.41 12.52 12.63 12.74 12.84 12.95 13.06 13.17 13.28 13.390.19 13.50 13.61 13.72 13.83 13.94 14.05 14.16 14.28 14.39 14.500.20 14.62 14.73 14.84 14.96 15.07 15.19 15.30 15.42 15.53 15.650.21 15.76 15.88 16.00 16.11 16.23 16.35 16.47 16.59 16.70 16.820.22 16.94 17.06 17.18 17.30 17.42 17.54 17.66 17.79 17.91 18.030.23 18.15 18.27 18.40 18.52 18.64 18.77 18.89 19.01 19.14 19.260.24 19.39 19.51 19.64 19.77 19.89 20.02 20.15 20.27 20.40 20.530.25 20.66 20.78 20.91 21.04 21.17 21.30 21.43 21.56 21.69 21.820.26 21.95 22.08 22.21 22.34 22.48 22.61 22.74 22.87 23.01 23.140.27 23.27 23.41 23.54 23.67 23.81 23.94 24.08 24.21 24.35 24.490.28 24.62 24.76 24.89 25.03 25.17 25.31 25.44 25.58 25.72 25.860.29 26.00 26.14 26.28 26.42 26.56 26.70 26.84 26.98 27.12 27.260.30 27.40 27.54 27.68 27.83 27.97 28.11 28.25 28.40 28.54 28.680.31 28.83 28.97 29.12 29.26 29.41 29.55 29.70 29.84 29.99 30.140.32 30.28 30.43 30.58 30.72 30.87 31.02 31.17 31.32 31.46 31.610.33 31.76 31.91 32.06 32.21 32.36 32.51 32.66 32.81 32.96 33.12

Appendix V. Discharge Tables for Rated Structures
November 2, 1998 255
Table V- 5. 6" Montana Flume - under free-flow discharge in L/s.
Computed from the Formula Q = 0.3812ha1.580
Head 0.0 0.001 0.002 0.003 0.004 0.005 0.006 0.007 0.008 0.0090.03 1.5 1.6 1.7 1.7 1.8 1.9 2.0 2.1 2.2 2.30.04 2.4 2.5 2.5 2.6 2.7 2.8 2.9 3.0 3.1 3.20.05 3.4 3.5 3.6 3.7 3.8 3.9 4.0 4.1 4.2 4.40.06 4.5 4.6 4.7 4.8 5.0 5.1 5.2 5.3 5.5 5.60.07 5.7 5.8 6.0 6.1 6.2 6.4 6.5 6.6 6.8 6.90.08 7.0 7.2 7.3 7.5 7.6 7.8 7.9 8.0 8.2 8.30.09 8.5 8.6 8.8 8.9 9.1 9.2 9.4 9.6 9.7 9.90.10 10.0 10.2 10.3 10.5 10.7 10.8 11.0 11.2 11.3 11.50.11 11.7 11.8 12.0 12.2 12.3 12.5 12.7 12.8 13.0 13.20.12 13.4 13.6 13.7 13.9 14.1 14.3 14.4 14.6 14.8 15.00.13 15.2 15.4 15.5 15.7 15.9 16.1 16.3 16.5 16.7 16.90.14 17.1 17.3 17.4 17.6 17.8 18.0 18.2 18.4 18.6 18.80.15 19.0 19.2 19.4 19.6 19.8 20.0 20.2 20.4 20.7 20.90.16 21.1 21.3 21.5 21.7 21.9 22.1 22.3 22.5 22.8 23.00.17 23.2 23.4 23.6 23.8 24.1 24.3 24.5 24.7 24.9 25.20.18 25.4 25.6 25.8 26.1 26.3 26.5 26.7 27.0 27.2 27.40.19 27.6 27.9 28.1 28.3 28.6 28.8 29.0 29.3 29.5 29.70.20 30.0 30.2 30.5 30.7 30.9 31.2 31.4 31.7 31.9 32.10.21 32.4 32.6 32.9 33.1 33.4 33.6 33.9 34.1 34.3 34.60.22 34.8 35.1 35.4 35.6 35.9 36.1 36.4 36.6 36.9 37.10.23 37.4 37.6 37.9 38.2 38.4 38.7 38.9 39.2 39.5 39.70.24 40.0 40.2 40.5 40.8 41.0 41.3 41.6 41.8 42.1 42.40.25 42.6 42.9 43.2 43.5 43.7 44.0 44.3 44.5 44.8 45.10.26 45.4 45.7 45.9 46.2 46.5 46.8 47.0 47.3 47.6 47.90.27 48.2 48.4 48.7 49.0 49.3 49.6 49.9 50.1 50.4 50.70.28 51.0 51.3 51.6 51.9 52.2 52.5 52.7 53.0 53.3 53.60.29 53.9 54.2 54.5 54.8 55.1 55.4 55.7 56.0 56.3 56.60.30 56.9 57.2 57.5 57.8 58.1 58.4 58.7 59.0 59.3 59.60.31 59.9 60.2 60.5 60.8 61.1 61.4 61.8 62.1 62.4 62.70.32 63.0 63.3 63.6 63.9 64.2 64.6 64.9 65.2 65.5 65.80.33 66.1 66.4 66.8 67.1 67.4 67.7 68.0 68.4 68.7 69.00.34 69.3 69.6 70.0 70.3 70.6 70.9 71.3 71.6 71.9 72.20.35 72.6 72.9 73.2 73.6 73.9 74.2 74.5 74.9 75.2 75.50.36 75.9 76.2 76.5 76.9 77.2 77.5 77.9 78.2 78.6 78.90.37 79.2 79.6 79.9 80.3 80.6 80.9 81.3 81.6 82.0 82.30.38 82.6 83.0 83.3 83.7 84.0 84.4 84.7 85.1 85.4 85.80.39 86.1 86.5 86.8 87.2 87.5 87.9 88.2 88.6 88.9 89.30.40 89.6 90.0 90.3 90.7 91.0 91.4 91.8 92.1 92.5 92.80.41 93.2 93.5 93.9 94.3 94.6 95.0 95.3 95.7 96.1 96.40.42 96.8 97.2 97.5 97.9 98.3 98.6 99.0 99.4 99.7 100.10.43 100.5 100.8 101.2 101.6 101.9 102.3 102.7 103.1 103.4 103.80.44 104.2 104.6 104.9 105.3 105.7 106.1 106.4 106.8 107.2 107.60.45 108.0 108.3 108.7 109.1 109.5 109.9 110.2 110.6 111.0 111.4
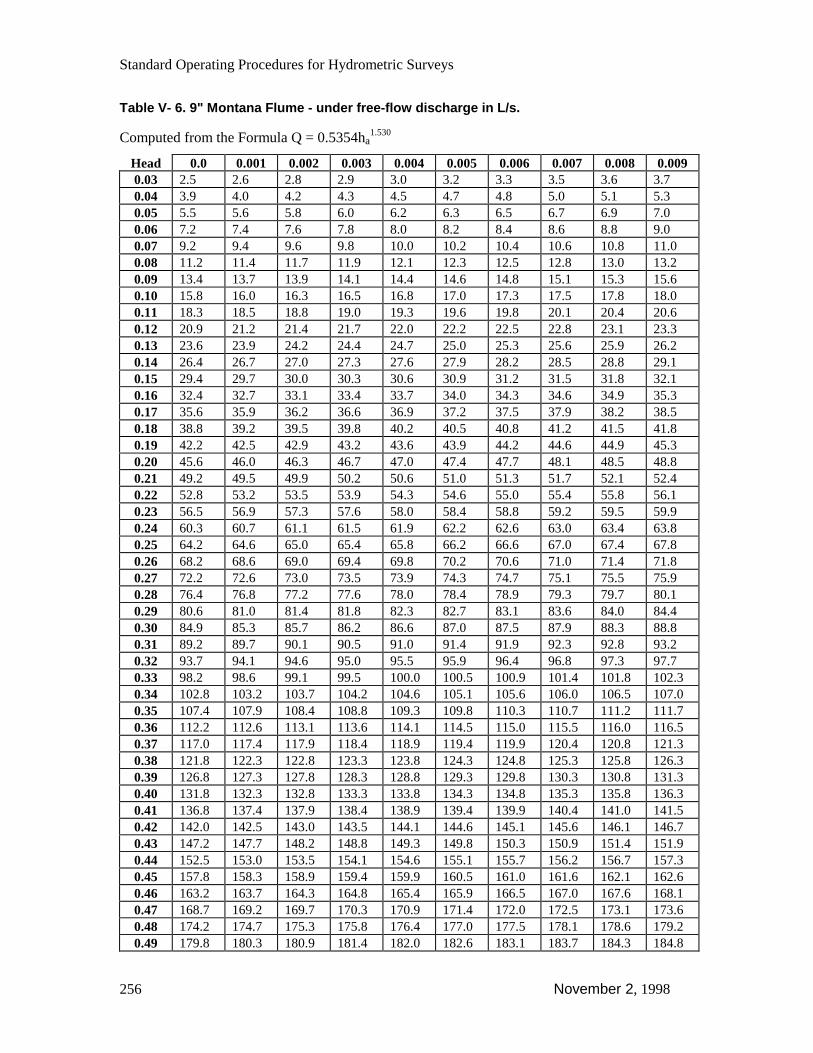
Standard Operating Procedures for Hydrometric Surveys
256 November 2, 1998
Table V- 6. 9" Montana Flume - under free-flow discharge in L/s.
Computed from the Formula Q = 0.5354ha1.530
Head 0.0 0.001 0.002 0.003 0.004 0.005 0.006 0.007 0.008 0.0090.03 2.5 2.6 2.8 2.9 3.0 3.2 3.3 3.5 3.6 3.70.04 3.9 4.0 4.2 4.3 4.5 4.7 4.8 5.0 5.1 5.30.05 5.5 5.6 5.8 6.0 6.2 6.3 6.5 6.7 6.9 7.00.06 7.2 7.4 7.6 7.8 8.0 8.2 8.4 8.6 8.8 9.00.07 9.2 9.4 9.6 9.8 10.0 10.2 10.4 10.6 10.8 11.00.08 11.2 11.4 11.7 11.9 12.1 12.3 12.5 12.8 13.0 13.20.09 13.4 13.7 13.9 14.1 14.4 14.6 14.8 15.1 15.3 15.60.10 15.8 16.0 16.3 16.5 16.8 17.0 17.3 17.5 17.8 18.00.11 18.3 18.5 18.8 19.0 19.3 19.6 19.8 20.1 20.4 20.60.12 20.9 21.2 21.4 21.7 22.0 22.2 22.5 22.8 23.1 23.30.13 23.6 23.9 24.2 24.4 24.7 25.0 25.3 25.6 25.9 26.20.14 26.4 26.7 27.0 27.3 27.6 27.9 28.2 28.5 28.8 29.10.15 29.4 29.7 30.0 30.3 30.6 30.9 31.2 31.5 31.8 32.10.16 32.4 32.7 33.1 33.4 33.7 34.0 34.3 34.6 34.9 35.30.17 35.6 35.9 36.2 36.6 36.9 37.2 37.5 37.9 38.2 38.50.18 38.8 39.2 39.5 39.8 40.2 40.5 40.8 41.2 41.5 41.80.19 42.2 42.5 42.9 43.2 43.6 43.9 44.2 44.6 44.9 45.30.20 45.6 46.0 46.3 46.7 47.0 47.4 47.7 48.1 48.5 48.80.21 49.2 49.5 49.9 50.2 50.6 51.0 51.3 51.7 52.1 52.40.22 52.8 53.2 53.5 53.9 54.3 54.6 55.0 55.4 55.8 56.10.23 56.5 56.9 57.3 57.6 58.0 58.4 58.8 59.2 59.5 59.90.24 60.3 60.7 61.1 61.5 61.9 62.2 62.6 63.0 63.4 63.80.25 64.2 64.6 65.0 65.4 65.8 66.2 66.6 67.0 67.4 67.80.26 68.2 68.6 69.0 69.4 69.8 70.2 70.6 71.0 71.4 71.80.27 72.2 72.6 73.0 73.5 73.9 74.3 74.7 75.1 75.5 75.90.28 76.4 76.8 77.2 77.6 78.0 78.4 78.9 79.3 79.7 80.10.29 80.6 81.0 81.4 81.8 82.3 82.7 83.1 83.6 84.0 84.40.30 84.9 85.3 85.7 86.2 86.6 87.0 87.5 87.9 88.3 88.80.31 89.2 89.7 90.1 90.5 91.0 91.4 91.9 92.3 92.8 93.20.32 93.7 94.1 94.6 95.0 95.5 95.9 96.4 96.8 97.3 97.70.33 98.2 98.6 99.1 99.5 100.0 100.5 100.9 101.4 101.8 102.30.34 102.8 103.2 103.7 104.2 104.6 105.1 105.6 106.0 106.5 107.00.35 107.4 107.9 108.4 108.8 109.3 109.8 110.3 110.7 111.2 111.70.36 112.2 112.6 113.1 113.6 114.1 114.5 115.0 115.5 116.0 116.50.37 117.0 117.4 117.9 118.4 118.9 119.4 119.9 120.4 120.8 121.30.38 121.8 122.3 122.8 123.3 123.8 124.3 124.8 125.3 125.8 126.30.39 126.8 127.3 127.8 128.3 128.8 129.3 129.8 130.3 130.8 131.30.40 131.8 132.3 132.8 133.3 133.8 134.3 134.8 135.3 135.8 136.30.41 136.8 137.4 137.9 138.4 138.9 139.4 139.9 140.4 141.0 141.50.42 142.0 142.5 143.0 143.5 144.1 144.6 145.1 145.6 146.1 146.70.43 147.2 147.7 148.2 148.8 149.3 149.8 150.3 150.9 151.4 151.90.44 152.5 153.0 153.5 154.1 154.6 155.1 155.7 156.2 156.7 157.30.45 157.8 158.3 158.9 159.4 159.9 160.5 161.0 161.6 162.1 162.60.46 163.2 163.7 164.3 164.8 165.4 165.9 166.5 167.0 167.6 168.10.47 168.7 169.2 169.7 170.3 170.9 171.4 172.0 172.5 173.1 173.60.48 174.2 174.7 175.3 175.8 176.4 177.0 177.5 178.1 178.6 179.20.49 179.8 180.3 180.9 181.4 182.0 182.6 183.1 183.7 184.3 184.8
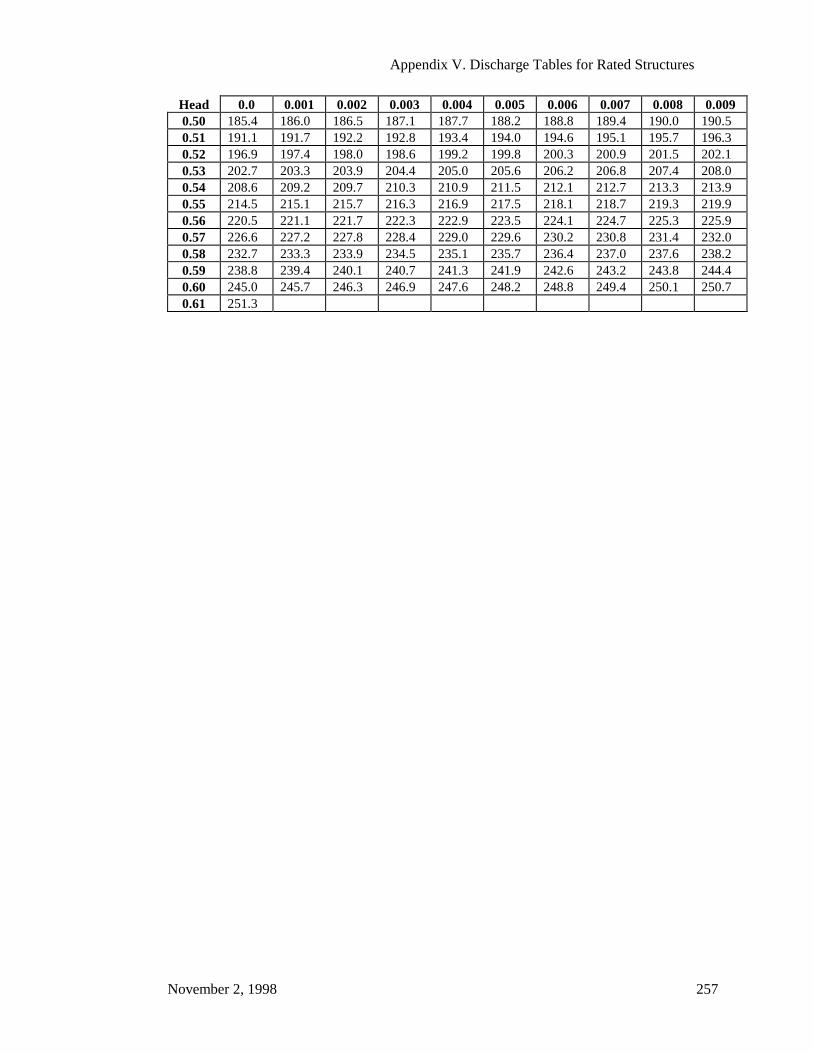
Appendix V. Discharge Tables for Rated Structures
November 2, 1998 257
Head 0.0 0.001 0.002 0.003 0.004 0.005 0.006 0.007 0.008 0.0090.50 185.4 186.0 186.5 187.1 187.7 188.2 188.8 189.4 190.0 190.50.51 191.1 191.7 192.2 192.8 193.4 194.0 194.6 195.1 195.7 196.30.52 196.9 197.4 198.0 198.6 199.2 199.8 200.3 200.9 201.5 202.10.53 202.7 203.3 203.9 204.4 205.0 205.6 206.2 206.8 207.4 208.00.54 208.6 209.2 209.7 210.3 210.9 211.5 212.1 212.7 213.3 213.90.55 214.5 215.1 215.7 216.3 216.9 217.5 218.1 218.7 219.3 219.90.56 220.5 221.1 221.7 222.3 222.9 223.5 224.1 224.7 225.3 225.90.57 226.6 227.2 227.8 228.4 229.0 229.6 230.2 230.8 231.4 232.00.58 232.7 233.3 233.9 234.5 235.1 235.7 236.4 237.0 237.6 238.20.59 238.8 239.4 240.1 240.7 241.3 241.9 242.6 243.2 243.8 244.40.60 245.0 245.7 246.3 246.9 247.6 248.2 248.8 249.4 250.1 250.70.61 251.3
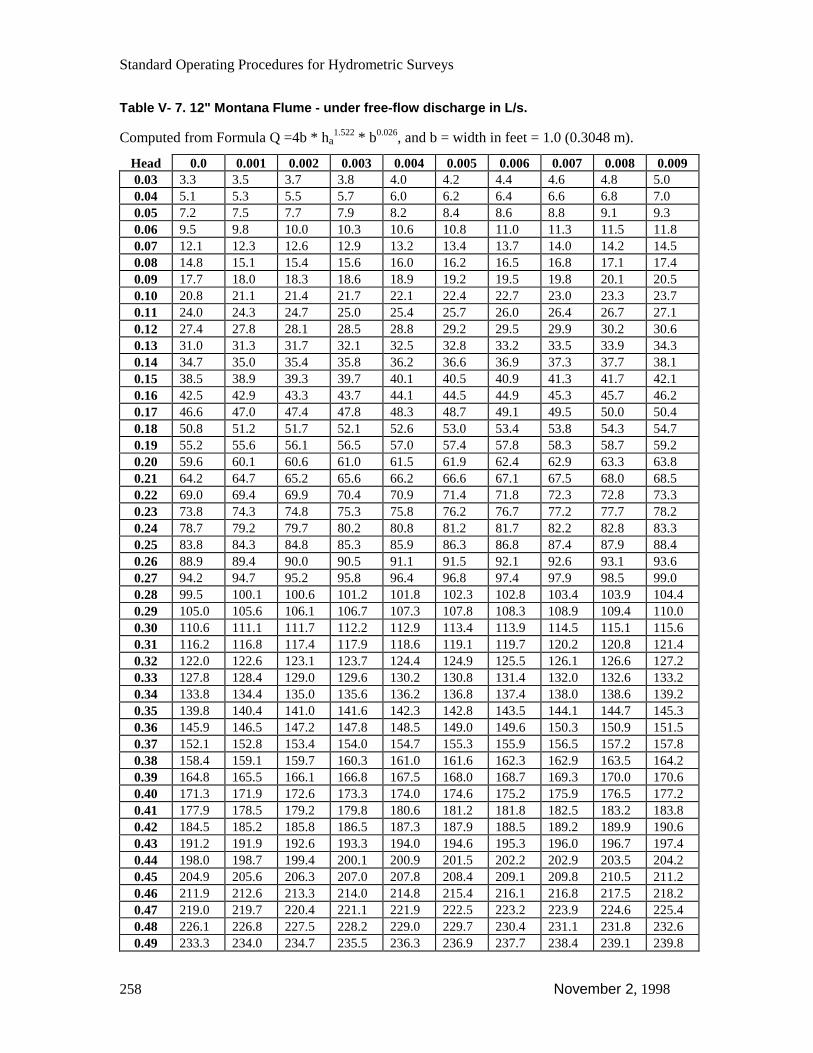
Standard Operating Procedures for Hydrometric Surveys
258 November 2, 1998
Table V- 7. 12" Montana Flume - under free-flow discharge in L/s.
Computed from Formula Q =4b * ha1.522 * b0.026, and b = width in feet = 1.0 (0.3048 m).
Head 0.0 0.001 0.002 0.003 0.004 0.005 0.006 0.007 0.008 0.0090.03 3.3 3.5 3.7 3.8 4.0 4.2 4.4 4.6 4.8 5.00.04 5.1 5.3 5.5 5.7 6.0 6.2 6.4 6.6 6.8 7.00.05 7.2 7.5 7.7 7.9 8.2 8.4 8.6 8.8 9.1 9.30.06 9.5 9.8 10.0 10.3 10.6 10.8 11.0 11.3 11.5 11.80.07 12.1 12.3 12.6 12.9 13.2 13.4 13.7 14.0 14.2 14.50.08 14.8 15.1 15.4 15.6 16.0 16.2 16.5 16.8 17.1 17.40.09 17.7 18.0 18.3 18.6 18.9 19.2 19.5 19.8 20.1 20.50.10 20.8 21.1 21.4 21.7 22.1 22.4 22.7 23.0 23.3 23.70.11 24.0 24.3 24.7 25.0 25.4 25.7 26.0 26.4 26.7 27.10.12 27.4 27.8 28.1 28.5 28.8 29.2 29.5 29.9 30.2 30.60.13 31.0 31.3 31.7 32.1 32.5 32.8 33.2 33.5 33.9 34.30.14 34.7 35.0 35.4 35.8 36.2 36.6 36.9 37.3 37.7 38.10.15 38.5 38.9 39.3 39.7 40.1 40.5 40.9 41.3 41.7 42.10.16 42.5 42.9 43.3 43.7 44.1 44.5 44.9 45.3 45.7 46.20.17 46.6 47.0 47.4 47.8 48.3 48.7 49.1 49.5 50.0 50.40.18 50.8 51.2 51.7 52.1 52.6 53.0 53.4 53.8 54.3 54.70.19 55.2 55.6 56.1 56.5 57.0 57.4 57.8 58.3 58.7 59.20.20 59.6 60.1 60.6 61.0 61.5 61.9 62.4 62.9 63.3 63.80.21 64.2 64.7 65.2 65.6 66.2 66.6 67.1 67.5 68.0 68.50.22 69.0 69.4 69.9 70.4 70.9 71.4 71.8 72.3 72.8 73.30.23 73.8 74.3 74.8 75.3 75.8 76.2 76.7 77.2 77.7 78.20.24 78.7 79.2 79.7 80.2 80.8 81.2 81.7 82.2 82.8 83.30.25 83.8 84.3 84.8 85.3 85.9 86.3 86.8 87.4 87.9 88.40.26 88.9 89.4 90.0 90.5 91.1 91.5 92.1 92.6 93.1 93.60.27 94.2 94.7 95.2 95.8 96.4 96.8 97.4 97.9 98.5 99.00.28 99.5 100.1 100.6 101.2 101.8 102.3 102.8 103.4 103.9 104.40.29 105.0 105.6 106.1 106.7 107.3 107.8 108.3 108.9 109.4 110.00.30 110.6 111.1 111.7 112.2 112.9 113.4 113.9 114.5 115.1 115.60.31 116.2 116.8 117.4 117.9 118.6 119.1 119.7 120.2 120.8 121.40.32 122.0 122.6 123.1 123.7 124.4 124.9 125.5 126.1 126.6 127.20.33 127.8 128.4 129.0 129.6 130.2 130.8 131.4 132.0 132.6 133.20.34 133.8 134.4 135.0 135.6 136.2 136.8 137.4 138.0 138.6 139.20.35 139.8 140.4 141.0 141.6 142.3 142.8 143.5 144.1 144.7 145.30.36 145.9 146.5 147.2 147.8 148.5 149.0 149.6 150.3 150.9 151.50.37 152.1 152.8 153.4 154.0 154.7 155.3 155.9 156.5 157.2 157.80.38 158.4 159.1 159.7 160.3 161.0 161.6 162.3 162.9 163.5 164.20.39 164.8 165.5 166.1 166.8 167.5 168.0 168.7 169.3 170.0 170.60.40 171.3 171.9 172.6 173.3 174.0 174.6 175.2 175.9 176.5 177.20.41 177.9 178.5 179.2 179.8 180.6 181.2 181.8 182.5 183.2 183.80.42 184.5 185.2 185.8 186.5 187.3 187.9 188.5 189.2 189.9 190.60.43 191.2 191.9 192.6 193.3 194.0 194.6 195.3 196.0 196.7 197.40.44 198.0 198.7 199.4 200.1 200.9 201.5 202.2 202.9 203.5 204.20.45 204.9 205.6 206.3 207.0 207.8 208.4 209.1 209.8 210.5 211.20.46 211.9 212.6 213.3 214.0 214.8 215.4 216.1 216.8 217.5 218.20.47 219.0 219.7 220.4 221.1 221.9 222.5 223.2 223.9 224.6 225.40.48 226.1 226.8 227.5 228.2 229.0 229.7 230.4 231.1 231.8 232.60.49 233.3 234.0 234.7 235.5 236.3 236.9 237.7 238.4 239.1 239.8
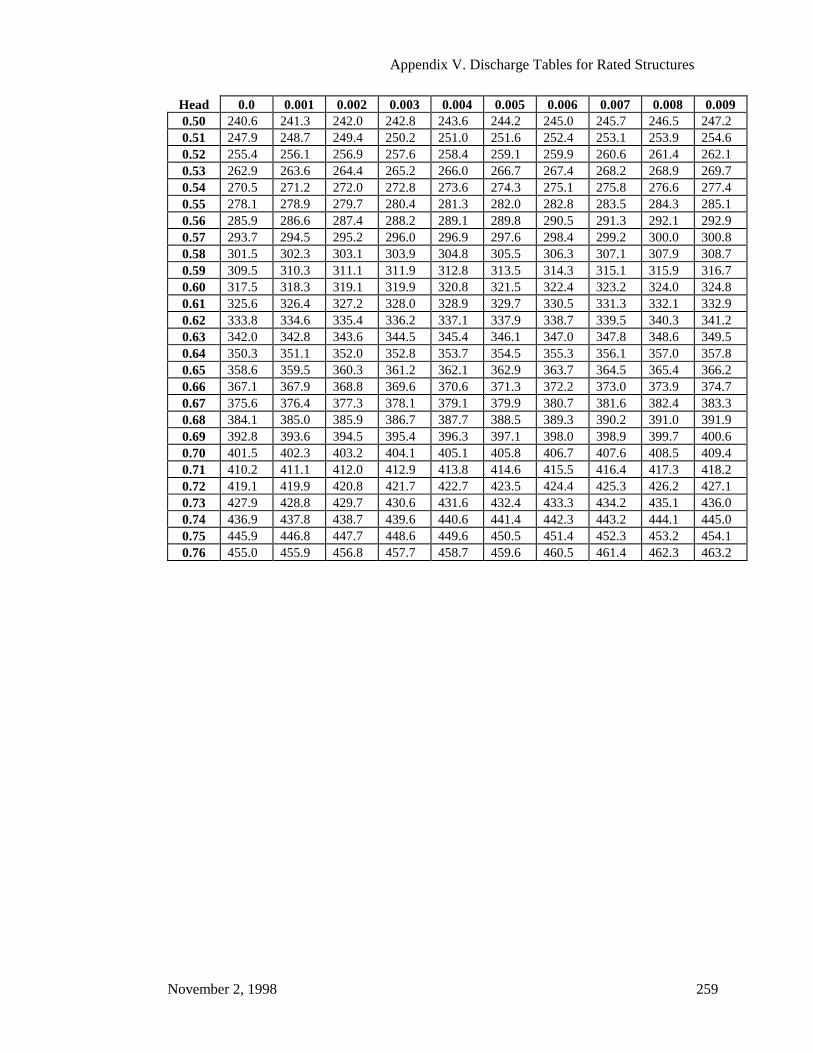
Appendix V. Discharge Tables for Rated Structures
November 2, 1998 259
Head 0.0 0.001 0.002 0.003 0.004 0.005 0.006 0.007 0.008 0.0090.50 240.6 241.3 242.0 242.8 243.6 244.2 245.0 245.7 246.5 247.20.51 247.9 248.7 249.4 250.2 251.0 251.6 252.4 253.1 253.9 254.60.52 255.4 256.1 256.9 257.6 258.4 259.1 259.9 260.6 261.4 262.10.53 262.9 263.6 264.4 265.2 266.0 266.7 267.4 268.2 268.9 269.70.54 270.5 271.2 272.0 272.8 273.6 274.3 275.1 275.8 276.6 277.40.55 278.1 278.9 279.7 280.4 281.3 282.0 282.8 283.5 284.3 285.10.56 285.9 286.6 287.4 288.2 289.1 289.8 290.5 291.3 292.1 292.90.57 293.7 294.5 295.2 296.0 296.9 297.6 298.4 299.2 300.0 300.80.58 301.5 302.3 303.1 303.9 304.8 305.5 306.3 307.1 307.9 308.70.59 309.5 310.3 311.1 311.9 312.8 313.5 314.3 315.1 315.9 316.70.60 317.5 318.3 319.1 319.9 320.8 321.5 322.4 323.2 324.0 324.80.61 325.6 326.4 327.2 328.0 328.9 329.7 330.5 331.3 332.1 332.90.62 333.8 334.6 335.4 336.2 337.1 337.9 338.7 339.5 340.3 341.20.63 342.0 342.8 343.6 344.5 345.4 346.1 347.0 347.8 348.6 349.50.64 350.3 351.1 352.0 352.8 353.7 354.5 355.3 356.1 357.0 357.80.65 358.6 359.5 360.3 361.2 362.1 362.9 363.7 364.5 365.4 366.20.66 367.1 367.9 368.8 369.6 370.6 371.3 372.2 373.0 373.9 374.70.67 375.6 376.4 377.3 378.1 379.1 379.9 380.7 381.6 382.4 383.30.68 384.1 385.0 385.9 386.7 387.7 388.5 389.3 390.2 391.0 391.90.69 392.8 393.6 394.5 395.4 396.3 397.1 398.0 398.9 399.7 400.60.70 401.5 402.3 403.2 404.1 405.1 405.8 406.7 407.6 408.5 409.40.71 410.2 411.1 412.0 412.9 413.8 414.6 415.5 416.4 417.3 418.20.72 419.1 419.9 420.8 421.7 422.7 423.5 424.4 425.3 426.2 427.10.73 427.9 428.8 429.7 430.6 431.6 432.4 433.3 434.2 435.1 436.00.74 436.9 437.8 438.7 439.6 440.6 441.4 442.3 443.2 444.1 445.00.75 445.9 446.8 447.7 448.6 449.6 450.5 451.4 452.3 453.2 454.10.76 455.0 455.9 456.8 457.7 458.7 459.6 460.5 461.4 462.3 463.2
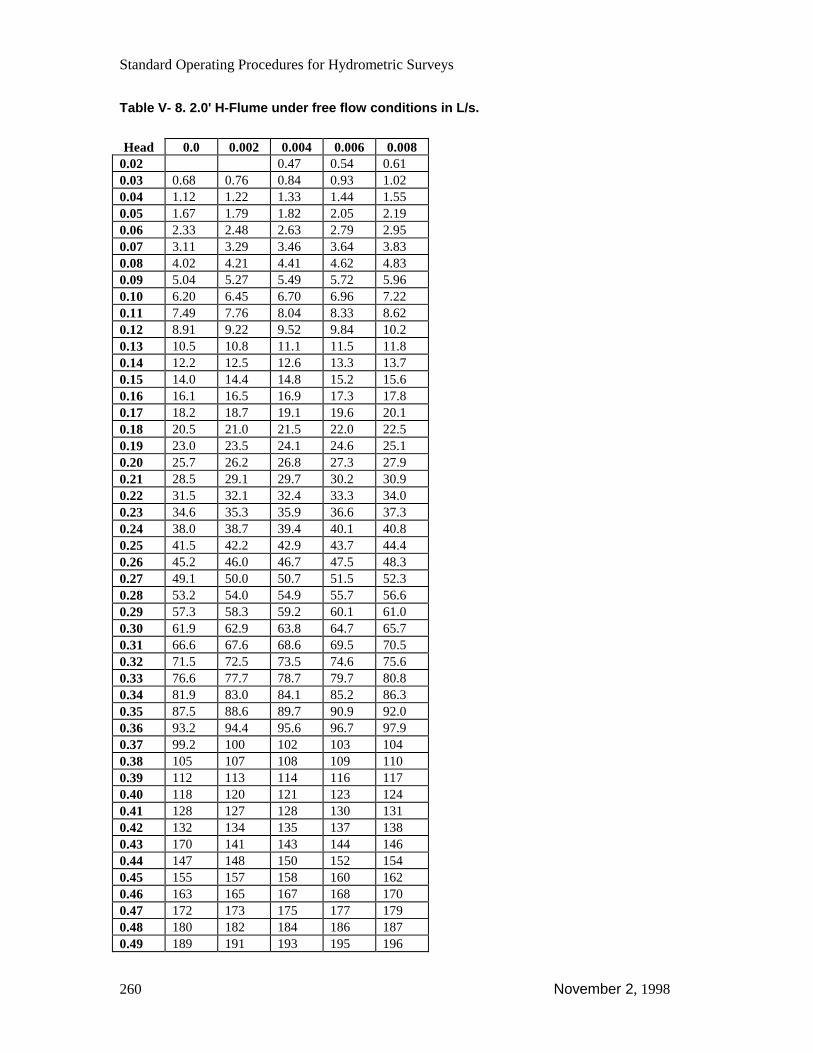
Standard Operating Procedures for Hydrometric Surveys
260 November 2, 1998
Table V- 8. 2.0' H-Flume under free flow conditions in L/s.
Head 0.0 0.002 0.004 0.006 0.0080.02 0.47 0.54 0.610.03 0.68 0.76 0.84 0.93 1.020.04 1.12 1.22 1.33 1.44 1.550.05 1.67 1.79 1.82 2.05 2.190.06 2.33 2.48 2.63 2.79 2.950.07 3.11 3.29 3.46 3.64 3.830.08 4.02 4.21 4.41 4.62 4.830.09 5.04 5.27 5.49 5.72 5.960.10 6.20 6.45 6.70 6.96 7.220.11 7.49 7.76 8.04 8.33 8.620.12 8.91 9.22 9.52 9.84 10.20.13 10.5 10.8 11.1 11.5 11.80.14 12.2 12.5 12.6 13.3 13.70.15 14.0 14.4 14.8 15.2 15.60.16 16.1 16.5 16.9 17.3 17.80.17 18.2 18.7 19.1 19.6 20.10.18 20.5 21.0 21.5 22.0 22.50.19 23.0 23.5 24.1 24.6 25.10.20 25.7 26.2 26.8 27.3 27.90.21 28.5 29.1 29.7 30.2 30.90.22 31.5 32.1 32.4 33.3 34.00.23 34.6 35.3 35.9 36.6 37.30.24 38.0 38.7 39.4 40.1 40.80.25 41.5 42.2 42.9 43.7 44.40.26 45.2 46.0 46.7 47.5 48.30.27 49.1 50.0 50.7 51.5 52.30.28 53.2 54.0 54.9 55.7 56.60.29 57.3 58.3 59.2 60.1 61.00.30 61.9 62.9 63.8 64.7 65.70.31 66.6 67.6 68.6 69.5 70.50.32 71.5 72.5 73.5 74.6 75.60.33 76.6 77.7 78.7 79.7 80.80.34 81.9 83.0 84.1 85.2 86.30.35 87.5 88.6 89.7 90.9 92.00.36 93.2 94.4 95.6 96.7 97.90.37 99.2 100 102 103 1040.38 105 107 108 109 1100.39 112 113 114 116 1170.40 118 120 121 123 1240.41 128 127 128 130 1310.42 132 134 135 137 1380.43 170 141 143 144 1460.44 147 148 150 152 1540.45 155 157 158 160 1620.46 163 165 167 168 1700.47 172 173 175 177 1790.48 180 182 184 186 1870.49 189 191 193 195 196

Appendix V. Discharge Tables for Rated Structures
November 2, 1998 261
Head 0.0 0.002 0.004 0.006 0.0080.50 198 200 202 204 2060.51 208 210 211 213 2150.52 217 219 221 223 2250.53 227 229 231 233 2350.54 237 240 242 244 2460.55 248 250 252 254 2560.56 259 261 263 265 2670.57 270 272 274 276 2790.58 281 283 286 288 2900.59 293 295 297 300 3020.60 305 307 309
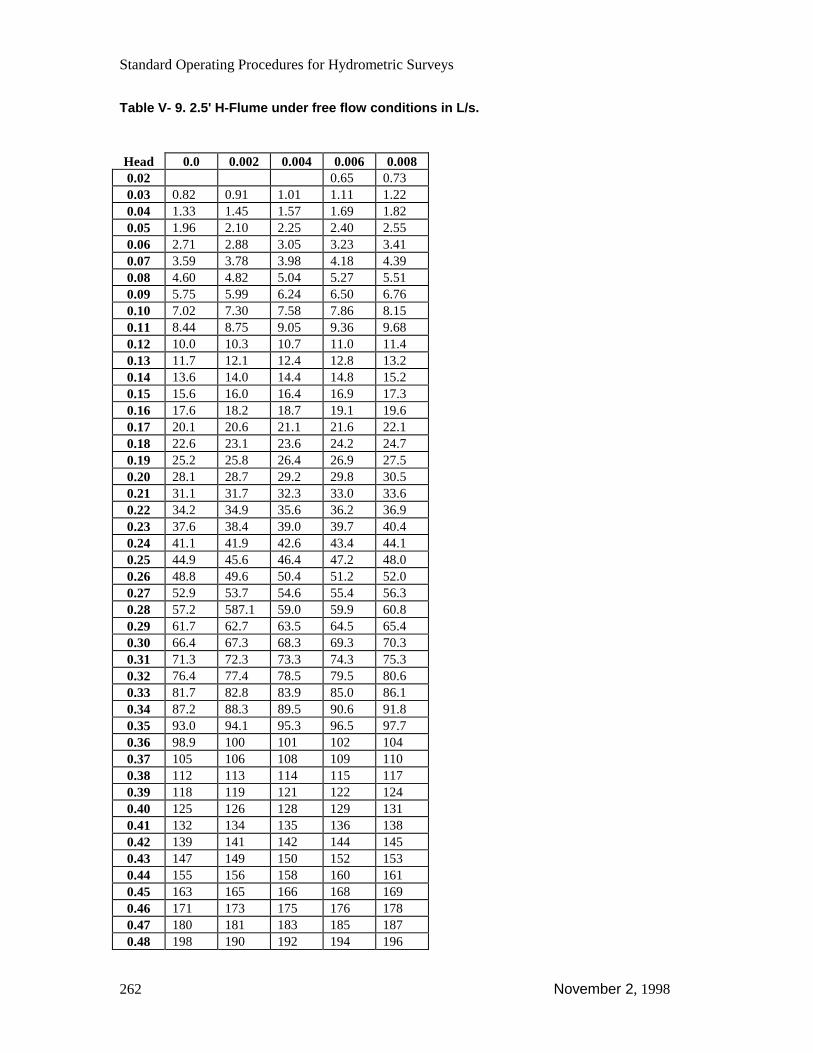
Standard Operating Procedures for Hydrometric Surveys
262 November 2, 1998
Table V- 9. 2.5' H-Flume under free flow conditions in L/s.
Head 0.0 0.002 0.004 0.006 0.0080.02 0.65 0.730.03 0.82 0.91 1.01 1.11 1.220.04 1.33 1.45 1.57 1.69 1.820.05 1.96 2.10 2.25 2.40 2.550.06 2.71 2.88 3.05 3.23 3.410.07 3.59 3.78 3.98 4.18 4.390.08 4.60 4.82 5.04 5.27 5.510.09 5.75 5.99 6.24 6.50 6.760.10 7.02 7.30 7.58 7.86 8.150.11 8.44 8.75 9.05 9.36 9.680.12 10.0 10.3 10.7 11.0 11.40.13 11.7 12.1 12.4 12.8 13.20.14 13.6 14.0 14.4 14.8 15.20.15 15.6 16.0 16.4 16.9 17.30.16 17.6 18.2 18.7 19.1 19.60.17 20.1 20.6 21.1 21.6 22.10.18 22.6 23.1 23.6 24.2 24.70.19 25.2 25.8 26.4 26.9 27.50.20 28.1 28.7 29.2 29.8 30.50.21 31.1 31.7 32.3 33.0 33.60.22 34.2 34.9 35.6 36.2 36.90.23 37.6 38.4 39.0 39.7 40.40.24 41.1 41.9 42.6 43.4 44.10.25 44.9 45.6 46.4 47.2 48.00.26 48.8 49.6 50.4 51.2 52.00.27 52.9 53.7 54.6 55.4 56.30.28 57.2 587.1 59.0 59.9 60.80.29 61.7 62.7 63.5 64.5 65.40.30 66.4 67.3 68.3 69.3 70.30.31 71.3 72.3 73.3 74.3 75.30.32 76.4 77.4 78.5 79.5 80.60.33 81.7 82.8 83.9 85.0 86.10.34 87.2 88.3 89.5 90.6 91.80.35 93.0 94.1 95.3 96.5 97.70.36 98.9 100 101 102 1040.37 105 106 108 109 1100.38 112 113 114 115 1170.39 118 119 121 122 1240.40 125 126 128 129 1310.41 132 134 135 136 1380.42 139 141 142 144 1450.43 147 149 150 152 1530.44 155 156 158 160 1610.45 163 165 166 168 1690.46 171 173 175 176 1780.47 180 181 183 185 1870.48 198 190 192 194 196
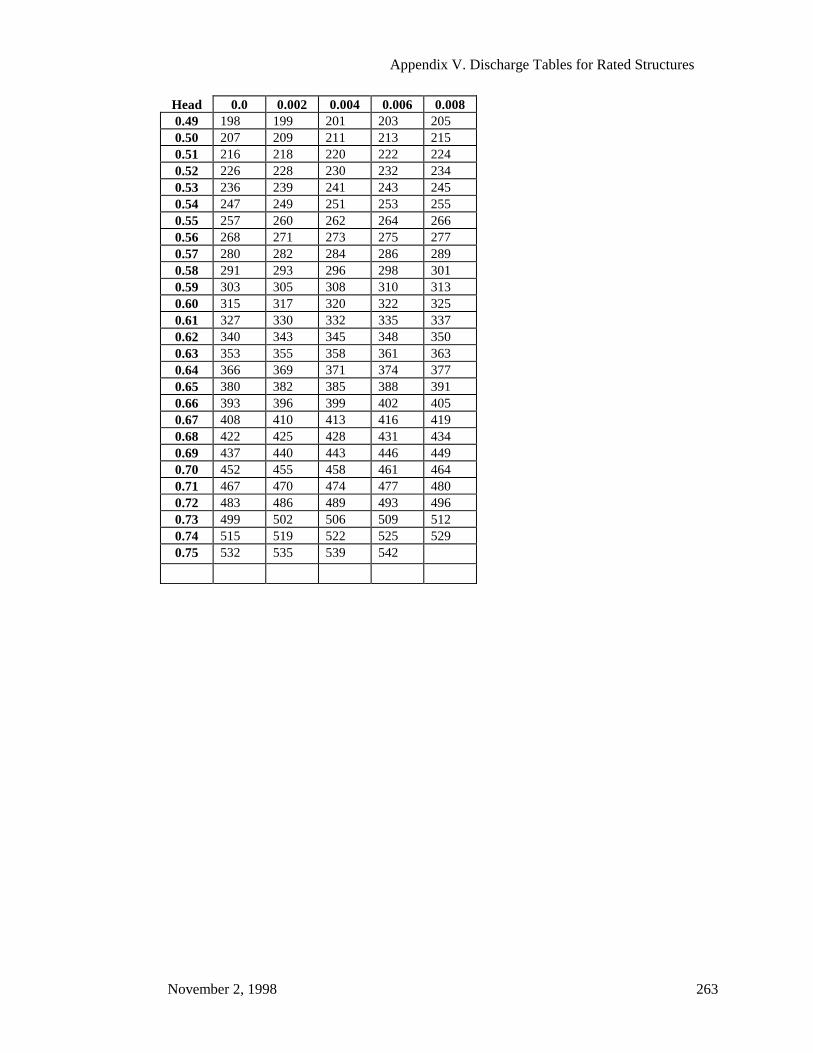
Appendix V. Discharge Tables for Rated Structures
November 2, 1998 263
Head 0.0 0.002 0.004 0.006 0.0080.49 198 199 201 203 2050.50 207 209 211 213 2150.51 216 218 220 222 2240.52 226 228 230 232 2340.53 236 239 241 243 2450.54 247 249 251 253 2550.55 257 260 262 264 2660.56 268 271 273 275 2770.57 280 282 284 286 2890.58 291 293 296 298 3010.59 303 305 308 310 3130.60 315 317 320 322 3250.61 327 330 332 335 3370.62 340 343 345 348 3500.63 353 355 358 361 3630.64 366 369 371 374 3770.65 380 382 385 388 3910.66 393 396 399 402 4050.67 408 410 413 416 4190.68 422 425 428 431 4340.69 437 440 443 446 4490.70 452 455 458 461 4640.71 467 470 474 477 4800.72 483 486 489 493 4960.73 499 502 506 509 5120.74 515 519 522 525 5290.75 532 535 539 542
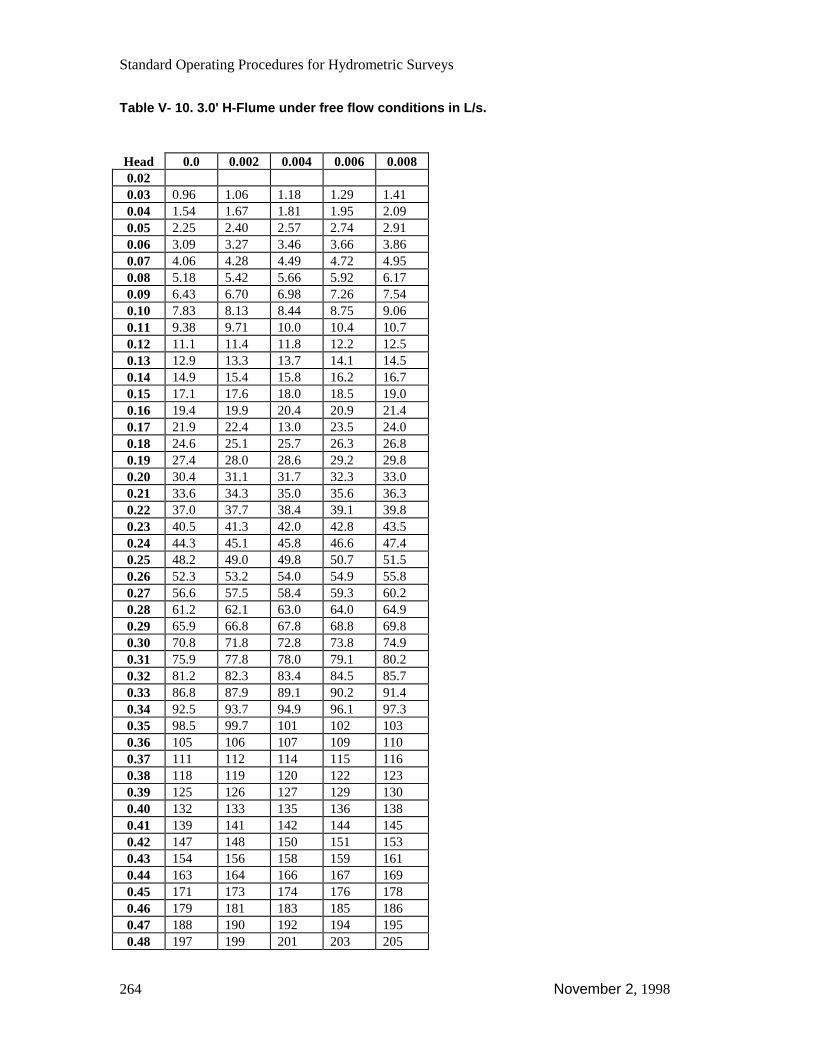
Standard Operating Procedures for Hydrometric Surveys
264 November 2, 1998
Table V- 10. 3.0' H-Flume under free flow conditions in L/s.
Head 0.0 0.002 0.004 0.006 0.0080.020.03 0.96 1.06 1.18 1.29 1.410.04 1.54 1.67 1.81 1.95 2.090.05 2.25 2.40 2.57 2.74 2.910.06 3.09 3.27 3.46 3.66 3.860.07 4.06 4.28 4.49 4.72 4.950.08 5.18 5.42 5.66 5.92 6.170.09 6.43 6.70 6.98 7.26 7.540.10 7.83 8.13 8.44 8.75 9.060.11 9.38 9.71 10.0 10.4 10.70.12 11.1 11.4 11.8 12.2 12.50.13 12.9 13.3 13.7 14.1 14.50.14 14.9 15.4 15.8 16.2 16.70.15 17.1 17.6 18.0 18.5 19.00.16 19.4 19.9 20.4 20.9 21.40.17 21.9 22.4 13.0 23.5 24.00.18 24.6 25.1 25.7 26.3 26.80.19 27.4 28.0 28.6 29.2 29.80.20 30.4 31.1 31.7 32.3 33.00.21 33.6 34.3 35.0 35.6 36.30.22 37.0 37.7 38.4 39.1 39.80.23 40.5 41.3 42.0 42.8 43.50.24 44.3 45.1 45.8 46.6 47.40.25 48.2 49.0 49.8 50.7 51.50.26 52.3 53.2 54.0 54.9 55.80.27 56.6 57.5 58.4 59.3 60.20.28 61.2 62.1 63.0 64.0 64.90.29 65.9 66.8 67.8 68.8 69.80.30 70.8 71.8 72.8 73.8 74.90.31 75.9 77.8 78.0 79.1 80.20.32 81.2 82.3 83.4 84.5 85.70.33 86.8 87.9 89.1 90.2 91.40.34 92.5 93.7 94.9 96.1 97.30.35 98.5 99.7 101 102 1030.36 105 106 107 109 1100.37 111 112 114 115 1160.38 118 119 120 122 1230.39 125 126 127 129 1300.40 132 133 135 136 1380.41 139 141 142 144 1450.42 147 148 150 151 1530.43 154 156 158 159 1610.44 163 164 166 167 1690.45 171 173 174 176 1780.46 179 181 183 185 1860.47 188 190 192 194 1950.48 197 199 201 203 205
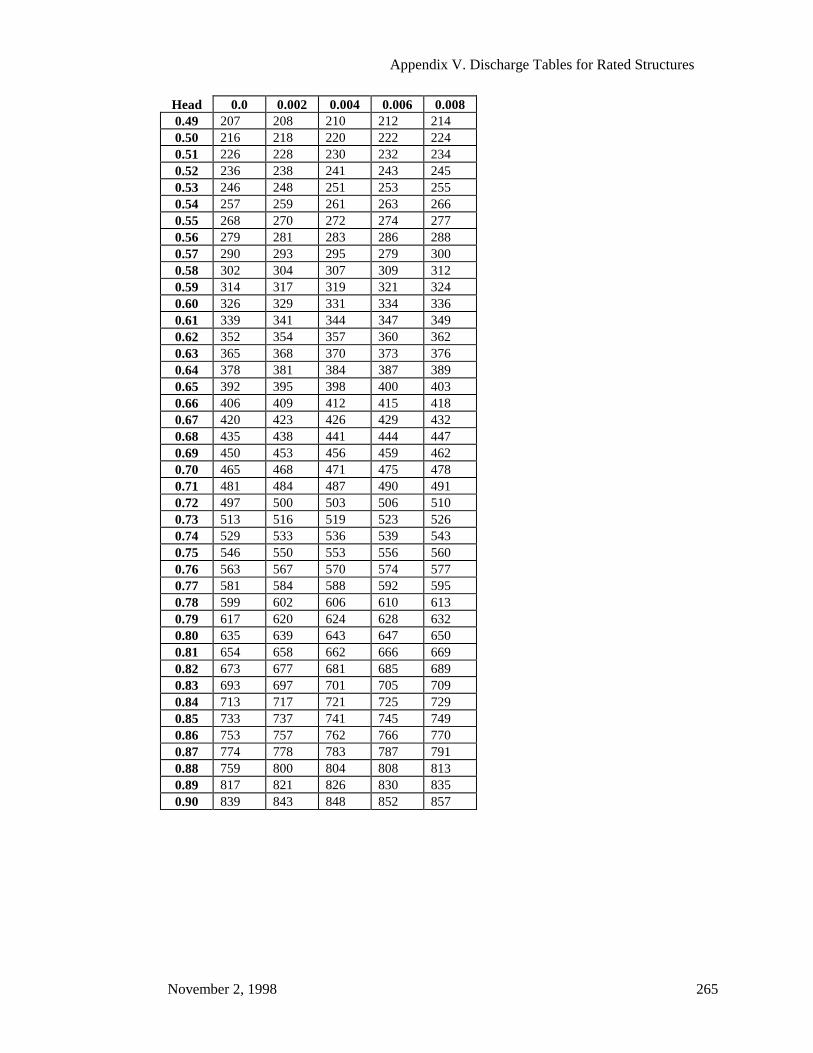
Appendix V. Discharge Tables for Rated Structures
November 2, 1998 265
Head 0.0 0.002 0.004 0.006 0.0080.49 207 208 210 212 2140.50 216 218 220 222 2240.51 226 228 230 232 2340.52 236 238 241 243 2450.53 246 248 251 253 2550.54 257 259 261 263 2660.55 268 270 272 274 2770.56 279 281 283 286 2880.57 290 293 295 279 3000.58 302 304 307 309 3120.59 314 317 319 321 3240.60 326 329 331 334 3360.61 339 341 344 347 3490.62 352 354 357 360 3620.63 365 368 370 373 3760.64 378 381 384 387 3890.65 392 395 398 400 4030.66 406 409 412 415 4180.67 420 423 426 429 4320.68 435 438 441 444 4470.69 450 453 456 459 4620.70 465 468 471 475 4780.71 481 484 487 490 4910.72 497 500 503 506 5100.73 513 516 519 523 5260.74 529 533 536 539 5430.75 546 550 553 556 5600.76 563 567 570 574 5770.77 581 584 588 592 5950.78 599 602 606 610 6130.79 617 620 624 628 6320.80 635 639 643 647 6500.81 654 658 662 666 6690.82 673 677 681 685 6890.83 693 697 701 705 7090.84 713 717 721 725 7290.85 733 737 741 745 7490.86 753 757 762 766 7700.87 774 778 783 787 7910.88 759 800 804 808 8130.89 817 821 826 830 8350.90 839 843 848 852 857
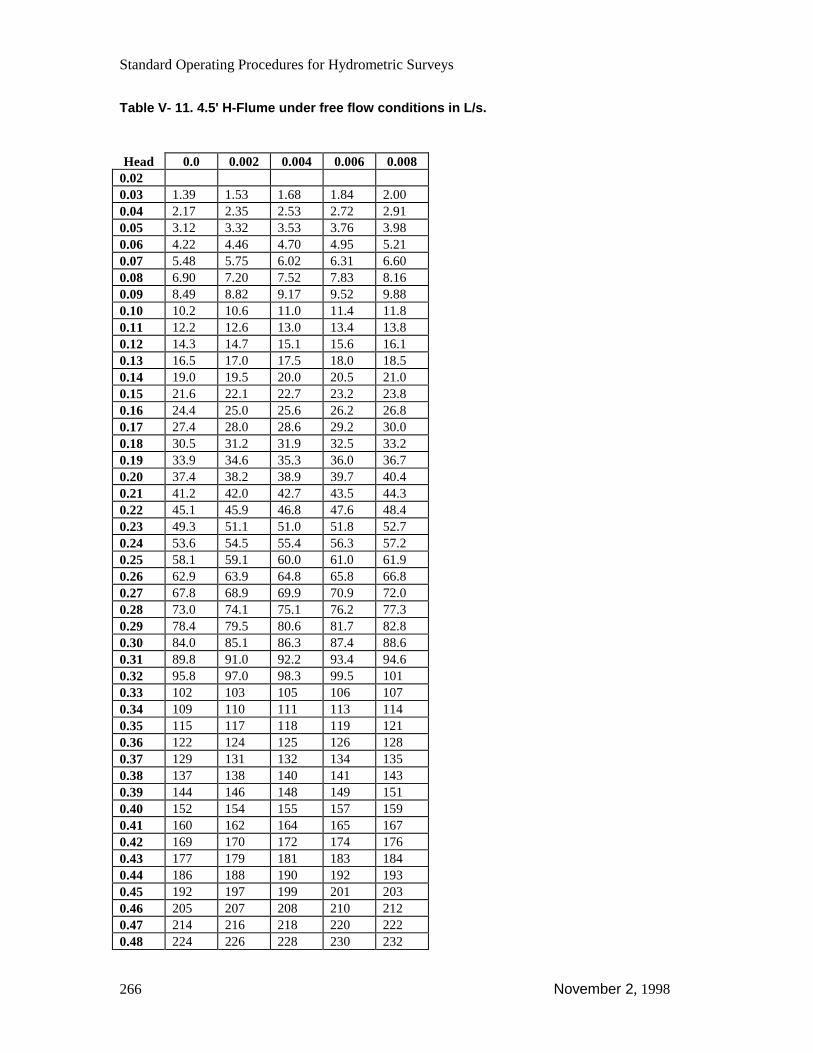
Standard Operating Procedures for Hydrometric Surveys
266 November 2, 1998
Table V- 11. 4.5' H-Flume under free flow conditions in L/s.
Head 0.0 0.002 0.004 0.006 0.0080.020.03 1.39 1.53 1.68 1.84 2.000.04 2.17 2.35 2.53 2.72 2.910.05 3.12 3.32 3.53 3.76 3.980.06 4.22 4.46 4.70 4.95 5.210.07 5.48 5.75 6.02 6.31 6.600.08 6.90 7.20 7.52 7.83 8.160.09 8.49 8.82 9.17 9.52 9.880.10 10.2 10.6 11.0 11.4 11.80.11 12.2 12.6 13.0 13.4 13.80.12 14.3 14.7 15.1 15.6 16.10.13 16.5 17.0 17.5 18.0 18.50.14 19.0 19.5 20.0 20.5 21.00.15 21.6 22.1 22.7 23.2 23.80.16 24.4 25.0 25.6 26.2 26.80.17 27.4 28.0 28.6 29.2 30.00.18 30.5 31.2 31.9 32.5 33.20.19 33.9 34.6 35.3 36.0 36.70.20 37.4 38.2 38.9 39.7 40.40.21 41.2 42.0 42.7 43.5 44.30.22 45.1 45.9 46.8 47.6 48.40.23 49.3 51.1 51.0 51.8 52.70.24 53.6 54.5 55.4 56.3 57.20.25 58.1 59.1 60.0 61.0 61.90.26 62.9 63.9 64.8 65.8 66.80.27 67.8 68.9 69.9 70.9 72.00.28 73.0 74.1 75.1 76.2 77.30.29 78.4 79.5 80.6 81.7 82.80.30 84.0 85.1 86.3 87.4 88.60.31 89.8 91.0 92.2 93.4 94.60.32 95.8 97.0 98.3 99.5 1010.33 102 103 105 106 1070.34 109 110 111 113 1140.35 115 117 118 119 1210.36 122 124 125 126 1280.37 129 131 132 134 1350.38 137 138 140 141 1430.39 144 146 148 149 1510.40 152 154 155 157 1590.41 160 162 164 165 1670.42 169 170 172 174 1760.43 177 179 181 183 1840.44 186 188 190 192 1930.45 192 197 199 201 2030.46 205 207 208 210 2120.47 214 216 218 220 2220.48 224 226 228 230 232
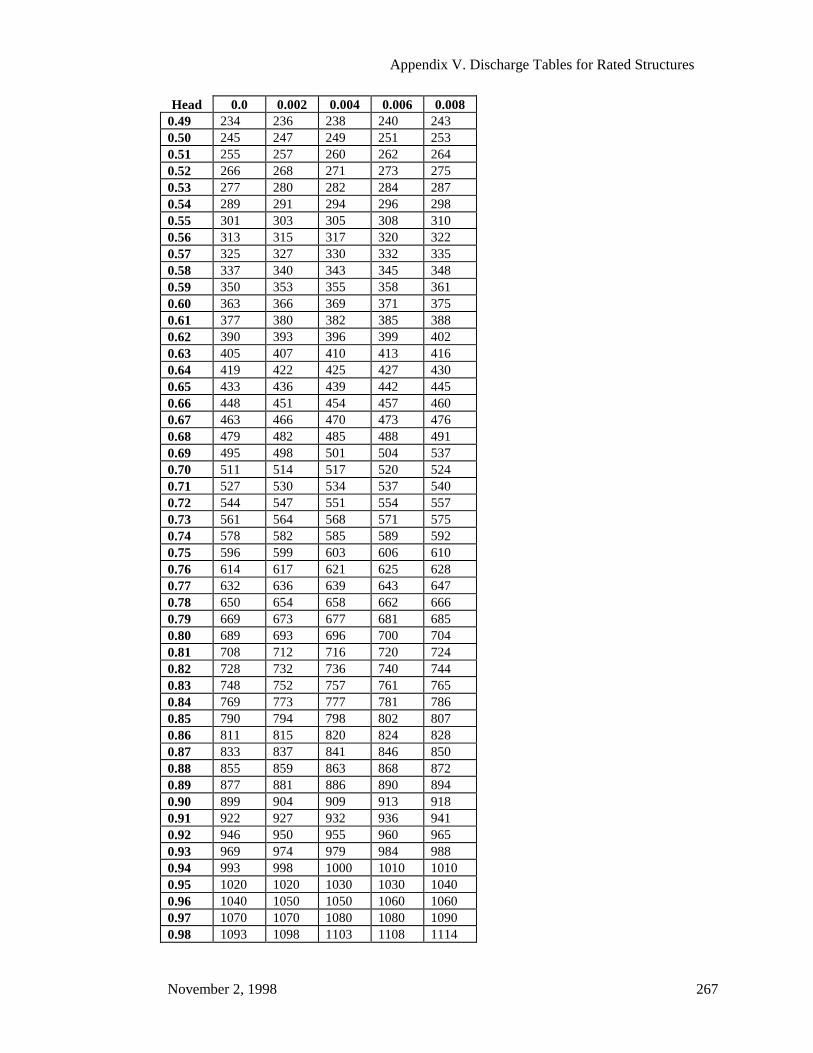
Appendix V. Discharge Tables for Rated Structures
November 2, 1998 267
Head 0.0 0.002 0.004 0.006 0.0080.49 234 236 238 240 2430.50 245 247 249 251 2530.51 255 257 260 262 2640.52 266 268 271 273 2750.53 277 280 282 284 2870.54 289 291 294 296 2980.55 301 303 305 308 3100.56 313 315 317 320 3220.57 325 327 330 332 3350.58 337 340 343 345 3480.59 350 353 355 358 3610.60 363 366 369 371 3750.61 377 380 382 385 3880.62 390 393 396 399 4020.63 405 407 410 413 4160.64 419 422 425 427 4300.65 433 436 439 442 4450.66 448 451 454 457 4600.67 463 466 470 473 4760.68 479 482 485 488 4910.69 495 498 501 504 5370.70 511 514 517 520 5240.71 527 530 534 537 5400.72 544 547 551 554 5570.73 561 564 568 571 5750.74 578 582 585 589 5920.75 596 599 603 606 6100.76 614 617 621 625 6280.77 632 636 639 643 6470.78 650 654 658 662 6660.79 669 673 677 681 6850.80 689 693 696 700 7040.81 708 712 716 720 7240.82 728 732 736 740 7440.83 748 752 757 761 7650.84 769 773 777 781 7860.85 790 794 798 802 8070.86 811 815 820 824 8280.87 833 837 841 846 8500.88 855 859 863 868 8720.89 877 881 886 890 8940.90 899 904 909 913 9180.91 922 927 932 936 9410.92 946 950 955 960 9650.93 969 974 979 984 9880.94 993 998 1000 1010 10100.95 1020 1020 1030 1030 10400.96 1040 1050 1050 1060 10600.97 1070 1070 1080 1080 10900.98 1093 1098 1103 1108 1114
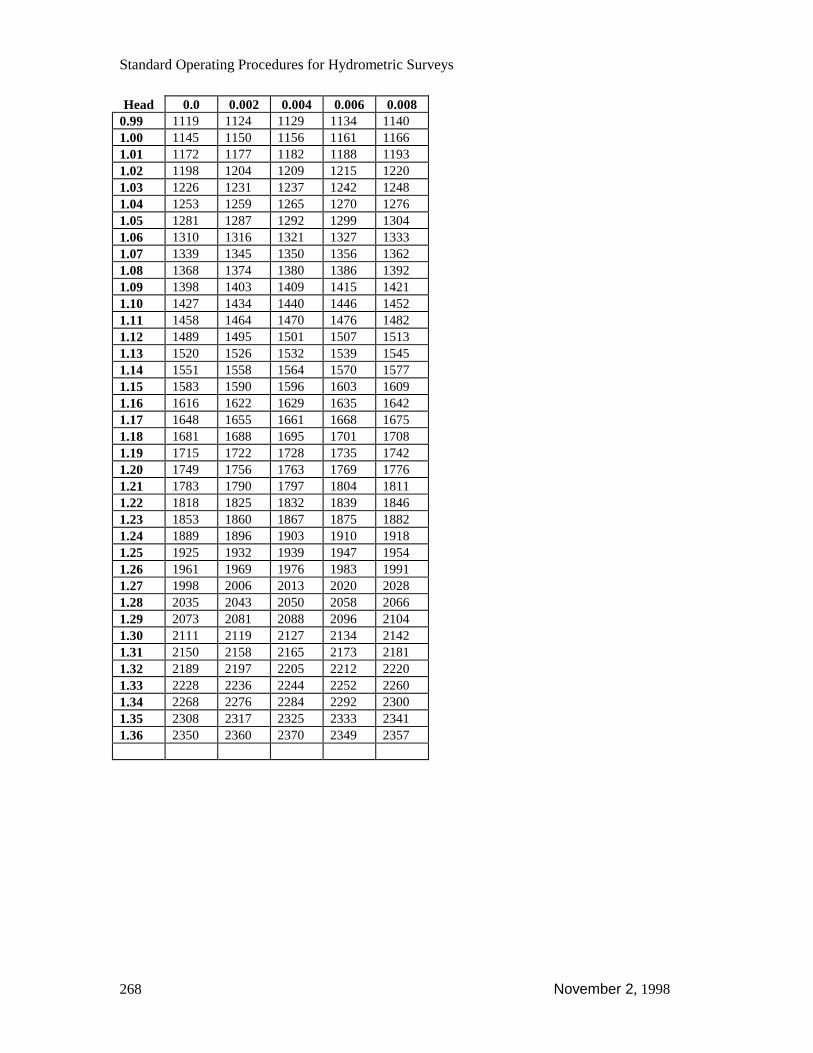
Standard Operating Procedures for Hydrometric Surveys
268 November 2, 1998
Head 0.0 0.002 0.004 0.006 0.0080.99 1119 1124 1129 1134 11401.00 1145 1150 1156 1161 11661.01 1172 1177 1182 1188 11931.02 1198 1204 1209 1215 12201.03 1226 1231 1237 1242 12481.04 1253 1259 1265 1270 12761.05 1281 1287 1292 1299 13041.06 1310 1316 1321 1327 13331.07 1339 1345 1350 1356 13621.08 1368 1374 1380 1386 13921.09 1398 1403 1409 1415 14211.10 1427 1434 1440 1446 14521.11 1458 1464 1470 1476 14821.12 1489 1495 1501 1507 15131.13 1520 1526 1532 1539 15451.14 1551 1558 1564 1570 15771.15 1583 1590 1596 1603 16091.16 1616 1622 1629 1635 16421.17 1648 1655 1661 1668 16751.18 1681 1688 1695 1701 17081.19 1715 1722 1728 1735 17421.20 1749 1756 1763 1769 17761.21 1783 1790 1797 1804 18111.22 1818 1825 1832 1839 18461.23 1853 1860 1867 1875 18821.24 1889 1896 1903 1910 19181.25 1925 1932 1939 1947 19541.26 1961 1969 1976 1983 19911.27 1998 2006 2013 2020 20281.28 2035 2043 2050 2058 20661.29 2073 2081 2088 2096 21041.30 2111 2119 2127 2134 21421.31 2150 2158 2165 2173 21811.32 2189 2197 2205 2212 22201.33 2228 2236 2244 2252 22601.34 2268 2276 2284 2292 23001.35 2308 2317 2325 2333 23411.36 2350 2360 2370 2349 2357
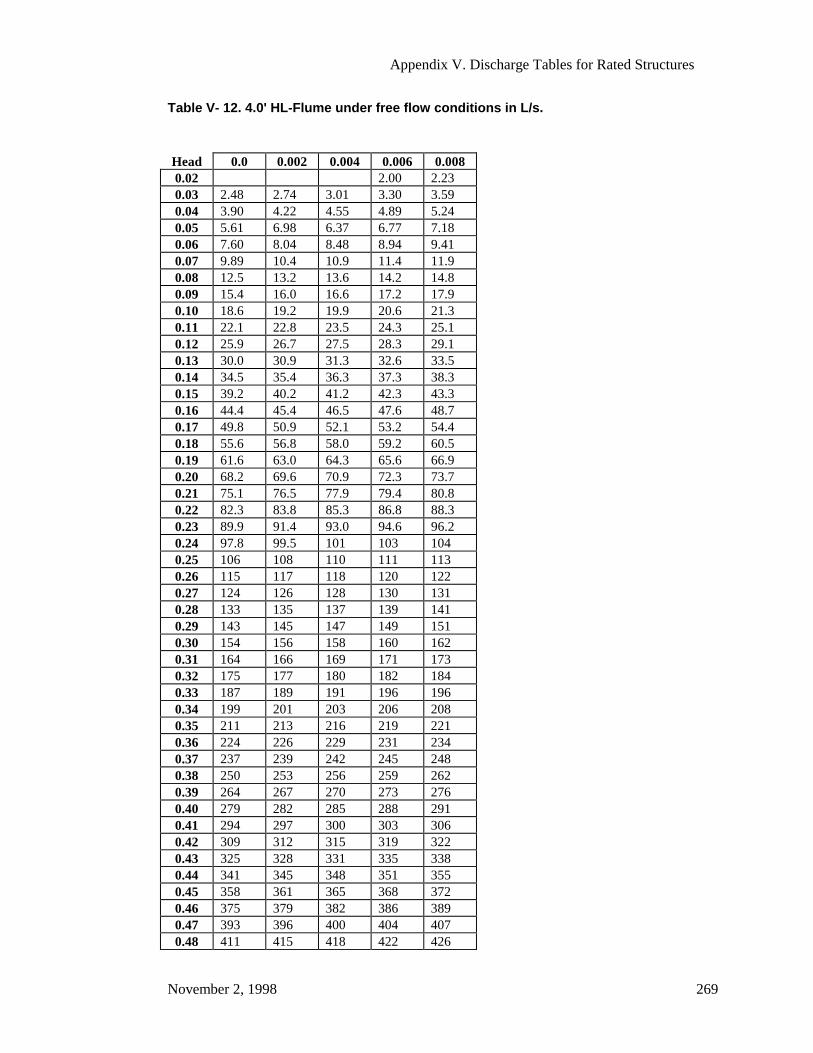
Appendix V. Discharge Tables for Rated Structures
November 2, 1998 269
Table V- 12. 4.0' HL-Flume under free flow conditions in L/s.
Head 0.0 0.002 0.004 0.006 0.0080.02 2.00 2.230.03 2.48 2.74 3.01 3.30 3.590.04 3.90 4.22 4.55 4.89 5.240.05 5.61 6.98 6.37 6.77 7.180.06 7.60 8.04 8.48 8.94 9.410.07 9.89 10.4 10.9 11.4 11.90.08 12.5 13.2 13.6 14.2 14.80.09 15.4 16.0 16.6 17.2 17.90.10 18.6 19.2 19.9 20.6 21.30.11 22.1 22.8 23.5 24.3 25.10.12 25.9 26.7 27.5 28.3 29.10.13 30.0 30.9 31.3 32.6 33.50.14 34.5 35.4 36.3 37.3 38.30.15 39.2 40.2 41.2 42.3 43.30.16 44.4 45.4 46.5 47.6 48.70.17 49.8 50.9 52.1 53.2 54.40.18 55.6 56.8 58.0 59.2 60.50.19 61.6 63.0 64.3 65.6 66.90.20 68.2 69.6 70.9 72.3 73.70.21 75.1 76.5 77.9 79.4 80.80.22 82.3 83.8 85.3 86.8 88.30.23 89.9 91.4 93.0 94.6 96.20.24 97.8 99.5 101 103 1040.25 106 108 110 111 1130.26 115 117 118 120 1220.27 124 126 128 130 1310.28 133 135 137 139 1410.29 143 145 147 149 1510.30 154 156 158 160 1620.31 164 166 169 171 1730.32 175 177 180 182 1840.33 187 189 191 196 1960.34 199 201 203 206 2080.35 211 213 216 219 2210.36 224 226 229 231 2340.37 237 239 242 245 2480.38 250 253 256 259 2620.39 264 267 270 273 2760.40 279 282 285 288 2910.41 294 297 300 303 3060.42 309 312 315 319 3220.43 325 328 331 335 3380.44 341 345 348 351 3550.45 358 361 365 368 3720.46 375 379 382 386 3890.47 393 396 400 404 4070.48 411 415 418 422 426
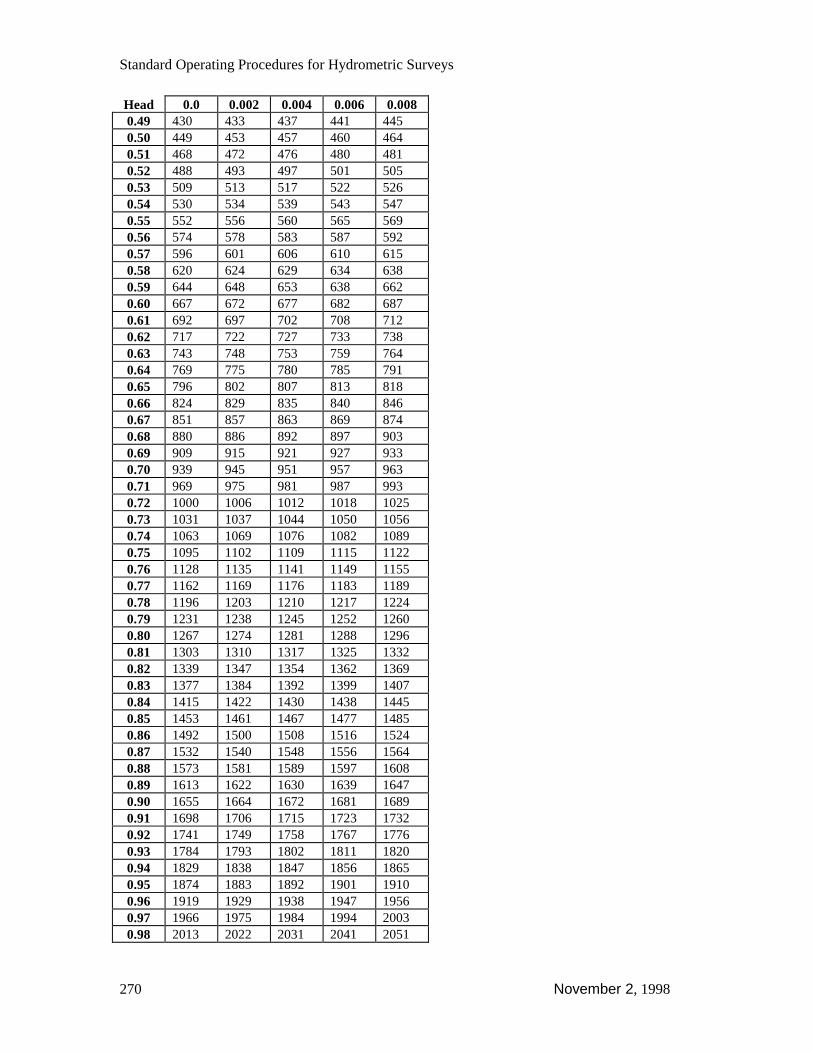
Standard Operating Procedures for Hydrometric Surveys
270 November 2, 1998
Head 0.0 0.002 0.004 0.006 0.0080.49 430 433 437 441 4450.50 449 453 457 460 4640.51 468 472 476 480 4810.52 488 493 497 501 5050.53 509 513 517 522 5260.54 530 534 539 543 5470.55 552 556 560 565 5690.56 574 578 583 587 5920.57 596 601 606 610 6150.58 620 624 629 634 6380.59 644 648 653 638 6620.60 667 672 677 682 6870.61 692 697 702 708 7120.62 717 722 727 733 7380.63 743 748 753 759 7640.64 769 775 780 785 7910.65 796 802 807 813 8180.66 824 829 835 840 8460.67 851 857 863 869 8740.68 880 886 892 897 9030.69 909 915 921 927 9330.70 939 945 951 957 9630.71 969 975 981 987 9930.72 1000 1006 1012 1018 10250.73 1031 1037 1044 1050 10560.74 1063 1069 1076 1082 10890.75 1095 1102 1109 1115 11220.76 1128 1135 1141 1149 11550.77 1162 1169 1176 1183 11890.78 1196 1203 1210 1217 12240.79 1231 1238 1245 1252 12600.80 1267 1274 1281 1288 12960.81 1303 1310 1317 1325 13320.82 1339 1347 1354 1362 13690.83 1377 1384 1392 1399 14070.84 1415 1422 1430 1438 14450.85 1453 1461 1467 1477 14850.86 1492 1500 1508 1516 15240.87 1532 1540 1548 1556 15640.88 1573 1581 1589 1597 16080.89 1613 1622 1630 1639 16470.90 1655 1664 1672 1681 16890.91 1698 1706 1715 1723 17320.92 1741 1749 1758 1767 17760.93 1784 1793 1802 1811 18200.94 1829 1838 1847 1856 18650.95 1874 1883 1892 1901 19100.96 1919 1929 1938 1947 19560.97 1966 1975 1984 1994 20030.98 2013 2022 2031 2041 2051
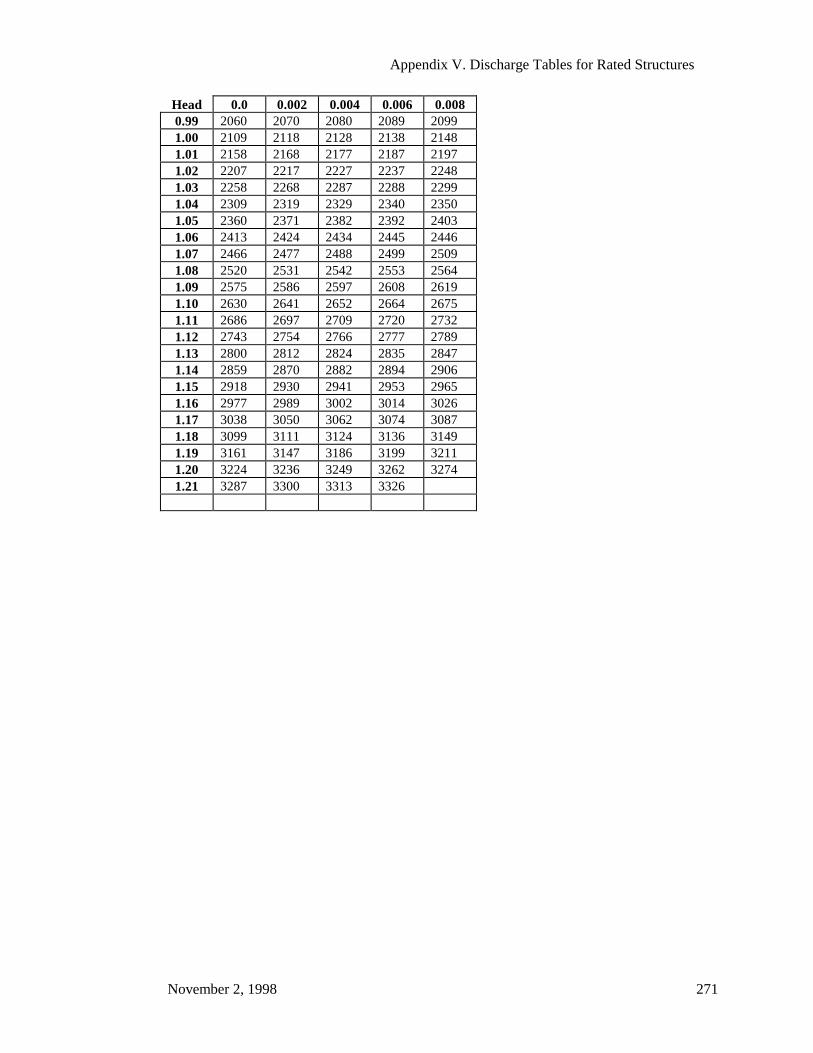
Appendix V. Discharge Tables for Rated Structures
November 2, 1998 271
Head 0.0 0.002 0.004 0.006 0.0080.99 2060 2070 2080 2089 20991.00 2109 2118 2128 2138 21481.01 2158 2168 2177 2187 21971.02 2207 2217 2227 2237 22481.03 2258 2268 2287 2288 22991.04 2309 2319 2329 2340 23501.05 2360 2371 2382 2392 24031.06 2413 2424 2434 2445 24461.07 2466 2477 2488 2499 25091.08 2520 2531 2542 2553 25641.09 2575 2586 2597 2608 26191.10 2630 2641 2652 2664 26751.11 2686 2697 2709 2720 27321.12 2743 2754 2766 2777 27891.13 2800 2812 2824 2835 28471.14 2859 2870 2882 2894 29061.15 2918 2930 2941 2953 29651.16 2977 2989 3002 3014 30261.17 3038 3050 3062 3074 30871.18 3099 3111 3124 3136 31491.19 3161 3147 3186 3199 32111.20 3224 3236 3249 3262 32741.21 3287 3300 3313 3326
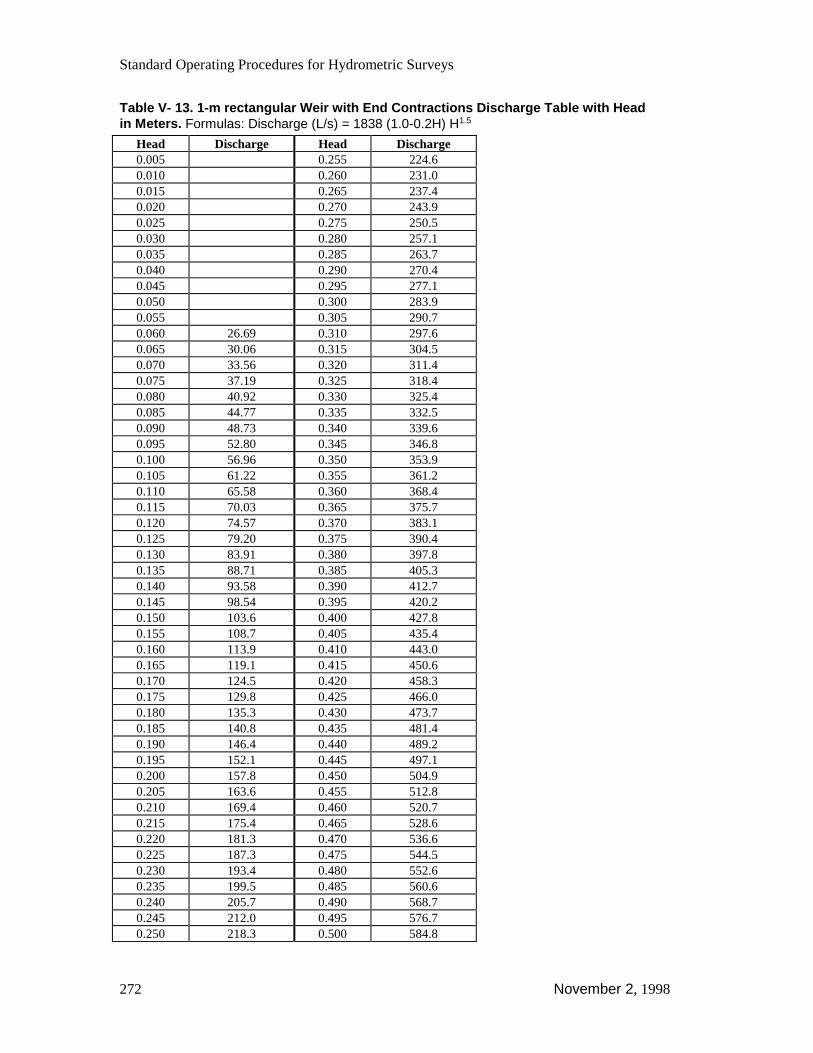
Standard Operating Procedures for Hydrometric Surveys
272 November 2, 1998
Table V- 13. 1-m rectangular Weir with End Contractions Discharge Table with Headin Meters. Formulas: Discharge (L/s) = 1838 (1.0-0.2H) H1.5
Head Discharge Head Discharge0.005 0.255 224.60.010 0.260 231.00.015 0.265 237.40.020 0.270 243.90.025 0.275 250.50.030 0.280 257.10.035 0.285 263.70.040 0.290 270.40.045 0.295 277.10.050 0.300 283.90.055 0.305 290.70.060 26.69 0.310 297.60.065 30.06 0.315 304.50.070 33.56 0.320 311.40.075 37.19 0.325 318.40.080 40.92 0.330 325.40.085 44.77 0.335 332.50.090 48.73 0.340 339.60.095 52.80 0.345 346.80.100 56.96 0.350 353.90.105 61.22 0.355 361.20.110 65.58 0.360 368.40.115 70.03 0.365 375.70.120 74.57 0.370 383.10.125 79.20 0.375 390.40.130 83.91 0.380 397.80.135 88.71 0.385 405.30.140 93.58 0.390 412.70.145 98.54 0.395 420.20.150 103.6 0.400 427.80.155 108.7 0.405 435.40.160 113.9 0.410 443.00.165 119.1 0.415 450.60.170 124.5 0.420 458.30.175 129.8 0.425 466.00.180 135.3 0.430 473.70.185 140.8 0.435 481.40.190 146.4 0.440 489.20.195 152.1 0.445 497.10.200 157.8 0.450 504.90.205 163.6 0.455 512.80.210 169.4 0.460 520.70.215 175.4 0.465 528.60.220 181.3 0.470 536.60.225 187.3 0.475 544.50.230 193.4 0.480 552.60.235 199.5 0.485 560.60.240 205.7 0.490 568.70.245 212.0 0.495 576.70.250 218.3 0.500 584.8
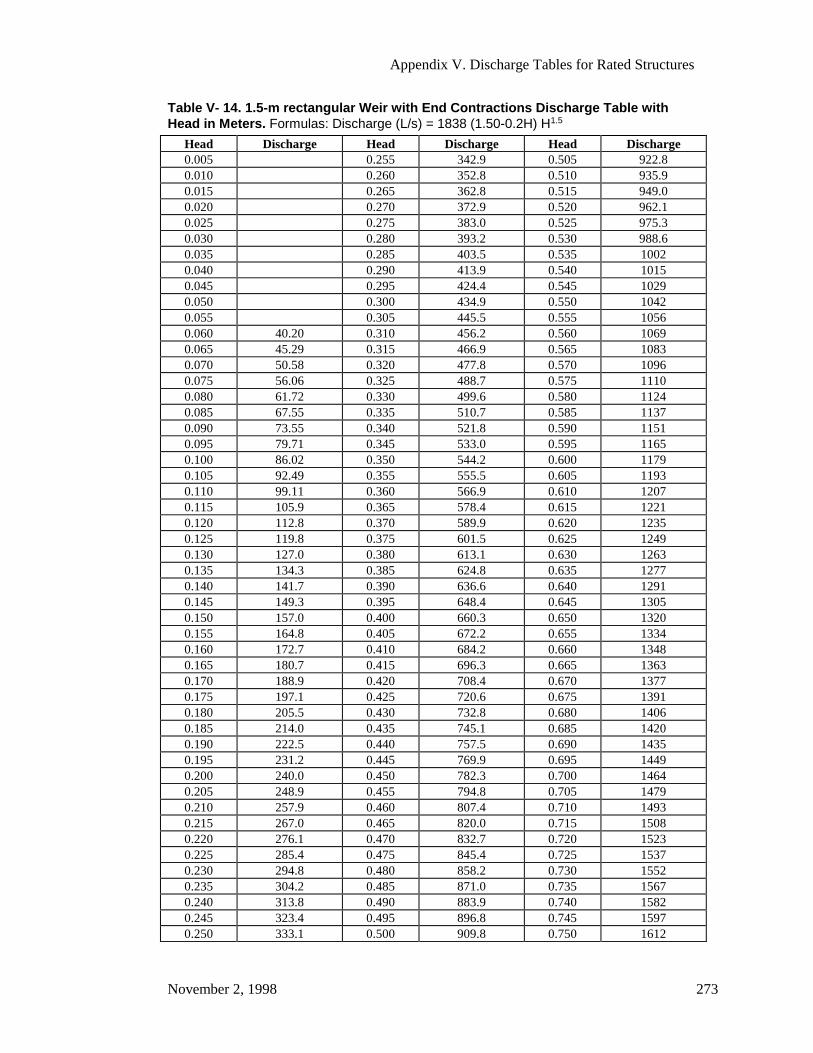
Appendix V. Discharge Tables for Rated Structures
November 2, 1998 273
Table V- 14. 1.5-m rectangular Weir with End Contractions Discharge Table withHead in Meters. Formulas: Discharge (L/s) = 1838 (1.50-0.2H) H1.5
Head Discharge Head Discharge Head Discharge0.005 0.255 342.9 0.505 922.80.010 0.260 352.8 0.510 935.90.015 0.265 362.8 0.515 949.00.020 0.270 372.9 0.520 962.10.025 0.275 383.0 0.525 975.30.030 0.280 393.2 0.530 988.60.035 0.285 403.5 0.535 10020.040 0.290 413.9 0.540 10150.045 0.295 424.4 0.545 10290.050 0.300 434.9 0.550 10420.055 0.305 445.5 0.555 10560.060 40.20 0.310 456.2 0.560 10690.065 45.29 0.315 466.9 0.565 10830.070 50.58 0.320 477.8 0.570 10960.075 56.06 0.325 488.7 0.575 11100.080 61.72 0.330 499.6 0.580 11240.085 67.55 0.335 510.7 0.585 11370.090 73.55 0.340 521.8 0.590 11510.095 79.71 0.345 533.0 0.595 11650.100 86.02 0.350 544.2 0.600 11790.105 92.49 0.355 555.5 0.605 11930.110 99.11 0.360 566.9 0.610 12070.115 105.9 0.365 578.4 0.615 12210.120 112.8 0.370 589.9 0.620 12350.125 119.8 0.375 601.5 0.625 12490.130 127.0 0.380 613.1 0.630 12630.135 134.3 0.385 624.8 0.635 12770.140 141.7 0.390 636.6 0.640 12910.145 149.3 0.395 648.4 0.645 13050.150 157.0 0.400 660.3 0.650 13200.155 164.8 0.405 672.2 0.655 13340.160 172.7 0.410 684.2 0.660 13480.165 180.7 0.415 696.3 0.665 13630.170 188.9 0.420 708.4 0.670 13770.175 197.1 0.425 720.6 0.675 13910.180 205.5 0.430 732.8 0.680 14060.185 214.0 0.435 745.1 0.685 14200.190 222.5 0.440 757.5 0.690 14350.195 231.2 0.445 769.9 0.695 14490.200 240.0 0.450 782.3 0.700 14640.205 248.9 0.455 794.8 0.705 14790.210 257.9 0.460 807.4 0.710 14930.215 267.0 0.465 820.0 0.715 15080.220 276.1 0.470 832.7 0.720 15230.225 285.4 0.475 845.4 0.725 15370.230 294.8 0.480 858.2 0.730 15520.235 304.2 0.485 871.0 0.735 15670.240 313.8 0.490 883.9 0.740 15820.245 323.4 0.495 896.8 0.745 15970.250 333.1 0.500 909.8 0.750 1612
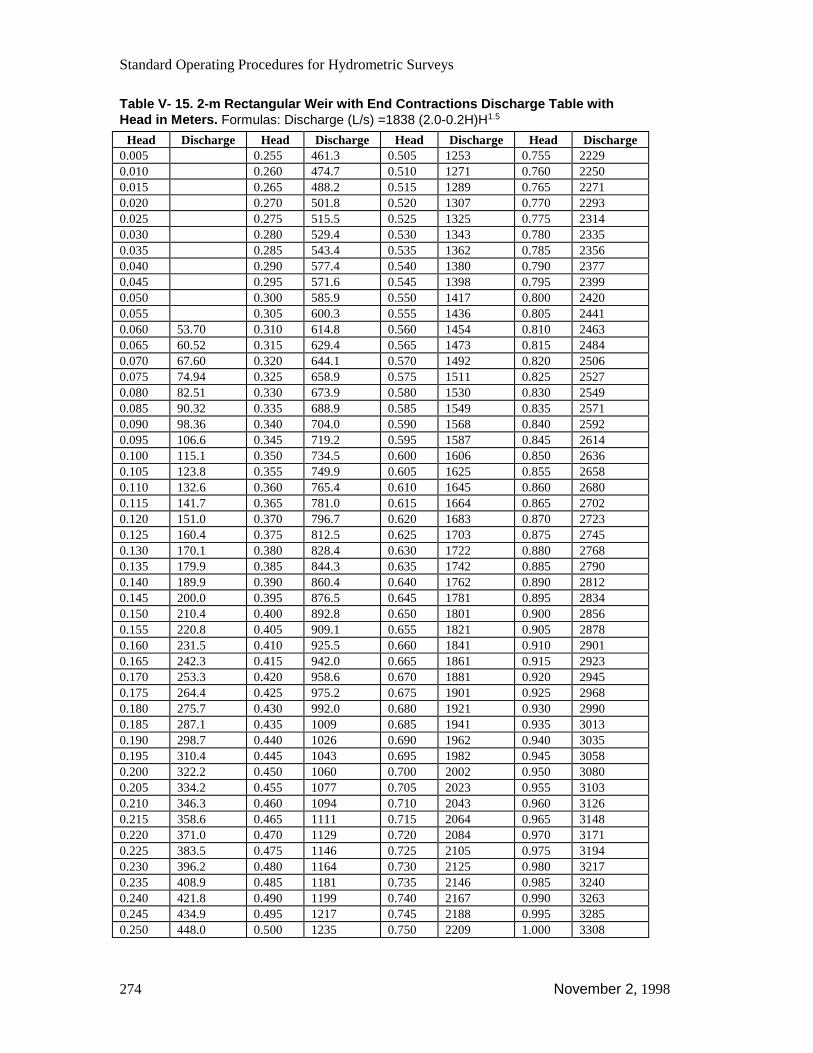
Standard Operating Procedures for Hydrometric Surveys
274 November 2, 1998
Table V- 15. 2-m Rectangular Weir with End Contractions Discharge Table withHead in Meters. Formulas: Discharge (L/s) =1838 (2.0-0.2H)H1.5
Head Discharge Head Discharge Head Discharge Head Discharge0.005 0.255 461.3 0.505 1253 0.755 22290.010 0.260 474.7 0.510 1271 0.760 22500.015 0.265 488.2 0.515 1289 0.765 22710.020 0.270 501.8 0.520 1307 0.770 22930.025 0.275 515.5 0.525 1325 0.775 23140.030 0.280 529.4 0.530 1343 0.780 23350.035 0.285 543.4 0.535 1362 0.785 23560.040 0.290 577.4 0.540 1380 0.790 23770.045 0.295 571.6 0.545 1398 0.795 23990.050 0.300 585.9 0.550 1417 0.800 24200.055 0.305 600.3 0.555 1436 0.805 24410.060 53.70 0.310 614.8 0.560 1454 0.810 24630.065 60.52 0.315 629.4 0.565 1473 0.815 24840.070 67.60 0.320 644.1 0.570 1492 0.820 25060.075 74.94 0.325 658.9 0.575 1511 0.825 25270.080 82.51 0.330 673.9 0.580 1530 0.830 25490.085 90.32 0.335 688.9 0.585 1549 0.835 25710.090 98.36 0.340 704.0 0.590 1568 0.840 25920.095 106.6 0.345 719.2 0.595 1587 0.845 26140.100 115.1 0.350 734.5 0.600 1606 0.850 26360.105 123.8 0.355 749.9 0.605 1625 0.855 26580.110 132.6 0.360 765.4 0.610 1645 0.860 26800.115 141.7 0.365 781.0 0.615 1664 0.865 27020.120 151.0 0.370 796.7 0.620 1683 0.870 27230.125 160.4 0.375 812.5 0.625 1703 0.875 27450.130 170.1 0.380 828.4 0.630 1722 0.880 27680.135 179.9 0.385 844.3 0.635 1742 0.885 27900.140 189.9 0.390 860.4 0.640 1762 0.890 28120.145 200.0 0.395 876.5 0.645 1781 0.895 28340.150 210.4 0.400 892.8 0.650 1801 0.900 28560.155 220.8 0.405 909.1 0.655 1821 0.905 28780.160 231.5 0.410 925.5 0.660 1841 0.910 29010.165 242.3 0.415 942.0 0.665 1861 0.915 29230.170 253.3 0.420 958.6 0.670 1881 0.920 29450.175 264.4 0.425 975.2 0.675 1901 0.925 29680.180 275.7 0.430 992.0 0.680 1921 0.930 29900.185 287.1 0.435 1009 0.685 1941 0.935 30130.190 298.7 0.440 1026 0.690 1962 0.940 30350.195 310.4 0.445 1043 0.695 1982 0.945 30580.200 322.2 0.450 1060 0.700 2002 0.950 30800.205 334.2 0.455 1077 0.705 2023 0.955 31030.210 346.3 0.460 1094 0.710 2043 0.960 31260.215 358.6 0.465 1111 0.715 2064 0.965 31480.220 371.0 0.470 1129 0.720 2084 0.970 31710.225 383.5 0.475 1146 0.725 2105 0.975 31940.230 396.2 0.480 1164 0.730 2125 0.980 32170.235 408.9 0.485 1181 0.735 2146 0.985 32400.240 421.8 0.490 1199 0.740 2167 0.990 32630.245 434.9 0.495 1217 0.745 2188 0.995 32850.250 448.0 0.500 1235 0.750 2209 1.000 3308

Appendix V. Discharge Tables for Rated Structures
November 2, 1998 275
This page intentionally blank.

Standard Operating Procedures for Hydrometric Surveys
276 November 2, 1998
Table V- 16. 3-m Rectangular Weir with End Contractions Discharge Table withHead in Meters. Formulas: Discharge (L/s) =1838 (3.0-0.2H) H1.5
Head Discharge Head Discharge Head Discharge0.005 0.255 98.0 0.505 19120.010 0.260 718.3 0.510 19400.015 0.265 738.9 0.515 19680.020 0.270 759.7 0.520 19960.025 0.275 780.6 0.525 20240.030 0.280 801.7 0.530 20520.035 0.285 823.0 0.535 20810.040 0.290 844.5 0.540 21090.045 0.295 866.1 0.545 21380.050 0.300 887.9 0.550 21670.055 0.305 909.9 0.555 21950.060 80.71 0.310 932.1 0.560 22240.065 90.98 0.315 954.4 0.565 22540.070 101.6 0.320 976.8 0.570 22830.075 112.7 0.325 999.5 0.575 23120.080 124.1 0.330 1022 0.580 23410.085 135.9 0.335 1045 0.585 23710.090 148.0 0.340 1068 0.590 24010.095 160.4 0.345 1092 0.595 24300.100 173.2 0.350 1115 0.600 24600.105 186.3 0.355 1139 0.605 24900.110 199.7 0.360 1162 0.610 25200.115 213.4 0.365 1186 0.615 25500.120 227.4 0.370 1210 0.620 25810.125 241.7 0.375 1235 0.625 26110.130 256.2 0.380 1259 0.630 26410.135 271.0 0.385 1283 0.635 26720.140 286.1 0.390 1308 0.640 27030.145 301.5 0.395 1333 0.645 27330.150 317.1 0.400 1358 0.650 27640.155 333.0 0.405 1383 0.655 27950.160 349.1 0.410 1408 0.660 28260.165 365.5 0.415 1433 0.665 28580.170 382.1 0.420 1459 0.670 28890.175 399.0 0.425 1484 0.675 29200.180 416.0 0.430 1510 0.680 29520.185 433.3 0.435 1536 0.685 29830.190 450.9 0.440 1562 0.690 30150.195 468.6 0.445 1588 0.695 30470.200 486.6 0.450 1615 0.700 30790.205 504.8 0.455 1641 0.705 31110.210 523.2 0.460 1668 0.710 31430.215 541.8 0.465 1694 0.715 31750.220 560.6 0.470 1721 0.720 32070.225 579.7 0.475 1748 0.725 32390.230 598.9 0.480 1775 0.730 32720.235 618.3 0.485 1802 0.735 33040.240 637.9 0.490 1830 0.740 33370.245 657.8 0.495 1857 0.745 33700.250 677.8 0.500 1885 0.750 3402
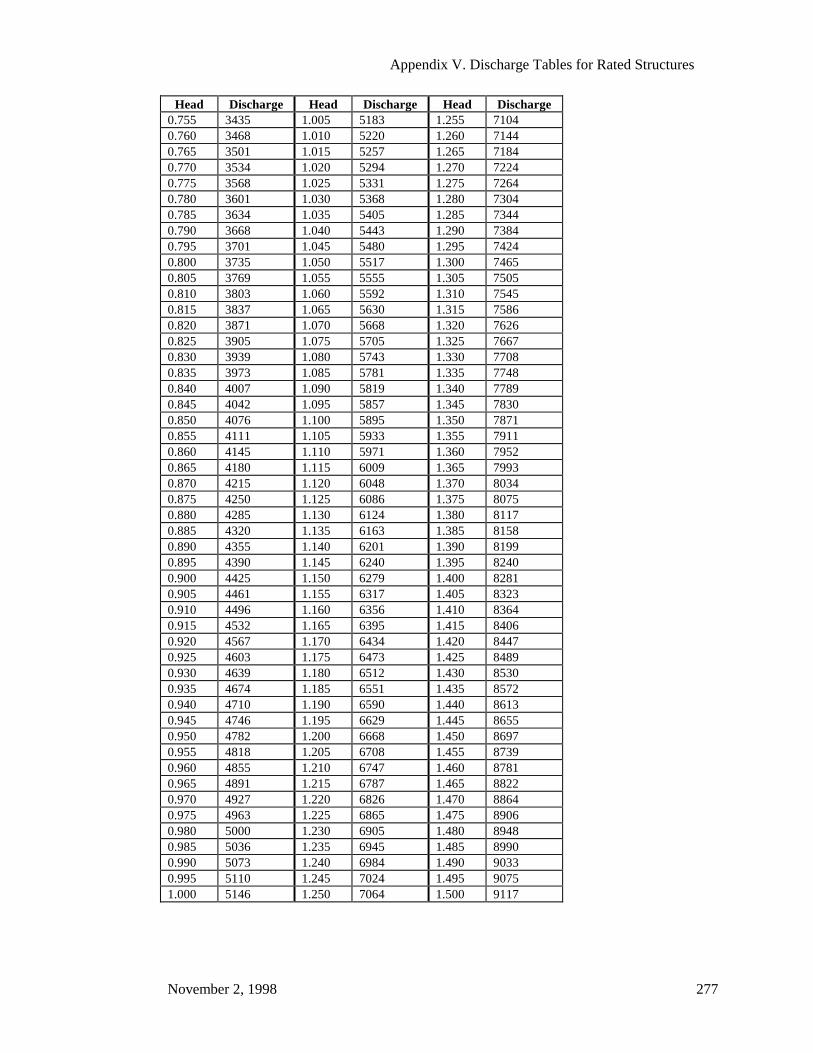
Appendix V. Discharge Tables for Rated Structures
November 2, 1998 277
Head Discharge Head Discharge Head Discharge0.755 3435 1.005 5183 1.255 71040.760 3468 1.010 5220 1.260 71440.765 3501 1.015 5257 1.265 71840.770 3534 1.020 5294 1.270 72240.775 3568 1.025 5331 1.275 72640.780 3601 1.030 5368 1.280 73040.785 3634 1.035 5405 1.285 73440.790 3668 1.040 5443 1.290 73840.795 3701 1.045 5480 1.295 74240.800 3735 1.050 5517 1.300 74650.805 3769 1.055 5555 1.305 75050.810 3803 1.060 5592 1.310 75450.815 3837 1.065 5630 1.315 75860.820 3871 1.070 5668 1.320 76260.825 3905 1.075 5705 1.325 76670.830 3939 1.080 5743 1.330 77080.835 3973 1.085 5781 1.335 77480.840 4007 1.090 5819 1.340 77890.845 4042 1.095 5857 1.345 78300.850 4076 1.100 5895 1.350 78710.855 4111 1.105 5933 1.355 79110.860 4145 1.110 5971 1.360 79520.865 4180 1.115 6009 1.365 79930.870 4215 1.120 6048 1.370 80340.875 4250 1.125 6086 1.375 80750.880 4285 1.130 6124 1.380 81170.885 4320 1.135 6163 1.385 81580.890 4355 1.140 6201 1.390 81990.895 4390 1.145 6240 1.395 82400.900 4425 1.150 6279 1.400 82810.905 4461 1.155 6317 1.405 83230.910 4496 1.160 6356 1.410 83640.915 4532 1.165 6395 1.415 84060.920 4567 1.170 6434 1.420 84470.925 4603 1.175 6473 1.425 84890.930 4639 1.180 6512 1.430 85300.935 4674 1.185 6551 1.435 85720.940 4710 1.190 6590 1.440 86130.945 4746 1.195 6629 1.445 86550.950 4782 1.200 6668 1.450 86970.955 4818 1.205 6708 1.455 87390.960 4855 1.210 6747 1.460 87810.965 4891 1.215 6787 1.465 88220.970 4927 1.220 6826 1.470 88640.975 4963 1.225 6865 1.475 89060.980 5000 1.230 6905 1.480 89480.985 5036 1.235 6945 1.485 89900.990 5073 1.240 6984 1.490 90330.995 5110 1.245 7024 1.495 90751.000 5146 1.250 7064 1.500 9117

Standard Operating Procedures for Hydrometric Surveys
278 November 2, 1998
This page intentionally blank.
Appendix VI. Discharge Measurement Field Data and Calculation (DMFDC) V. 1.2
November 2, 1998 279
Appendix VI. Discharge Measurement Field Data andCalculation (DMFDC) V. 1.2
Developed by: Gordon Clark and Jeff Pitt of G.McG. Clark & Associates,Hydrological Services, 1997 for the RIC Standards Manual.
The executable program, DMFDC is
available on the Internet as part of the
RIC Manual, and may be downloaded
for field use:
Multis.xls MultiT.xlt Stnds.xls StndT.xlt
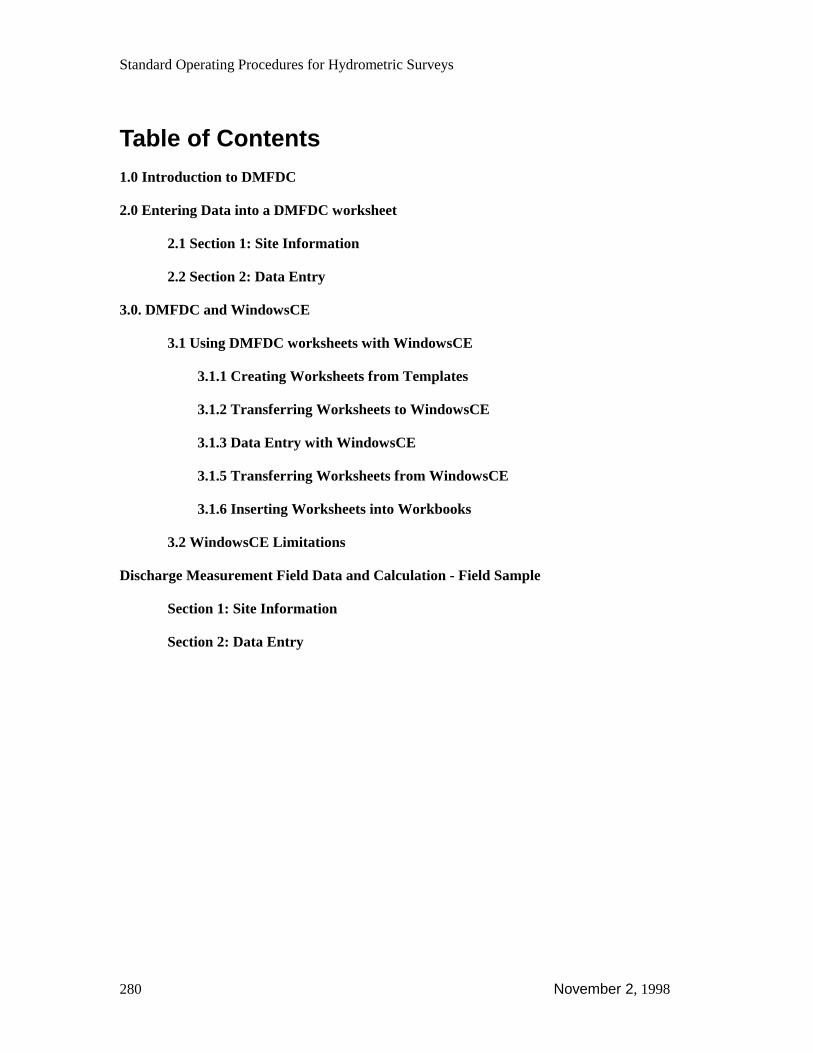
Standard Operating Procedures for Hydrometric Surveys
280 November 2, 1998
Table of Contents1.0 Introduction to DMFDC
2.0 Entering Data into a DMFDC worksheet
2.1 Section 1: Site Information
2.2 Section 2: Data Entry
3.0. DMFDC and WindowsCE
3.1 Using DMFDC worksheets with WindowsCE
3.1.1 Creating Worksheets from Templates
3.1.2 Transferring Worksheets to WindowsCE
3.1.3 Data Entry with WindowsCE
3.1.5 Transferring Worksheets from WindowsCE
3.1.6 Inserting Worksheets into Workbooks
3.2 WindowsCE Limitations
Discharge Measurement Field Data and Calculation - Field Sample
Section 1: Site Information
Section 2: Data Entry
Appendix VI. Discharge Measurement Field Data and Calculation (DMFDC) V. 1.2
November 2, 1998 281
1.0 Introduction to DMFDCThe Discharge Measurement Field Data and Calculation (DMFDC) Excel programcalculates and displays stream flow data in a user friendly, Windows based environment.Users can enter stream flow data and see the results instantly. Many features have beenincluded in the DMFDC program to give the user more flexibility than has been availablein the past. For example, there is an entry in DMFDC pages to input the equations formeters. This prevents users from having to alter the equations contained in the manycells every time a different meter is used.
The DMFDC program is composed of two types of worksheets. The first type ofworksheet is called “Stnd.xls”, the second worksheet type is called “Multi.xls”. The onlydifference between the two types of worksheets is their size. “Stnd.xls” worksheets aredesigned for measurement sessions that consist of only single vertical measurements like“point six” and “point five” measurements. Therefore there are 25 rows for stream flowdata to be entered in the “Stnd.xls” worksheet. The “Multi.xls” worksheet is designed tohandle “two” and “three” point measurements. To handle the extra rows required forthese measurements “Multi.xls” worksheets have 62 rows available for stream data to beentered. Beyond the number of rows for data entries, the two worksheets are exactly thesame in every respect.
Each of the worksheets are broken up into two sections. The first part of a worksheet iscalled “Section 1: Site Information”, the second part of a worksheet is labeled “Section2: Data Entry”. Each section describes a different aspect of a measurement session.
Section 1 contains data that describes many conditions and variables of the measurementsession. Examples of items that are entered into the Section 1 are station name,temperatures and meter equations. Section 2 accepts actual stream flow data input fromthe user. Items like rotor revolutions and water depth are entered into Section 2 by theuser. As data is entered into Section 2, results such as velocities and discharges aredisplayed in real time. Each row in Section 2 represents a single measurement, althoughtwo and three point measurements occupy two and three rows respectively.
2.0 Entering Data into a DMFDC Worksheet
2.1 Section 1: Site Information
As previously noted, the “Section 1: Site Information” portion of the worksheet containsall the environmental data for the stream, as well as other variables.
The following entries are made in Section 1:
• Station Operating Agency/Firm, Station Number and Station Name
• Date
• Metered by
• Location and Time of Metering
• Weather and Air and Water Temperatures
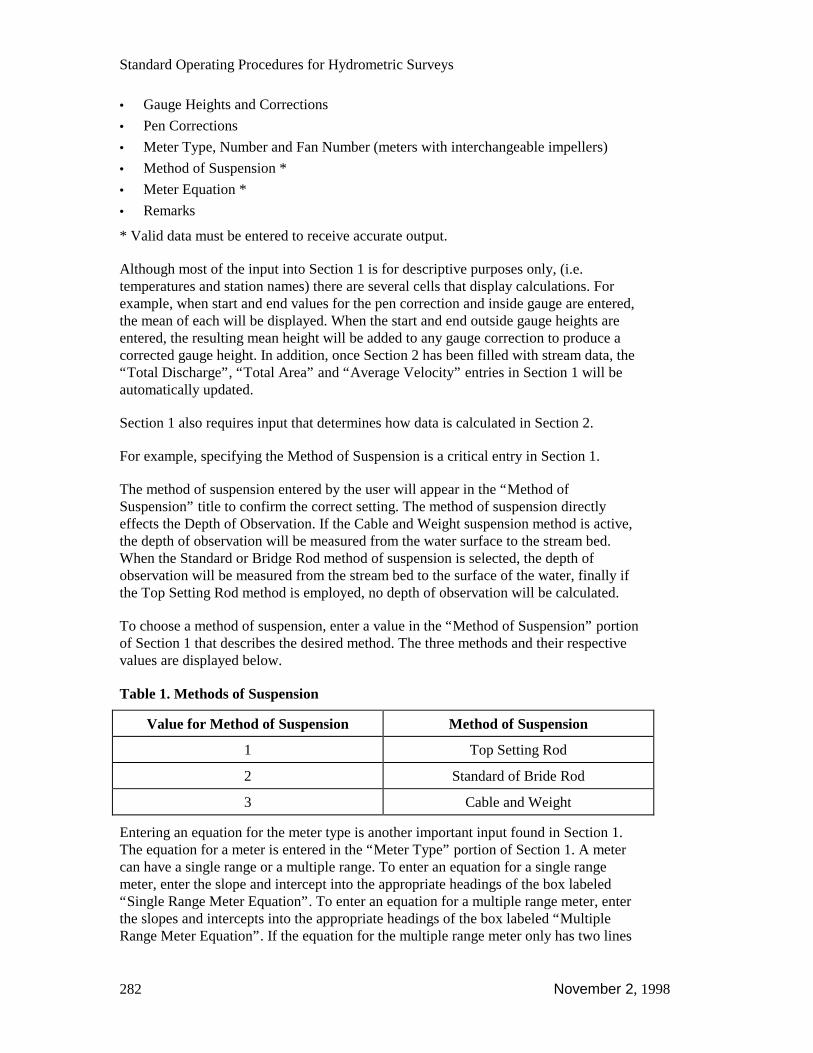
Standard Operating Procedures for Hydrometric Surveys
282 November 2, 1998
• Gauge Heights and Corrections
• Pen Corrections
• Meter Type, Number and Fan Number (meters with interchangeable impellers)
• Method of Suspension *
• Meter Equation *
• Remarks
* Valid data must be entered to receive accurate output.
Although most of the input into Section 1 is for descriptive purposes only, (i.e.temperatures and station names) there are several cells that display calculations. Forexample, when start and end values for the pen correction and inside gauge are entered,the mean of each will be displayed. When the start and end outside gauge heights areentered, the resulting mean height will be added to any gauge correction to produce acorrected gauge height. In addition, once Section 2 has been filled with stream data, the“Total Discharge”, “Total Area” and “Average Velocity” entries in Section 1 will beautomatically updated.
Section 1 also requires input that determines how data is calculated in Section 2.
For example, specifying the Method of Suspension is a critical entry in Section 1.
The method of suspension entered by the user will appear in the “Method ofSuspension” title to confirm the correct setting. The method of suspension directlyeffects the Depth of Observation. If the Cable and Weight suspension method is active,the depth of observation will be measured from the water surface to the stream bed.When the Standard or Bridge Rod method of suspension is selected, the depth ofobservation will be measured from the stream bed to the surface of the water, finally ifthe Top Setting Rod method is employed, no depth of observation will be calculated.
To choose a method of suspension, enter a value in the “Method of Suspension” portionof Section 1 that describes the desired method. The three methods and their respectivevalues are displayed below.
Table 1. Methods of Suspension
Value for Method of Suspension Method of Suspension
1 Top Setting Rod
2 Standard of Bride Rod
3 Cable and Weight
Entering an equation for the meter type is another important input found in Section 1.The equation for a meter is entered in the “Meter Type” portion of Section 1. A metercan have a single range or a multiple range. To enter an equation for a single rangemeter, enter the slope and intercept into the appropriate headings of the box labeled“Single Range Meter Equation”. To enter an equation for a multiple range meter, enterthe slopes and intercepts into the appropriate headings of the box labeled “MultipleRange Meter Equation”. If the equation for the multiple range meter only has two lines

Appendix VI. Discharge Measurement Field Data and Calculation (DMFDC) V. 1.2
November 2, 1998 283
instead of three, simply enter the equation into the first two lines of the “Multiple RangeMeter Equation” box.
Certain meter equations contain intercepts that are subtracted from the rest of theequation. In contrast, intercepts are always added to the equations in the “Meter Type”box. To subtract an intercept from an equation, simply enter the intercept as a negativenumber. For example, if the equation was: V = 0.251*n - 0.004, enter 0.251 for the slopeand -.004 for the intercept. If the maximum revs/seconds for an equation is unknown,choose a value that will be higher than the highest possible value (i.e. 99).
Ideally, users should ensure that only one meter range has equation(s) entered into it. Ifboth meter range boxes have valid equations entered, the single range meter equationwill be used and the multiple range meter equations will be ignored. To confirm whichmeter range is activated, refer to the “Meter Type” heading above the two meter rangeboxes. This heading indicates which meter type is selected based on the equationsentered. Initially, it will display “No Meter Range Selected”. After a valid equation(s) isentered into one of the meter ranges this heading will describe the range selected. It iscritical that one of the meter ranges are activated before entering data into a “Section 2”.If a range is not selected, the output of the “Sheet” will be completely invalid.
2.2 Section 2: Data Entry
Section 2 of the worksheet contains all the actual stream data of the measurementsession. Values such as water depth, method and revolutions of fan are entered here.“Section 2” also displays the results of such input, such as calculated velocities andareas.
There are two main sections in “Section 2”. The first section is the “Observations”section which covers the first seven columns from the left. The second section is the“Computations” section which covers the remaining six columns.
The Columns in the “Observations” section:
• Method
• Distance From Initial Point
• Depth
• Depth of Observation *
• Revs
• Time
• Cos of Flow
* indicates that no user input is permitted in column.
The Columns in the “Computations” section:
• Velocity: at Point *
• Velocity: Mean in Vertical *
• Width *
• Area *
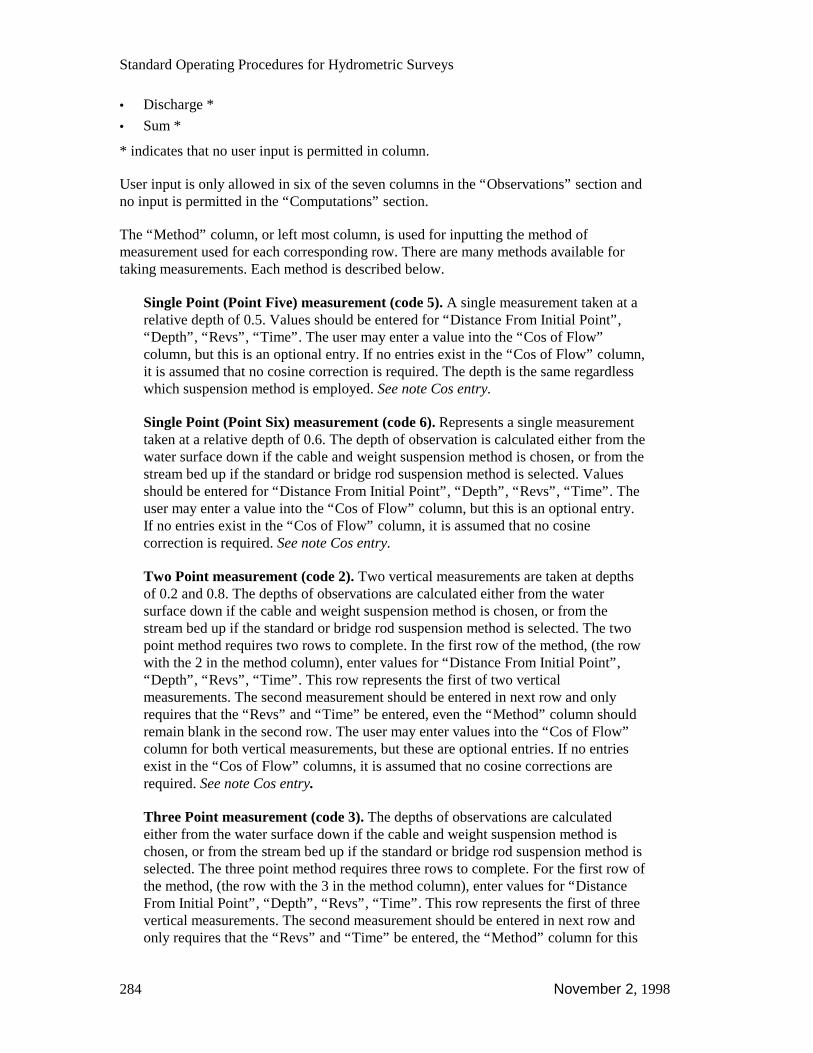
Standard Operating Procedures for Hydrometric Surveys
284 November 2, 1998
• Discharge *
• Sum *
* indicates that no user input is permitted in column.
User input is only allowed in six of the seven columns in the “Observations” section andno input is permitted in the “Computations” section.
The “Method” column, or left most column, is used for inputting the method ofmeasurement used for each corresponding row. There are many methods available fortaking measurements. Each method is described below.
Single Point (Point Five) measurement (code 5). A single measurement taken at arelative depth of 0.5. Values should be entered for “Distance From Initial Point”,“Depth”, “Revs”, “Time”. The user may enter a value into the “Cos of Flow”column, but this is an optional entry. If no entries exist in the “Cos of Flow” column,it is assumed that no cosine correction is required. The depth is the same regardlesswhich suspension method is employed. See note Cos entry.
Single Point (Point Six) measurement (code 6). Represents a single measurementtaken at a relative depth of 0.6. The depth of observation is calculated either from thewater surface down if the cable and weight suspension method is chosen, or from thestream bed up if the standard or bridge rod suspension method is selected. Valuesshould be entered for “Distance From Initial Point”, “Depth”, “Revs”, “Time”. Theuser may enter a value into the “Cos of Flow” column, but this is an optional entry.If no entries exist in the “Cos of Flow” column, it is assumed that no cosinecorrection is required. See note Cos entry.
Two Point measurement (code 2). Two vertical measurements are taken at depthsof 0.2 and 0.8. The depths of observations are calculated either from the watersurface down if the cable and weight suspension method is chosen, or from thestream bed up if the standard or bridge rod suspension method is selected. The twopoint method requires two rows to complete. In the first row of the method, (the rowwith the 2 in the method column), enter values for “Distance From Initial Point”,“Depth”, “Revs”, “Time”. This row represents the first of two verticalmeasurements. The second measurement should be entered in next row and onlyrequires that the “Revs” and “Time” be entered, even the “Method” column shouldremain blank in the second row. The user may enter values into the “Cos of Flow”column for both vertical measurements, but these are optional entries. If no entriesexist in the “Cos of Flow” columns, it is assumed that no cosine corrections arerequired. See note Cos entry.
Three Point measurement (code 3). The depths of observations are calculatedeither from the water surface down if the cable and weight suspension method ischosen, or from the stream bed up if the standard or bridge rod suspension method isselected. The three point method requires three rows to complete. For the first row ofthe method, (the row with the 3 in the method column), enter values for “DistanceFrom Initial Point”, “Depth”, “Revs”, “Time”. This row represents the first of threevertical measurements. The second measurement should be entered in next row andonly requires that the “Revs” and “Time” be entered, the “Method” column for this
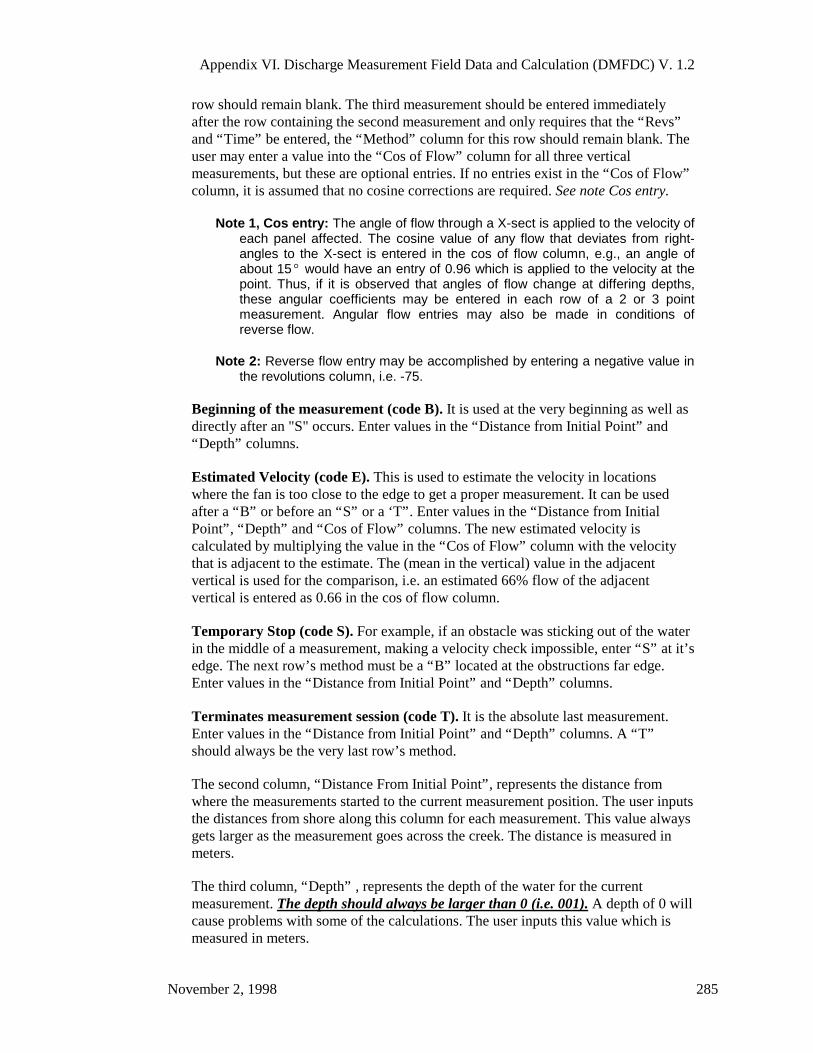
Appendix VI. Discharge Measurement Field Data and Calculation (DMFDC) V. 1.2
November 2, 1998 285
row should remain blank. The third measurement should be entered immediatelyafter the row containing the second measurement and only requires that the “Revs”and “Time” be entered, the “Method” column for this row should remain blank. Theuser may enter a value into the “Cos of Flow” column for all three verticalmeasurements, but these are optional entries. If no entries exist in the “Cos of Flow”column, it is assumed that no cosine corrections are required. See note Cos entry.
Note 1, Cos entry: The angle of flow through a X-sect is applied to the velocity ofeach panel affected. The cosine value of any flow that deviates from right-angles to the X-sect is entered in the cos of flow column, e.g., an angle ofabout 15° would have an entry of 0.96 which is applied to the velocity at thepoint. Thus, if it is observed that angles of flow change at differing depths,these angular coefficients may be entered in each row of a 2 or 3 pointmeasurement. Angular flow entries may also be made in conditions ofreverse flow.
Note 2: Reverse flow entry may be accomplished by entering a negative value inthe revolutions column, i.e. -75.
Beginning of the measurement (code B). It is used at the very beginning as well asdirectly after an "S" occurs. Enter values in the “Distance from Initial Point” and“Depth” columns.
Estimated Velocity (code E). This is used to estimate the velocity in locationswhere the fan is too close to the edge to get a proper measurement. It can be usedafter a “B” or before an “S” or a ‘T”. Enter values in the “Distance from InitialPoint”, “Depth” and “Cos of Flow” columns. The new estimated velocity iscalculated by multiplying the value in the “Cos of Flow” column with the velocitythat is adjacent to the estimate. The (mean in the vertical) value in the adjacentvertical is used for the comparison, i.e. an estimated 66% flow of the adjacentvertical is entered as 0.66 in the cos of flow column.
Temporary Stop (code S). For example, if an obstacle was sticking out of the waterin the middle of a measurement, making a velocity check impossible, enter “S” at it’sedge. The next row’s method must be a “B” located at the obstructions far edge.Enter values in the “Distance from Initial Point” and “Depth” columns.
Terminates measurement session (code T). It is the absolute last measurement.Enter values in the “Distance from Initial Point” and “Depth” columns. A “T”should always be the very last row’s method.
The second column, “Distance From Initial Point”, represents the distance fromwhere the measurements started to the current measurement position. The user inputsthe distances from shore along this column for each measurement. This value alwaysgets larger as the measurement goes across the creek. The distance is measured inmeters.
The third column, “Depth” , represents the depth of the water for the currentmeasurement. The depth should always be larger than 0 (i.e. 001). A depth of 0 willcause problems with some of the calculations. The user inputs this value which ismeasured in meters.
Standard Operating Procedures for Hydrometric Surveys
286 November 2, 1998
The fourth column, “Depth of Observation”, is NOT for user input. This columndisplays the depth of measurement, which indicates the depth at which the velocitiesare measured. In the case of standard or bridge rod, this number reflects the depthfrom the surface, in the case of cable and weight this number reflects the depth fromthe bottom, and in the case of top setting rod, there is no “Depth of Observation”value calculated.
The fifth column, “Revs.”, is where the user entries the number of full revolutionsthe fan completes in the time specified.
The sixth column, “Time”, is where the user enters the time for each verticalmeasurement. The measurement is timed in seconds.
The seventh column, “Cos of Flow”, indicates the Cosine of the flow angle. Thisvalue corrects the velocity based on any differences between the angle of the watersflow vs. the angle that the fan is being held at. This value is optional. If it is entered,it is multiplied to the raw velocity to produce a corrected velocity representing moreaccurately the effects of the flow angle on velocity measured by the meter.
The remaining columns are found in the “Calculations” section. They are not foruser input. They are strictly calculations based on the data that the user input in the“Observations” section of the “Sheet”.
3.0 DMFDC and WindowsCEDMFDC worksheets are very flexible. They can be used in the office or the field. IfDMFDC is used in the office, data that has been collected in the field can be input into aworksheet for processing. In addition, DMFDC can be carried into the field using a hand-held computer, running WindowsCE. In fact, DMFDC worksheets are designed to allowthe user to see all important data in the narrow screen of a hand-held WindowsCEcomputer. Use of a WindowsCE computer allows measurements to be entered directlyinto the computer as they are taken in the stream. This allows output to be viewed in realtime throughout the measurement. Users can make corrections during and after themeasurement and see the results of the corrections instantly. The workbooks can bebrought back to the office and transferred from WindowsCE to a desktop for permanentstorage.
3.1 Instructions for using DMFDC worksheets with WindowsCE
3.1.1 Creating Worksheets from Templates
The two DMFDC worksheets, Stnd and Multi, are distributed as a Excel 5.0 templates,with the extensions “.XLT”. There are several advantages that templates have overstandard worksheets. The first advantage is that many Excel worksheets can be createdeasily from just one template and secondly, the contents of templates can not bepermanently altered by the user. To create a new worksheet based on a DMFDCtemplate, just open the template. Microsoft Excel creates a copy of the template to workon, leaving the original template intact.
Appendix VI. Discharge Measurement Field Data and Calculation (DMFDC) V. 1.2
November 2, 1998 287
To create a new worksheet from one of DMFDC’s templates, complete thefollowing procedures:
1. Start Microsoft’s Excel.
2. Open one of DMFDC’s two templates from Excel using the “Open” commandlocated in the “File” main menu item.
3. Save the new worksheet using the “Save As...” command located in the “File” mainmenu item. It is recommended to name worksheets after the Station’s ID numberthey represent. This allows for easy identification of worksheets without having toview their contents.
Following the above instructions will generate a new blank worksheet with the extensiontype ”XLS”. It is important to transfer DMFDC worksheets, and not DMFDC templatesto WindowsCE because Pocket Excel can not work with templates.
3.1.2 Transferring Worksheets to WindowsCE
Before a WindowsCE hand-held computer can be used to enter streamflow data, theDMFDC worksheet(s) must be transferred to it. The following steps will allow aDMFDC worksheet to be transferred into a WindowsCE hand-held computer from eithera desktop or laptop PC.
1. Ensure that HPC Explorer is installed on either a laptop or desktop computer. Thecomputer with HPC Explorer will be the “host” for the WindowsCE computer.Connect the “host” to the WindowsCE computer using the cable provided with theWindowsCE system. Refer to the WindowsCE instruction manual for detailsregarding the installation of HPC Explorer and connecting a WindowsCE computerto a host computer.
2. Confirm that both computers are turned on.
3. From the host computer start HPC Explorer. The installation process of Explorershould have placed an icon on the desktop called “HPC Explorer”. Double clickingthis icon will start HPC Explorer. HPC explorer will immediately begin connectingto the WindowsCE computer as soon as it starts. See Figure 1.

Standard Operating Procedures for Hydrometric Surveys
288 November 2, 1998
Figure 1: Example of screen when HPC Explorer connects to “host” computer.
4. From the host computer, start Windows Explorer. Explorer can be found in the Start- Programs menu.
5. Position the Windows Explorer and HPC Explorer windows so they are side by side.In the HPC Explorer window double click on the “My Handheld PC” icon, then onthe “My Documents” icon. A list of all the files in the WindowsCE computer shouldbe displayed in the HPC Explorer window.
6. The computers are now ready to transfer files between each other. To transfer a filebetween computers simply click on the desired file and drag it from one window tothe next. If the left mouse button is used to drag the file will be automatically copiedto the destination, if the right mouse button is used the user will be given the choiceof copying or moving the file. Wherever the user lets go of the button after dragginga file is the location that the file will be transferred to (Figure 2). A window willappear called “Copy and Convert to HPC”. At this point the worksheet will beconverted to WindowsCE format and copied to the WindowsCE computer. After the“Copy and Convert to HPC” window closes the transfer is complete.
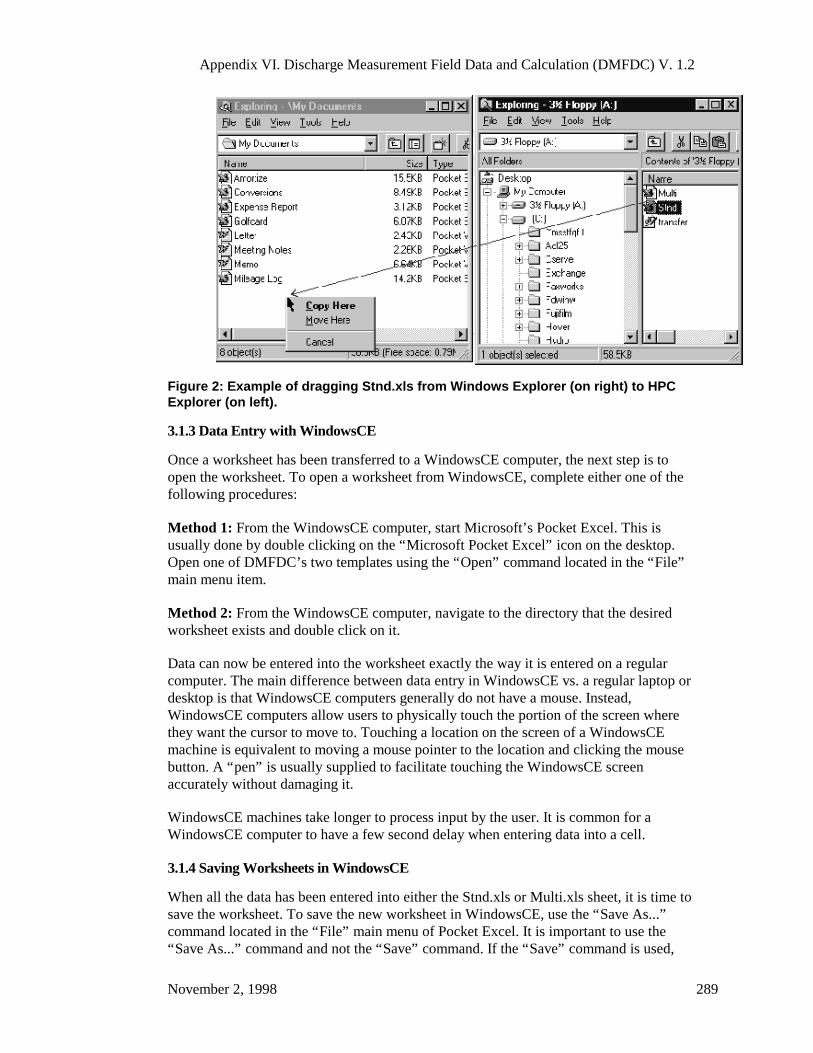
Appendix VI. Discharge Measurement Field Data and Calculation (DMFDC) V. 1.2
November 2, 1998 289
Figure 2: Example of dragging Stnd.xls from Windows Explorer (on right) to HPCExplorer (on left).
3.1.3 Data Entry with WindowsCE
Once a worksheet has been transferred to a WindowsCE computer, the next step is toopen the worksheet. To open a worksheet from WindowsCE, complete either one of thefollowing procedures:
Method 1: From the WindowsCE computer, start Microsoft’s Pocket Excel. This isusually done by double clicking on the “Microsoft Pocket Excel” icon on the desktop.Open one of DMFDC’s two templates using the “Open” command located in the “File”main menu item.
Method 2: From the WindowsCE computer, navigate to the directory that the desiredworksheet exists and double click on it.
Data can now be entered into the worksheet exactly the way it is entered on a regularcomputer. The main difference between data entry in WindowsCE vs. a regular laptop ordesktop is that WindowsCE computers generally do not have a mouse. Instead,WindowsCE computers allow users to physically touch the portion of the screen wherethey want the cursor to move to. Touching a location on the screen of a WindowsCEmachine is equivalent to moving a mouse pointer to the location and clicking the mousebutton. A “pen” is usually supplied to facilitate touching the WindowsCE screenaccurately without damaging it.
WindowsCE machines take longer to process input by the user. It is common for aWindowsCE computer to have a few second delay when entering data into a cell.
3.1.4 Saving Worksheets in WindowsCE
When all the data has been entered into either the Stnd.xls or Multi.xls sheet, it is time tosave the worksheet. To save the new worksheet in WindowsCE, use the “Save As...”command located in the “File” main menu of Pocket Excel. It is important to use the“Save As...” command and not the “Save” command. If the “Save” command is used,

Standard Operating Procedures for Hydrometric Surveys
290 November 2, 1998
the blank copy of the worksheet in WindowsCE will be saved full of data. This wouldforce the user to transfer another blank worksheet to the WindowsCE computer ifanother measurement was to be started. If “Save As...” is used, a new worksheet, namedby the user, would be created with the recently entered data stored in it. The originalblank worksheet, either “Stnd.xls” or “Multi.xls”, will remain blank ready to be usedagain. This method allows for many sheets to be created within a WindowsCE computerwithout the need to transfer a new worksheet each time a measurement is conducted. Ifthe computer stops responding during the save process, reconfigure the WindowsCEmemory to allow for storage. Refer to Section 3.2 in this document or to the WindowsCEmanual for additional details on configuring memory.
Worksheets are normally named after the Station’s id number they represent. This allowsfor easy identification of workbooks without having to view their contents.
3.1.5 Transferring Worksheets from WindowsCE
After creating and saving worksheets in WindowsCE, they can be transferred back to alaptop or desktop where they can be added to a workbook for permanent storage. Thesteps used to transfer a DMFDC worksheet to WindowsCE can be used to transfer itback to the “host” computer. Open Windows explorer and HPC Explorer and drag thefiles from WindowsCE back to the “host” system. It is important to understand thatwherever the user drags the file to is the final destination for the file. If the user wishes totransfer the worksheet to a specific directory, that directory should be visible beforebeginning to drag the file.
3.1.6 Inserting Worksheets into Workbooks
After the generated worksheets have been transferred from a WindowsCE computer to alaptop or desktop, they can be added to their appropriate workbook. Although there aremany ways to move a worksheet into a workbook, an easy method is outlined below.
To move DMFDC sheets to an existing workbook:
1. In the host computer, start Microsoft Excel.
2. Open the workbooks you want to move sheets to and from.
3. Select the sheet or sheets you want to move.
4. From the Edit menu, choose “Move Or Copy Sheet...”.
5. In the “To Book” box, select the destination workbook.
6. In the Before Sheet box, select where you want the sheet or sheets inserted.
7. Choose the OK button.
If no workbook exists for a station it is also possible to create a new workbook.
To move DMFDC sheets to a new workbook:
1. In the host computer, start Microsoft Excel.
2. Open the workbooks you want to move sheets from.
3. Select the sheet or sheets you want to move.
4. From the Edit menu, choose “Move Or Copy Sheet...”.
Appendix VI. Discharge Measurement Field Data and Calculation (DMFDC) V. 1.2
November 2, 1998 291
5. In the “To Book” box, select New Book.
6. Choose the OK button.
A new workbook is created containing only the sheet or sheets you moved. Theworkbook can be named to fit the users application.
3.2 WindowsCE Limitations
Users should be aware of how much memory is available in their WindowsCE computerwhile creating worksheets with it. Depending on which DMFDC template is loaded,users may be restricted in the number of worksheets that they can have loaded in theirWindowsCE at any given time. The Stnd.xls sheet was designed to save memory inWindowsCE applications because it takes up less space than a Multi.xls sheet. It isimportant to note that the size of worksheets can vary based on certain conditions. Forexample, when a worksheet is transferred from the host to a WindowsCE computer, thereformatting process to allow WindowsCE read the worksheet doubles the worksheet’ssize. When calculating memory requirements it is advisable to use the size ofWindowsCE worksheets to avoid unanticipated memory problems. The following tableprovides information on the sizes of different workbooks under different conditions. Itwill allow you to calculate how many worksheets will fit into the memory of yourparticular WindowsCE computer. Note: One Megabyte = 1024 Kilobytes.
Table 2. Worksheet sizes
Worksheet State Stnd.xlt Multi.xlt
Worksheet in PC Format 60 Kilobytes 115 Kilobytes
Worksheet in WindowsCE Format 89 Kilobytes 208 Kilobytes
If the number of workbooks a user is required to create exceeds the memory capacity ofthe WindowsCE computer, a laptop should be available to transfer worksheets to. Thiswill free up the WindowsCE computer to continue generating additional worksheets,while the laptop stores all the generated worksheets. It is strongly recommended that acomputer running WindowsCE have 4 or more megabytes of memory for optimalperformance with DMFDC worksheets.
It is often possible to configure how memory is used in WindowsCE computers. Userscan determine if they want more memory to be reserved for storage or for use byapplications. To fit the greatest number of sheets in a WindowsCE computer, it isadvisable to reserve just enough memory to run a DMFDC worksheet while leaving asmuch space as possible for storage. For a complete breakdown of the usage of memory ina WindowsCE computer, click on Start, Settings, System. This will bring up the SystemProperties window, click on the Memory tab at the top of the window for a detailedanalysis of your memory. From this location memory can be balanced between storagespace or application.
If two or more people are taking the measurement, it may be more convenient to use alaptop as opposed to a WindowsCE platform. Laptops are able to handler input quickerthan typical WindowsCE machines.
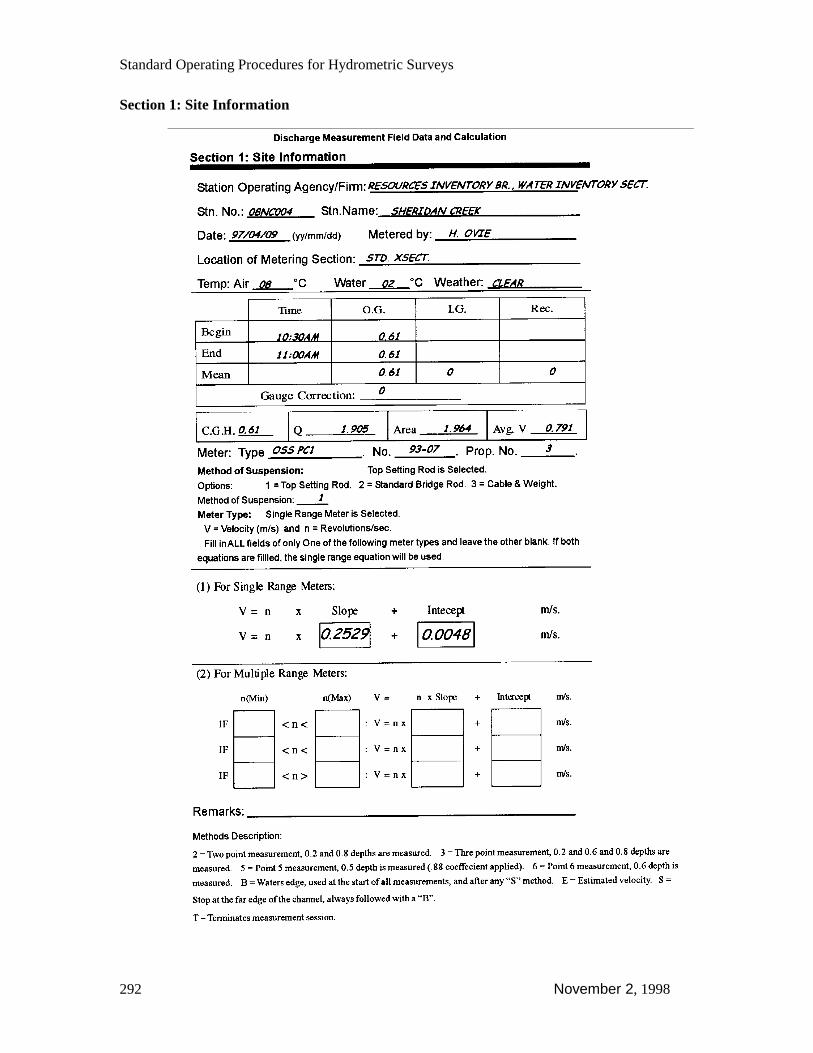
Standard Operating Procedures for Hydrometric Surveys
292 November 2, 1998
Section 1: Site Information
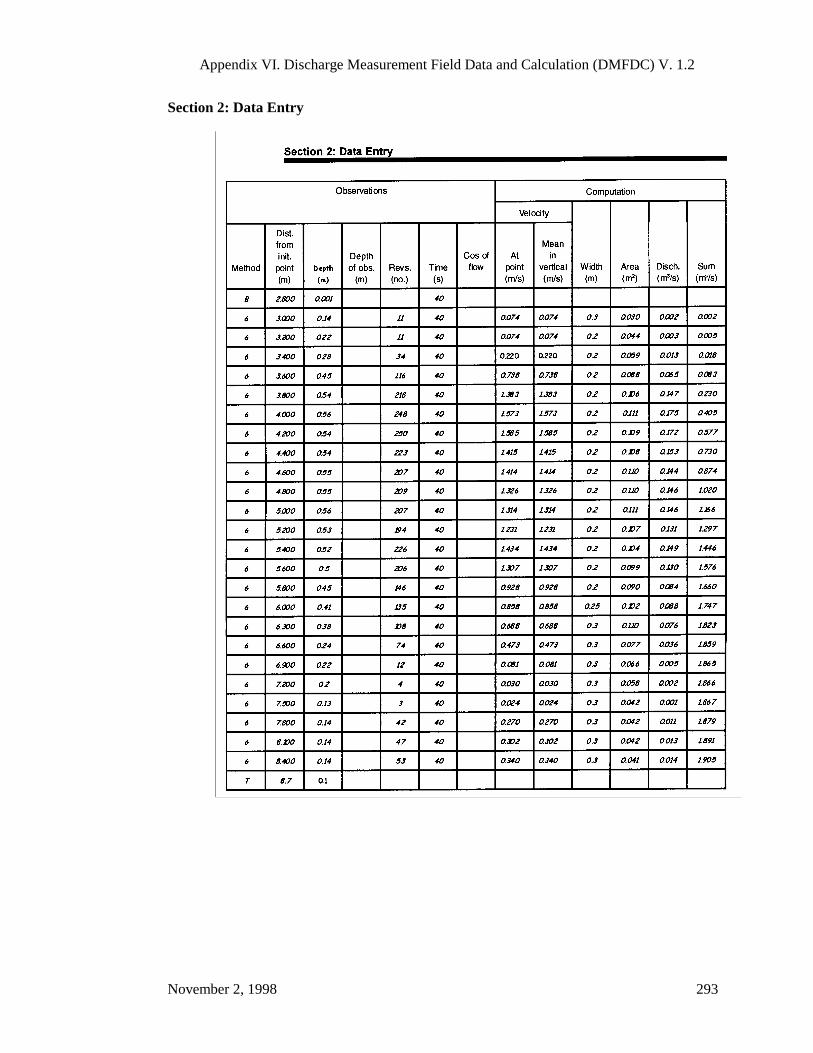
Appendix VI. Discharge Measurement Field Data and Calculation (DMFDC) V. 1.2
November 2, 1998 293
Section 2: Data Entry

Standard Operating Procedures for Hydrometric Surveys
294 November 2, 1998
This page intentionally blank.
Appendix VII. List of References
November 2, 1998 295
Appendix VII. List of ReferencesManual of Operational Hydrology in British Columbia. Edited by C.H. Coulson. MELP,
Victoria, BC. February 1988.
Hydrometric Technician Career Development Program. Vol. 1-5. Water Survey ofCanada. 1990.
Discharge Measurement Structures. Edited by M.G. Bos. International Institute for LandReclamation and Improvement. Delft Hydraulics Laboratory, Wageningen, TheNetherlands. 1978.
The following manuals are published by the Inland Waters Directorate, Water ResourcesBranch, Ottawa.
• Manual of Hydrometric Data Commutations and Publication Procedures. 5th ed.1980.
• Hydrometric Field Manual - Measurement of Streamflow. R. A. Terzi. 1981.
• A guide to Gauging Station Inspection. R.A. Terzi. 1972.
• Hydrometric Field Manual - Measurement of Stage. R.A. Halliday, R.A. Terzi. 1976.
• Hydrometric Field Manual - Leveling. R.A. Terzi. 1984.
• Methods for the Estimation of Hydrometric Data. 1984.
Rantz, S.E. et al. 1982. Measurement and Computation of Stream flow Vol. 1.Measurement of Stage and Discharge, Water Supply Paper 2175, U.S. GeologicalSurvey.
Techniques of Water-Resources Investigations of the United States Geological Survey,Book 3:
• Chapter A2, Measurement of Peak Discharge by the Slope-Area Method.
• Chapter A4, Measurement of Peak Discharge at Width Contractions by IndirectMethods.
• Chapter A7, Stage Measurement at Gauging Stations.
• Chapter A13, Computation of Continuous Records of Streamflow.
• Chapter A19, Levels at Streamflow Gauging Stations.
• Chapter A13, Computation of Continuous Records of Streamflow.
Military Engineering, Vol. III - Part I, Bridging (General principles and materials), Vol.V1, Water Supply, (1936), H.M. Stationary Office, UK.
Stevens Water Resources Data Book. Leopold & Stevens, Inc. (3rd edition).

Standard Operating Procedures for Hydrometric Surveys
296 November 2, 1998
Isco Open Channel Flow Measurement Handbook. Douglas M. Grant, Brian D. Dawson.
Hydrological Services PTY. Ltd. PO Box 332, Liverpool, 2170, Sydney, NSW,Australia: Operating Instructions for the following Sherlock Instruments, Mode OSSB1, OSS PC1, CMC 20 & 200 and 20 mm Rod & Locating Device.