vite: a visual interface supporting the direct ...lieber/iui/hsieh/hsieh.pdf · vite: a visual...
TRANSCRIPT
VITE: A Visual Interface Supporting the DirectManipulation of Structured Data Using Two-Way
MappingsHao-wei Hsieh and Frank M. Shipman III
Department of Computer Science & Center for the Study of Digital LibrariesTexas A&M University, College Station, TX 77843-3112, USA
TEL: 1-409-862-3216E-mail: {haowei, shipman}@cs.tamu.edu
ABSTRACTInformation processed by computers is frequently stored andorganized for the computer’s, rather than for the user’s,convenience. For example, information stored in a databaseis normalized and indexed so computers can efficientlyaccess, process, and retrieve it. However, it is not natural forpeople to manipulate such formal/prescriptiverepresentations. Instead, people frequently sort items byrough notions of association or categorization. One naturalorganizational process has been found to center aroundmanipulations of objects in spatial arrangements. Examplesof this range from the organization of documents and otheritems on a regular office desktop to the use of 3”x5” cardsto organize a conference program. Using visual cues andspatial proximity, people change the categorizations of andrelationships between objects. Without the help of indicesor perfect memory people can still interpret, locate, andmanipulate the information represented by the items and thehigher-level visual structures they form. The VITE systempresented here is an intuitive interface for people tomanipulate information in their own way and at their ownpace. VITE provides for configurable visualizations ofstructured data sets so users can design their own"perspectives" and a direct manipulation interface allowingediting of and manipulation on the structured data.
KeywordsInformation visualization, visual languages, structured datamanipulation, multiple perspectives, direct manipulation,visual parsing, spatial pattern recognition
INTRODUCTIONIt is natural for people to perceive and arrange informationvisually. In the course of conference planning or productdevelopment, we see people taking notes on note cards
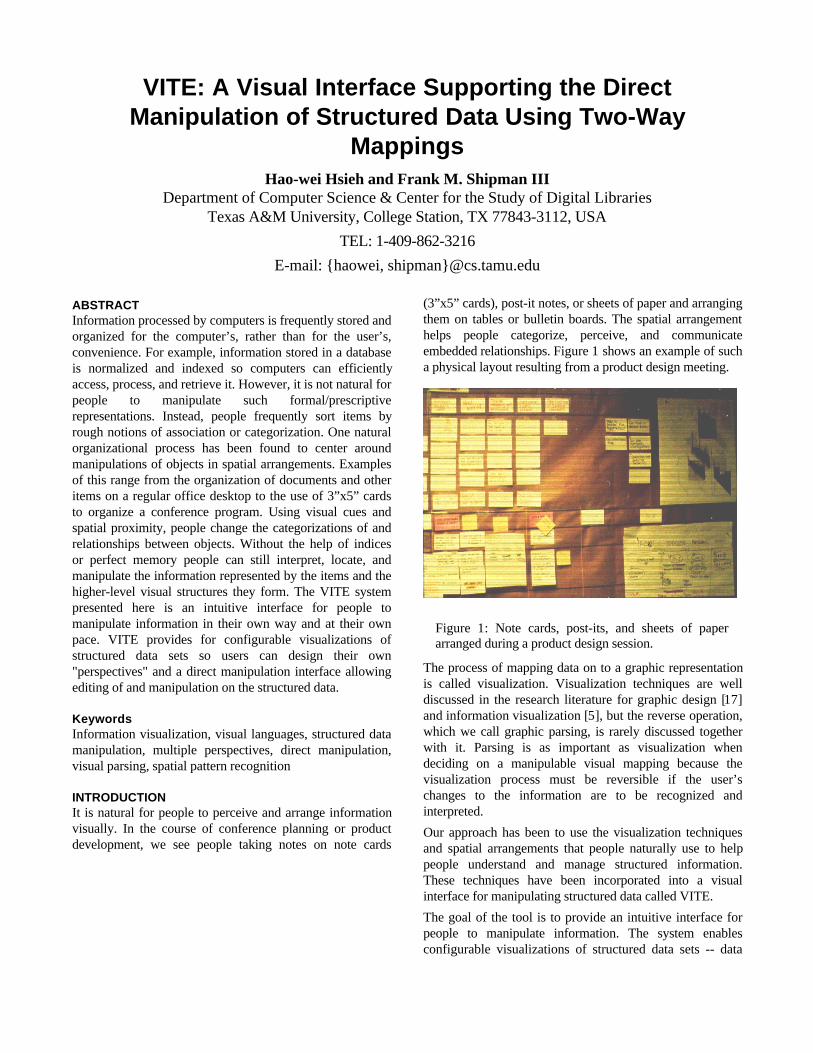
(3”x5” cards), post-it notes, or sheets of paper and arrangingthem on tables or bulletin boards. The spatial arrangementhelps people categorize, perceive, and communicateembedded relationships. Figure 1 shows an example of sucha physical layout resulting from a product design meeting.
Figure 1: Note cards, post-its, and sheets of paperarranged during a product design session.
The process of mapping data on to a graphic representationis called visualization. Visualization techniques are welldiscussed in the research literature for graphic design [17]and information visualization [5], but the reverse operation,which we call graphic parsing, is rarely discussed togetherwith it. Parsing is as important as visualization whendeciding on a manipulable visual mapping because thevisualization process must be reversible if the user’schanges to the information are to be recognized andinterpreted.
Our approach has been to use the visualization techniquesand spatial arrangements that people naturally use to helppeople understand and manage structured information.These techniques have been incorporated into a visualinterface for manipulating structured data called VITE.
The goal of the tool is to provide an intuitive interface forpeople to manipulate information. The system enablesconfigurable visualizations of structured data sets -- data

made up of multiple attribute values, such as frames orobjects in a knowledge base or rows in a relational database.VITE includes a direct manipulation interface forgraphically editing the structured data. By enabling multiplemanipulable visual "perspectives" of data, people mayorganize, categorize, and manipulate information in theirown way, making the characteristics that are most importantfor the particular person or task easiest to recognize. Themultiple perspectives facility guarantees that the tool doesnot coerce the user into a premature commitment to a fixedvisual structure, but allows the salient characteristics tochange over time as the user discovers new requirements intheir current task or identifies new uses for the information.Thus, not only is having one manipulable visual mapping ofthe information beneficial for many tasks, but supporting avariety of mappings for the same data will enable the systemto support a wider variety of tasks over a longer period oftime.
The next section of this paper describes VITE’s interfaceand system architecture. A discussion of related work is thenpresented. This is followed by scenarios of use in a numberof domains to convey the application and usefulness of thesystem and a discussion of issues related to the visualmappings for encoding structured data. We conclude with adescription of our lessons so far and plans for future work.
VITE: DESIGN AND IMPLEMENTATIONInterfaceVITE, a visual interface for manipulating structured data, isdesigned to support rapid visual/spatial interactions withinformation objects similar to those observed in the use ofpaper and electronic media [6]. The interface lets users viewand edit information as if they were manipulating note cardson a working surface. VITE currently limits users to a twodimensional workspace where objects can overlap with eachother.
The interface of VITE consists of a main working areasimilar to a drawing application (Figure 2). Data elementsare represented as visual information objects, which operatemuch like desktop icons. Information objects can be movedand resized through direct manipulation. Other graphicalproperties, such as color and border width, can be modifiedby selecting visual attributes from the toolbar or from apopup menu.
VITE provides a two-way graphical mapping for movinginformation to and from the database or other knowledgestore; we call this mapping a perspective. Each perspectiveencodes specific attributes of the data as graphicalproperties. The encoding for the information can beredesigned and saved for repeated use. Users may create avariety of different mapping profiles to serve as differentperspectives for the same data set. Thus, VITE providesusers of traditional databases or object stores the ability to
view and manipulate the same set of data through a varietyof visual mappings.
Figure 2: VITE interface showing the visual interactiveworking area and a tabular data viewer. Data elementsare represented as visual objects in the working areaand rows in the tabular viewer.
Once the database or knowledge base is mapped into agraphical display, information can be modified by draggingthe object into a different area of the graphical layout or bychanging other visual attributes (like color, border width,etc.). Interactions between the user and the interface areimmediately interpreted by the system and the results arereflected in both the visual representation and in thestructured information stored in the database. This allowsthe possibility that synchronous users could manipulate thesame data set via different visual representations given suchsupport from the database/knowledge-base layer.
System ArchitectureThe basic skeleton of VITE is similar to an interactivedrawing program that provides simple object manipulationcapabilities on the graphical display. This similarity allowsskill transfer so that most users have no trouble learning tomanipulate the data presented. Figure 3 shows the VITEcomponent architecture.
The Mapping Engine is the heart of VITE. It contains aGraphic Parser and a Graphic Renderer. The mappingengine calculates the region allocated for the informationcategories in the data set and stores the boundaries andmapping criteria.
The graphic parser interprets user input and intentionsinteractively. The graphic renderer projects the data set intothe graphical display according to the mapping assignments.Working together, the graphic parser and graphic renderer

synchronize interpreted results between the structured datastore and the graphical displays.
Figure 3: VITE components.
VITE also provides a traditional Tabular Data Viewer(Figure 6). It shows the structured data a table listingattribute values in a traditional way. Updates to data eitherin the visual workspace or in the table viewer areimmediately reflected in the other.
The Mapping Designer (Figure 9) presents the visualmapping assignments to the user and can also be used to editor create new visual mappings. Each attribute is listed withinformation about the types of values allowed andselections for visual attributes. The mapping designer and itsuse will be described in more detail later in the paper.
RELATED WORKThe design of VITE has been influenced by research in tworelated areas: (1) visualization systems and (2) systemssupporting the direct manipulation of structured data.
Visualization SystemsMost visualization systems focus on transformingstructured or unstructured data into a graphical displayaccording to visualization constraints such as whatcharacteristics of the data can be mapped to visualattributes. Visualization systems can help users perceive andunderstand patterns in large information spaces [11].
Robertson and colleague’s Information Visualizer [10] andKumar's Timeline project [4] provide examples of assigningvisualization mappings for specific tasks. The attributes of adatabase are assigned to different graphical propertiesaccording to different task domains. Visualization can be auseful tool for identifying desired items in a corpus. Musai[7] demonstrates the effectiveness of combining datavisualization, keyword search, and category search whenlooking for information using multiple, vaguely definedcriteria.
Research aiming to provide multiple visualizations of a dataset at the same time includes FOCUS [15], FINESSE [18],SSR & SIV [2] and Table Lens [9]. For example, FOCUS is
an interactive table viewer for comparing multiple attributesin a table using fisheye techniques. The configurablefocus+context for data exploration shares some conceptswith VITE in the support for task-dependent or user-dependent visualizations of information. SSR, SIV, andFINESSE use a spreadsheet environment to view and editmultiple visualizations at the same time. The Table Lens isalso a spreadsheet environment for exploring large data setsbut with support for focusing attention on subsets.
SAGE [12] and GlyphMaker [19] aim at providingconfigurable visualizations of data. These systems allowvisualization mappings to be edited using diagrammanipulation and schema drawing. SAGE includes anintelligent mechanism for generating visualizations of data.
Software visualization systems, like Tango [16], couplealgorithm execution to animation components with userdesigned mappings. The Tango framework focuses onalgorithm animation and reveals some mapping designissues.
The systems described provide a variety of means toperceive, understand, and find information. They do notsupport easy modification of data once the data is mapped tothe visual display or for visual changes to the data to resultin changes to the underlying data.
Direct Manipulation of Structured DataVITE uses direct-manipulation and visual attributes tomodify the information displayed. Direct manipulation iscommon in operating system desktops and in drawing andgraphics software due to the intuitive and efficientinteraction provided to the user. Hollan [3] and Ballas [1]concluded that performance advantages and directengagement are benefits of direct manipulation interfaces.
The second author’s prior work on VIKI [14] combines adirect manipulation interface with spatial structurerecognition but does not include a visualization system togenerate initial views. VITE extends the work on VIKI byadding a graphic renderer to generate initial views,broadening the recognition capabilities to include mappingsbetween visual and semantic attributes.
Tivoli [8], software for electronic whiteboards in meetingroom situations, shows the possibility of interpreting directmanipulation interaction techniques based on boundariesand the implicit recognition of regions. Tivoli’s domainobjects are also similar to VIKI and VITE visual symbols,providing manipulable visual representations of domain-specific data.
Visage [13] provides an environment for informationanalysis that integrates a variety of mini-visualizations forspecific tasks or applications. Users can drag informationbetween the various visualizations and can modify elementswithin the visualizations (e.g. changing the color of specificobjects.) Such changes are reflected in the othervisualizations but have no semantic effect on the data.

Figure 4: Budget meeting scenario with mappingsetting shown in table 1.
Figure 5: Budget meeting scenario, with semanticattribute “productivity benefit” mapped to visualattribute “width”.
VITE, combining the concepts of visualization and directmanipulation with a general purpose two-way mappingengine, allows users to selectively visualize their data withpreferred mappings according to their tasks and needs, andmodify the database contents within the visual workspace.
EXAMPLE TASKSThis section provides examples of VITE use to motivatefurther discussion. The first example involves using VITE ina budget meeting. In this scenario, a total budget has beenset for four departments and the task is to select expenserequests that will be approved. Each expense has beenassigned a priority and an expected productivity benefit.Spreadsheets, or a calculator and piece of paper, might bethe most common tools for this task. VITE is not as preciseas these tools for quantitative calculations, but it maybenefit from the visual representation of individual expensesand the overview of current decisions.
As an example, the department managers decide on a firstvisualization of the requests and their status (shown inFigure 4) using the visual mapping in Table 1:
Visual attribute Semantic attributeVertical Size Budget amount/expenseHorizontal position DepartmentColor PriorityVertical position Status (approved/pending/denied)
Table 1: Mapping 1 for budget meeting.
The managers later decide to take into account the expectedproductivity benefit of pending requests and modify themapping by setting the horizontal size to the productivitybenefit. This second perspective (Figure 5) providesadditional clues for obtaining a beneficial decision whilestaying within the budget limit. Now the width/height ratioof an expense indicates the expected payback on investment.When the managers decide to change the amount of afunding request, they use the tabular data, shown in Figure6, since resizing the height would result in imprecisechanges.
Figure 6: Budget meeting, Tabular View.

Figure 7: Airport flight management. A perspectiveused by ground control for terminal/gate assignment.Color, border width, and border color are assigned toaircraft type, engine type, or size category respectively.E.g. twin-engine, tri-engine, or four-engine; jet,propeller, or turbo fan; private, passenger, or cargo, etc.
Figure 8: A perspective for ground crews to monitoraircraft preparation status, and help managing resourceallocation among these gates.
The second example is an airport flight status managementenvironment. In this scenario, passengers need easy-to-understand information about their flights and controllers,flight crews, ground crews, and gate personnel need theability to review and update aspects of the flight status.Although all aircraft are monitored by all controllers,different tasks are performed by each controller. Forexample, approach control and departure control focusmainly on the approach/departure route and runwayassignment. Ground control focus on taxi sequence, taxiway clearance and parking/terminal assignment. Airline
liaisons are interested in the schedule status (on time,delayed, or canceled) of their aircraft.
Using VITE, visualizations can be tailored for each class ofuser so the relevant aspects of flights are clearly illustratedand easy to alter. Figure 7 shows a possible mapping usedby a controller. When the airport personnel need to changeany information, they can directly manipulate the attributeusing their tailored perspective. Not currently in VITE,security could also be included so only certain informationis editable in each perspective. Figure 8 shows a mapping ofthe same data set but with the monitoring and updatinginformation needed by ground crews. Notice some of theinformation is needed in multiple views.
These two scenarios demonstrate some potential uses ofVITE. VITE is useful for applications which require:
• easy to perceive structured information,
• constant modification of information,
• objects identified in multiple categorization schemes,
• multiple perspectives of the same data, and
• shared manipulation of structured information.
VISUAL MAPPINGS OF STRUCTURED DATAGeneral Design PrinciplesTo support the users in the two scenarios above, VITE needsa two-way mapping engine. The mapping engine needsmapping information which is defined as a perspective forthe users. This mapping information can be pre-determinedand stored in a file or can be designed by the user. Thisinformation includes the mapping style, mappingconstraints, graphical properties, attribute mapping pairs andspecial characteristics for each attribute in the database.
In the mapping designer interface, mapping informationmust be checked for conflicts. For example, considervisualizing car engine performance where a car’s velocity ismapped onto the X-axis. In this case, the width of theinformation object is not yet defined and can be assigned torepresent another attribute such as acceleration. If theinformation object represents a historical event, we maywant the X-axis to display the starting time and ending timeof the event. In this case, the width (X-size) of theinformation object is predetermined and cannot be assignedto any other attribute. Such constraints will be checkedwhen the user designs a new mapping using the mappingdesigner.
Position may also be used to represent discrete attributes asthe Y position did in the budget scenario in the priorsection. For discrete data, information objects are parsedaccording to their region, not by a specific location value.These region boundaries are pre-calculated and stored inmapping database when the data is loaded into the workingarea.

Mapping DesignerA preliminary version of the mapping designer is shown inFigure 9. In this interface, users can match semanticattributes of the data set to visual attributes in the display.This tabular interface provides information about thesemantic attribute (its name, type, and style.) Users selectvisual attributes and details the mapping from menus on theright. A new mapping designer is currently underconstruction. It will provide a drag and drop interface wheregraphical attributes are represented as icons located in a"mapping pool". Users drop the desired visual attribute iconon the semantic attributes to connect them. The system willrestrict the use of visual attribute icons to enforce anyexclusion or constraints, such as the ability to use only twoof the X-size, X-start and X-end visual attributes, asdiscussed earlier.
Figure 9: Mapping Designer.
The mapping designer must also serve as a data analyzerbecause the system needs all the potential values of anattribute to determine the spatial parsing boundaries. Thisinformation is also useful when choosing a graphicalmapping.
For instance, if an editable attribute has only 5 or 6 possiblevalues, it may be suitable for a color mapping, or a borderwidth mapping, but if the attribute has too many possiblevalues, the user should consider using X/Y-position orsimply text label mappings.
Deciding which semantic attribute is mapped to whichvisual attribute is complex. The following sections discussissues related to some of the graphical properties in themapping model.
Graphical PropertiesDesigning graphical mappings combines issues of designinggraphical presentations with issues of the manipulability ofattributes and parsibility of results. Graphical presentationscan be viewed as sentences of graphical languages [6].
Graphical properties, such as position, encode functionalinformation. Therefore, the choice of graphical propertieshas a great influence on the design of graphical languages,and thus the design of graphical presentations.
Visual effectiveness and expressiveness criteria [6]determine if a particular graphical presentation will result ina good design. These criteria are still important concerns inthe mapping design, but for VITE, we have to consider notonly the visualization effectiveness but also manipulationeffectiveness.
The graphical properties manipulable in VITE are: position,size, color (both border and internal), border width, andlabel. The following identifies characteristics of theseproperties which affect mapping decisions.
Position: Position is one of the most obvious anddistinguishable properties for visual perception, and is themost effective property for direct manipulation. Thus it isour first choice of graphical properties for semanticattributes requiring frequent manipulation.
Position can be used for two classes of visual mappings [4],one is categorical mapping, for representing discrete-valuedattributes, and the other is numerical mapping, forrepresenting continuous-valued attributes.1 The number ofdiscrete values that can reasonably be mapped to position isdependent on screen real estate and object size.
Size: The second spatial property of objects in VITE is size.As previously explained, sometimes this property isexclusive of the "position" property. One consideration inthe assignment of attributes to the vertical and horizontalsize properties is that they effect the perceived volume ofthe object as a whole. Size can be used for both continuousand discrete values. The number of discernable discrete sizevalues depends on the screen’s size.
Color: Color may or may not be a very distinguishableproperty. It can be easy to identify a small set of colors, e.g.red, blue, yellow, etc., but it can be tricky to distinguishshades of gray. Nevertheless, color is an important graphicalproperty for information visualization. It is difficult forusers to modify color precisely enough for continuous data.Thus, the color property is recommended to be used fordiscrete mapping or as a display-only attribute forcontinuous data. In VITE, both border color and backgroundcolor can be assigned to each visual symbol.
It is also tedious to define the mapping pairs (data attributevalue and color pairs) if you have to manually define them.Because there is not always an obvious way to assign colorsto attribute values, a good mapping does not come directlyby scanning all the candidate values from the database. VITEpreprocesses and scans and can assign the mapping randomlyor sequentially based on available colors. But this approach
1. Mackinlay distinguished between three styles:Quantitative, Nominal, and Ordinal.

is as likely to choose red for “cold” and blue for “hot” as theother way around. For automatically generated colormappings, the mapping information needs to be exposed inadvance.
Border width: Border width can be used to representsemantic attributes that have only a few possible values butneed to be easily distinguishable. VITE uses easy-to-reachapplicable tool buttons to support the rapid change ofborder width and color.
Label: Since labels are presented as text, assigning anattribute to the label is the most direct way to retain theinformation stored in the database in the visualization.Labels are also useful for making sure the users canunderstand the value of the attribute. The problem withusing labels is that it supports little, if any, directmanipulation. Modifying a label is not any different thanmodifying a text-editor-based database.
Resolution and Error in Mapping DesignResolution and error must be considered when selecting atwo-way mapping. Error, the inaccurate selection of visualattribute values for given data values, is not a problem forvisualization (data-to-graphics mapping) because data canbe deterministically mapped to a visual attribute. Resolutionremains an issue since the number of data attributes andvalues that need to be represented visually may require manysemantic values map to similar visual values. Suchmappings are more likely to cause user confusion.
Error is a problem for parsing (graph-to-data mapping),because users manipulating objects with a mouse cannot beexpected to be as precise as the system is calculating thevalues and assigning the mappings. One simple solution forthis problem is to provide real time display of the mapping-information (e.g. the real value-change of the operation)while the object is dragged on the screen. Other possiblesolutions include: layered operation for the requirement ofprecise manipulation, so the users do the coarse operationby direct manipulation and fine tune the value with the helpof a value input or slide controller interface. Gridconstraints also can be used and can be predefined so thevalues will always fall into these grid slots as desired.
Due to the limited number of easily manipulable visualattributes, VITE enables multiple perspectives so users canwork with their favored perspective for their current need. Atraditional text-based database editor interface is provided aswell, so as to not force the users to change the perspectivewhenever they need to modify rarely modified attributes orin situations when a text-based table is appropriate.
DISCUSSION AND FUTURE WORKThere are limitations to the semantic and visualrepresentations that VITE currently supports. One suchlimitation is that it cannot visually represent explicitrelationships between data objects. Explicit relationships in
the database would be naturally represented by links in thegraphical environment, but such links are currently notsupported.
Multiple visual occurrences for one data object is anotherchallenge. Consider the case of a data categorization task.Different users may want to classify the same object indifferent categories, or it simply belongs to two or morecategories. For example, we may want to classify “IndustrialDesign” as an “art” subject, but some may classify it as a“science” subject, or perhaps it belongs to both categories.For better support of progressive categorization, VITEshould encourage vague classifications as well as distinctcategorizations. Taken one step further, the user may evenspecify the classification using a visual attribute to assign arough belief or expectation value, say 70% towards “art”and 30% “science”, so “Industrial Design” is classifiedmore “art” than “science”.
SUMMARYThe use of two-way visual mappings to support themanipulation of structured data has many potential uses. Byproviding users with multiple perspectives of their datawhich they can edit through a direct manipulation interface,VITE enables work practices seen in other media.
Through VITE, we are investigating the combination ofvisualization and graphical parsing to provide domain-andtask-specific interfaces to structured data sets. This workhas pointed out the complexity of designing goodvisualizations that also work as good visual editors. Thework on VITE suggests many additional research issuesworth investigation.
ACKNOWLEDGMENTSThis work was supported in part by grant IIS-9734167 fromthe National Science Foundation.
REFERENCES1. James A. Ballas, Constance L. Heitmeyer and Manual A.
Perez. Evaluating two aspects of direct manipulation inadvanced cockpits. In Proceedings of CHI ‘92, May 3-7,1992, pp.127-134.
2. Ed Huai-hsin Chi, Phillip Barry, John Riedl, JosephKonstan, A Spreadsheet Approach to InformationVisualization. In Proceedings of InformationVisualization ‘97, pp.17-24.
3. Edwin L. Hutchins, James D. Hollan, and Donald A.Norman, Direct manipulation interfaces. In Donald A.Norman & Stephen W. Draper (Eds). User-centeredsystem design. Erlbaum Associates, Hillsdale, NJ, 1986,pp. 87-124.
4. Vijay Kumar, Richard Furuta, and Robert B. Allen,Metadata Visualization for Digital Libraries: InteractiveTimeline Editing and Review. In Proceedings of DigitalLibraries ‘98, pp.126-133.

5. Jock D. Mackinlay. Automating the design of graphicalpresentations of relational information. In ACMTransactions on Graphics, Vol. 5, No. 2 April 1986,pp. 110-141.
6. Catherine C. Marshall, and Frank M. Shipman III.Searching for the Missing Link: Discovering ImplicitStructure in Spatial Hypertext. Proceedings of Hypertext‘93, Seattle, Washington, November 14-18, 1993, pp.217-230.
7. Toshiyuki Masui, Mitsuru Minakuchi, George R. BordenIV, Kouichi Kashiwagi. Multiple-view Approach forSmooth Information Retrieval, In Proceedings of UIST‘95, November 14-17, 1995, pp.199-206.
8. Thomas P. Moran, Patrick Chiu, William van Melle.Pen-based interaction techniques for organizing materialon an electronic whiteboard. In Proceedings of UIST‘97, October,1997, pp. 45-54.
9. Ramana Rao and Stuart K. Card. The table lens: Merginggraphical and symbolic representations in an interactivefocus+context visualization for tabular information.Proceedings CHI ‘94 Human Factors in ComputingSystems, ACM, April 1994, pp.318-322.
10. George G. Robertson, Stuart K. Card, and Jock D.Mackinlay. Information visualization using 3Dinteractive animation. Communications of the ACM,36(4), April 1993, pp.57-71.
11. Russell R. Rose, P1000 Science and TechnologyStrategy for Information Visualization, September1996.
12. Steven F. Roth, John Kolojejchick, Joe Mattis, JadeGoldstein, Interactive Graphic Design Using AutomatiPresentation Knowledge, in Proceedings of CHI ‘94,pp.112-117.
13. Steven F. Roth, Peter Lucas, Jeffrey A. Senn, Cristina C.Gomberg, Michael B. Burks, Philip J. Stroffolino, JohnA. Kolojejchick and Carolyn Dunmire, Visage: A UserInterface Environment for Exploring Information, inProceedings of Information Visualization ‘96, pp.3-10.
14. Frank M. Shipman, Catherine C. Marshall, and ThomasP. Moran, Finding and Using Implicit Structure inHuman-Organized Spatial Layouts of Information.Proceedings of CHI ‘95, Denver, Colorado, May 7-11,1995, pp. 346-353.
15. Michael Spenke, Christian Beilken, Thomas Berlage,FOCUS: The Interactive Table for Product Comparisonand Selection, in Proceedings of UIST ‘96, pp.41-50.
16. John T. Stasko, Tango: A Framework and System forAlgorithm Animation, in IEEE Computer, Sept 1990,pp.27-39.
17. Edward R. Tufte, The Visual Display of QuantitativeInformation, 1983.
18. Amitabh Varshney and Arie Kaufman, FINESSE: AFinancial Information Spreadsheet, in Proceedings ofInformation Visualization ‘96, pp.70-71.
19. Glyphmaker: An Interactive, Programmerless Approachfor Custom Visualization and Analysis of Data, GeorgiaTech "Tech Report", URL:http://www.cc.gatech.edu/scivis/research/glyph/glyph.html.