vitamin c, folate, and phytochemical compounds of
TRANSCRIPT

Pharmaceutical Sciences Asia Pharm Sci Asia 2019; 46 (4), 218-230 DOI:10.29090/psa.2019.04.018.0044
218
Vitamin C, folate, and phytochemical compounds of organically versus inorganically grown fruits and vegetables commonly consumed in Thailand Ratchanee Kongkachuichai*, Rin Charoensiri, Aurawan Kettawan Institute of Nutrition, Mahidol University, Salaya, Phuthamonthon Nakhon Pathom 73170, Thailand.
*Corresponding author: Ratchanee Kongkachuichai
Keywords: Organic; Inorganic; Fruits and
vegetables; Bioactive
compounds; Vitamin C; Folate
https://www.pharmacy.mahidol.ac.th/journal/
© Faculty of Pharmacy, Mahidol University (Thailand) 2018
ABSTRACT
Currently, organic plants are very popular among
consumers due to lack of pesticide residues and their being good
sources of bioactive compounds. However, only a few reports have
compared bioactive compounds in organically versus inorganically
grown plants. Consequently, this study’s objective was to determine
vitamin C, folate, carotenoid and flavonoid contents in 5 varieties
of vegetables (kale; Brassica albroglabra, cabbage; Brassica
oleracea var. capitata, carrot; Daucus carota subsp, tomato;
Solanum lycopersicum and yardlong bean; Vigna unguiculata ssp.
Sesquipedalis) and 5 varieties of fruits (pineapple; Ananas
comosus, papaya; Carica papaya, long kong; Lansium parasiticum,
rambutan; Nephelium Lappaceum and watermelon; Citrullus
lanatus) that had been grown organically and inorganically . Results
showed that vitamin C and folate contents in inorganic plants,
particularly, carrot, yardlong bean, pineapple, papaya, and
watermelon were slightly higher than those of organic ones. While
carotenoid contents in organic Chinese kale, tomato, and yardlong
bean were significantly higher than those of inorganic ones.
However, vitamin C, total carotenoid and flavonoid contents were
not significantly different between organic and inorganic plants,
except for Chinese kale. It is noted that, nearly all the selected
vegetables and fruits in present study were good sources of vitamins
and phytochemicals, especially Chinese kale showed excellent
amounts of vitamin C, folate, carotenoid and flavonoids while
watermelon contained good amount of lycopene. Therefore,
regularly consumed fruits and vegetables especially Chinese kale
and watermelon as a plant-based diet might lower the risk of chronic
disease due to the presence of high amount of bioactive compounds
in them.
1. INTRODUCTION
Currently, people are greatly interested in improving their
health, especially when an unhealthy diet is associated with the
onset of non-communicable diseases (NCDs). Consequently, fruits
and vegetables that are rich in natural antioxidants are receiving
greater attention, since evidence have shown that consuming such
foods are associated with preventing or delaying the onset of NCDs
and maintaining a healthy weight1,2. Several bioactive compounds
found in fruits and vegetables, such as vitamin C, polyphenol,
Research Article

Pharmaceutical Sciences Asia
219
carotenoids, and flavonoids have shown a strong
inverse correlation with many chronic diseases,
including cancer, hypertension, diabetes,
cardiovascular disease, and neurological
disorders3-7. Consumers, however, are also
becoming more aware of the adverse health
effects of toxic residues in fruits and vegetables
that are used in cultivation, such as chemical
fertilizers, herbicides, and pesticides.
Consequently, the demand for organic fruits and
vegetables is increasing among consumers,
health educators, farmers, and food retailers.
Consumers, especially, believe that organically
grown fruits and vegetables are free of pesticide
residues and are of better quality, healthier, and
more nutritious compared to conventionally
grown produce.
It is hypothesized that since organic
fruits and vegetables cultivated without the use of
insecticides or chemical pesticides, protect
themselves against the environment by
increasing their own protective or chemical
substances in order to defend against free radical
reactive oxygen species (ROS) in the
environment, ultra violet light (UV), as well as
insect pests, diseases, and bacteria that could
damage or destroy cells8. Some studies have
found no significant differences in nutrient
content and bioactive compound values between
organically and conventionally grown fruits and
vegetables, since it can be affected by geographic
location, local soil, climactic conditions,
seasonality, maturity at time of harvest, and post-
harvest storage practices9.
In Thailand, no data are available
comparing nutrient content and bioactive
compounds between organic and inorganic fruits
and vegetables. Consequently, this study
compared nutrients (folate and vitamin C
content) and antioxidant content (8 forms of
flavonoids and 6 forms of carotenoids) in 5
varieties of certified organic and inorganic fruits
(pineapple, Ananas comosus; papaya, Carica
papaya; long kong, Lansium parasiticum;
rambutan, Nephelium Lappaceum; watermelon,
Citrullus lanatus,) and 5 varieties of vegetables
(cabbage, Brassica oleracea var. capitata; carrot,
Daucus carota subsp. Sativus; Kale, Brassica
albroglabra; tomato, Solanum lycopersicum;
yardlong bean, Vigna unguiculata ssp.
Sesquipedalis).
2. MATERIALS AND METHODS
2.1. Materials
Ten varieties of organically and
inorganically grown fruits and vegetables were
selected based on common consumption in
Thailand. Each variety was weighed to
approximately 3 kilograms and was collected
from July 2016 to July 2017. Six representative
samples of conventionally (inorganically) grown
fruits and vegetables were purchased from
traditional distribution trade centers in Thailand,
locally known as Talaad Thai and Talaad
Simummuang, as well as from Ratchaburi
province. Certified organic samples were
obtained from the Health Society Company,
which is an organic farm network that has
received the certification standard for organic
produce (IFOAM certified) by the participatory
guarantee system (PGS). During transportation
all the sample were kept in ice box with lid
covered and bring to laboratory in the same day
of purchased and immediately analyzed the
moisture and vitamin C content. Table 1 gives the
names and numbers of each studied variety.
Table 1. Name, scientific name and number of vegetable and fruit samples
English name Scientific name Number of sample
Vegetables 6
Chinese kale (organic and inorganic) Brassica albroglabra 6
Cabbage (organic and inorganic) Brassica oleracea var.capitata 6
Carrot (organic and inorganic) Daucus carota subsp.sativus 6
Tomato (organic and inorganic) Solanum lycopersicum 6
Yardlong bean (organic and inorganic) Vigna unguiculata ssp.sesquipedalis 6
Fruits 6
Pineapple (organic and inorganic) Ananas commosus 6
Papaya (ripen; organic and inorganic) Carica papaya 6
Long kong (organic and inorganic) Lansium parasiticum 6
Rambutan (organic and inorganic) Nephelium lappaceum 6
Water melon (organic and inorganic) Citrullus lanatus 6 Inorganic vegetables and fruits were purchased from three traditional distribution module trade centers in Thailand
(n= 6 of each variety). Organic vegetables and fruits were obtained from the certified organic farm network of Health Society Company in various provinces of Thailand (n=6 of each variety).
R. Kongkachuichai et al. Pharm Sci Asia 2019; 46 (4), 218-230
220
2.1.1. Sample preparation
Upon arrival at the laboratory, six sets of
the same variety of fruit or vegetable from the
trade centers and the Health Society Company
were individually washed with tap water to
eliminate any contaminants and rinsed again with
deionized distilled water. The edible portion of
each vegetable or fruit set was prepared and
homogenized separately (Ace homogenizer,
NISSEI, Ltd, Tokyo, Japan) in a dark room at
25ºC. Approximately 300 g of each homogenized
sample were pooled together to obtain a single
sample. Consequently, a total of six
representative composite samples were obtained
for each variety of vegetable and fruit.
Individual samples from the six representative
samples of the same variety (inorganic and
certified organic) were then analyzed in
duplicate. Moisture and vitamin C contents were
determined immediately after the samples were
homogenized and pooled. The homogenized
samples were divided into three portions and
stored in acid-washed polyethylene bottles. One
bottle was used to determine antioxidant content
(total polyphenol, 8 forms of flavonoids; ferulic
acid, myricetin, quercetin, luteolin, naringenin,
hesperetin, kaemferol and apigenin and
anthocyanidins; cyanidin and peonidin). The
second bottle was used for folate. The third bottle
was used to determine 6 forms of carotenoids
(lutein, zeaxanthin, beta-cryptoxanthin, alpha-
carotene, beta-carotene and lycopene).
2.2. Methods
2.2.1. Moisture content determination
To determine moisture content, each
sample was dried in a hot air oven at 100 ± 5ºC
until constant weight was obtained according to
AOAC method 950.46 (Latimer)10.
2.2.2. Vitamin C determination
Each sample’s vitamin C content was
analyzed using HPLC according to a
modification of the procedure of Brause et al.,11
In brief, 3-10 g of each homogenized sample was
weighed into a 50 ml volumetric flask, then 3 ml
of 10% metaphosphoric acid (MPA; Merck
Darmstadt, Germany) was immediately added
and diluted with deionized water to the required
volume. The diluted sample was then filtered
(Whatman #1, Whatman International Ltd.,
Maidstone, England). The pH of all sample
filtrate was adjusted to 5.0-5.25 with 4 M sodium
hydroxide or 10% MPA (w/v) prior to the
addition of 10 mg dithiothreitol (DTT, Sigma-
Aldrich, St.Louis, MO, USA). The solution was
mixed and incubated in the dark at room
temperature (25ºC) for 1 h. All sample solutions
were filtered (Whatman #42, Whatman
International Ltd., Miadstone, England) and then
re-filtered through a 0.45 µm syringe membrane
filter (Chrome Tech® Milford, MA, USA) before
injection for the HPLC analysis. Vitamin C
content was analyzed using HPLC system
equipped with a Waters 515 pump (Water
Corporation, Milford, MA, USA) and Jasco UV
975 detector (Jasco International, Co., Ltd,
Tokyo, Japan). Vitamin C was separated using a
Zorbax 5µm ODS column (250 x 4.6 mn) with an
analytical guard column C-130B (2 x 20 nm).
The mobile phase was 5% K2PO4 at a flow rate
of 0.8 ml/min. Vitamin C was monitored at 254
nm. The results were reported as milligram of
ascorbic acid per 100g of fresh weight
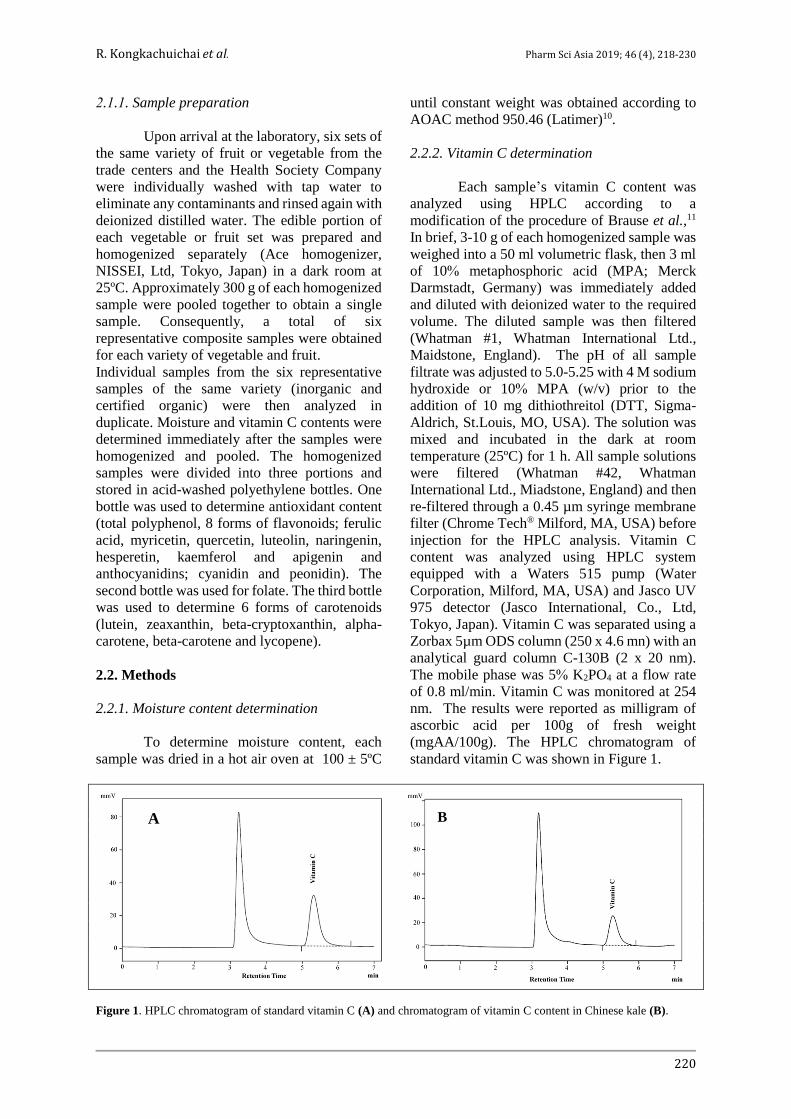
(mgAA/100g). The HPLC chromatogram of
standard vitamin C was shown in Figure 1.
Figure 1. HPLC chromatogram of standard vitamin C (A) and chromatogram of vitamin C content in Chinese kale (B).
A B
Pharmaceutical Sciences Asia
221
2.2.3. Folate content determination
Folate analysis was performed according
to the procedure of Li et al.,12 and DeVries et
al.,13,14. Briefly, each homogenized sample (3-
5g) was weighed into an Erlenmeyer flask into
which 100 ml of 0.1 M phosphate buffer, pH 7.8
was added. Each sample tube was then wrapped
in aluminum foil and placed in an autoclave at
120ºC for 10 min, and then cooled at room
temperature. Protease (2 mg/ml) per g sample
was added and the sample tube was placed in an
incubator (model 6500, Fisher Scientific) at 37ºC
for 3 h. Each sample tube was returned to the
boiling water bath for 5 min to inactivate
protease, followed by cooling at room
temperature. Thereafter, 1 ml (20 mg/ml) of α-
amylase per g sample was added, followed by
incubation for 2 h at 37ºC. The pH of the sample
was adjusted to 7.8 and 4 ml of chicken pancreas
conjugase solution was added, followed by
adding 0.5 ml of toluene, and incubated at 37ºC
for 16 h. The sample tube was returned to a
boiling water bath for 5 min to inactivate the
conjugate. The sample tube was cooled at room
temperature and diluted to appropriate volume
with deionized water, then the solution was
filtered through Whatman No.4 filter paper into
an Erlenmeyer flask. Thereafter, a pipetted
appropriate volume of the clear sample solution
was adjusted to pH 6.2 with acid or alkaline
solution. Finally, the clear solution was pipetted
at 0.5, 1 and 2 ml, and diluted to a final volume
(2 ml) with phosphate buffer pH, 6.2, followed
by adding 2 ml of folate assay medium (DifcoTM
Folic acid Casei Medium, Becton, Dickinson &
Co., Sparks, MD 21152, USA) and mixed
thoroughly. The sample tube was placed in an
autoclave at 110ºC for 10 min and rapidly cooled
down to room temperature using an ice water
bath. After this period, each sample tube was
inoculated with one drop of lactobacillus casei
ATCC 7469 and mixed thoroughly. The sample
tube was then returned to the boiling water bath
at 100ºC for 5 min to stop bacterial growth.
Growth was measured by turbidimetric method at
the wavelength of 630 nm.
2.2.4. Determination of 6 carotenoid forms
Samples were extracted following the
method of Speek et al., in a dark room to protect
carotenoids from degradation15. In brief, samples
were saponified by placing a 2-10 g homogenized
sample into a brown round-bottom flask. This
was followed by adding 10 ml of a freshly
prepared aqueous solution of 10% ascorbic acid
(Unilab # A79, Australia) and 50 ml of 2M
ethanolic potassium hydroxide (KOH) (Merck #
105033, Darmstadt, Germany). This
solution was refluxed in a boiling water bath for
30 min. Samples were then cooled to room
temperature. After adding 70 ml of hexane (J.T.
Baker # 9309-03, USA), the samples were mixed
by continuous shaking for 2 min. After
separation of the two layers, the upper layer was
transferred to a brown-glass separating funnel
containing 50 ml of 5% (w/v) KOH solution. The
samples were extracted twice with 35 ml of
hexane. The combined hexane extract was
washed with 100 ml of 10% (w/v) sodium
chloride (NaCl; UNIVAR # A465, Ajax
Finechem, Newzeland) and with a consecutive
100 ml water until it becomes alkali-free. An
aliquot was collected and evaporated in a rotary
evaporator (Buchi, Switzerland) under vacuum in
a 37°C water bath. The standard carotenoids in
this study included Lutein (0133, Carote Nature,
Germany), zeaxanthin (0119, Carote Nature,
Germany), β-cryptoxanthin (0055, Carote
Nature, Germany), lycopene (0031, Carote
Nature, Germany), α-carotene (0007, Carote
Nature, Germany) and β-carotene (C9750,
Sigma, USA). Analyses of carotenoids were
performed using an Alliance 2695, Waters HPLC
connected with Waters 486 UV/VIS detector
(Waters Corporation, USA). The residue of each
sample were dissolved in 1 ml methylene
chloride (CH2Cl2: J.T. Baker # 9324-68, USA)
and 2 ml mobile phase. Separation of carotenoids
in each sample was performed using a C18
column (Vydac 201TP, C18 4.6 x 250 mm, 5 μm
column, Grace division, USA) with a guard
column (Vydac 201TP, cartridge C18 4.6 x 12.5
mm, 5μm, Grace division, USA) at a flow rate of
0.7 ml/min at a controlled temperature at 30°C
and monitored at 450 nm. The mobile phase
consisted of HPLC-grade acetonitrile (CH3CN;
Lab Scan # LC 1005, Thailand): HPLC-grade
methanol (CH3OH; Lab Scan # LC 1115,
Thailand): methylene chloride (CH2Cl2; J.T.
Baker # 9324-68, USA): triethylamine (TEA;
Fluka # 90342, Switzerland): and ammonium
acetate (CH3COONH4; Merck # 1.01116,
Darmstadt, Germany) at a ratio of
90:8:2:0.085:0.085 (v/v/v/v and w/v). The results
of carotenoid contents in all fresh vegetable and
fruit samples were analysed in duplicate and
expressed as micrograms/100 g fresh weight
(μg/100g).

R. Kongkachuichai et al. Pharm Sci Asia 2019; 46 (4), 218-230
222
2.2.5. Determination of 8 flavonoid forms
Flavonoid content was determined using
a modified procedure following Merken &
Beecher.,16. Briefly, an approximately 3-5 g
homogenate sample was hydrolyzed in 40 ml of
62.5% aqueous methanol containing 0.5 g/l tert-
butylhydroquinone (Sigma-Aldrich, St. Louis,
MO, USA) and 10 ml of 6 N HCl (Merck,
Darmstadt, Germany) at 90˚C in a shaking water
bath for 2 hours (Memmert, Duesseldorf,
Germany). After cooling to room temperature,
100 µl of 1% ascorbic acid (Ajax Finechem,
Victoria, Australia) was added and each sample
was diluted to 50 ml with methanol (J.T. Baker,
PA, USA) and sonicated for 5 minutes (Branson
2510, Danbury, CT, USA). The solution was
filtered through a 2.5 µm pores filter (Whatman
International Ltd., Maidstone, England). Before
being injected for HPLC analysis, the solution was
passed through a 0.2 µm PTFE syringe filter
(Chrom Tech®, Milford, MA, USA). The standard
flavonoids in this study included ferulic acid (Fluka,
New York, USA), myricetin (Fluka, St. Quentin
Fallavier, France), quercetin (Fluka, Buchs,
Switzerland), luteolin (Fluka, Rehovot, Israel),
naringenin (Fluka, New York, USA), hesperetin
(Fluka, Gillingham, England), kaemferol (Fluka,
Neu-Ulm, Germany), and apigenin (Fluka, Neu-
Ulm, Germany). Flavonoid determination was
performed using an HPLC system consisting of a
quaternary gradient pump (Agilent G1315A,
Agilent Technologies, CA, USA), vacuum
degasser (Agilent G1379A, Agilent Technologies,
CA, USA), autosampler (Agilent G1329A,
Agilent Technologies, CA, USA), Zorbax Eclipse
XDB-C18 column (250 x 4.6 mm, 5 µm) with a
guard column (12.5 x 4.6 mm, 5 µm) of the same
stationary phase (Agilent Technologies, CA,
USA), a thermo-stated column control with
temperature at 30oC (Agilent G1316A, Agilent
Technologies, CA, USA), and diode array detector
(Agilent G1315B, Agilent Technologies, CA,
USA) at wavelengths of 210, 280, 325, 338, and
368 nm. Elution was carried out at a flow rate of
0.6 ml/min using the following gradients of water
(A), methanol (B), and acetonitrile (C), each
containing 0.05% (w/w) trifluoroacetic acid
(Merck, Darmstadt, Germany) with solvent
parameters as 0-5 min: 90-85% A, 6-9% B, 4-6%
C; 5-30 min: 85-71% A, 9-17.4% B, 6-11.6% C;
30-60 min: 71-0% A, 17.4-85% B, 11.6-15% C;
60-61 min: 0-90% A, 85-6%B, 15-4% C; and 61-
66 min: 90% A, 6% B, 4% C. The flavonoids peak
identification was done by comparing the
retention time and the UV spectrum of unknown
peaks to the authentic standards using
ChemStation software (Agilent G1379A, Agilent
Technologies, CA, USA). The results were
expressed as micrograms per 100g of fresh weight.
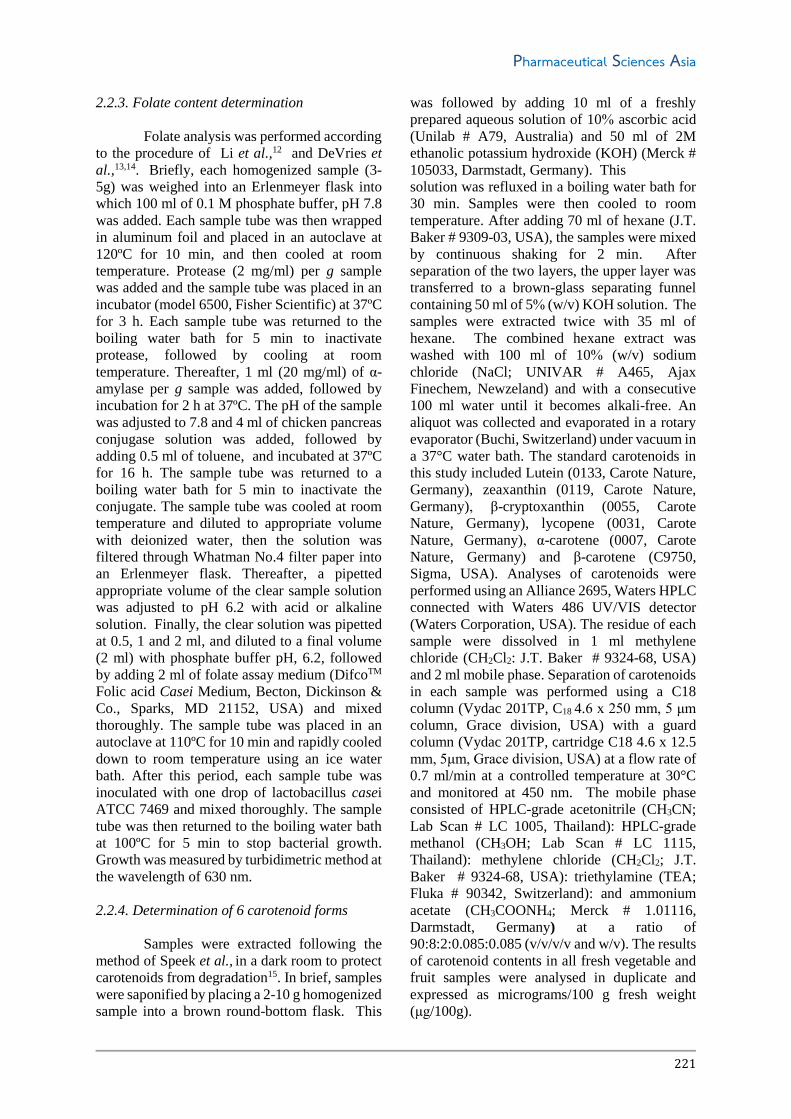
The HPLC chromatogram 8 form of standard
flavonoids as showed in Figure 2.
2.2.6. Quality control
In-house control materials (black rice
flour, Tang® natural fresh orange powder, and
whole milk powder) were used for quality control
of all analyzed data. Black rice flour and Tang®
were used as the daily control sample of
antioxidants and vitamin C content while whole
milk powder was used for total folate analysis.
Figure 2. HPLC chromatogram 8 form of standard flavonoids.
Pharmaceutical Sciences Asia
223
3. STATISTISTICAL ANALYSIS
Data were expressed as mean ± standard
deviation of duplicated analysis. Non-parametric
Mann-Whitney U-test was applied to compare
mean of nutrient content and bioactive
compounds between organic and inorganic fruit
and vegetable as same variety. The Statistical
Package for Social Science (SPSS) for Windows
version 19 (IBM Corporation, New York, USA)
was used to analyze the data. Statistical
significance was determined at a level of p <0.05.
4. RESULTS AND DISCUSSION
4.1. Moisture Content
The moisture content of 10 varieties of
vegetables and fruits ranged from 88.87% in
Chinese kale (Brassica albroglabra) to 94.53%
in cabbage (Brassica oleracea var.capitata) and
80.10% in rambutan (Nephelium lappaceum) to
91.12% in watermelon (Citrullus lanatus).
Moisture content of the same variety of fresh
vegetables and fruits grown under different
systems (organic and inorganic) showed no
significant differences (Table 2).
4.2 Vitamin C Content
Vitamin C is an essential phytonutrient
and is one of the most important water soluble
antioxidants found in fruits and vegetables17,18,19.
It acts as an antioxidant to prevent free radicals
from damaging tissues and inhibits LDL
oxidation that can lead to atherosclerosis.
Previous publications have shown that vitamin C
may reduce the risk of chronic diseases including
coronary heart disease, cancer, and various age-
related chronic diseases. However, humans are
incapable of synthesizing vitamin C due to the
absence of the enzyme L-gluconolatone oxidase.
Hence, this vitamin must be obtained from food.
Results of vitamin C analysis in fresh
vegetables and fruits used in the present study are
shown in Table 2 and Figure 1 showed an example
of HPLC chromatogram of vitamin C in Chinese
kale. Vitamin C content in vegetables ranged from
2.56 (inorganic carrot) to 64.25 (inorganic
Chinese kale) mg/100g wet weight, while in fruits
it ranged from 1.53 (inorganic long kong) to 48.12
(organic ripe papaya) mg/100 g edible portion.
Inorganic Chinese kale had higher average value
of vitamin C (64.25 mg/100g FW) than the
organic samples (50.62 mg/100g FW) at p < 0.05.
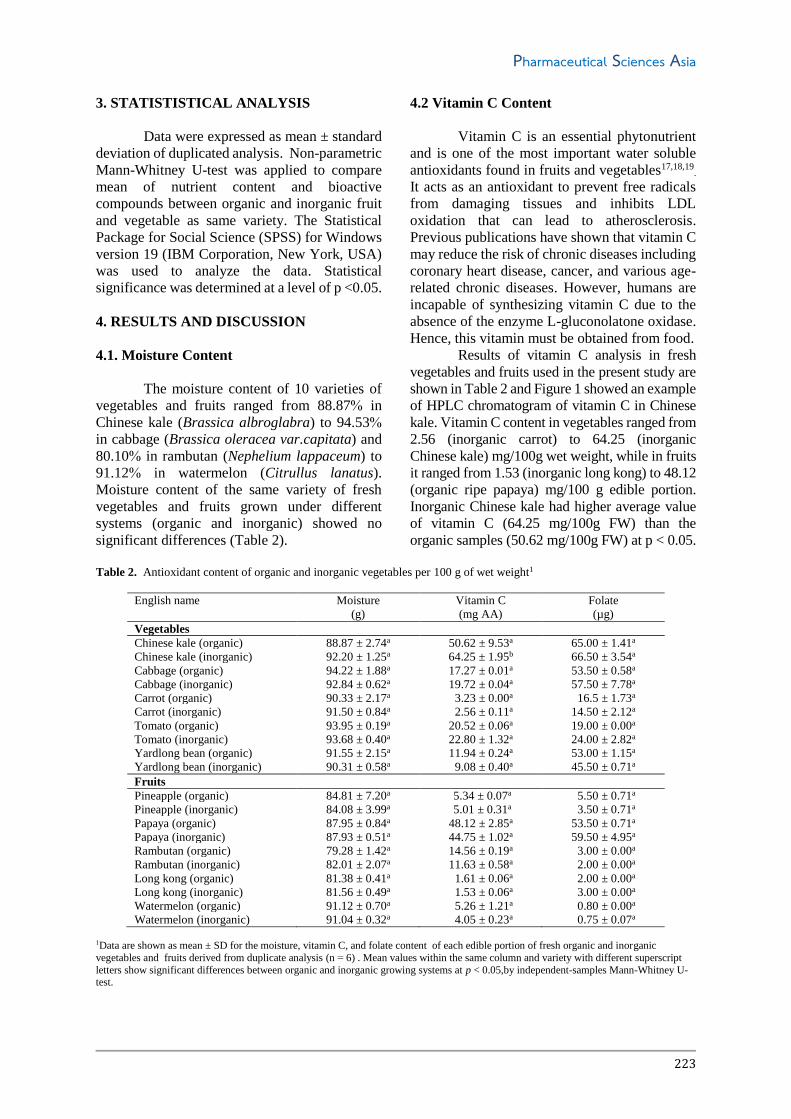
Table 2. Antioxidant content of organic and inorganic vegetables per 100 g of wet weight1
English name Moisture
(g)
Vitamin C
(mg AA)
Folate
(µg)
Vegetables
Chinese kale (organic) 88.87 ± 2.74a 50.62 ± 9.53a 65.00 ± 1.41a
Chinese kale (inorganic) 92.20 ± 1.25a 64.25 ± 1.95b 66.50 ± 3.54a
Cabbage (organic) 94.22 ± 1.88a 17.27 ± 0.01a 53.50 ± 0.58a
Cabbage (inorganic) 92.84 ± 0.62a 19.72 ± 0.04a 57.50 ± 7.78a
Carrot (organic) 90.33 ± 2.17a 3.23 ± 0.00a 16.5 ± 1.73a
Carrot (inorganic) 91.50 ± 0.84a 2.56 ± 0.11a 14.50 ± 2.12a
Tomato (organic) 93.95 ± 0.19a 20.52 ± 0.06a 19.00 ± 0.00a
Tomato (inorganic) 93.68 ± 0.40a 22.80 ± 1.32a 24.00 ± 2.82a
Yardlong bean (organic) 91.55 ± 2.15a 11.94 ± 0.24a 53.00 ± 1.15a
Yardlong bean (inorganic) 90.31 ± 0.58a 9.08 ± 0.40a 45.50 ± 0.71a
Fruits
Pineapple (organic) 84.81 ± 7.20a 5.34 ± 0.07a 5.50 ± 0.71a
Pineapple (inorganic) 84.08 ± 3.99a 5.01 ± 0.31a 3.50 ± 0.71a
Papaya (organic) 87.95 ± 0.84a 48.12 ± 2.85a 53.50 ± 0.71a
Papaya (inorganic) 87.93 ± 0.51a 44.75 ± 1.02a 59.50 ± 4.95a
Rambutan (organic) 79.28 ± 1.42a 14.56 ± 0.19a 3.00 ± 0.00a
Rambutan (inorganic) 82.01 ± 2.07a 11.63 ± 0.58a 2.00 ± 0.00a
Long kong (organic) 81.38 ± 0.41a 1.61 ± 0.06a 2.00 ± 0.00a
Long kong (inorganic) 81.56 ± 0.49a 1.53 ± 0.06a 3.00 ± 0.00a
Watermelon (organic) 91.12 ± 0.70a 5.26 ± 1.21a 0.80 ± 0.00a
Watermelon (inorganic) 91.04 ± 0.32a 4.05 ± 0.23a 0.75 ± 0.07a
1Data are shown as mean ± SD for the moisture, vitamin C, and folate content of each edible portion of fresh organic and inorganic
vegetables and fruits derived from duplicate analysis (n = 6) . Mean values within the same column and variety with different superscript
letters show significant differences between organic and inorganic growing systems at p < 0.05,by independent-samples Mann-Whitney U-test.
R. Kongkachuichai et al. Pharm Sci Asia 2019; 46 (4), 218-230
224
Similar results were reported by Ismail and Fun
wherein Chinese kale samples produced under a
conventional system presented higher values of
vitamin C20. In addition, previous publications
have shown higher vitamin C content in organic
tomatoes, potatoes, and leafy vegetables
compared to conventionally grown ones 21,22.
Differences in quality and nutrient
composition of vegetable and fruit samples were
observed in this study. Possibly, changes in the
management of chemicals and agricultural
practices, different weather conditions, or the
growing system could have played a role in
interfering with the influences and possible
effects of the cultivation system23. In addition,
present study’s vitamin C content of all inorganic
fruits and vegetables except cabbage were lower
than those reported in the Thai Food Composition
Tables and the Indian Food Composition 24,25.
Differences may be due to differences in the
varieties of plants, fertilizers used, cultivation,
soil, harvest time, post-harvest handling, and
storage conditions can influence nutrient and
antioxidants values in plants 18,19,26. According
to Thai dietary recommendations, consuming one
serving of either organic or inorganic ripe papaya
(130 g of edible portion) will meet the daily
vitamin C requirement of adults and children,
which is 60 mg/day. Foods that are ready to eat
can be classified as a good source when it meets
10-19% of Thai dietary reference intake (Thai
RDI) and as a rich source when it meets equal to
or greater than 20% of the Thai RDI27.
Consequently, a ripe papaya provides 100% of
the daily requirement for vitamin C and thus is
classified as a “rich” source of vitamin C.
In comparing the two different cultivation
systems, no significant difference was observed
for vitamin C content in fruits and vegetables.
Overall there was a trend of higher vitamin C
content in organically grown plants, particularly,
yardlong bean and 5 varieties of fruits. This might
be due to differences in the soil or fertilizer used
in cultivation, since previous publications have
suggested that the use of lower doses of nitrogen
fertilizer in the form of nitrates22.
4.3. Folate Content
Folates are water soluble vitamins that
play an important role as essential coenzymes in
the synthesis of purine and thymidine nucleotides
for fetal development and health maintenance.
Previous publications have indicated that an
adequate intake of folate helps to reduce the risk
of neural tube defects (NTDs), colon cancer,
Alzheimer’s, dementia, and cardiovascular
diseases 28,29,30. Present study gives valuable data
on the total folate contents of fruits and
vegetables commonly consumed in Thailand.
Among the 5 varieties of vegetables studied here,
inorganic Chinese kale had the highest level of
folate at 66.50µg/100g wet weight, followed by
organic Chinese kale (65.00 µg/100g wet
weight), organic and inorganic cabbage (53.50
and 57.50 µg/100g wet weight), and organic
yardlong bean (53.00 µg/100g wet weight). As
for the 5 varieties of fruits, all of them except
papaya had low folate content ranging from 0.75
(inorganic watermelon) to 5.50 (organic
pineapple) µg/100g of edible portion. Organic
and inorganic ripe papaya were found to be good
sources of folate (53.50 and 59.50 µg/100g of
edible portion). Regarding the folate content of
different cultivars, no significant difference was
observed (Table 2). When comparing the folate
content of inorganic in the present study with
previously reported results, it was found to be
higher in cabbage and tomato and lower in carrot
and yardlong bean. Among inorganic fruits,
folate contents of ripe papaya and pineapple were
higher, while watermelon was lower, than those
reported in previous studies31. Unfortunately, no
published data on folate content of organic fruits
and vegetables were found to compare with the
present study.
4.4. Carotenoid Content
Vitamin A is essential for normal vision,
for maintaining the integrity of epithelial tissues,
and for a wide variety of other metabolic functions.
Studies from developing countries suggest that over
80% of the dietary intake of vitamin A comes from
pro vitamin A (carotenoids). Carotenoids are
synthesized as pigments by many plants and are
found in green, orange, and yellow plant tissues.
These carotenoids are composed of lutein,
zeaxanthin, alpha-carotene, beta-carotene, beta-
cryptoxanthine, and lycopene. Many researchers
have suggested that eating pro vitamin A rich food
such as green leafy vegetables and fruits may
reduce the risk of chronic diseases, especially age
related macular degeneration (AMD) and
cataracts in elderly people since AMD is one of the
major causes of blindness in elderly adults. In
addition, previous publications have indicated that
a diet rich in zeaxanthin and lutein is associated
with a reduced risk of the development of cataract
and macular degeneration 32-36.
Pharmaceutical Sciences Asia
225
Table 3. Carotenoid contents of organic and inorganic vegetables per 100 g of wet weight1
English name Lutein
(µg)
Zeaxanthin
(µg)
β-crypto-
xanthin
(µg)
Lycopene
(µg)
α-carotene
(µg)
β-carotene
(µg)
Total
carotenoids
(µg)
Vegetables
Chinese kale
(organic)
2035.98 ±
273.30a
ND 53.32 ±
4.41a
ND ND 2339.03 ±
695.44a
4428.33 ±
969.66a
Chinese kale
(inorganic)
1699.55 ±
167.80a
ND 39.72 ±
2.17b
ND ND 2158.87 ±
117.20b
3898.13 ±
105.28b
Cabbage
(organic)
14.60 ±
0.39a
ND ND ND ND 5.58 ±
0.43a
20.18 ±
0.50a
Cabbage
(inorganic)
22.25 ±
5.60b
ND ND ND ND 10.98 ±
5.28a
33.23 ±
10.88b
Carrot
(organic)
119.05 ±
33.78a
12.40 ±
3.30
ND ND 918.63 ±
68.17a
2872.90 ±
727.61a
3910.58 ±
564.79a
Carrot
(inorganic)
114.27 ±
5.95a
ND ND ND 865.25 ±
40.97a
5290.20 ±
201.11a
6269.73 ±
240.72b
Tomato
(organic)
83.67 ±
5.76a
1.20 ±
1.40
13.58 ±
1.75a
2960.70
±736.98a
95.85 ±
17.68a
420.58 ±
31.10a
3575.58 ±
642.42a
Tomato
(inorganic)
73.27 ±
5.65a
ND 9.17 ±
2.06a
1761.15
±326.52b
55.30 ±
10.10b
282.80 ±
24.60a
2181.69 ±
339.45b
Yardlong bean
(organic)
359.05 ±
23.29a
ND 17.32 ±
1.49a
ND 9.57 ±
0.57a
436.93 ±
29.18a
822.87 ±
13.68b
Fruits
Pineapple
(organic)
4.83 ±
1.12a
ND ND ND ND 30.62 ±
2.71a
35.45 ±
3.79a
Pineapple
(inorganic)
9.35 ±
1.51a
ND 14.45 ±
11.38
ND ND 170.70 ±
58.19b
194.50 ±
70.59b
Papaya
(organic)
ND ND 958.85 ±
72.22a
2347.65 ±
318.33a
101.75 ±
11.69a
368.08 ±
70.31a
3766.33 ±
282.72a
Papaya
(inorganic)
ND ND 817.90 ±
143.33a
2435.40 ±
386.33a
108.82 ±
22.98a
311.03 ±
103.89a
3673.15 ±
632.72a
Rambutan
(organic)
ND ND ND ND ND ND ND
Rambutan
(inorganic)
ND ND ND ND ND ND ND
Long kong
(organic)
0.85 ±
0.05a
ND ND ND ND 1.88 ±
0.35a
2.73 ±
0.40a
Long kong
(inorganic)
0.75 ±
0.05a
ND ND ND ND 1.77 ±
0.47a
2.52 ±
0.48a
Watermelon
(organic)
41.57 ±
27.17a
ND 60.43 ±
38.78a
4690.20 ±
1173.71a
214.07 ±
111.82a
395.92 ±
188.54a
5402.19 ±
1419.10a
Watermelon
(inorganic)
35.70 ±
55.38a
ND 75.92 ±
23.94a
6110.20 ±
486.55a
293.62 ±
42.62a
549.13 ±
334.16a
7064.74 ±
778.01a
Yardlong bean
(inorganic)
276.92 ±
40.39a
ND 11.55 ±
1.52a
ND 5.83 ±
0.97a
373.25 ±
15.41a
667.55 ±
57.73a
1Data are shown as mean ± SD for 6 forms of carotenoids for each edible portion of fresh organic and inorganic vegetables and fruits
derived from duplicate analysis (n=6). Mean values within the same column and variety with different superscript letters show significant differences between organic and inorganic growing systems at p < 0.05, by independent-samples Mann-Whitney U-test. ND: not detected
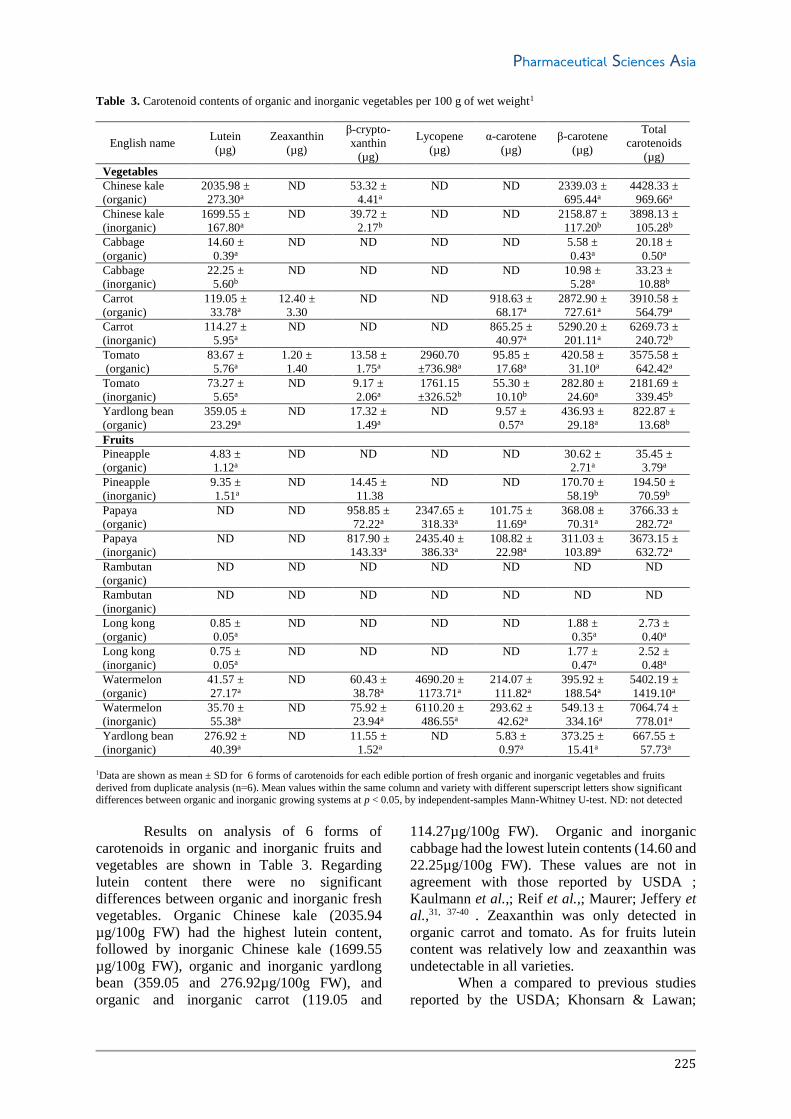
Results on analysis of 6 forms of
carotenoids in organic and inorganic fruits and
vegetables are shown in Table 3. Regarding
lutein content there were no significant
differences between organic and inorganic fresh
vegetables. Organic Chinese kale (2035.94
µg/100g FW) had the highest lutein content,
followed by inorganic Chinese kale (1699.55
µg/100g FW), organic and inorganic yardlong
bean (359.05 and 276.92µg/100g FW), and
organic and inorganic carrot (119.05 and
114.27µg/100g FW). Organic and inorganic
cabbage had the lowest lutein contents (14.60 and
22.25µg/100g FW). These values are not in
agreement with those reported by USDA ;
Kaulmann et al.,; Reif et al.,; Maurer; Jeffery et
al.,31, 37-40 . Zeaxanthin was only detected in
organic carrot and tomato. As for fruits lutein
content was relatively low and zeaxanthin was
undetectable in all varieties.
When a compared to previous studies
reported by the USDA; Khonsarn & Lawan;

R. Kongkachuichai et al. Pharm Sci Asia 2019; 46 (4), 218-230
226
Martinez-Valdivieso et al., present study
revealed lower amounts of lutein and zeaxanthin
in all inorganic fruits, except for watermelon
which showed higher amount 31,41,42.
Among the 10 varieties of fruits and
vegetables in this study, both organic and
inorganic ripe papaya proved to be excellent
sources of β-cryptoxanthin (948.85 and
796.07µg/100g FW), whereas other fruits and
vegetables ranged from not detectable to 75.92
µg/100g FW.
As for lycopene content, organic and
inorganic watermelon (red colored pulp) proved
to be excellent sources (4690.20 and
6110.20µg/100g FW), followed by organic
tomato (red skin; 3172.43µg/100g edible
portion), organic and inorganic ripe papaya
(2347.65 and 2450.40 µg/100g FW), and
inorganic tomato (1761.15µg/100g edible
portion). Lycopene was not detected in other
selected fruits and vegetables (Table 3).
Since few studies were found on the
carotenoids content of organic plants,
comparison with the present study was not
possible. The highest value of beta-carotene was
found in organic and inorganic carrot (3082.38
and 5290.20 µg/100g FW), followed by organic
and inorganic Chinese kale (2339.03 and
2148.87µg/100g FW). Watermelon and ripe
papaya showed the highest alpha- and beta-
carotene contents as compared to other selected
fruits in this study. The amount of alpha- and
beta-carotene contents of fresh vegetables in this
study were lower than those reported by the
USDA31 whereas higher values were found in
papaya, pineapple, and watermelon as shown in
Table 3. In addition, beta-carotene and lycopene
content for long kong, papaya, rambutan, and
watermelon in this study was in agreement with
the data reported by Chareonsiri and
Kongkachuchai 43. Total carotenoid content of all
organic vegetables were significantly higher than
those of inorganic ones except for cabbage and
carrot. As for fruits, papaya, longkong and
watermelon did not show any significant
difference in total carotenoids between the two
cultivation systems. However, inorganic
pineapple exhibited significantly higher total
carotenoids than the organic samples and
carotenoids were not detected in both organic and
inorganic rambutan. A study by Mercadante &
Rodriguez-Amaya44 found that conventionally
grown and organic kale of the same cultivar was
significantly different in total carotenoids
composition. Similarly, Walsh et al.,45 indicated
that vegetable cultivars grown on conventional
farms using crop fertilizer may differ in
carotenoid value than that of an organic farm. In
the present study, carrot, Chinese kale, tomato,
watermelon, and ripe papaya were excellent
sources of total carotenoids.
4.5. Flavonoid Content
Epidemiological studies have shown that
diets rich in fruits and vegetables are associated
with longer life expectancy, possibly due to their
being rich sources of vitamin and antioxidants
compounds (phenolics, flavonoids, and
carotenoids). Phytochemicals are bioactive non-
nutrient plant compounds that have shown a
remarkably high scavenging activity toward
chemically generated radicals. They are effective
in inhibiting oxidation of human low-density
lipoproteins and thus have potential effects in
preventing various human diseases, such as heart
disease, cancer, stroke, diabetes, Alzheimer’s
disease, cataracts, and age-related function
decline. Quercetin and other polyphenols have
been shown to play a protective role in
carcinogenesis by reducing the bioavailability of
carcinogens. Ferulic acid (FA) is a major
bioactive compound in fruits, vegetables and
other plants that showed free radical scavenging
effect which is comparable to that of superoxide
dismutase. Therefore, FA has been claimed to
reduce the risk of major chronic diseases through
numerous biological effects such as anti-
inflammatory, antimicrobial, antiallergic,
hepatoprotective, anticarcinogenic, and
vasodilatory activites46,47. In addition, a previous
publication indicated that consumption of natural
bioactive compounds like quercetin, myricetin,
kaempferol, luteolin, and fisetin available in
plants, help in decreasing systolic blood pressure,
oxidative stress, LDL cholesterol and plasma
cholesterol, improving dyslipidemia, preventing
arteriosclerosis by inhibiting LDL oxidation and
formation of platelets, suppressing body weight
gain, and acting as an anti-inflammatory agent48.
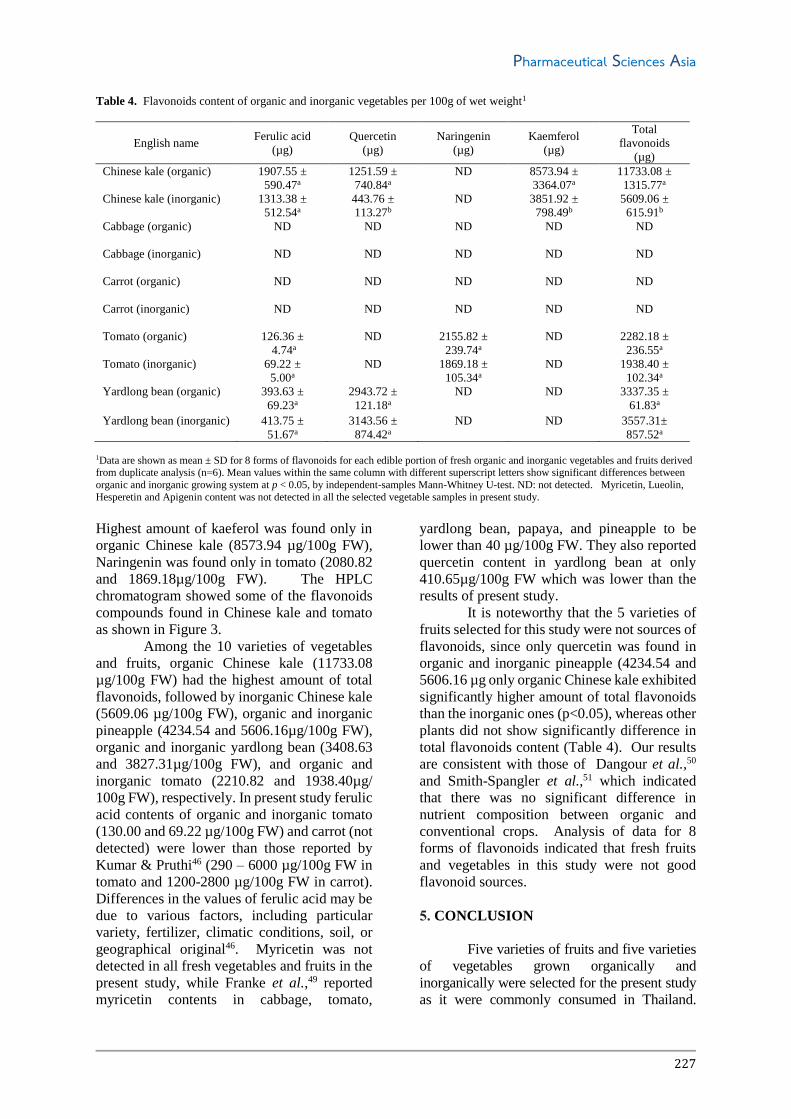
Table 4 showed the contents of 8
flavonoid forms in all tested vegetables and
fruits. Organic and inorganic Chinese kale
(1907.55 and 1313.38µg/100g FW) and organic
and inorganic pineapple (4234.54 and
5606.16µg/100g FW) showed the highest content
of ferulic acid, while organic and inorganic
yardlong bean (2943.72 and 3143.56 µg/100g
FW) and organic Chinese kale (1251.59 µg/100g
FW) exhibited highest amount of quercetin.
Pharmaceutical Sciences Asia
227
Table 4. Flavonoids content of organic and inorganic vegetables per 100g of wet weight1
English name Ferulic acid
(µg)
Quercetin
(µg)
Naringenin
(µg)
Kaemferol
(µg)
Total
flavonoids
(µg)
Chinese kale (organic) 1907.55 ±
590.47a
1251.59 ±
740.84a
ND 8573.94 ±
3364.07a
11733.08 ±
1315.77a
Chinese kale (inorganic) 1313.38 ±
512.54a
443.76 ±
113.27b
ND 3851.92 ±
798.49b
5609.06 ±
615.91b
Cabbage (organic)
ND ND ND ND ND
Cabbage (inorganic)
ND ND ND ND ND
Carrot (organic)
ND ND ND ND ND
Carrot (inorganic)
ND ND ND ND ND
Tomato (organic) 126.36 ±
4.74a
ND 2155.82 ±
239.74a
ND 2282.18 ±
236.55a
Tomato (inorganic) 69.22 ±
5.00a
ND 1869.18 ±
105.34a
ND 1938.40 ±
102.34a
Yardlong bean (organic) 393.63 ±
69.23a
2943.72 ±
121.18a
ND ND 3337.35 ±
61.83a
Yardlong bean (inorganic) 413.75 ±
51.67a
3143.56 ±
874.42a
ND ND 3557.31±
857.52a
1Data are shown as mean ± SD for 8 forms of flavonoids for each edible portion of fresh organic and inorganic vegetables and fruits derived from duplicate analysis (n=6). Mean values within the same column with different superscript letters show significant differences between
organic and inorganic growing system at p < 0.05, by independent-samples Mann-Whitney U-test. ND: not detected. Myricetin, Lueolin,
Hesperetin and Apigenin content was not detected in all the selected vegetable samples in present study.
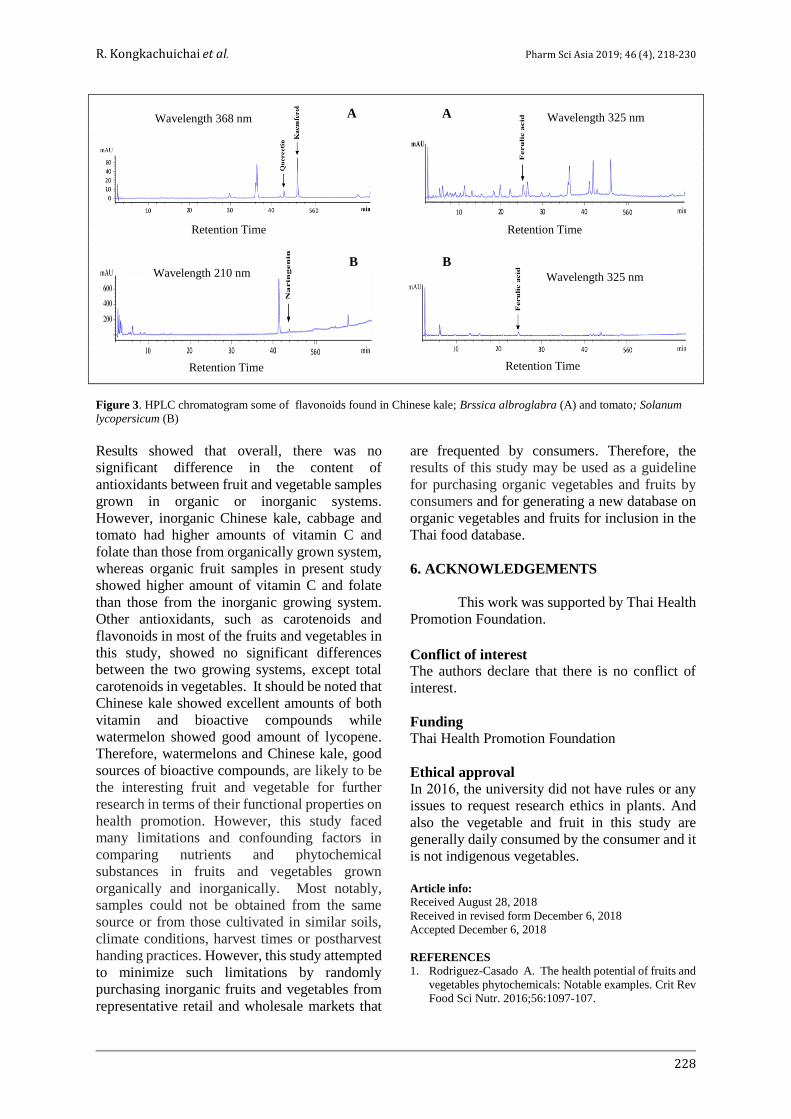
Highest amount of kaeferol was found only in
organic Chinese kale (8573.94 µg/100g FW),
Naringenin was found only in tomato (2080.82
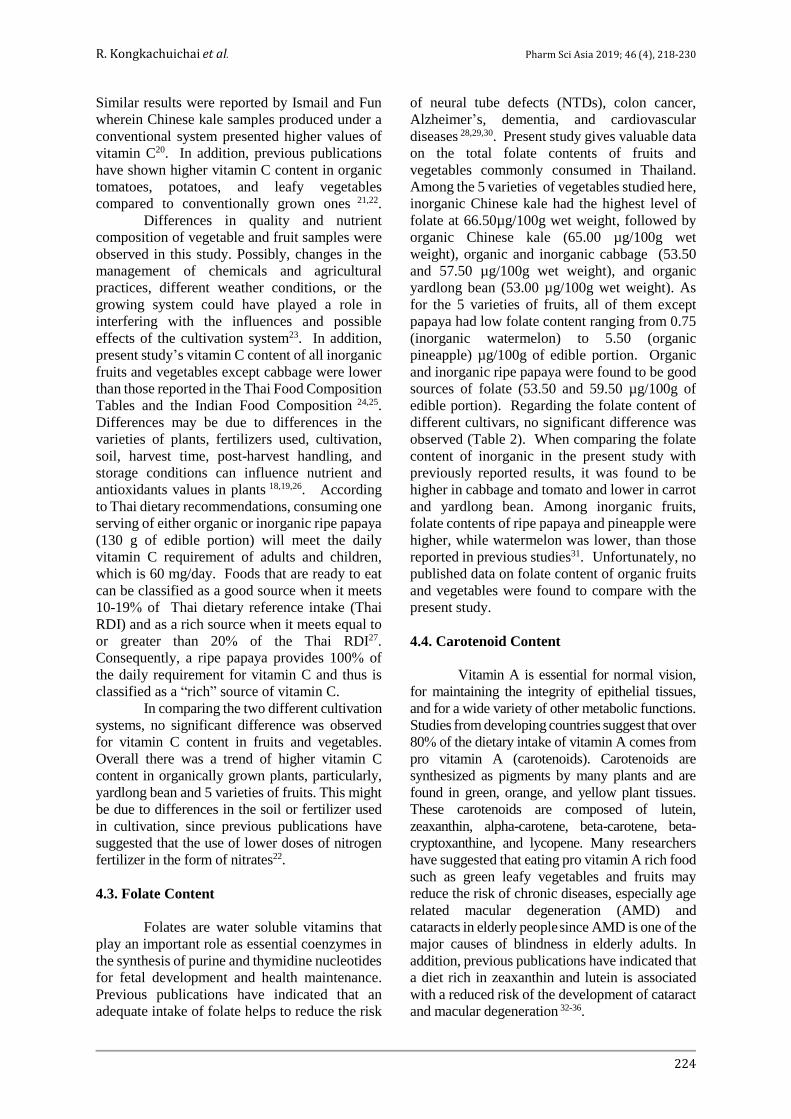
and 1869.18µg/100g FW). The HPLC
chromatogram showed some of the flavonoids
compounds found in Chinese kale and tomato
as shown in Figure 3.
Among the 10 varieties of vegetables
and fruits, organic Chinese kale (11733.08
µg/100g FW) had the highest amount of total
flavonoids, followed by inorganic Chinese kale
(5609.06 µg/100g FW), organic and inorganic
pineapple (4234.54 and 5606.16µg/100g FW),
organic and inorganic yardlong bean (3408.63
and 3827.31µg/100g FW), and organic and
inorganic tomato (2210.82 and 1938.40µg/
100g FW), respectively. In present study ferulic
acid contents of organic and inorganic tomato
(130.00 and 69.22 µg/100g FW) and carrot (not
detected) were lower than those reported by
Kumar & Pruthi46 (290 – 6000 µg/100g FW in
tomato and 1200-2800 µg/100g FW in carrot).
Differences in the values of ferulic acid may be
due to various factors, including particular
variety, fertilizer, climatic conditions, soil, or
geographical original46. Myricetin was not
detected in all fresh vegetables and fruits in the
present study, while Franke et al.,49 reported
myricetin contents in cabbage, tomato,
yardlong bean, papaya, and pineapple to be
lower than 40 µg/100g FW. They also reported
quercetin content in yardlong bean at only
410.65µg/100g FW which was lower than the
results of present study.
It is noteworthy that the 5 varieties of
fruits selected for this study were not sources of
flavonoids, since only quercetin was found in
organic and inorganic pineapple (4234.54 and
5606.16 µg only organic Chinese kale exhibited
significantly higher amount of total flavonoids
than the inorganic ones (p<0.05), whereas other
plants did not show significantly difference in
total flavonoids content (Table 4). Our results
are consistent with those of Dangour et al.,50
and Smith-Spangler et al.,51 which indicated
that there was no significant difference in
nutrient composition between organic and
conventional crops. Analysis of data for 8
forms of flavonoids indicated that fresh fruits
and vegetables in this study were not good
flavonoid sources.
5. CONCLUSION
Five varieties of fruits and five varieties
of vegetables grown organically and
inorganically were selected for the present study
as it were commonly consumed in Thailand.
R. Kongkachuichai et al. Pharm Sci Asia 2019; 46 (4), 218-230
228
Figure 3. HPLC chromatogram some of flavonoids found in Chinese kale; Brssica albroglabra (A) and tomato; Solanum
lycopersicum (B)
Results showed that overall, there was no
significant difference in the content of
antioxidants between fruit and vegetable samples
grown in organic or inorganic systems.
However, inorganic Chinese kale, cabbage and
tomato had higher amounts of vitamin C and
folate than those from organically grown system,
whereas organic fruit samples in present study
showed higher amount of vitamin C and folate
than those from the inorganic growing system.
Other antioxidants, such as carotenoids and
flavonoids in most of the fruits and vegetables in
this study, showed no significant differences
between the two growing systems, except total
carotenoids in vegetables. It should be noted that
Chinese kale showed excellent amounts of both
vitamin and bioactive compounds while
watermelon showed good amount of lycopene.
Therefore, watermelons and Chinese kale, good
sources of bioactive compounds, are likely to be
the interesting fruit and vegetable for further
research in terms of their functional properties on
health promotion. However, this study faced
many limitations and confounding factors in
comparing nutrients and phytochemical
substances in fruits and vegetables grown
organically and inorganically. Most notably,
samples could not be obtained from the same
source or from those cultivated in similar soils,
climate conditions, harvest times or postharvest
handing practices. However, this study attempted
to minimize such limitations by randomly
purchasing inorganic fruits and vegetables from
representative retail and wholesale markets that
are frequented by consumers. Therefore, the
results of this study may be used as a guideline
for purchasing organic vegetables and fruits by
consumers and for generating a new database on
organic vegetables and fruits for inclusion in the
Thai food database.
6. ACKNOWLEDGEMENTS
This work was supported by Thai Health
Promotion Foundation.
Conflict of interest
The authors declare that there is no conflict of
interest.
Funding
Thai Health Promotion Foundation
Ethical approval
In 2016, the university did not have rules or any
issues to request research ethics in plants. And
also the vegetable and fruit in this study are
generally daily consumed by the consumer and it
is not indigenous vegetables.
Article info:
Received August 28, 2018
Received in revised form December 6, 2018
Accepted December 6, 2018
REFERENCES
1. Rodriguez-Casado A. The health potential of fruits and
vegetables phytochemicals: Notable examples. Crit Rev
Food Sci Nutr. 2016;56:1097-107.
Wavelength 368 nm
A Wavelength 325 nm
A
Retention Time Retention Time
B B
Retention Time Retention Time
Wavelength 210 nm
Wavelength 325 nm

Pharmaceutical Sciences Asia
229
2. Gülçin I. Antioxidant activity of food constituents: An
overview. Arch Toxicol.2012; 86(3): 345–91.
3. Andarwulan N, Kurniasih D, Apriady RA, Rahmat H,
Roto AV, Bolling BW. Polyphenols, carotenoids and
ascorbic acid in underutilized medicinal vegetables. J
Funct Foods. 2012; 4 (1):339–47.
4. Yamada T, Hayasaka S, Shibata Y, Ojima T, Saegusa T,
Gotoh T, et al. Frequency of citrus fruit intake is
associated with the incidence of cardiovascular disease:
The Jichi Medical school cohort study. J Epidemiol.
2011; 21(3): 169-75.
5. Oboh G, Ademosun AO. Phenolic extracts from
grapefruit peels (Citrus paradisi) inhibit key enzymes
linked with type 2 diabetes and hypertension. J Food
Biochem. 2011; 35: 1703–9.
6. Du Q, Chen H. The methoxyflavones in Citrus
reticulata Blanco cv. ponkan and their antiproliferative
activity against cancer cells. Food Chem. 2010; 119 (2):
567–72.
7. Xi W, Zhang G, Jiang D, & Zhou Z. Phenolic
compositions and antioxidant activities of grapefruit
(Citrus paradisi Macfadyen) varieties cultivated in
China. Int J Food Sci Nutr. 2015; 66(8): 858–66.
8. Mditshwa A, Magwaza LS, Tesfay SZ, Mbili N.
Postharvest quality and composition of organically and
conventionally produced fruits: A review. Sci Hortic.
2017; 216: 148–59.
9. Forman J, Silverstein J. Organic foods: Health and
environmental advantages and disadvantages. American
Academy of Pediatrics. 2012; 130(5): e1406-15.
10. Latimer GW. 2012. Official methods of analysis of
AOAC, International 19th edition, AOAC International,
Maryland, USA.
11. Brause AR, Woollard DC, Indyk HE. Determination of
total vitamin C in fruit juices and related products by
liquid chromatography: Interlaboratory study. J AOAC
Int. 2003; 86(2): 367–74.
12. Li L, Pegg RB, Eitenmiller RR, Chun J-Y, Kerrihard AL.
Selected nutrient analysis of fresh, fresh-stored and frozen
fruit and vegetables. J Food Compost Anal. 2017; 59: 8-17.
13. DeVries JW, Keagy PM, Hudson CA, Rader JI.
Collaborative study on determination of total folate in
cereal products by microbiological assay using
trienzyme extraction (AACC Method 86-47). Cereal
Food World. 2001; 46 (5): 216-9.
14. DeVries J.W, Rader J.L, Keagy P.M, Hudson C.A.
2005. Micro assay trienzyme produre for total folates in
cereal and cereal foods: Collaborative study. J AOAC
Int. 2005; 88(1): 5-15.
15. Speek AJ, Schrijver J, Schreurs WHP. Vitamin E
composition of some seeds oils as determined by high-
performance liquid chromatography with fluorometric
detection. J Food Sci. 1985; 50 (1): 121–4.
16. Merken HM, Beecher GR. Measurement of food
flavonoids by high-performance liquid chromatography:
A review. J Agric Food Chem. 2000; 48(3): 577–99.
17. Ellong EN, Billard C, Adenet S, Rochefort K.
Polyphenols, carotenoids, vitamin C content in Tropical
fruits and vegetables and impact of processing methods.
Food Nutr Sci. 2015; 6 (3): 299-313.
18. Muhammad I, Ashiru S, Ibrahim I, Kanoma AI, Sani I,
Garba S. Effect of ripening stage on vitamin C content
in selected fruits. Int J Agric For Fish. 2014; 2(3):60-5.
19. Wu W, Sun Z, Zhang W. Simple and rapid
determination of vitamin C in vegetables and fruits by a
commercial electrochemical reader. Food Anal
Methods. 2016; 9 (11): 3187-92.
20. Ismail A, Fun CS. Determination of vitamin C, β-
carotene and riboflavin contents in five green vegetables
organically and conventionally grown. Malays J Nutr.
2003; 9(1): 31-9.
21. Hallmann E. The influence of organic and conventional
cultivation systems on the nutritional value and content
of bioactive compounds in selected tomato types. J Sci
Food Agric. 2012; 92 (14): 2840–8.
22. Williamson CS. Is organic food better for our health?
Nutr Bull. 2007; 32 (2): 104-8.
23. Bender I, Moor U, Luik A. The effect of growing
systems on the quality of carrots. Res Rural Dev. 2015;
1:118 -23.
24. Puwastein P, Judprasong K, Sridonpai B, Saiwan T.
Thai Food Composition Tables 2, Second Edition.
Institute of Nutrition, Mahidol University, Thailand;
2015 Aseanfoods Regional Database Centre of Infoods.
25. Longvah T, Ananthan R, Bhaskarachary K, Venkaiah K.
2017. Indian Food Composition Tables. National
Institute of Nutrition (Indian Council of Medical
Research), Department of Health Research, Ministry of
Health and Family Welfare, Government of India
Hyderabad 500007, Telangana state, India.
26. Cardoso PC, Tomazini APB, Stringheta PC, Ribeiro
SMR, Pinheiro-Sant’ Ana HM. Vitamin C and
carotenoids in organic and conventional fruits grown in
Brazil. Food Chem. 2011; 126 (2): 411–6.
27. Ministry of Public Health. 2003. Dietary reference
intake for Thais. Bangkok: Nutrition Division,
Department of Health, Ministry of Public Health.
28. Amarin ZO, Obeidat AZ. Effect of folic acid
fortification on the incidence of neural tube defects.
Paediatr Perinat Epidemiol. 2010; 24 (4): 349-51.
29. Ebara S. Nutritional role of folate. Congenit Anom.
2017; 57 (5): 138–41.
30. Czeizel AE, Dudás I, Vereczkey A, Bánhidy F. Folate
deficiency and folic acid supplementation: The
prevention of neural-tube defects and congenital heart
defects. Annual 21st International Scientific Conference
proceeding. Nutrient. 2013; 5(11): 4760-75.
31. USDA: United States Department of Agriculture.
USDA National nutrient database for standard reference
release 28; 2015. Retrieved September 30, 2016.
Available from: https://ndb.nal.usda.gov/ndb/.
32. Pritwani R, Mathur P. β-carotene content of some
commonly consumed vegetables and fruits Delhi, India.
J Nutr Food Sci. 2017; 7: 625.
33. Sugiura M, Nakamura M, Ogawa K, Ikoma Y, Ando F,
Shimokata H, et al. Dietary patterns of antioxidant vitamin
and carotenoid intake associated with bone mineral density:
Findings from post-menopausal Japanese female subjects.
Osteoporos Int. 2011; 22 (1): 143–52.
34. Sugiura M, Nakamura M, Ogawa K, Ikoma Y, Yano M.
High serum carotenoids associated with lower risk for
bone loss and osteoporosis in post-menopausal Japanese
female subjects: Prospective cohort study. PLoS ONE.
2012; 7(12): e52643.
35. Ma L, Yan SF, Huang YM, Lu XR, Qian F, Pang HL, et
al. Effect of lutein and zeaxanthin on macular pigment and
visual function in patients with early age-related macular
degeneration. Ophthalmology. 2012; 119 (11): 2290–7.
36. Eisenhauer B, Natoli S, Liew G, Flood VM. Lutein and
zeaxanthin-food sources, bioavailability and dietary
variety in age-related macular degeneration protection.
Nutrients. 2017; 9(2): 120.
37. Kaulmann A, Jonville MC, Schneider YJ, Hoffmann L,
Bohn T. Carotenoids, polyphenols and micronutrient

R. Kongkachuichai et al. Pharm Sci Asia 2019; 46 (4), 218-230
230
profiles of Brassica oleracea and plum varieties and
their contribution to measures of total antioxidant
capacity. Food Chem. 2014; 155: 240–50.
38. Reif C, Arrigoni E, Berger F, Baumgartner D, Nyström
L. Lutein and β-carotene content of green Brassica
species grown under different conditions. LWT-Food
Sci Technol. 2013; 53(1): 378–81.
39. Maurer MM, Mein JR, Chaudhuri SK, Constant HL. An
improved UHPLC-UV method for separation and
quantification of carotenoids in vegetable crops. Food
Chem. 2014; 165: 475-82.
40. Jeffery JL, Turner ND, King SR. Carotenoid
bioaccessibility from nine raw carotenoid-storing fruits
and vegetables using an in vitro model. J Sci Food
Agric. 2012; 92(13): 2603–10.
41. Khonsarn N, Lawan S. Level of xanthophyll, lutein and
zeaxanthin in selected Thai fruits determined by HPLC.
International Conference on Nutrition and Food
Sciences. 2012; 39: 240-243, IACSIT press, Singapore.
42. Martínez-Valdivieso D, Font R, Blanco-Díaz MT,
Moreno-Rojas JM, Gómez P, Alonso-Moraga Á, et al.
Application of near-infrared reflectance spectroscopy
for predicting carotenoid content in summer squash
fruit. Comput Electron Agr.2014; 108: 71–9.
43. Charoensiri R, Kongkachuichai R, Suknicom S,
Sungpuag P. 2009. Beta-carotene, lycopene, and alpha-
tocopherol contents of selected Thai fruits. Food Chem.
2009; 113(1): 202-7.
44. Mercadante AZ, Rodriguez-Amaya DB. Carotenoid
composition of a leafy vegetable in relation to some
agricultural variables. J Agric Food Chem. 1991; 39(6):
1094-7.
45. Walsh RP, Barlett H, Eperjesi F. Variation in carotenoid
content of kale and other vegetables: A review of Pre
and Postharvest effects. J Agric Food Chem. 2015; 63
(44): 9677-82.
46. Kumar N, Pruthi V. 2014. Potential applications of
ferulic acid from natural sources. Biotechnol Rep. 2014;
4: 86-93.
47. Wang O, Liu J, Cheng Q, Guo X, Wang Y, Zhao L, et
al. Effects of ferulic acid and γ-oryzanol on high-fat and
high-fructose diet-induced metabolic syndrome in rats.
PLoS ONE. 2015; 10(2): e0118135.
48. Salvamani S, Gunasekaran B, Shaharuddin NA, Ahmad
SA, Shukor MY. Antiartherosclerotic effects of plant
flavonoids. BioMed Res Int. 2014; 1-12.
49. Franke AA, Custer LJ, Arakaki C, Murphy SP. Vitamin C
and flavonoid levels of fruits and vegetables consumed in
Hawaii. J Food Compos Anal. 2004; 17 (1): 1–35.
50. Dangour AD, Dodhia SK, Hayter A, Allen E, Lock K,
Uauy R. 2009. Nutritional quality of organic foods: a
systematic review. Am J Clin Nutr. 2009; 90(3): 680-5.
51. Smith-Spangler C, Brandeau ML, Hunter GE, Bavinger
JC, Pearson M, Eschbach PJ, et al. Are organic foods safer
or healthier than conventional alternatives?: a systematic
review. Ann Intern Med. 2012; 157 (5): 348-66.