visualizing the internal physical characteristics of
TRANSCRIPT
ABSTRACT
Magnetic resonance (MR) images are analyzed in conjunction with petrographic data to evaluate the textural character-istics of rocks dominated by fabric-selective dolomitization. The magnetic resonance imaging (MRI) measurements revealthe three-dimensional geometry of the physical sedimentary structures and the trace fossils that influenced dolomitizationand porosity development.
Because MRI images represent composites of nuclear spin density and MR relaxation times, each of which can berelated to pore size, stronger MRI image intensity must be calibrated to known porous zones by integrating petrologicaldata with MR data. Pairing of MR images with petrography helps map the distribution of porosity in diageneticallyaltered rock.
The data presented herein show the potential of a new class of MRI technique as an imaging tool for low-porosityrocks. The results demonstrate that MRI technology can significantly enhance petrological studies. Notable resultsinclude 1) the successful resolution of the porosity distribution in carbonate rocks characterized by low porosity (generally less than 6%); 2) the successful acquisition of the three-dimensional data required to model the porous network; and 3) recognition that the complex distribution of porosity and its relationship to the matrix show that thisfabric represents a dual porosity/permeability system and may reduce the resource quality of similarly burrowed carbonate rocks.
RÉSUMÉ
Des images de résonance magnétique (IRM) ont été analysées en conjonction avec des données pétrographiques pourévaluer les caractéristiques texturales des roches dominées par la dolomitisation à texture préférentielle. Les mesuresdes IRM montrent une géométrie tridimensionnelle des structures sédimentaires physiques et les traces fossiles qui ontinfluencé la dolomitisation et le développement de la porosité.
Parce que les images IRM représentent des composites de la densité de spin nucléaire et des temps de relaxation RM,chacune peut être mise en relation avec la dimension des pores, et l’intensité la plus forte des IRM doit être calibrée parrapport à des zones poreuses connues en intégrant des données pétrologiques avec les données de RM. Corréler les imagesRM avec la pétrographie permet de cartographier la distribution de la porosité dans la roche altérée par la diagenèse.
Les données présentées ici montrent le potentiel d’une nouvelle classe de technique IRM en tant qu’outil d’imageriepour les roches de faible porosité. Les résultats démontrent que la technologie IRM peut significativement augmenter lesétudes pétrologiques. Les résultats les plus notables incluent: 1) le succès de la résolution de la distribution de la porositédans les roches carbonatées caractérisées par une faible porosité d’ensemble (généralement de moins de 6%); 2) le succès de l’acquisition des données tridimensionnelles nécessaires pour modéliser un réseau poreux, et 3) la reconnaissance que la distribution complexe de la porosité et la relation avec la matrice montre que la texture représenteun système à couple porosité/perméabilité qui pourrait réduire la qualité de la ressource dans des roches carbonatées quisont taraudées de façon similaire.
Traduit par Lynn Gagnon
363
BULLETIN OF CANADIAN PETROLEUM GEOLOGYVOL. 50, NO. 3 (SEPTEMBER, 2002), P. 363-369
Visualizing the internal physical characteristics of carbonate sedimentswith magnetic resonance imaging and petrography
MURRAY K. GINGRAS
Department of GeologyUniversity of New Brunswick
Fredericton, NB E3B 5A3
BRYCE MACMILLAN
Department of Physics, MRI CentreUniversity of New Brunswick
Fredericton, NB E3B 5A3
BRUCE J. BALCOM
Department of Physics, MRI CentreUniversity of New Brunswick
Fredericton, NB E3B 5A3
INTRODUCTION
Visualizing the internal structure of carbonate rock by non-destructive means is inhibited by the lack of density contrast between the primary carbonate-rock-forming min-erals, calcite, aragonite and dolomite. Visualizing the porositydistribution is also difficult, because only mesoscale vugs areeasily detected with standard techniques, such as X-ray andX-ray computed tomography (CT) scans. Also, if the porositydistribution is determined by such techniques, one cannotdetermine if the observed porosity represents effective (con-nected) or ineffective (isolated) pores.
An advanced magnetic resonance imaging (MRI) tech-nique, single-point ramped imaging with T1 enhancement(SPRITE, Balcom et al., 1996), has the potential to improveour understanding of porosity distribution in carbonate rocks.Like the aforementioned techniques, SPRITE does notresolve mineralogical heterogeneity. It is exceptionally useful, however, for the mapping of effective pore space.Because the porosity must be imbibed with a fluid to providea measurable MRI signal, the images generated by these techniques generally show the effective porosity (to thatfluid). This technology may also be used to study petrophys-ical aspects of a medium and the macroscopic flow propertiesof fluids (Kenyon, 1992).
PREVIOUS WORK
Only standard spin-echo MRI techniques have previouslybeen applied to the study of sedimentary rocks. Although thiswas initiated with high expectations and produced someexcellent results (Chen et al., 1996; Hoffman et al., 1996;Brancolini et al., 1997), the research gradually lost momen-tum as some of the limitations regarding traditional MRI, andits application to rocks, became more apparent. The key lim-itation was the sensitivity of the MR method applied, and theminimum observable porosity. Clinical MRI instruments, forexample, are not especially useful when the effective porosityfalls below 20%. In material applications, MRI technologyhas tended towards the observation and spatial encoding ofshorter MR-lifetime signals, thereby increasing the tech-nique’s sensitivity. In recent work, we showed that short echotime spin-echo techniques might permit observation of minorvariations in porosity, and pore geometry can be resolved.Gingras et al. (in press) used this method to observe millime-tre-scale porosity conduits, interpreted as representing thefossil passages of worms, which could be mapped throughouta sandstone sample. Notably, the difference in porositybetween the matrix and the conduits was less than 2% (basedon the total volume).
The SPRITE technique has previously been applied to thestudy of sediments or sedimentary rocks. Rack et al. (1998)were able to visualize the internal architecture of Pleistocene–Holocene lake sediments from Lake Winnipeg in centralCanada. The application of this technique and turbo spin-echosingle-point imaging (turboSPI) in other heterogeneous materi-als, such as concrete and Tepexel aggregate (Beyea et al.,
2000), show that the SPRITE technique is capable of providinghigh-resolution MR images where standard spin-echo MRItechniques fail.
ROCKS STUDIED
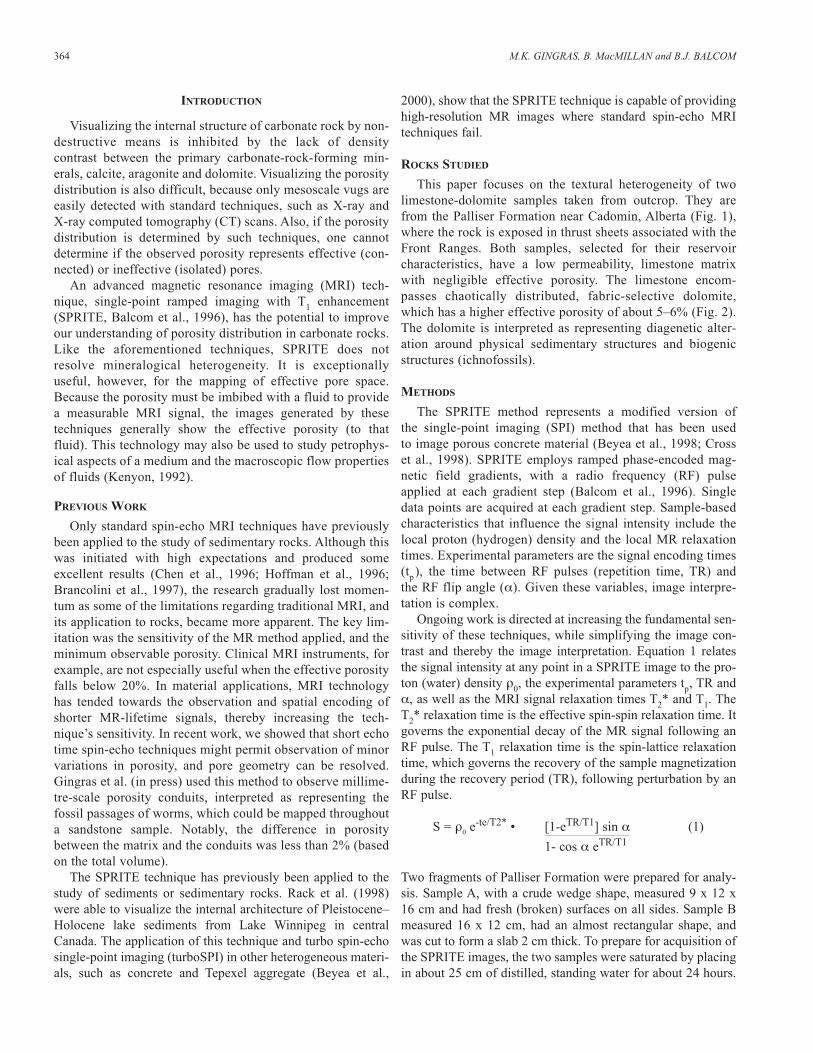
This paper focuses on the textural heterogeneity of twolimestone-dolomite samples taken from outcrop. They arefrom the Palliser Formation near Cadomin, Alberta (Fig. 1),where the rock is exposed in thrust sheets associated with theFront Ranges. Both samples, selected for their reservoir characteristics, have a low permeability, limestone matrixwith negligible effective porosity. The limestone encom-passes chaotically distributed, fabric-selective dolomite,which has a higher effective porosity of about 5–6% (Fig. 2).The dolomite is interpreted as representing diagenetic alter-ation around physical sedimentary structures and biogenicstructures (ichnofossils).
METHODS
The SPRITE method represents a modified version of the single-point imaging (SPI) method that has been used to image porous concrete material (Beyea et al., 1998; Crosset al., 1998). SPRITE employs ramped phase-encoded mag-netic field gradients, with a radio frequency (RF) pulseapplied at each gradient step (Balcom et al., 1996). Singledata points are acquired at each gradient step. Sample-basedcharacteristics that influence the signal intensity include thelocal proton (hydrogen) density and the local MR relaxationtimes. Experimental parameters are the signal encoding times(tp), the time between RF pulses (repetition time, TR) and the RF flip angle (α). Given these variables, image interpre-tation is complex.
Ongoing work is directed at increasing the fundamental sen-sitivity of these techniques, while simplifying the image con-trast and thereby the image interpretation. Equation 1 relatesthe signal intensity at any point in a SPRITE image to the pro-ton (water) density ρ0, the experimental parameters tp, TR andα, as well as the MRI signal relaxation times T2* and T1. TheT2* relaxation time is the effective spin-spin relaxation time. Itgoverns the exponential decay of the MR signal following anRF pulse. The T1 relaxation time is the spin-lattice relaxationtime, which governs the recovery of the sample magnetizationduring the recovery period (TR), following perturbation by anRF pulse.
S = ρ0 e-te/T2* • [1-eTR/T1] sin α (1)
1- cos α eTR/T1
Two fragments of Palliser Formation were prepared for analy-sis. Sample A, with a crude wedge shape, measured 9 x 12 x16 cm and had fresh (broken) surfaces on all sides. Sample Bmeasured 16 x 12 cm, had an almost rectangular shape, andwas cut to form a slab 2 cm thick. To prepare for acquisition ofthe SPRITE images, the two samples were saturated by placingin about 25 cm of distilled, standing water for about 24 hours.
364 M.K. GINGRAS, B. MacMILLAN and B.J. BALCOM
The samples were removed from the water 20 minutes beforebeing subjected to MRI.
The SPRITE technique was implemented on a Nalorac 2.4T, 32 cm horizontal bore, superconducting magnet. Imagingexperiments were conducted at ambient temperature with aTecmag Libra S-16 console. The RF probe was a homebuiltbirdcage coil. The RF amplifier was a 2 kW AMT Model3445. Magnetic field gradients were driven by Techron 7780amplifiers. For each image (in three orthogonal directions),the gradient was ramped in 64 steps with 2 ms step lengths.The delay between successive gradient ramps was 300 ms.Under these experimental conditions, the acquired imageshave substantial T1 weighting (desirable with the SPRITEtechnique). Signals from rock regions with T1 relaxationtimes longer than several milliseconds will have reducedimage intensity.
The image data matrix has 643 data points, which wereacquired in a conservative overnight experiment, with 32 sig-nal averages. The image field of view was 17 cm isotropi-cally, with a phase encode time of 80 µs, and an RF pulse flipangle of 16°. The nominal image resolution was 2.5 mmisotropically. Measurement of the bulk MR relaxation timefor carbonate samples A and B revealed T2* signal lifetimesof hundreds of microseconds with multiexponential T1 relax-ation with short lifetime components of tens of millisecondsand long lifetime components of hundreds of milliseconds.Relaxation times in these ranges are ideally suited to theSPRITE technique.
RESULTS AND INTERPRETATION
PETROGRAPHY
Both samples used in this study are petrographically similar.The rock comprises lime mudstone that envelops planar andtubular finely crystalline, euhedral, equant, and locally sucrosicdolomitized zones. Although little variation exists in eithercement, small allochems (mostly crinoids and small bra-chiopods) are scattered throughout. Dolomite appears to havereplaced the calcite wherever it is present, the strongest evi-dence of which is locally common, partially dissolved calcitecrystals scattered amongst the dolomite crystals. The limestonehas a variable (point count) porosity, between 1 and 2%.Dolomitized zones commonly exceed 5% porosity. Theabsence of dissolution textures, replacive nature of thedolomite, its pervasive (and penetrative) distribution, and itssimilarity to subsurface examples from the WabamunFormation, suggest that the dolomite is not a surficial weather-ing product.
MR IMAGES
Sample A
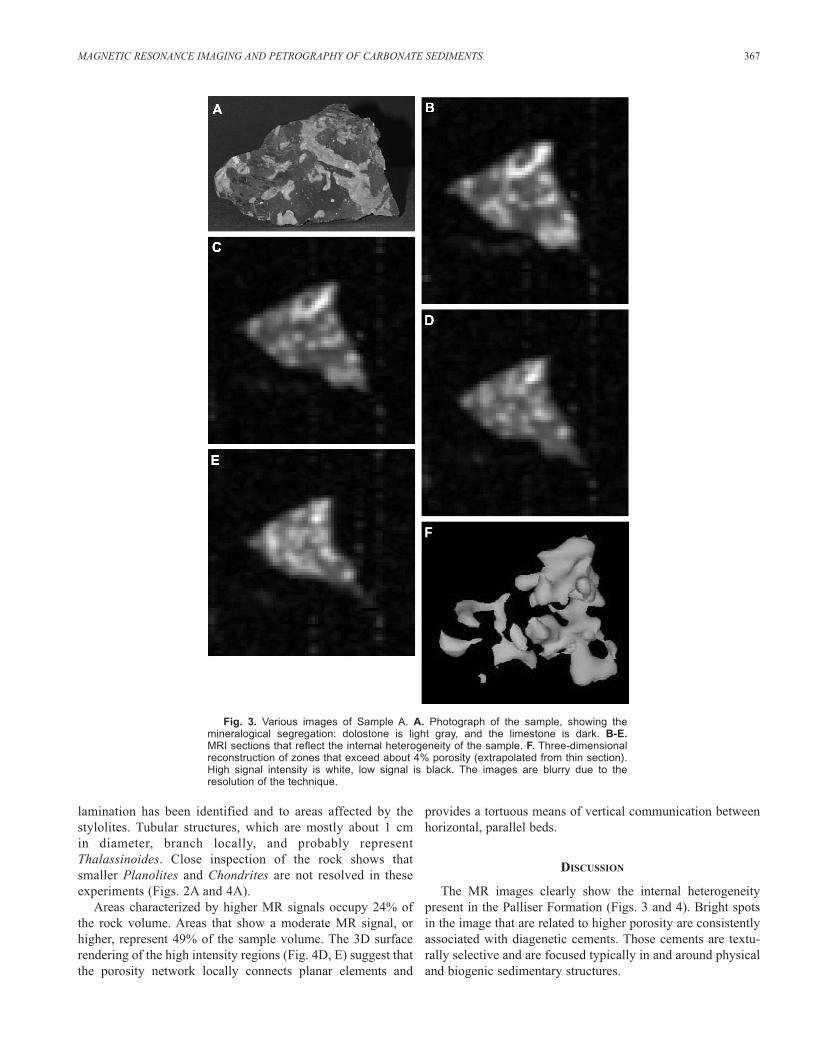
Sample A was chosen for study based on the chaotic distri-bution of dolomite patches seen on the rock’s surface (Fig. 3A).As expected, selected ‘slices’ through the image, which arebedding parallel, show that internal heterogeneity is remark-ably high (Fig. 3B–E). Calibration of high MR signals (bright
MAGNETIC RESONANCE IMAGING AND PETROGRAPHY OF CARBONATE SEDIMENTS 365
Fig. 1. Location maps. A. Cadomin in west-central Alberta. B. Sample location. The samples were taken along a railway cut that exposes tensof metres of Palliser Formation, adjacent to the quarry.
zones) to the petrographic data suggests that the strongest sig-nals are generated from portions of the rock where the porosityexceeds 4% and approximately coincide with the presence ofdolomite cement. Presumably, because the sample was satu-rated with water, only the effective porosity is shown.
Higher MR signals define approximately tubular, dolo-mitized ichnofossils that locally branch and interpenetrate(Fig. 3A). Each of these zones has a diameter of between 0.5 and 1.0 cm. Higher resolution images may reveal smaller-diameter loci of comparatively high porosity. The burrows in Sample A are mostly parallel to bedding but some vertical,branching tubes are present (Fig. 3B, C). The trace assem-blage is composed of the ichnogenera Thalassinoides andPlanolites; diagenetic cements inhibit a more detailed taxo-nomic evaluation.
Higher MR signals associated with the highest porosity inSample A, occupy 18% of the rock volume. This, togetherwith burrow-affected zones, which show a moderate MR sig-nal, constitute 57% of the rock volume. A surface-rendered,3-D image of high intensity regions associated with the
inferred porous zones (Fig. 3F) show that the porosity net-work is connected and potentially provides a tortuous flowmedium for fluids.
Sample B
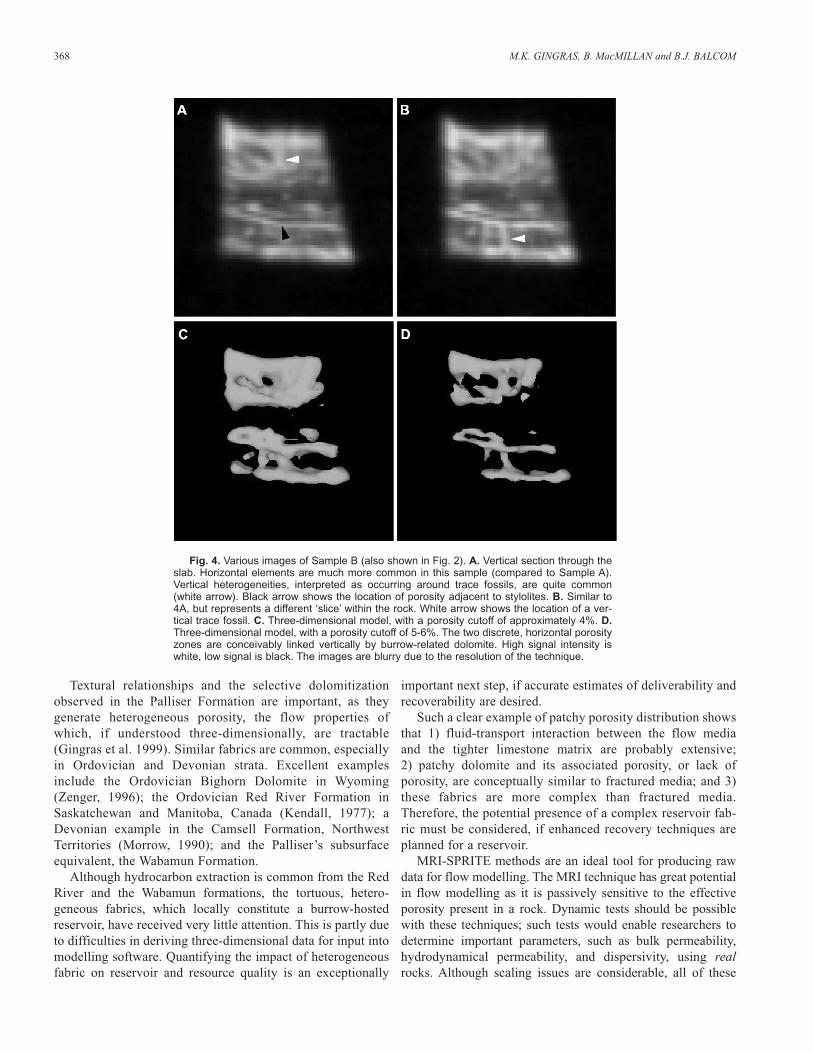
Sample B is different from A in that some of the primarysedimentary structure is preserved, mostly as wavy-parallellamination. In addition, three stylolites crosscut the rock fabric(Fig. 2A). These are approximately bedding parallel (Fig. 4A).Like Sample A, high MR signals are associated with areas ofthe rock that have approximately 4% porosity or more (Fig. 4B,C). The stylolites, or the stylolite-affected rock, are also asso-ciated with a strong MR signal. This seems to be related tohigher porosity rock adjacent to the stylolites (confirmed pet-rographically), but the resistate minerals preserved within thestylolites may also contribute to the MR signal.
Higher porosity zones are associated with horizontal, planar elements, and tubular structures that are dominantlyperpendicular or oblique to the planar structures. The planarporosity streaks correspond to locations where planar
366 M.K. GINGRAS, B. MacMILLAN and B.J. BALCOM
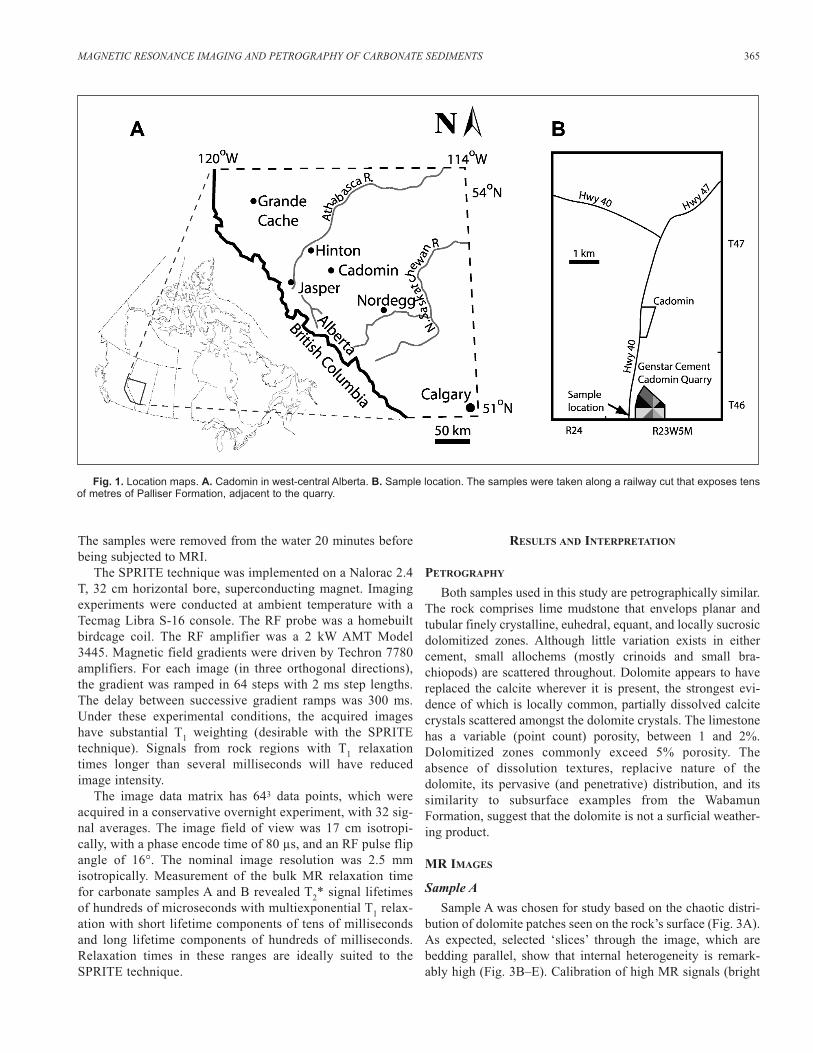
Fig. 2. Diagenetic and sedimentary textures in the samples studied (Sample B shown). A. Polished slab of Palliser Formation. The location ofdolomitized limestone is indicated by white arrows. Dolomitized sections are mostly circular in this view and are generally associated with tracefossils. Primary horizontal lamination and well developed stylolites are indicated by black arrows. B. Close-up view showing lime mudstone (ct)adjacent to dolomitized zones (dt). The lime mud is micritic, whereas the dolomite cement crystals are fine grained, equant and locally sucrosic.
A B
lamination has been identified and to areas affected by thestylolites. Tubular structures, which are mostly about 1 cm in diameter, branch locally, and probably representThalassinoides. Close inspection of the rock shows thatsmaller Planolites and Chondrites are not resolved in theseexperiments (Figs. 2A and 4A).
Areas characterized by higher MR signals occupy 24% ofthe rock volume. Areas that show a moderate MR signal, orhigher, represent 49% of the sample volume. The 3D surfacerendering of the high intensity regions (Fig. 4D, E) suggest thatthe porosity network locally connects planar elements and
provides a tortuous means of vertical communication betweenhorizontal, parallel beds.
DISCUSSION
The MR images clearly show the internal heterogeneitypresent in the Palliser Formation (Figs. 3 and 4). Bright spotsin the image that are related to higher porosity are consistentlyassociated with diagenetic cements. Those cements are textu-rally selective and are focused typically in and around physicaland biogenic sedimentary structures.
MAGNETIC RESONANCE IMAGING AND PETROGRAPHY OF CARBONATE SEDIMENTS 367
Fig. 3. Various images of Sample A. A. Photograph of the sample, showing the mineralogical segregation: dolostone is light gray, and the limestone is dark. B-E. MRI sections that reflect the internal heterogeneity of the sample. F. Three-dimensionalreconstruction of zones that exceed about 4% porosity (extrapolated from thin section).High signal intensity is white, low signal is black. The images are blurry due to the resolution of the technique.
Textural relationships and the selective dolomitizationobserved in the Palliser Formation are important, as theygenerate heterogeneous porosity, the flow properties ofwhich, if understood three-dimensionally, are tractable(Gingras et al. 1999). Similar fabrics are common, especiallyin Ordovician and Devonian strata. Excellent examplesinclude the Ordovician Bighorn Dolomite in Wyoming(Zenger, 1996); the Ordovician Red River Formation inSaskatchewan and Manitoba, Canada (Kendall, 1977); aDevonian example in the Camsell Formation, NorthwestTerritories (Morrow, 1990); and the Palliser’s subsurfaceequivalent, the Wabamun Formation.
Although hydrocarbon extraction is common from the RedRiver and the Wabamun formations, the tortuous, hetero-geneous fabrics, which locally constitute a burrow-hostedreservoir, have received very little attention. This is partly dueto difficulties in deriving three-dimensional data for input intomodelling software. Quantifying the impact of heterogeneousfabric on reservoir and resource quality is an exceptionally
important next step, if accurate estimates of deliverability andrecoverability are desired.
Such a clear example of patchy porosity distribution showsthat 1) fluid-transport interaction between the flow media and the tighter limestone matrix are probably extensive; 2) patchy dolomite and its associated porosity, or lack ofporosity, are conceptually similar to fractured media; and 3)these fabrics are more complex than fractured media.Therefore, the potential presence of a complex reservoir fab-ric must be considered, if enhanced recovery techniques areplanned for a reservoir.
MRI-SPRITE methods are an ideal tool for producing rawdata for flow modelling. The MRI technique has great potentialin flow modelling as it is passively sensitive to the effectiveporosity present in a rock. Dynamic tests should be possiblewith these techniques; such tests would enable researchers todetermine important parameters, such as bulk permeability,hydrodynamical permeability, and dispersivity, using realrocks. Although scaling issues are considerable, all of these
368 M.K. GINGRAS, B. MacMILLAN and B.J. BALCOM
Fig. 4. Various images of Sample B (also shown in Fig. 2). A. Vertical section through theslab. Horizontal elements are much more common in this sample (compared to Sample A).Vertical heterogeneities, interpreted as occurring around trace fossils, are quite common(white arrow). Black arrow shows the location of porosity adjacent to stylolites. B. Similar to4A, but represents a different ‘slice’ within the rock. White arrow shows the location of a ver-tical trace fossil. C. Three-dimensional model, with a porosity cutoff of approximately 4%. D.Three-dimensional model, with a porosity cutoff of 5-6%. The two discrete, horizontal porosityzones are conceivably linked vertically by burrow-related dolomite. High signal intensity iswhite, low signal is black. The images are blurry due to the resolution of the technique.

parameters, except dispersivity, are scalable. Dispersivity isscale-dependant, but is a function of rock heterogeneity, whichcan be assessed with MRI.
CONCLUSIONS
The data presented herein show the potential of MRI-SPRITE as an imaging tool for low-porosity rocks. Theimproved results offered by this technique demonstrate that thetechnology to advance petrological studies with MRI tech-niques is available. The results are notable because 1) they suc-cessfully resolve the porosity distribution in a rock that ischaracterized by a low overall porosity (generally less than6%); 2) the three-dimensional data required to model theporous network is accessible through the MRI technique; and3) although the technique doesn’t measure the pore size andpore distribution directly, these data can be retroactively calcu-lated from the image if petrographical analyses are conductedin conjunction with MRI analyses. More sophisticated MRIexperiments would probably provide detailed porosity data.The link between petrographic evaluation and the interpretationof the MR images will ultimately support nuclear magnetic res-onance data obtained from subsurface techniques and shouldimprove interpretations derived from such data. Therefore,future research might focus on dynamic MRI applications, andto the effect mineralogy, pore character and pore distributionhave on the MR data.
ACKNOWLEDGMENTS
Tom Saunders, Floyd Henk, Arjun Keswani, Rosalia Pakand Gladys Fong made extremely valuable contributions tothis manuscript, especially where burrow-related permeabil-ity was concerned. Richard Evoy, William Martindale and J.-P. Zonneveld improved the manuscript with their criticalreviews. The MR images were made in the MRI laboratory atthe University of New Brunswick. The operation of that lab-oratory is made possible through a major facilities grant fromthe Natural Science and Engineering Research Council(NSERC) of Canada, an NSERC operating research grant,and Steacie Fellowship (2000–2002) to BJB. Sampling andpetrographic work was funded through an NSERC researchgrant to MKG.
REFERENCES
Balcom, B.J., MacGregor, R.P., Beyea, S.D., Green, D.P., Armstrong, R.L. andBremner, T.W. 1996. Single-point ramped imaging with T1 enhancement(SPRITE): Journal of Magnetic Resonance, v. A123, p. 131-134.
Beyea, S.D., Balcom, B.J., Bremner, T.W., Prado, P.J., Green, D.P., Armstrong,R.L. and Grattan-Bellew, P.E. 1998. Magnetic resonance imaging andmoisture content profiles of drying concrete. Cement and ConcreteResearch, v. 28(3), p. 453-463.
_______, _______, Mastikhin, I.V., Bremner, T.W., Armstrong, R.L. andGrattan-Bellew, P.E. 2000. Imaging of heterogeneous materials with aturbo spin echo single-point imaging technique. Journal of MagneticResonance, v. A144, p. 255-265.
Brancolini A., Cominelli, A., Kulkarni, R. and Watson, A.T. 1997. Spatial dis-tribution of petrophysical parameters on a core scale using magnetic reso-nance imaging. Transactions of the Society of Professional Well LogAnalysts (SPWLA). Symposium, no. 38.
Chen S., X. Yao, J. Qiao and Watson, A.T. 1996. MRI investigations of frac-tures and multiphase flow in fractured media. Journal of the AmericanInstitute of Chemical Engineers, v. 42, p. 820-828.
Cross, A.R., Armstrong, R.L. and Grattan-Bellew, P.E. 1998. The influence ofshrinkage-cracking on the drying behaviour of White Portland cementusing Single-Point Imaging (SPI). Solid State Nuclear MagneticResonance, v. 13, p. 93-100.
Gingras, M.K., Pemberton, S.G., Mendoza, C. and Henk, F. 1999. Modelingfluid flow in trace fossils; assessing the anisotropic permeability ofGlossifungites surfaces. Petroleum Geoscience, v. 5, p. 349-357.
_______, MacMillan, B., Balcom, B.J., Saunders, T.D.A. and Pemberton, S.G.in press. Using magnetic resonance imaging and petrographic techniques tounderstand the textural attributes and porosity distribution inMacaronichnus-burrowed sandstone. Journal of Sedimentary Research.***VOLUME AND PAGE NUMBERS?
Hoffman, F., Ronen, D. and Pearl, Z. 1996. Evaluation of flow characteristicsof a sand column using magnetic resonance imaging. Journal ofContaminant Hydrology, v. 22, p. 95-107.
Kendall, A.C. 1977. Origin of dolomite mottling in Ordovician limestonesfrom Saskatchewan and Manitoba. Bulletin of Canadian PetroleumGeology, v. 25, p. 480-504.
Kenyon, W.E. 1992. Nuclear magnetic resonance as a petrophysical measure-ment. Nuclear Geophysics, v. 2, p. 153-171.
Morrow, D.W. 1990. Synsedimentary dolospar cementation: a possibleDevonian example in the Camsell Formation, Northwest Territories,Canada. Sedimentology, v. 37, p. 763-773.
Rack, F.R., Balcom, B.J., MacGregor, R.P. and Armstrong, R.L. 1998.Magnetic resonance imaging of the Lake Agassiz-Lake Winnipeg transi-tion. Journal of Paleolimnology. v. 19, p. 255-264.
Zenger, D.H. 1996. Dolomitization patterns in widespread “Bighorn Facies”(Upper Ordovician), western craton, U.S.A. Carbonates and Evaporites,v. 11, p. 219-225.
Manuscript received: October 1, 2001
Revised manuscript accepted: December 27, 2001
MAGNETIC RESONANCE IMAGING AND PETROGRAPHY OF CARBONATE SEDIMENTS 369
�