visualizing cyber security risks with bow-tie diagrams · 2017-10-10 · how can bow-tie diagrams...
TRANSCRIPT

VISUALIZING CYBER SECURITY RISKSWITH BOW-TIE DIAGRAMSSINTEF Digital: Karin Bernsmed, Christian Frøystad, Per Håkon Meland SINTEF OCEAN: Dag Atle Nesheim, Ørnulf Jan Rødseth
GraMSec 2017, Santa Barbara, CA:

2
Image Courtesy: Port of Los Angeles
Image Courtesy: Port of Long Beach

3
Photo: Reuters

4
http://splash247.com/maersk-hit-giant-cyber-attack/

5
$300!

6
http://splash247.com/maersk-still-not-back-normal-three-weeks-petya-attack/

7
"awareness on cyber security needs and challenges in the maritime sector is currently low to non-existent"
"Maritime is way behind the curve in standards on cyber security"
"the soft underbelly of the maritime industry is its reliance on Information and Communication Technology"

8
SAT
SHORE
SHIP
SHIP
VDES: VHF Data Exchange System

Why do we need VDES?
23.08.2017Page 9
Polar Communication
Health Monitoring
Weather Forecasts
WW VTS
eNavigation

11
Bow-tie diagram

Mitigation
Barrier
Prevention
Barrier
12
Unwanted event
Hazard
Cause
Cause
Cause
Escalationfactor
Consequence
Consequence
Consequence
Consequence
Bow-tie diagram

13
Capsize
Sailing close to shore
Mechanicalfailure
Lack of visualacuity
Navigationerror
Alarm system turned off
Loss ofhuman life
Oil spill
Reputationaldamage
Commercial lossNo readingglasses
Concentrationloss
Moldoviandancers
Maintenance
Comp. system
Radar
Coffee
Evacuation
Pumps
Insurance

Research Questions
1. How can bow-tie diagrams be extended to include security considerations in addition to safety considerations?
2. How can the likelihood of cause and severity of cyber attacks be visualized in bow-tie diagrams?
14

15
Qualitative descriptors
Never Extremely rare
Rare Frequent Always
Quantitative scales 0.0001 0.001 0.01 0.1 1
Catastrophic$50 000 k
Critical$ 5 000 k
Moderate$ 500k
Negligible$ 5 k
None$ 1
Likelihood
Cons
eque
nce

16
Unwanted event
Hazard
Cause
Cause
Threat
Consequence
Consequence
Consequence
Asset
Barrier Barrier
Security control
Security controlThreat Actors
Window of OpportunityVulnerabilities
Security Controls
IndividualEnvironmentReputationCommercial
Likelihood ImpactRisk
Qualitative descriptors
Never Extremely rare
Rare Frequent Always
Quantitative scales 0.0001 0.001 0.01 0.1 1
Catastrophic$50 000 k
Critical$ 5 000 k
Moderate$ 500k
Negligible$ 5 k
None$ 1
Likelihood
Cons
eque
nce
Extensions

17

18

19
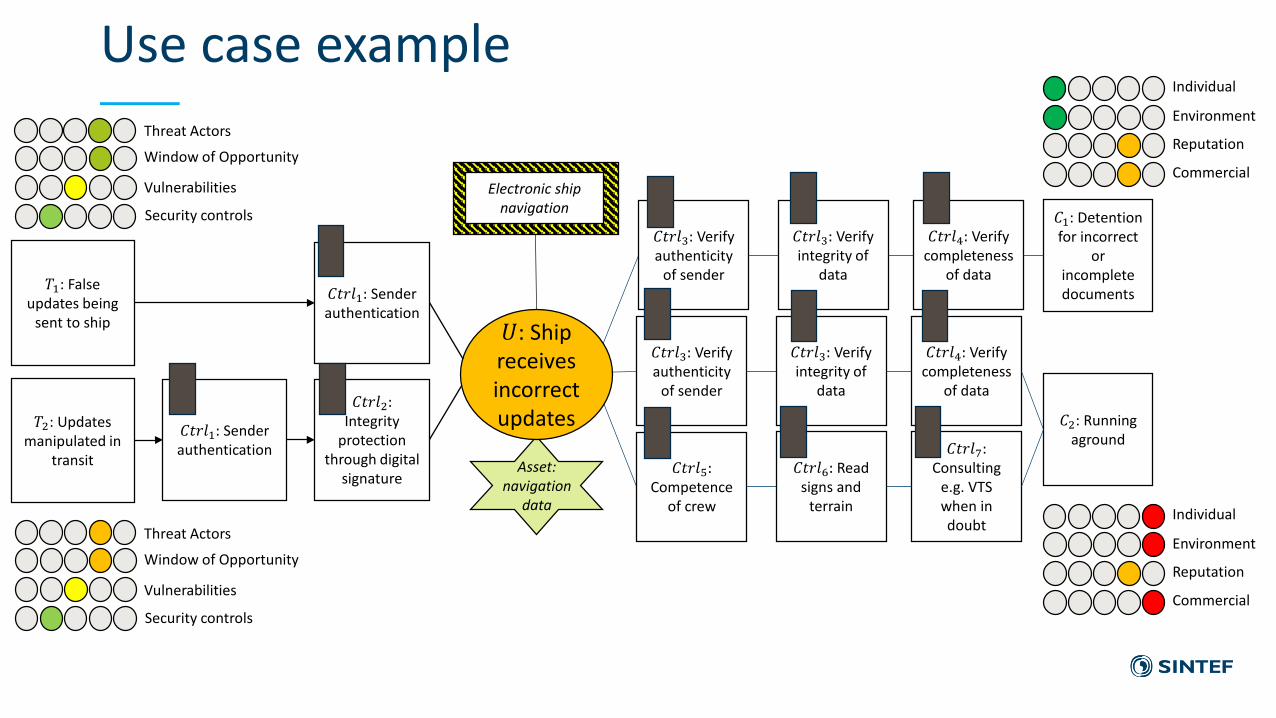
Electronic ship navigation
Threat Actors
Window of Opportunity
Vulnerabilities
Security controls
Threat Actors
Window of Opportunity
Vulnerabilities
Security controls
Individual
Environment
Reputation
Commercial
Individual
Environment
Reputation
Commercial
Asset: navigation
data
𝑇𝑇2: Updates manipulated in
transit
𝑇𝑇1: False updates being
sent to ship
𝐶𝐶𝑡𝑡𝑡𝑡𝑡𝑡1: Sender authentication
𝐶𝐶𝑡𝑡𝑡𝑡𝑡𝑡2:Integrity
protection through digital
signature
𝐶𝐶𝑡𝑡𝑡𝑡𝑡𝑡1: Sender authentication
𝐶𝐶1: Detention for incorrect
or incomplete documents
𝐶𝐶2: Running aground
𝐶𝐶𝑡𝑡𝑡𝑡𝑡𝑡3: Verify authenticity
of sender
𝐶𝐶𝑡𝑡𝑡𝑡𝑡𝑡3: Verify integrity of
data
𝐶𝐶𝑡𝑡𝑡𝑡𝑡𝑡4: Verify completeness
of data
𝐶𝐶𝑡𝑡𝑡𝑡𝑡𝑡3: Verify authenticity
of sender
𝐶𝐶𝑡𝑡𝑡𝑡𝑡𝑡3: Verify integrity of
data
𝐶𝐶𝑡𝑡𝑡𝑡𝑡𝑡4: Verify completeness
of data
𝐶𝐶𝑡𝑡𝑡𝑡𝑡𝑡5:Competence
of crew
𝐶𝐶𝑡𝑡𝑡𝑡𝑡𝑡6: Read signs and
terrain
𝐶𝐶𝑡𝑡𝑡𝑡𝑡𝑡7:Consulting
e.g. VTS when in doubt
𝑈𝑈: Ship receives incorrect updates
Use case example

Final remarks
• Scenario based analysis proves that: • security concepts can be contained within bow-ties (RQ1)• RMA-inspired indicators work well to visualize likelihood (RQ2)
• High level overview of causes, consequences, barriers• more suitable to put details in other types of diagrams
21