visualization of dynamic power and synchrony changes in high density eeg a. alba 1, t. harmony2,...
TRANSCRIPT

Visualization of dynamic power and synchrony
changes in high density EEG
A. Alba1, T. Harmony2, J.L. Marroquín2, E. Arce1
1 Facultad de Ciencias, UASLP2 Instituto de Neurobiología, UNAM
3 Centro de Investigación en Matemáticas, A.C.

Overview
IntroductionEstimation of power changesEstimation of synchrony changesClassification and segmentationResults with HD-EEGConclusions

Introduction
Electroencephalography (EEG) consists of voltage measurements recorded by electrodes placed on the scalp surface or within the cortex.
Electrode cap
Varela et al., 2001
• During cognitive tasks, several areas of the brain are activated simultaneously and may even interact together.

High density EEG
Uses a large number of electrodes (64-256) to increase spatial resolution.
However, synchrony is typically computed for each electrode pair.
The amount of synchrony data is proportional to the square of the number of electrodes!

High density EEG
Example: an experiment with
128 channels, 1024 samples per channel, Analyzed over 20 frequency bands,
yields about 3x10⁸ synchrony values!

Estimation of power changes
1. Run the EEG signals through a bank of bandpass quadrature filters.
2. Extract the log-amplitude from the output of each filter.
3. Average the log-amplitude over all trials.
4. Subtract the baseline (pre-stimulus average) from the log-amplitude signals.
5. Classify values as higher (+1), lower (-1) or equal (0) than the baseline.

Estimation of synchrony changes
1. Run the EEG signals through a bank of bandpass quadrature filters to obtain their (instantaneous) phase.
2. Compute the (normalized) phase difference for each electrode pair.
3. Subtract the baseline (pre-stimulus average) from the phase-difference signals.
4. Classify values as higher (+1), lower (-1) or equal (0) than the baseline.

Classification and segmentation
Spatial patterns of power and synchrony changes appear at specific time-frequency windows.
We use a segmentation technique to detect time-frequency regions where the power/synchrony pattern is homogeneous.
Segmentation is performed by seeded region growing, with a Bayesian regularization stage.

Seeded region growingTF regions with homogeneous SP’s can be segmented using a simple region growing algorithm, which basically:
1. Computes a representative synchrony pattern (RSP) for each region (initially the SP corresponding to the seed).
2. Takes a pixel from some region’s border and compares its neighbors against the region’s RSP. If they are similar enough, the neighbors are included in the region and the RSP is recomputed.
3. Repeats the process until neither region can be expanded any further.

Seeded region growing

Automatic seed selection
An unlabeled pixel is a good candidate for a seed if it is similar to its neighbors, and all of its neighbors are also unlabeled.
To obtain an automatic segmentation, choose the seed which best fits the criteria above, grow the corresponding region, and repeat the procedure.

Bayesian regularizationThe regions obtained by region-growing show very rough edges and require regularization.
We apply Bayesian regularization by minimizing the following energy function:
lt,f is the label fieldLt,f is a pseudo-likelihood functionNs is the number of electrode pairsV is the Ising potential functiont and f are regularization parameters

Visualization (Figure categorization experiment)
The field cf,t,e1,e2 can be partially visualized in various ways:
Multitoposcopic display of the synchronization pattern (SP) at a
given time and frequency
Time-frequency (TF) map for a given electrode pair (T4-O2)
Time-frequency-topography (TFT) histogram of synchrony increases at
each electrode
• The TFT histogram shows regions with homogeneous synchronization patterns. These may be related to specific neural processes.

Results with HD-EEG
We tested our methodology with data from a 120-electrode experiment following the Go/NoGo paradigm.
The tests were performed using different subsets of the 120 electrodes:

Results: Go – 19 electrodes
Synch
ron
y d
ata
Segm
en
ted d
ata
Region map Representative patterns

Results: Go – 120 electrodes
Synch
ron
y d
ata
Segm
en
ted d
ata
Region map Representative patterns

Results: NoGo – 19 electrodes
Synch
ron
y d
ata
Segm
en
ted d
ata
Region map Representative patterns

Results: NoGo – 120 electrodes
Synch
ron
y d
ata
Segm
en
ted d
ata
Region map Representative patterns
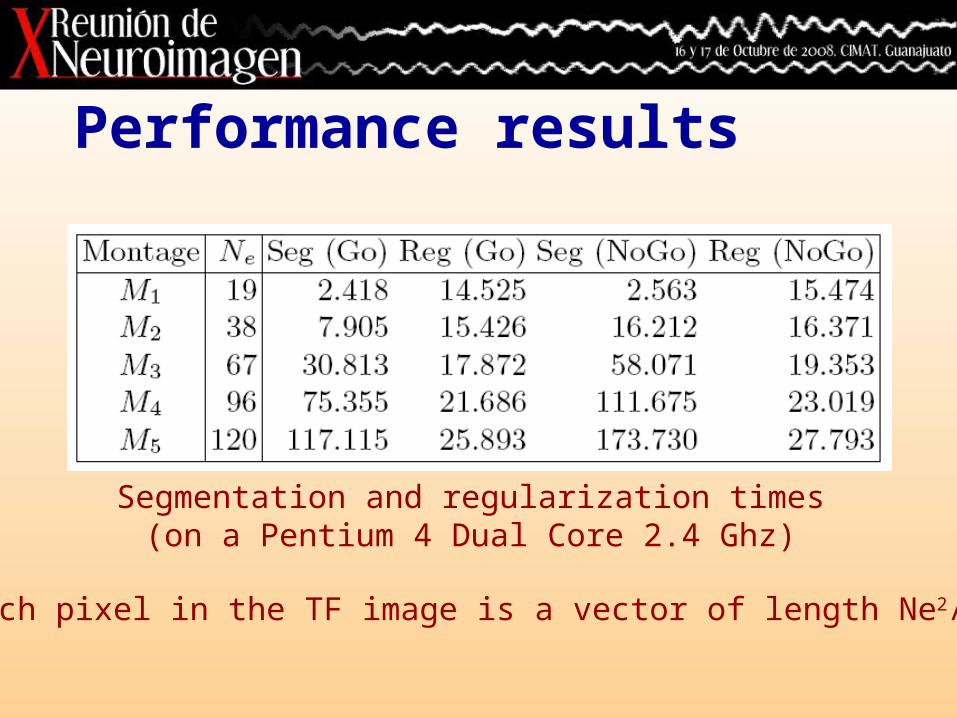
Performance results
Segmentation and regularization times(on a Pentium 4 Dual Core 2.4 Ghz)
Each pixel in the TF image is a vector of length Ne2/2.

ConclusionsSegmentation of the TF plane in regions with homogeneous power/synchrony patterns yields important information about task-related processes.
High density EEG may improve the quality of the segmentation.
A small subset of electrodes may be used to obtain a rough segmentation.

Thank you!

Comparison between synchrony measures

Correlation between synchrony measures
MPD CPPD PLS STPLS CoherenceMPD 1.000 0.835 0.853 0.477 0.508CPPD 0.835 1.000 0.755 0.500 0.525PLS 0.853 0.755 1.000 0.503 0.536STPLS 0.477 0.500 0.503 1.000 0.872
Coherence 0.508 0.525 0.536 0.872 1.000
Measure correlation

Sensitivity to local phase variations
• We define a local phase constancy (LPC) measure as:
• Correlation between synchrony measures and LPC:
This suggests that STPLS and Coherence may be more sensitive to local changes not necessarily related to synchonous processes.

Sensitivity to volume conduction
• Lachaux: “if there is high synchrony between two electrodes, then one should also observe high synchrony between their neighbors.”
• Neighbor synchrony measure +: for each electrode pair <e1 , e2> for which a synchrony increase is observed, one can estimate the probability of observing an increase in synchrony between a neighbor of e1 and a neighbor of e2.