visualization approaches for communicating real-time flood forecasting level and inundation...
TRANSCRIPT

Visualizationapproaches for communicating real-time£oodforecasting level and inundation informationD. Leedal1, J. Neal2, K. Beven1,3, P. Young1,4 and P. Bates2
1 Lancaster Environment Centre, Lancaster University, Lancaster, UK
2 School of Geographical Sciences, University of Bristol, Bristol, UK
3 Geocentrum, Uppsala University, Uppsala, Sweden
4 Centre for Resource and Environmental Studies, Institute of Advanced Studies, Australian National University, Canberra, Australia
Correspondence:
David Leedal, Lancaster Environment Centre,
Lancaster University, Lancaster, LA1 4YQ, UK
Email: [email protected]
DOI:10.1111/j.1753-318X.2010.01063.x
Key words
Carlisle; data-based mechanistic; inundation;
LISFLOOD-FP; real-time flood forecasting;
uncertainty.
Abstract
The January 2005 flood event in the Eden catchment (UK) has focused consider-
able research effort towards strengthening and extending operational flood
forecasting in the region. The Eden catchment has become a key study site within
the remit of phase two of the Flood Risk Management Research Consortium. This
paper presents a synthesis of results incorporating model uncertainty analysis,
computationally efficient real-time data assimilation/forecasting algorithms, two-
dimensional (2D) inundation modelling, and data visualization for decision
support. The emphasis here is on methods of presenting information from a new
generation of probabilistic flood forecasting models. Using Environment Agency
rain and river-level gauge data, a data-based mechanistic model is identified and
incorporated into a modified Kalman Filter (KF) data assimilation algorithm
designed for real-time flood forecasting applications. The KF process generates
forecasts within a probabilistic framework. A simulation of the 6-h ahead forecast
for river levels at Sheepmount (Carlisle) covering the January 2005 flood event is
presented together with methods of visualizing the associated uncertainty. These
methods are then coupled to the 2D hydrodynamic LISFLOOD-FP model to
produce real-time flood inundation maps. The value of incorporating probabilistic
information is emphasized.
Introduction
This paper provides an overview of the approaches used to
generate two complementary forms of probabilistic informa-
tion relevant to flood risk management together with meth-
ods of communicating and visualizing this information. The
research activity is focused on the city of Carlisle within the
Eden catchment (UK) and the analysis time frame encom-
passes the serious flooding event of January 2005. Figure 1
shows the location of the study site with markers for the
Environment Agency gauge sites used later.
Operational flood forecasting is concerned with tracking
and forecasting the movement of a flood wave through a
catchment system with the aim of providing accurate and
useful information to actors involved in flood risk manage-
ment. An ideal forecast would provide information of flows,
levels, velocities, timings, and inundation with enough lead
time to allow for the deployment of flood defences and/or
the evacuation of at-risk areas. Unfortunately, experience
has shown that the science of flood forecasting is many years
from being able to provide all this information in a
consistently accurate fashion, and worse, for the case of long
lead times involving meteorological simulation, the sensi-
tivity of environmental systems to initial conditions suggests
that accurate deterministic forecasting will never be possi-
ble. To account for the limitations of modelling and
forecasting methods, the relatively new field of uncertainty
analysis has developed to provide environmental modellers
with the tools to allow (and encourage) model output to be
seen within a probabilistic context.
Model uncertainty does not provide too serious an
obstacle when models are used as a virtual laboratory for
scientific enquiry; for example, the Lorenz equations pro-
vide an invaluable insight into the properties of chaotic
systems, and similarly, the Lotka–Volterra equations are
invaluable for exploring predator–prey relationships.
Neither of these classic models calls for a consideration of
parameter uncertainty in order to be fit for their required
purpose. However, many modern environmental models
serve the purpose of providing forecast data to inform policy
J Flood Risk Management 3 (2010) 140–150c� 2010 The AuthorsJournal Compilation c� 2010 Blackwell Publishing Ltd

and support decision making. Within this context, it could
be argued that a model study is only fit for purpose when
not only the forecast but also the nature of the uncertainty
associated with the forecast are considered together. Beven
(2008) presents an in-depth reflection on this issue.
The field of model-based operational flood forecasting is a
clear example of the application of numerical forecasting as a
tool to support policy decisions. In the United Kingdom for
example, a broad range of models, from simple regression
based equations to complex hydrodynamic models, are a
common component of systems designed to guard against
human exposure to flood risk. For a review of the main
families of flood forecasting model used by the United King-
dom’s Environment Agency, see Moore and Bell (2001).
Historically, the main objective in the field of hydrological
modelling for flood forecasting has been to focus attention on
improving the model’s deterministic forecasting skill. Incre-
mental improvements in deterministic forecasting should be
possible through new modelling approaches and better model
calibration brought about by the assimilation of the ever-
growing body of hydrological data. It is trivially clear how
improvements in deterministic forecasting skill will provide
real benefits in reducing human exposure to flood risk (i.e.
consistently accurate flood warnings). However, at present, the
use of probabilistic information as a tool for decision support
in operational flood forecasting is very much the exception
rather than the rule. As a result, the value to the decision-
maker, of information displaying the degree of uncertainty in
a numerical model’s forecast, is as yet underresearched.
The authors believe that probabilistic information should
take on a central role in the presentation of model output to
decision makers. There are two main obstacles to achieving
this goal: (1) models with a high parametric dimensionality
require complex and computationally intensive methods for
uncertainty estimation that may not be appropriate for
applications such as real-time flood forecasting, where
calculation time and computational stability are key require-
ments and (2) probabilistic information needs to be ex-
pressed in a form that adds usefulness rather than confusion
to model output. This paper addresses the above issues by
demonstrating a real-time flood forecasting application for
Carlisle that tackles issue (1) by utilizing the parametrically
efficient data-based mechanistic modelling and data assim-
ilation approach to generate point estimates of river levels.
These levels are then passed to a simplified two-dimensional
(2D) hydrodynamic model of the key urban flood risk site.
While the 2D model is computationally expensive, offline
methods can be used to generate libraries of scenarios that
can be drawn on in real time, thus providing real-time 2D
inundation visualization capability. Issue (2) is addressed by
presenting a range of methods for conveying the complex
information content of probabilistic real-time flood fore-
casting output in an intuitive way that may provide new and
useful information for decision support personnel.
Methods
Data-based mechanistic rainfall to levelforecasting
The data-based mechanistic (DBM) modelling approach,
developed by Young and colleagues (see Young, 1998 and the
Figure 1 Location of the study site centred on Carlisle (UK) with the location of the Environment Agency’s four level gauge sites used in this study
(marked with circles). Reproduced from the OS MiniScale 1:1000000 map by the permission of Ordnance Survey on behalf of the Controller of Her
Majesty’s Stationery Office r Crown Copyright. Lancaster University, Bailrigg, Lancaster. O.S. Licence No. A281220.
J Flood Risk Management 3 (2010) 140–150 c� 2010 The AuthorsJournal Compilation c� 2010 Blackwell Publishing Ltd
141Visualization approaches for communicating real-time flood forecasting

references therein), was used to identify and estimate rainfall
to river-level relationships for the four locations of study in the
Carlisle region (Sheepmount, Linstock, Harraby Green, and
Denton Holme). Following the identification/estimation pro-
cess, the DBM transfer function model for each location was
recast in equivalent state space form and incorporated into a
modified Kalman Filter (KF) data assimilation algorithm (the
original KF is described in Kalman, 1960). This process has
been described in detail for different catchments in Romano-
wicz et al. (2006) and Young (2002); this paper will only
present pertinent details from the above where necessary.
Figure 2 provides a basic visual description of the opera-
tion of the KF data assimilation and forecasting process.
With reference to Figure 2, at time period k, an observation
of river level becomes available together with an estimate of
the uncertainty associated with the observation; this is
compared with the model forecast at the corresponding
time period, which also has a measure of uncertainty
(indicated in the diagram by normal curves). Equations (2)
and (3) in the text provide a recursive solution to estimating
the minimum variance blend of these two values. The new
value then provides the starting point for the n-step ahead
forecasts of level into the future; the propagation of the
forecast variance provides forecast uncertainty information
useful for decision support.
Importantly, for probabilistic forecasting, the KF data
assimilation algorithm inherently generates an estimate of
the error covariance matrix at each time step. Equation (1)
shows the state space form for each model. Data assimilation
was then performed using the recursive implementation of
Eqns (2) and (3).
xk ¼ Fxk�1 þ Guk�d þ zk
yk ¼ hTxk þ xk ð1Þ
Forecast:
xkjk�1 ¼ Fxk�1 þ Guk�d
Pkjk�1 ¼ FPk�1FT þ s2kQr
ykjk�1 ¼ hTxkjk�1
ð2Þ
Correction:
xk ¼ xkjk�1 þ Pkjk�1h½s2 þ hTPkjk�1��1fyk � ykjk�1gPk ¼ Pkjk�1 � Pkjk�1h½s2 þ hTPkjk�1��1hTPkjk�1
yk ¼ hTxk
ð3Þ
where the elements of F, G, and h are determined by the
associated transfer function model parameters, uk is a vector
of input terms (rainfall or upstream level) usually trans-
formed according to a power law function, d is the time
delay between input and output (this provides the forecast
lead time), zk is the process noise entering the system at time
period k, xk is the observation noise applied to the measure-
ment of level at time period k, s2k is the variance of the
observation noise at time period k, and Qr is a diagonal
matrix where the entries along the diagonal are model
hyperparameters defining the ratio of process to observation
noise. The values of Qr can either be optimized or tuned
using pragmatic heuristic rules until an appropriate level of
simulation performance is achieved.
Importantly, it is assumed that the observation noise
variance is heteroscedastic, effectively providing a means to
place less confidence in observations as the river level
increases. An estimate of the level-dependent observation
noise variance is generated using Eqn (4).
s2k ¼ l0 þ l1y2
k ð4Þwhere l0 and l1 are the parameters determining the rela-
tionship between the forecast level and the observation noise
Figure 2 Diagram showing the operation of the Kalman Filter data assimilation and forecasting process for real-time flood forecasting.
J Flood Risk Management 3 (2010) 140–150c� 2010 The AuthorsJournal Compilation c� 2010 Blackwell Publishing Ltd
142 Leedal et al.
variance. Again, these model hyperparameters can either be
optimized or determined heuristically, where, in general
terms, l0 controls the baseline extent of forecast confidence
intervals at low flows and l1 defines the degree of inflation in
the confidence intervals as the forecasted level increases.
Each model can generate n-step ahead forecasts of level
where the maximum value for n for each model is equal to
the model’s associated value of d. For the results presented
here, the value of d is 6 h for Sheepmount and 5 h for
Linstock, Harraby Green, and Denton Holme. In operation,
a forecast and correction cycle is carried out at each sample
period as a new level and rainfall observation arrive (the
‘present’ sample period is labelled k). This is followed by drepetitions of the forecast step to produce level forecasts for
k11 to k1d periods into the future. Crucially, for operation
within a probabilistic framework, the error covariance
matrix P from Eqns (2) and (3), together with Eqn (4), are
used to estimate the variance for the k1n forecasts using
Eqn (5).
varðykþnjkÞ ¼ s2k þ hTPkþnjkh ð5Þ
An additional step is the application of an adaptive scalar
gain term. This mechanism applies a corrective offset to the
level forecasts that can be used to account for slow drifts in
the forecast accuracy that may result from long time scale
non-stationarity in the catchment process. This algorithm is
not included here; the interested reader is directed to the
references above for a complete description.
The key advantages of applying the algorithm described
above are: (1) the parsimonious model structure results in
computationally efficient data assimilation and forecasting
schemes and (2) the resulting n-step ahead forecasts are
defined in the form of symmetrical probability distributions
(mean and variance) that provide useful probabilistic in-
formation for flood risk management. This paper goes on to
consider two applications for these output: (1) the direct
communication of flood warning using level prediction and
warning thresholds and (2) the provision of n-step ahead
probabilistic boundary conditions to 2D hydrodynamic
models that can then provide probabilistic forecasts for
inundation extents within urban locations. The methods
for the latter are considered next.
Coupled 1--2D real-time probabilistic inundationforecasting
LISFLOOD-FP is a 2D storage cell hydrodynamic model
that can usefully be used to estimate flood inundation extent
for flood risk mapping or, using the special offline methods
outlined here, as a means of providing inundation informa-
tion in real time. The model is introduced in Hunter et al.
(2005). The model presented here for Carlisle is described in
detail in Neal et al. (2009). The model has a 25 m resolution
raster representation of floodplain topography sampled
from a 1 m resolution LiDAR-based digital terrain model
(DTM). Embankment tops in the DTM were retained in the
course resolution model grid, as these were assumed to have
a significant impact on flood inundation. The three rivers
shown in Figure 1 (River Eden, Caldew and Petteril) were
included in the 1D channel model. The 1D channel model
used a Manning’s roughness value of 0.055, while the 2D
floodplain model used 0.06. These values were obtained from
a calibration using observations of maximum water level on
the floodplain measured shortly after the January 2005 flood
event. A detailed description of this model and its accuracy
was presented by Neal et al. (2009) and will not be repeated
here. However, the method for estimating flood probabilities
is sufficiently generic that any model of the hydraulics that is
capable of incorporating the three inflows could be used,
with the proviso that the accuracy of the inundation model
will affect the accuracy of the probability estimates.
The principal behind the approach used here is that a
multidimensional array of simulations representing differ-
ent flow conditions on each river can be used as a rapidly
accessible library of inundation extents, given any flow
conditions within a pre-defined range. By generating an
offline library of simulation results, flood inundation prob-
abilities can be assessed rapidly, which would not be the case
if an ensemble of inundation models were run in real time
based on the equivalent forecast. Similar approaches have
been suggested by Aronica et al. (2002), Romanowicz and
Beven (2003), and Purvis et al. (2008). While the offline
library of simulations approach provides huge advantages in
terms of processing speed, the fact that the library of
simulations is based on steady state flows at the peak levels
has the drawback of not considering the effect of flood wave
dynamics on inundation extent that is, an assumption is
made that the dynamics of the flow on each tributary are
unimportant relative to the uncertainty in the peak flow
itself. Also, from an uncertainty point of view, the hydraulic
model and the rating at each gauge were assumed to be
perfect in the results presented later.
The inundation extent library was defined by populating
a 3D matrix of simulation results, where each simulation
had a different combination of inflows sampled from a pre-
defined range and a uniform distribution. The number of
simulations could have been reduced had a sufficient
correlation existed between the observed levels at two or
more gauges, e.g. by specifying a fixed relationship between
levels at different gauges. Unfortunately, differences in the
arrival time of peak flows and shape of hydrographs for each
river precluded this approach.
Peak forecast levels between September 2003 and March
2005 plus two standard errors were used to determine the
maximum levels that would be simulated by the hydraulic
model for the inundation extent library.
J Flood Risk Management 3 (2010) 140–150 c� 2010 The AuthorsJournal Compilation c� 2010 Blackwell Publishing Ltd
143Visualization approaches for communicating real-time flood forecasting
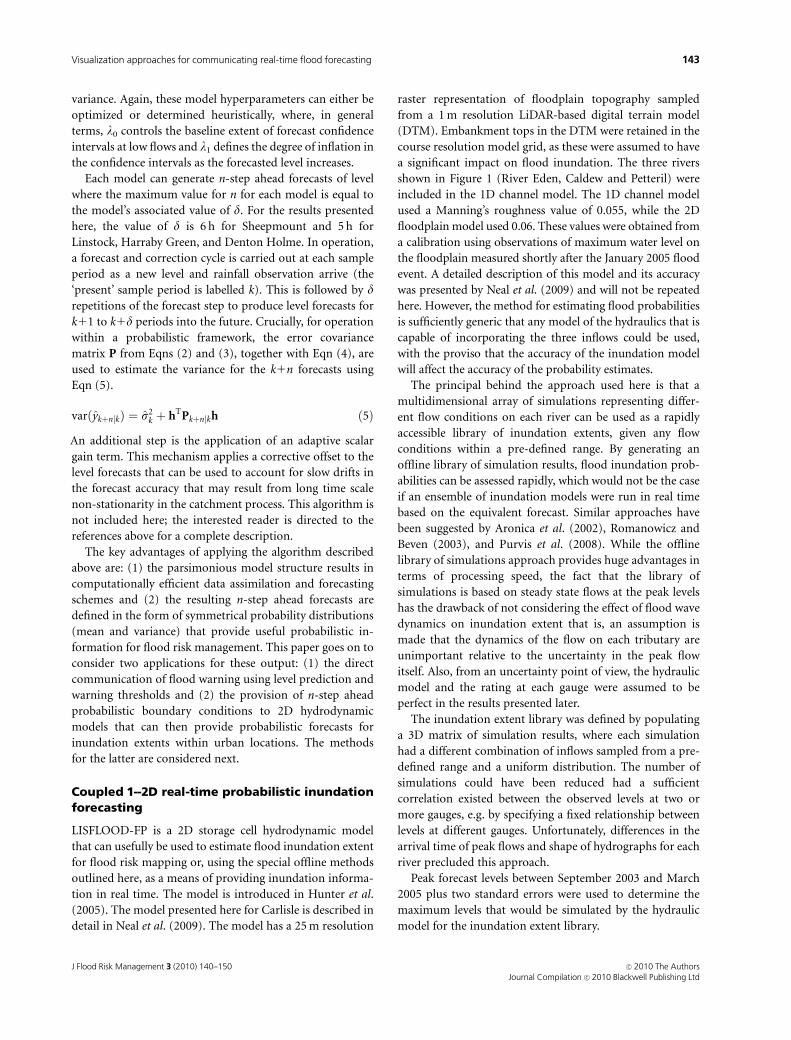
Although the maximum level simulated for Linstock was
reduced from 7 to 5.75 m, because levels above 5.75 m
generated physically unrealistic flows when the rating curve
was applied, lower level limits for the inundation extent
library were arbitrarily chosen at a level where inundation of
the floodplain did not occur. The range of levels simulated
in the inundation extent library is shown in Table 1.
The forecasting model provided a best estimate and
standard error at the three gauge locations close to the edge
of the model domain. For each forecast issued by the DBM
model, the probability of simulation a in the library of bsimulations was calculated using a multivariate normal
probability density function for that forecast. It was as-
sumed that the uncertainty in the forecast stage was
represented well by a normal distribution. The method can
be applied where forecast errors at each gauge are correlated,
although this was assumed not to be the case here as each
forecast was driven by independent gauge data.
The probability of inundation in cell i of the flood
inundation model was then estimated using a multivariate
extension of the method used by Purvis et al. (2008):
Pi ¼Pb
a ma;iPaPb
a Pað6Þ
where Pi is the probability of inundation in cell i, Pa is the
multivariate probability density of library simulation a, and
ma,i is the value of the binary flood inundation map (0 = dry,
1 = wet) for simulation a and location i.
Results
Presenting point-level estimates forSheepmount
In this first section of the results, we present probabilistic real-
time flood forecasting information generated by the DBM
modelling and KF algorithm described above. The forecast is
a point estimate of the level of the River Eden at the
Sheepmount gauge site used by the Environment Agency as
an indicator site for flood warning. While this paper is more
concerned with describing the types of information useful for
real-time flood forecasting, how to generate that information,
and a discussion of how best to communicate that informa-
tion, it is worth noting that the results presented here are
drawn from well-developed research investigating novel
methods for real-time forecasting and are tested using the
unprecedented January 2005 Carlisle flood.
The point-level information is presented in a form that
replicates the information content that would be available to
personnel in real time. The information available includes:
(1) present and all previous observations of river level; (2)
present and previous rainfall/upstream inputs; (3) all pre-
vious 1–6-h ahead forecasts at corresponding time values
together with variance estimates; (4) 1–6-h forecasts into the
future together with variance estimates; and (5) the value of
warning thresholds. Figure 3 shows the first in a series of
example output for point-level real-time forecasting in
Cartesian form.
Figure 3 shows the forecast level passing through the
lower three warning thresholds. The inclusion of the con-
fidence interval provides a highly useful indication of the
level of confidence in each forecast value. The inclusion of
the past 6-h forecasts and the associated confidence intervals
provides the user with information about the past perfor-
mance of the forecast and confidence intervals. It is im-
portant to note, however, that the provision of forecast
confidence intervals provides flood management profes-
sionals with additional decision-making complexity raising
unforeseen issues such as who takes ‘ownership’ of the
uncertainty? For a case study and analysis of the treatment
of uncertainty in real-time flood risk management, see
McCarthy et al. (2007). Figures 4–7 show the progression
of the 2005 flood wave.
The probabilistic information encoded in the forecasting
visualizations is of key importance for decision support.
During the majority of extreme flood events covered by
model forecasting, the models perform less well than hoped
(see Spencer et al. (2006) for a post event analysis of the
performance of the Environment Agency’s models applied
to the Carlisle 2005 event). The disappointing level of
performance is not surprising, considering each large flood
event is unique, and it is very difficult to calibrate a model
for these rare events. Inevitably, any model attempting to
forecast complex hydraulic processes will do so with some
degree of error. The confidence intervals in the result
reporting are an attempt to communicate this to flood risk
management personnel.
Given a probabilistic estimate of level, the flood risk
management team can then inform decisions based on the
degree of risk. For example demountable defences may be
deployed at sensitive locations at a lower probability of
inundation compared with less sensitive locations in order
to best administer resources.
Issuing warning as the river level crosses specific thresh-
olds is a common practice in flood risk management.
Figures 3–7 show how the grey areas intersect with thresh-
olds as levels rise. Figure 8 shows the post event analysis in
Table 1 Range of levels and sampling intervals used to generate the
simulation library
Minimum
level (m)
Maximum
level (m)
Sampling
interval (m)
Linstock 1 5.75 0.25
Harraby Green 1 2.5 0.5
Denton Holme 0.5 5.75 0.25
J Flood Risk Management 3 (2010) 140–150c� 2010 The AuthorsJournal Compilation c� 2010 Blackwell Publishing Ltd
144 Leedal et al.

terms of the actual times when the observed level crossed the
six threshold values and the cumulative probability curves of
level crossing the threshold estimated by the 6-h ahead
forecast.
Figure 8 demonstrates that the expected value (the
0.5 probability level) often misses the observed crossing
time by several hours (the date labels are 6 h apart).
However, for the four highest thresholds, the observed
crossing time falls within an �80% confidence range.
It should not be understated that flood risk manage
ment professionals are familiar with working with uncer-
tainty via experience, communication with others, and
professional judgement. The added value of probabilistic
information in the form of confidence intervals is to provide
some formal and rapidly accessible means of quantifying
forecast uncertainty that may support the judgement pro-
cess determining whether, when, and where inundation will
occur.
1--2D LISFLOOD-FP probabilistic real-timeinundation maps
This section of the results considers the visualization of 2D
inundation maps generated using the methods described
above. Again, research into both the point estimate and 2D
modelling as well as approaches to couple these methods is
Figure 4 Six forecast beginning 8 p.m., 7 January 2005. See Figure 3 for legend.
Figure 3 Six-hour ahead real-time flood forecasting figure for Sheepmount at 2 p.m., 7 January 2005. Included in the figure are present and previous
observed levels (solid black line), previous 6-h forecasts plus 99% and 95% confidence intervals (black dots plus light and dark grey patch), the present
time period (vertical line), warning threshold levels (horizontal lines), 1–6-h ahead level forecasts plus 99% and 95% confidence intervals (black dots
with red outline plus light and dark reddish-grey patch).
J Flood Risk Management 3 (2010) 140–150 c� 2010 The AuthorsJournal Compilation c� 2010 Blackwell Publishing Ltd
145Visualization approaches for communicating real-time flood forecasting

Figure 5 Forecast beginning midnight, 8 January 2005. See Figure 3 for legend.
Figure 6 Forecast beginning 1 p.m., 8 January 2005. See Figure 3 for legend.
Figure 7 Forecast beginning 7 p.m., 8 January 2005. See Figure 3 for legend. The time axis has been extended for contrast with Figures 3–6.
J Flood Risk Management 3 (2010) 140–150c� 2010 The AuthorsJournal Compilation c� 2010 Blackwell Publishing Ltd
146 Leedal et al.

ongoing, but the authors are using useful inundation fore-
cast visualizations of the January 2005 Carlisle flood event
for illustration. The propagation of level plus uncertainty
information from the 1D DBM methods described above to
the 2D hydrodynamic model allows probabilistic estimates
of inundation extent to be generated in real time. Informa-
tion is held in the form of probability distributions for the
wetness of each cell within the LISFLOOD grid. This
information can be communicated to flood risk manage-
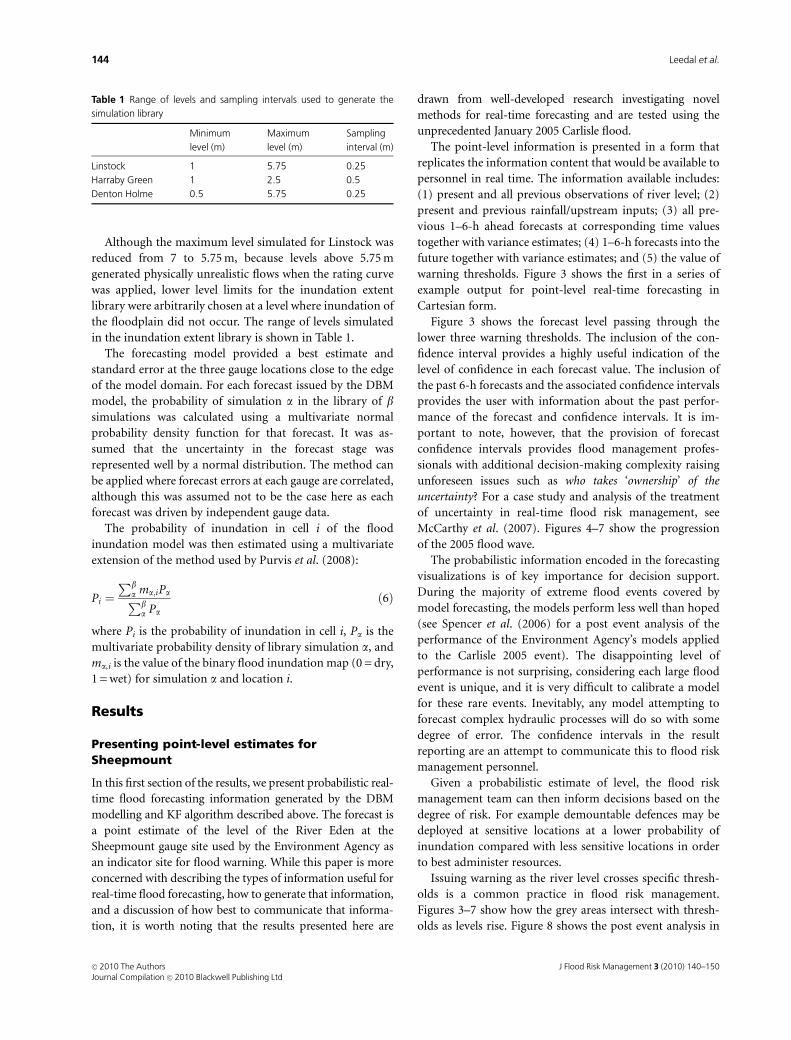
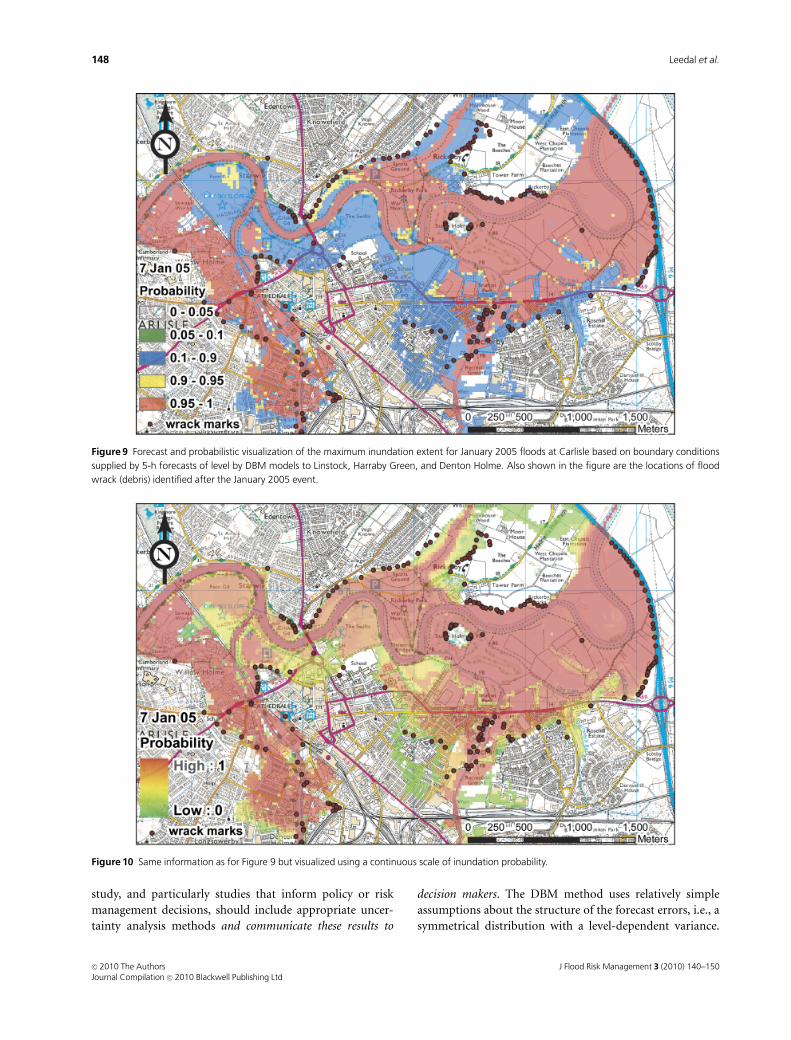
ment personnel in a number of ways. Using the peak flows
for the January 2005 event at Carlisle, Figures 9 and 10 show
inundation estimation maps colour coded with probabilistic
information. Figure 9 uses discrete increments of probabil-
ity, while Figure 10 presents a graduation in shade between
green (low probability) and red (high probability). Each
inundation figure also shows the location of wrack marks
(debris left behind following flooding) collected and logged
by the Environment Agency. The line of wrack marks
provides a surrogate measure for the outline of inundation
that actually occurred during the January 2005 event. This
outline once again demonstrates the importance of mapping
within a probabilistic framework as forecasted and observed
inundation correspond well in some locations and less well
in others.
For the purpose of testing, Figure 10 is included below,
which shows the deterministic depth map resulting from a
LISFLOOD-FP simulation using best available observed
levels for the January 2005 event (again with wrack loca-
tions). The 5-h 1–2D coupled forecast inundation map
shows a relatively good correlation to Figure 11, which is
effectively the best flood inundation estimate using the
LISFLOOD-FP model that would be available after river-
level data had been observed.
The results presented above show a number of novel and
potentially useful features. These include real-time level
forecast uncertainty bounds generated automatically by the
KF algorithm, the coupling of 1–2D modelling to allow
rapid calculation of inundation extent, the use of offline
methods to allow rapid estimates of inundation uncertainty
associated with the 2D model results, and both Cartesian
and map overlay methods in an attempt to clearly commu-
nicate uncertainty estimates to flood-risk management
professionals.
Comment
This paper has focused on the need for probabilistic
forecasting in real-time flood forecasting using the 2005
Carlisle flood event as a test bed. The objective has been to
identify which information would be useful in real-time
flood forecasting applications, how that information can be
generated, and finally how that information can be visua-
lized and communicated. The last of these objectives is
probably the furthest outside the area of expertise of the
authors. While the authors are familiar with ‘good’ knowl-
edge presentation philosophies as encouraged by Tufte
(1984, 1990), further research is required to address issues
of visualization style and layout when presenting complex
model output information to personnel in real-time flood
forecasting environments.
Experience from point-level estimate real-time forecast-
ing simulation demonstrates that while continuous ad-
vances in modelling skill should make deterministic
forecasting gradually more accurate, it would be unwise to
assume that uncertainty could ever be completely eradicated
from model results. Therefore, any environmental model
Figure 8 Cumulative distribution plots showing the probability that the 6-h ahead forecast level will be greater than each of the six warning threshold
levels. Vertical lines show the observed time of crossing for each threshold.
J Flood Risk Management 3 (2010) 140–150 c� 2010 The AuthorsJournal Compilation c� 2010 Blackwell Publishing Ltd
147Visualization approaches for communicating real-time flood forecasting
study, and particularly studies that inform policy or risk
management decisions, should include appropriate uncer-
tainty analysis methods and communicate these results to
decision makers. The DBM method uses relatively simple
assumptions about the structure of the forecast errors, i.e., a
symmetrical distribution with a level-dependent variance.
Figure 10 Same information as for Figure 9 but visualized using a continuous scale of inundation probability.
Figure 9 Forecast and probabilistic visualization of the maximum inundation extent for January 2005 floods at Carlisle based on boundary conditions
supplied by 5-h forecasts of level by DBM models to Linstock, Harraby Green, and Denton Holme. Also shown in the figure are the locations of flood
wrack (debris) identified after the January 2005 event.
J Flood Risk Management 3 (2010) 140–150c� 2010 The AuthorsJournal Compilation c� 2010 Blackwell Publishing Ltd
148 Leedal et al.

Further research needs to be carried out to refine and extend
the identification and parameterization of the forecast error
term. The mean value of the DBM forecast rarely crosses
flood warning thresholds at exactly the same time as the
observed level. However, the observed threshold crossing
times generally lie within the identified forecast confidence
intervals. This information would be useful in real-time
forecasting scenarios.
Experience from coupled 1–2D LISFLOOD-FP modelling
demonstrates that useful probabilistic forecasted inundation
maps can be created using a combination of parametrically
efficient DBM models to provide boundary conditions,
which are then used to draw from offline libraries of
previously calculated inundation scenarios. A variety of
colour coding and overlay methods can be applied to aid
clear and rapid communication of probabilistic informa-
tion. Clearly, a 2D inundation georeferenced map overlay
would provide an invaluable resource for operational real-
time flood management. These maps could for example be
transmitted and updated easily in real time to emergency
personnel equipped with GPS/PDAs or other readily avail-
able visualization technologies.
A potential drawback of the provision of probabilistic
information is a capacity to introduce confusion by present-
ing information in an inconsistent fashion from one model
or modelling approach to another. To address this issue,
much future research effort is being planned to develop
codes of best practice in uncertainty estimation and com-
munication with the intention of providing guidelines that
will advocate consistency across the flood risk management
discipline. Faulkner et al. (2007) present a roadmap out-
lining the issues and challenges to this end.
Acknowledgements
This research was carried out as part of RPA9 and SWP1 of
the Flood Risk Management Research Consortium
(FRMRC) phases 1 and 2. The principal sponsors of FRMRC
are: the Engineering and Physical Sciences Research Council
(EPSRC) in collaboration with the Environment Agency
(EA), the Northern Ireland Rivers Agency (DARDNI), the
United Kingdom Water Industry Research (UKWIR) Orga-
nisation, the Scottish Government (via SNIFFER), the Welsh
Assembly Government (WAG) through the auspices of the
Defra/EA, and the Office of Public Works (OPW) in the
Republic of Ireland. For details of the FRMRC, see http://
www.floodrisk.org.uk.
References
Aronica G., Bates P.D. & Horritt M.S. Assessing the uncertainty in
distributed model predictions using observed binary pattern
information within GLUE. Hydrolog Process 2002, 16, 2001–2016.
Figure 11 Deterministic depth map estimates for the January 2005 Carlisle flood event using observed peak flows. This figure can be compared with
Figures 9 and 10 to assess the performance of the coupled 1–2D 5-h ahead inundation probabilistic forecasting.
J Flood Risk Management 3 (2010) 140–150 c� 2010 The AuthorsJournal Compilation c� 2010 Blackwell Publishing Ltd
149Visualization approaches for communicating real-time flood forecasting

Beven K.J. Environmental modelling: an uncertain future? London:
Taylor & Francis, 2008.
Faulkner H., Parker D., Green C. & Beven K. Developing a
translational discourse to communicate uncertainty in flood
risk between science and the practitioner. AMBIO: J Hum
Environ 2007, 36, 692–704.
Hunter N.M., Horritt M.S., Bates P.D., Wilson M.D. & Werner
M.G.F. An adaptive time step solution for raster-based storage
cell modelling of floodplain inundation. Adv Water Resour
2005, 28, 975–991.
Kalman R.E. A new approach to linear filtering and prediction
problems. Trans. ASME J Basic Eng 1960, 82, 34–45.
McCarthy S., Tunstall S., Parker D., Faulkner H. & Howe J. Risk
communication in emergency response to a simulated extreme
flood. Environ Hazards 2007, 7, (3), 179–192.
Moore R.J. & Bell V.A. Comparison of rainfall-runoff models for
flood forecasting. Part 1: Literature review of models. R&D
Technical Report W241, CEH Project Number: C00260,
Environment Agency, Bristol, UK, 2001, 94pp.
Neal J.C., Bates P.D., Fewtrell T.J., Hunter N.M., Wilson M.D.
& Horritt M.S. Distributed whole city water level measurements
from the Carlisle 2005 urban flood event and comparison with
hydraulic model simulations. J Hydrol 2009, 368, 42–55.
Purvis M.J., Bates P.D. & Hayes C.M. A probabilistic
methodology to estimate future coastal flood risk due to
sea level rise. Coastal Eng 2008, 55, 1062–1073.
Romanowicz R. & Beven K. Estimation of flood inundation
probabilities as conditioned on event inundation maps.
Water Resour Res 2003, 39, 1073–1085.
Romanowicz R.J., Young P.C. & Beven K.J. Data assimilation
and adaptive forecasting of water levels in the river
Severn catchment, United Kingdom. Water Resour Res
2006, doi: 10.1029/2005WR004373
Spencer P., Boswell D., Davison I. & Lukey B. Flood Forecasting
using real time hydraulic and other models: lessons
from the Carlisle flood in January 2005. Defra Conference,
York, 2006.
Tufte E.R. The visual display of quantitative information. Cheshire,
CT: Graphics Press, 1984.
Tufte E.R. Envisioning information. Cheshire, CT: Graphics Press,
1990.
Young P. Data-based mechanistic modelling of environmental,
ecological, economic and engineering systems. Environ Model
Software 1998, 13, 105–122.
Young P.C. Advances in real-time flood forecasting. Phil Trans R
Soc A: Math, Phys Eng Sci 2002, 360, 1433–1450.
J Flood Risk Management 3 (2010) 140–150c� 2010 The AuthorsJournal Compilation c� 2010 Blackwell Publishing Ltd
150 Leedal et al.