visualization and user-modeling for browsing personal photo libraries
TRANSCRIPT

International Journal of Computer Vision 56(1/2), 109–130, 2004c© 2004 Kluwer Academic Publishers. Manufactured in The Netherlands.
Visualization and User-Modeling for Browsing Personal Photo Libraries
BABACK MOGHADDAMMitsubishi Electric Research Laboratories, Cambridge, MA 02139, USA
QI TIANBeckman Institute, University of Illinois, Urbana-Champaign, IL 61801, USA
NEAL LESH AND CHIA SHENMitsubishi Electric Research Laboratories, Cambridge, MA 02139, USA
THOMAS S. HUANGBeckman Institute, University of Illinois, Urbana-Champaign, IL 61801, USA
Received March 28, 2002; Revised July 21, 2003; Accepted July 21, 2003
Abstract. We present a user-centric system for visualization and layout for content-based image retrieval. Imagefeatures (visual and/or semantic) are used to display retrievals as thumbnails in a 2-D spatial layout or “configuration”which conveys all pair-wise mutual similarities. A graphical optimization technique is used to provide maximallyuncluttered and informative layouts. Moreover, a novel subspace feature weighting technique can be used to modify2-D layouts in a variety of context-dependent ways. An efficient computational technique for subspace weighting andre-estimation leads to a simple user-modeling framework whereby the system can learn to display query results basedon layout examples (or relevance feedback) provided by the user. The resulting retrieval, browsing and visualizationcan adapt to the user’s (time-varying) notions of content, context and preferences in style and interactive navigation.Monte Carlo simulations with machine-generated layouts as well as pilot user studies have demonstrated the abilityof this framework to model or “mimic” users, by automatically generating layouts according to their preferences.
Keywords: CBIR, visualization, subspace analysis, PCA, estimation
1. Introduction
Recent advances in technology have made it possi-ble to easily amass large collections of digital record-ings of our daily lives. These media offer oppor-tunities for new story sharing experiences beyondthe conventional digital photo album (Balabanovic
et al., 2000; Dietz and Leigh, 2001). The PersonalDigital Historian (PDH) project is an ongoing ef-fort to help people construct, organize, navigate,and share digital collections in an interactive multi-person conversational setting (Shen et al., 2001, 2003).The research in PDH is guided by the followingprinciples:

110 Moghaddam et al.
(1) The display device should enable natural face-to-face conversation—not forcing everyone to face inthe same direction (desktop) or at their own sepa-rate displays (hand-held devices).
(2) The physical sharing device must be convenientand customary to use—helping to make the com-puter disappear.
(3) Easy and fun to use across generations of users—minimizing time spent typing or formulatingqueries.
(4) Enabling interactive and exploratory storytelling—blending authoring and presentation.
Current software and hardware do not meet ourrequirements. Most existing software in this areaprovides users with either powerful query methods orauthoring tools. In the former case, the users can repeat-edly query their collections of digital content to retrieveinformation to show someone (Kang and Shneiderman,2000). In the latter case, a user experienced in the useof the authoring tool can carefully craft a story outof their digital content to show or send to someoneat a later time. Furthermore, current hardware is alsolacking. Desktop computers are not suitably designedfor group, face-to-face conversation in a social set-ting, while handheld story-telling devices have limitedscreen sizes and can be used only by a small numberof people at once. The objective of the PDH project isto take a step beyond.
The goal of PDH is to provide a new digital contentuser interface and management system enabling face-to-face causal exploration and visualization of digital
Figure 1. PDH table (a) An artistic rendering of the PDH table (designed by Ryan Bardsley, Tixel HCI www.tixel.net) and (b) the physicalPDH table.
contents. Unlike conventional desktop user interface,PDH is intended for multi-user collaborative applica-tions on single display groupware. PDH enables casualand exploratory retrieval, interaction with and visual-ization of digital contents.
We designed our system to work on a touch-sensitive, circular table-top display (Vernier et al.,2002), as shown in Fig. 1. The physical PDHtable, we use a standard tabletop with a top pro-jection (either ceiling mounted or tripod mounted)that displays on a standard whiteboard as shownin the right image of Fig. 1. We used two Mimio(www.mimio.com/meet/mimiomouse) styluses as theinput devices for first set of user experiments. Thelayout of the entire table-top display, as shown inFig. 2, consists of (1) a large story-space area encom-passing most of the table-top until the perimeter, and(2) one or more narrow arched control panels. Cur-rently, the present PDH table is implemented using ourDiamondSpin (www.merl.com/projects/diamondspin)circular table Java toolkit. DiamondSpin is intendedfor multi-user collaborative applications (Shen et al.,2002, 2003; Vernier et al., 2002).
The conceptual model of PDH was to focus on de-veloping content organization and retrieval metaphorsthat are easily understandable by users without dis-tracting from the conversation. We adopted a modelof organizing the materials using the four questionsessential to storytelling: who, when, where, and what(the four Ws). We do not currently support why, whichis also useful for storytelling. Control panels locatedon the perimeter of the table contain buttons labeled

Visualization and User-Modeling for Browsing Personal Photo Libraries 111
Figure 2. Close-up of “people-view” on the PDH table.
“people”, “calendar”, “location”, and “events”, corre-sponding to these four questions. When a user pressesthe “location” button, for example, the display on the ta-ble changes to show a map of the world. Every picturein the database that is annotated with a location willappear as a tiny thumbnail at its location. The usercan pan and zoom in on the map to a region of inter-est, which increase the size of the thumbnails. Simi-larly, by pressing one of the other three buttons, theuser can cause the pictures to be organized by thetime they were taken along a linear straight time-line, the people they contain, or the event keywordswith which the pictures were annotated. We assumethe pictures are partially annotated. Figure 3 showsan example of navigation of personal photo albumby the four Ws model. Adopting this model allowsusers to think of their documents in terms of howthey would like to record them as part of their his-tory collection, not necessarily in a specific hierar-
chical structure. The user can make selections amongthe four Ws and PDH will automatically combinethem to form rich Boolean queries implicitly for theuser (Shen et al., 2001, 2002, 2003; Vernier et al.,2002).
The PDH project combines and extends researchin largely two areas: (1) human-computer interaction(HCI) and interface (the design of the shared-displaydevices, user interface for story-telling and on-line au-thoring, and story-listening); (2) content-based infor-mation visualization, presentation and retrieval (user-guided image layout, data mining and summarization).Previous work in (Shen et al., 2001, 2002, 2003; Vernieret al., 2002) focused on the HCI and interface designissues of the first research area above. In this paper, wepresent our work for the second research area above.The proposed visualization and layout algorithms (Tianet al., 2001, 2002; Moghaddam et al., 2001, 2002)that can enhance informal storytelling using personal

112 Moghaddam et al.
Figure 3. An example of navigation by the four Ws model (Who, When, Where, What).
digital data such as photos, audio and video in a face-to-face social setting.
Due to the semantic gap (Smeulders et al., 2000),visualization is very important for user to navigate thecomplex query space. New visualization tools are re-quired to allow for user-dependent and goal-dependentchoices about what to display and how to provide feed-back. The query result has an inherent display dimen-sion that is often ignored. Most methods display im-ages in a 1-D list in order of decreasing similarity to thequery images. Enhancing the visualization of the queryresults is, however, a valuable tool in helping the user-navigating query space. Recently, other researchershave also explored towards content-based visualiza-tion (Horoike and Musha, 2000; Nakazato and Huang,2001; Santini and Jain 2000; Santini et al., 2001;Rubner, 1999). A common observation in Horoike andMusha (2000), Nakazato and Huang (2001), Santiniand Jain (2000), Santini et al. (2001), and Rubner(1999) is that the images are displayed in 2-D or 3-D
space from the projection of the high-dimensional fea-ture spaces. Images are placed in such a way thatdistances between images in 2-D or 3-D reflect theirdistances in the high-dimensional feature space. InHoroike and Musha (2000) and Nakazato and Huang(2001), the users can view large sets of images in2-D or 3-D space and user navigation is allowed. InNakazato and Huang (2001), Santini and Jain (2000),and Santini et al. (2001), the system allows user in-teraction on image location and forming new groups.In Santini and Jain (2000) and Santini et al. (2001),users can manipulate the projected distances betweenimages and learn from such a display. As is appar-ent from the query space framework, there is an abun-dance of information available for display. Our work inTian et al. (2001, 2002) and Moghaddam et al. (2001,2002) under the context of PDH shares many commonfeatures with the related work in Horoike and Musha(2000), Nakazato and Huang (2001), Santini and Jain(2000), Santini et al. (2001) and Rubner (1999).
Visualization and User-Modeling for Browsing Personal Photo Libraries 113
However, learning mechanism from display is notimplemented in Horoike and Musha (2000) and 3DMARS (Nakazato and Huang, 2001) is an extension toour work (Tian et al., 2001; Moghaddam et al., 2001)from 2-D to 3-D space. Our system differs from thework in (Rubner, 1999) is that we adopted differentmapping methods. Our work shares some features withthe work by Santini and Jain (2000) and Santini et al.(2001) except that our PDH system is currently beingincorporated into a much broader system for computerhuman guided navigating, browsing, archiving, and in-teractive story-telling with large photo libraries. Thepart of this system described in the remainder of thispaper is, however, specifically geared towards adap-tive user-modeling and relevance estimation and basedprimarily on visual features as opposed to semantic an-notation as in Santini and Jain (2000) and Santini et al.(2001).
The rest of paper is organized as follows. In Section2, we present designs for optimal (uncluttered) visu-alization and layout of images (or iconic data in gen-eral) in a 2-D display space for content-based imageretrieval (Tian et al., 2001; Moghaddam et al., 2001).In Section 3, we further provide a mathematical frame-work for user-modeling, which adapts and mimics theuser’s (possibly changing) preferences and style forinteraction, visualization and navigation (Moghaddamet al., 2002; Tian et al., 2002). Monte Carlo simulationsin Section 4 and pilot user studies in Section 5 havedemonstrated the ability of our framework to model or“mimic” users, by automatically generating layouts ac-cording to user’s preference. Finally discussion is givenin Section 6 and the conclusion in Section 7.
2. Visualization
With the advances in technology to capture, generate,transmit and store large amounts of digital imageryand video, research in content-based image retrieval(CBIR) has gained increasing attention. In CBIR, im-ages are indexed by their visual contents such as color,texture, etc. Many research efforts have addressed howto extract these low level features (Stricker and Orengo,1995; Smith and Chang, 1994; Zhou et al., 1999), eval-uate distance metrics (Santini and Jain, 1999; Popescuand Gader, 1998) for similarity measures and look forefficient searching schemes (Squire et al., 1999; Swetsand Weng, 1999).
In this section, we present a user-centric systemfor visualization and layout for content-based image
retrieval. Image features (visual and/or semantic) areused to display retrievals as thumbnails in a 2-D spatiallayout or “configuration” which conveys pair-wise mu-tual similarities. A graphical optimization technique isused to provide maximally uncluttered and informativelayouts. We should note that one physical instantiationof the PDH table is that of a roundtable, for which wehave in fact experimented with polar coordinate con-formal mappings for converting traditional rectangulardisplay screens. However, in the remainder of this pa-per, for purposes of ease of illustration and clarity, alllayouts and visualizations are shown on rectangulardisplays only.
2.1. Traditional Interfaces
The purpose of automatic content-based visualizationis augmenting the user’s understanding of large infor-mation spaces that cannot be perceived by traditionalsequential display (e.g. by rank order of visual simi-larities). The standard and commercially prevalent im-age management and browsing tools currently availableprimarily use tiled sequential displays—i.e. essentiallya simple 1-D similarity-based visualization.
However, the user quite often can benefit by havinga global view of a working subset of retrieved imagesin a way that reflects the relations between all pairsof images—i.e., N 2 measurements as opposed to onlyN . Moreover, even a narrow view of one’s immedi-ate surroundings defines “context” and can offer anindication on how to explore the dataset. The widerthis “visible” horizon, the more efficient the new querywill be formed. In Rubner (1999), Rubner proposeda 2-D display technique based on multi-dimensionalscaling (MDS) (Torgeson, 1958). A global 2D view ofthe images is achieved that reflects the mutual similar-ities among the retrieved images. MDS is a nonlineartransformation that minimizes the stress between highdimensional feature space and low dimensional dis-play space. However, MDS is rotation invariant, non-repeatable (non-unique), and often slow to implement.Most critically, MDS (as well as some of the other lead-ing nonlinear dimensionality reduction methods) pro-vide high-to-low-dimensional projection operators thatare not analytic or functional in form, but are rather de-fined on a point-by-point basis for each given dataset.This makes it very difficult to project a new datasetin a functionally consistent way (without having tobuild a post-hoc projection or interpolation functionfor the forward mapping each time). We feel that these

114 Moghaddam et al.
drawbacks make MDS (and other nonlinear methods)an unattractive option for real time browsing and visu-alization of high-dimensional data such as images.
2.2. Improved Layout and Visualization
We propose an alternative 2-D display scheme based onPrinciple Component Analysis (PCA) (Jolliffe, 1986).Moreover, a novel window display optimization tech-nique is proposed which provides a more perceptuallyintuitive, visually uncluttered and informative visual-ization of the retrieved images.
Traditional image retrieval systems display the re-turned images as a list, sorted by decreasing similar-ity to the query. The traditional display has one majordrawback. The images are ranked by similarity to thequery, and relevant images (as for example used in arelevance feedback scenario) can appear at separateand distant locations in the list. We propose an alterna-tive technique to MDS in Torgeson (1958) that displaysmutual similarities on a 2-D screen based on visual fea-tures extracted from images. The retrieved images aredisplayed not only in ranked order of similarity fromthe query but also according to their mutual similari-ties, so that similar images are grouped together ratherthan being scattered along the entire returned 1-D list.
2.3. Visual Features
We will first describe the low-level visual feature ex-traction used in our system. There are three visualfeatures used in our system: color moments (Strickerand Orengo, 1995), wavelet-based texture (Smith andChang, 1994), and water-filling edge-based structurefeature (Zhou et al., 1999). The color space we useis HSV because of its de-correlated coordinates andits perceptual uniformity (Stricker and Orengo, 1995).We extract the first three moments (mean, standard de-viation and skewness) from the three-color channelsand therefore have a color feature vector of length3 × 3 = 9.
For wavelet-based texture, the original image is fedinto a wavelet filter bank and is decomposed into 10de-correlated sub-bands. Each sub-band captures thecharacteristics of a certain scale and orientation of theoriginal image. For each sub-band, we extract the stan-dard deviation of the wavelet coefficients and thereforehave a texture feature vector of length 10.
For water-filling edge-based structure feature vec-tor, we first pass the original images through an edge
detector to generate their corresponding edge map. Weextract eighteen (18) elements from the edge maps,including max fill time, max fork count, etc. For a com-plete description of this edge feature vector, interestedreaders are referred to Zhou et al. (1999).
2.4. PCA Splats
To create such a 2-D layout, Principle ComponentAnalysis (PCA) (Jolliffe, 1986) is first performed onthe retrieved images to project the images from thehigh dimensional feature space to the 2-D screen. Im-age thumbnails are placed on the screen so that thescreen distances reflect as closely as possible the sim-ilarities between the images. If the computed similari-ties from the high dimensional feature space agree withour perception, and if the resulting feature dimensionreduction preserves these similarities reasonably well,then the resulting spatial display should be informativeand useful.
In our experiments, the 37 visual features (9 colormoments, 10 wavelet moments and 18 water-filling fea-tures) are pre-extracted from the image database andstored off-line. Any 37-dimensional feature vector foran image, when taken in context with other images,can be projected on to the 2-D {x, y} screen based onthe 1st two principal components normalized by the re-spective eigenvalues. Such a layout is denoted as a PCASplat. We implemented both linear and non-linear pro-jection methods using PCA and Kruskal’s algorithm(Torgeson, 1958). The projection using the non-linearmethod such as the Kruskal’s algorithm is an iterativeprocedure, slow to converge and converged to the localminima. Therefore the convergence largely depends onthe initial starting point and cannot be repeatable. Onthe contrary PCA has several advantages over nonlin-ear methods like MDS. It is a fast, efficient and uniquelinear transformation that achieves the maximum dis-tance preservation from the original high dimensionalfeature space to 2-D space among all possible lineartransformations (Jolliffe, 1986). The fact that it fails tomodel nonlinear mappings (which MDS succeeds at)is in our opinion a minor compromise given the ad-vantages of real-time, repeatable and mathematicallytractable linear projections.
Let us consider a scenario of a typical image-retrievalengine at work in which an actual user is providing rel-evance feedback for the purposes of query refinement.Figure 4 shows an example of the retrieved images bythe system (which resembles most traditional browsers

Visualization and User-Modeling for Browsing Personal Photo Libraries 115
Figure 4. Top 20 retrieved images (ranked top to bottom and left to right; query is shown first in the list).
in its 1D tile-based layout). The database is a collectionof 534 images. The 1st image (building) is the query.The other 9 relevant images are ranked in 2nd, 3rd, 4th,5th, 9th, 10th, 17th, 19th and 20th places, respectively.
Figure 5 shows an example of a PCA Splat for thetop 20 retrieved images shown in Fig. 4.1 In additionto visualization by layout, in this particular example,the sizes (alternatively contrast) of the images are de-termined by their visual similarity to the query. Thehigher the rank, the larger the size (or higher the con-trast). There is also a number next to each image inFig. 5 indicating its corresponding rank in Fig. 4. Theview of query image, i.e., the top left one in Fig. 4, isblocked by the images ranked 19th, 4th, and 17th inFig. 5. A better view is achieved in Fig. 8 after displayoptimization.
Clearly the relevant images are now better clusteredin this new layout as opposed to being dispersed alongthe tiled 1-D display in Fig. 4. Additionally, PCA Splatsconvey N 2 mutual distance measures relating all pair-wise similarities between images while the ranked 1-Ddisplay in Fig. 4 provides only N .
2.5. Display Optimization
However, one drawback of PCA Splat is that some im-ages can be partially or totally overlapped which makesit difficult to view all the images at the same time. Theoverlap will be even worse when the number of re-trieved images becomes larger, e.g. larger than 50. Tosolve the overlapping problem between the retrievedimages, a novel optimized technique is proposed inthis section.
Given the sets of the retrieved images and their cor-responding sizes and positions, our optimizer tries tofind a solution that places the images at the appropriatepositions while deviating as little as possible from theirinitial PCA Splat positions. Assume the number of im-ages is N . The image positions are represented by theircenter coordinates (xi , yi ), i = 1, . . . , N , and the initialimage positions are denoted as (xo
i , yoi ), i = 1, . . . , N .
The minimum and maximum coordinates of the 2-Dscreen are [xmin, xmax, ymin, ymax]. The image size isrepresented by its radius ri for simplicity, i = 1, . . . , Nand the maximum and minimum image size is rmax and

116 Moghaddam et al.
Figure 5. PCA Splat of top 20 retrieved images in Fig. 3.
rmin in radius, respectively. The initial image size is roi ,
i = 1, . . . , N .To minimize the overlap, one can move the images
away from each other to decrease the overlap betweenimages, but this will increase the deviation of the im-ages from their initial positions. Large deviation iscertainly undesirable because the initial positions pro-vide important information about mutual similaritiesbetween images. So there is a trade-off problem be-tween minimizing overlap and minimizing deviation.Without increasing the overall deviation, an alternativeway to minimize the overlap is to simply shrink the im-age size as needed, down to a minimum size limit. Theimage size will not be increased in the optimizationprocess because this will always increase the overlap.For this reason, the initial image size ro
i is assumed tobe rmax.
The total cost function is designed as a linear com-bination of the individual cost functions taking intoaccount two factors. The first factor is to keep the over-all overlap between the images on the screen as smallas possible. The second factor is to keep the overalldeviation from the initial position as small as possible.
J = F(p) + λ · S · G(p) (1)
where F(p) is the cost function of the overall overlapand G(p) is the cost function of the overall deviationfrom the initial image positions, S is a scaling factorwhich brings the range of G(p) to the same range ofF(p) and S is chosen to be (N − 1)/2. λ is a weightand λ ≥ 0. When λ is zero, the deviation of imagesis not considered in overlapping minimization. Whenλ is less than one, minimizing overall overlap is moreimportant than minimizing overall deviation, and viceversa for λ is greater than one.
The cost function of overall overlap is designed as
F(p) =N∑
i=1
N∑j=i+1
f (p) (2)
f (p) = 1 − e
− u2
σ f u > 0
0 u ≤ 0(3)
where u = ri + r j − √(xi − x j )2 + (yi − y j )2, u
is a measure of overlapping. When u ≤ 0, there isno overlap between the i th image and the j th im-age, thus the cost is 0. When u > 0, there is par-tial overlap between the i th image and the j th image.When u = 2 · rmax, the i th image and the j th image

Visualization and User-Modeling for Browsing Personal Photo Libraries 117
Figure 6. Cost function of overlap function f (p).
are totally overlapped. σ f is a curvature-controllingfactor.
Figure 6 shows the plot of f (p). With the increasingvalue of u(u > 0), the cost of overlap is also increasing.
From Fig. 6, σ f in Eq. (3) is calculated by settingT = 0.95 when u = rmax.
σ f = −u2
ln(1 − T )
∣∣∣∣u=rmax
(4)
The cost function of overall deviation is designed as
G(p) =N∑
i=1
g(p) (5)
g(p) = 1 − e− v2
σg (6)
where v = √(xi − xo
i )2 + (yi − yoi )2, v is the measure
of deviation of the i th image from its initial position.σg is a curvature-controlling factor. (xi , yi ) and (xo
i , yoi )
are the optimized and initial center coordinates of thei th image, respectively, i = 1, . . . , N .
Figure 7 shows the plot of g(p). With the increasingvalue of v, the cost of deviation is also increasing.
From Fig. 7, σg in Eq. (6) is calculated by settingT = 0.95 when v = maxsep. In our work, maxsep isset to be 2 · rmax.
σg = −v2
ln(1 − T )
∣∣∣∣v=maxsep
(7)
The optimization process is to minimize the totalcost J by finding a (locally) optimal set of size and im-age positions. The nonlinear optimization method wasimplemented by an iterative gradient descent method(with line search). Once converged, the images willbe redisplayed based on the new optimized sizes andpositions.
Figure 8 shows the optimized PCA Splats for Fig. 4.The image with a yellow frame is the query image inFig. 4. Clearly, the overlap is minimized while the rele-vant images are still close to each other to allow a globalview. With such a display, the user can see the relationsbetween the images, better understand how the queryperformed, and subsequently formulate future queriesmore naturally. Additionally, attributes such as con-trast and brightness can be used to convey rank. Wenote that this additional visual aid is essentially a 3rd

118 Moghaddam et al.
Figure 7. Cost function of function g(p).
dimension of information display. For example, imageswith higher rank could be displayed with larger size orincreased brightness to make them stand out from therest of the layout. An interesting example is to display“time” or “timeliness” by associating the size or bright-ness with how long ago the picture was taken, thusimages from the “past” would appear smaller or dim-mer than those taken recently. A full discussion of theresulting enhanced layouts is deferred to future work.
Also we should point out that despite our ability to“clean-up” layouts for maximal visibility with the opti-mizer we have designed, all subsequent figures in thispaper show Splats without any overlap minimizationsince for illustrating (as well as comparing) the accu-racy of the estimation results in subsequent sections theabsolute position was necessary and important.
3. Context and User-Modeling
Image content and “meaning” is ultimately based onsemantics. The user’s notion of content is a high-level
concept, which is quite often removed by many layersof abstraction from simple low-level visual features.Even near-exhaustive semantic (keyword) annotationscan never fully capture context-dependent notions ofcontent. The same image can “mean” a number of dif-ferent things depending on the particular circumstance.The visualization and browsing operation should beaware of which feature (visual and/or semantic) are rel-evant to the user’s current focus (or working set) andwhich should be ignored. In the space of all possiblefeatures for an image, this problem can be formulatedas a subspace identification or feature weighting tech-nique that is described fully in Section 3.1.
3.1. Estimation of Feature Weights
By user-modeling or “context awareness” we mean thatour system must be constantly aware of and adaptingto the changing concepts and preferences of the user.A typical example of this human-computer synergy ishaving the system learn from a user-generated layout

Visualization and User-Modeling for Browsing Personal Photo Libraries 119
Figure 8. Optimized PCA Splat of Fig. 4.
in order to visualize new examples based on identi-fied relevant/irrelevant features. In other words, designsmart browsers that “mimic” the user, and over-time,adapt to their style or preference for browsing and querydisplay. Given information from the layout, e.g., posi-tions and mutual distances between images, a novel fea-ture weight estimation scheme, noted as α-estimationis proposed, where α is a weighting vector for fea-ture e.g., color, texture and structure (and semantickeywords).
We now describe the subspace estimation of α forvisual features only, e.g., color, texture, and structure,although it should be understood that the features couldinclude visual, audio and semantic features or any hy-brid combination thereof.
In this case, the weighting vector is α= {αc, αt ,
αs}T , where αc is the weight for color, αt is the weightfor texture, and αs is the weight for structure. Thelengths of color, texture and structure features are Lc,
Lt , and Ls , respectively. The number of images in thepreferred clustering is N , and Xc is a Lc × N matrixwhere the i th column is the color feature vector of thei th image, i = 1, . . . , N , Xt is the Lt × N matrix, thei th column is the texture feature vector of the i th im-age, i = 1, . . . , N , and Xs is the Ls × N matrix, the i thcolumn is the structure feature vector of the i th image,i = 1, . . . , N . The distance, for example Euclidean-based between the i th image and the j th image, fori, j = 1, . . . , N , in the preferred clustering (distancein 2-D space) is di j . These weights αc, αt , αs are con-strained such that they always sum to 1.
We then define an energy term to minimize with anLp norm (with p = 2). This cost function is defined inEq. 8. It is a nonnegative quantity that indicates howwell mutual distances are preserved in going from theoriginal high dimensional feature space to 2-D space.Note that this cost function is similar to MDS stress, butunlike MDS, the minimization is seeking the optimal

120 Moghaddam et al.
feature weightsα. Moreover, the low-dimensional pro-jections in this case are already known. The optimalweighting parameter recovered is then used to weightoriginal feature-vectors before applying a PCA Splatwhich will result in the desired layout.
J =N∑
i=1
N∑j=1
{d p
i j −Lc∑
k=1
α pc
∣∣ X(k)c(i)
− X(k)c( j)
∣∣p
−Lt∑
k=1
αpt
∣∣ X(k)t(i) − X(k)
t( j)
∣∣p
−Ls∑
k=1
α ps
∣∣ X(k)s(i) − X(k)
s( j)
∣∣p
}2
(8)
The global minimum of this cost function correspond-ing to the optimal weight parameter α, is easily ob-tained using a constrained (non-negative) least-squaresas shown in Appendix A. We note that there is an alter-native approach to estimating the subspace weightingvector α in the sense of minimum deviation, which wehave called “deviation-based” α-estimation. The costfunction in this case is defined as follows:
J =N∑
i=1
∣∣p(i)(x, y) − p(i)(x, y)∣∣2
(9)
where p(i)(x, y) and p(i)(x, y) are the original and pro-jected 2-D locations of the i th image, respectively. Thisformulation is a more direct approach to estimationsince it deals with the final position of the images in thelayout. Unfortunately, however, this approach requiresthe simultaneous estimation of both the weight vectorsas well as the projection basis and consequently re-quires less-accurate iterative re-estimation techniques(as opposed to more robust closed-form solutions pos-sible with (8)). A full derivation of the solution for ourdeviation-based α estimation is shown in Appendix B.In all the experiments reported in this paper, we usedthe stress-based method (8) for α estimation.
We note that in principle it is possible to use a sin-gle weight for each dimension of the feature vector.However this would lead to a poorly determined es-timation problem since it is unlikely (and/or undesir-able) to have that many sample images from whichto estimate all individual weights. Even with plentyof examples (an over-determined system), chances arethat the estimated weights would generalize poorly toa new set of images—this is the same principle used in
a modeling or regression problem where the order ofthe model or number of free parameters should be lessthan the number of available observations. Therefore,the key reason for having fewer weights is to avoid theproblem of over-fitting and the subsequent poor gener-alization on new data. In this respect, the less weights(or more subspace “groupings”) there are, the betterthe generalization performance. Since the origin of all37 features is basically from 3 different (independent)visual attributes: color, texture and structure, it seemsprudent to use 3 weights corresponding to these 3 sub-spaces. Furthermore, this number is sufficiently smallto almost guarantee that we will always have enoughimages in one layout from which to estimate these 3weights.
Figure 9 shows a simple user layout where 3 carimages are clustered together despite their differentcolors. The same is performed with 3 flower images(despite their texture/structure). These two clustersmaintain a sizeable separation thus suggesting two sep-arate concept classes implicit by the user’s placement.Specifically, in this layout the user is clearly concernedwith the distinction between car and flower regardlessof color or other possible visual attributes.
Applying the α-estimation algorithm to Fig. 9, thefeature weights learned from this layout are αc =0.3729, αt = 0.5269 and αs = 0.1002. This shows thatthe most important feature in this case is texture andnot color, which is in accord with the concepts of carvs. flower as graphically indicated by the user in Fig. 9.
Now that we have the learned feature weights (ormodeled the user) what can we do with them? Fig-ure 10 shows an example of a typical application: au-tomatic layout of a larger (more complete data set) inthe style indicated by the user. Figure 10(a) shows thePCA splat using the learned feature weight for 18 carsand 19 flowers. It is obvious that the PCA splat us-ing the estimated weights captures the essence of theconfiguration layout in Fig. 9. Figure 10(b) shows aPCA splat of the same images but with a randomlygenerated α, denoting an arbitrary but coherent 2-Dlayout, which in this case, favors color (αc = 0.7629).This comparison reveals that proper feature weightingis an important factor in generating the user-desired andsensible layouts. We should point out that a randomα does not generate a random layout, but rather onethat is still coherent, displaying consistent groupingsor clustering. Here we have used such “random” lay-outs as substitutes for alternative (arbitrary) layouts thatare nevertheless “valid” (differing only in the relative

Visualization and User-Modeling for Browsing Personal Photo Libraries 121
Figure 9. An example of a user-guided layout.
Figure 10. PCA Splat on a larger set of images using (a) estimated weights and (b) arbitrary weights.
contribution of the 3 features to the final design of thelayout). Given the difficulty of obtaining hundreds (letalone thousands) of real user-layouts that are neededfor more complete statistical tests (such as those inthe next section), random α layouts are the only con-ceivable way of “simulating” a layout by a real user in
accordance with “familiar” visual criteria such as color,texture or structure.
Figure 11(a) shows an example of another lay-out. Figure 11(b) shows the corresponding computer-generated layout of the same images with their highdimensional feature vectors weighted by the estimated

122 Moghaddam et al.
Figure 11. (a) An example layout. Computer-generated layout based on (b) reconstruction using learned feature weights, and (c) the control(arbitrary weights).
α, which is recovered solely from the 2-D configura-tion of Fig. 11(a). In this instance the reconstruction ofthe layout is near perfect thus demonstrating that ourhigh-dimensional subspace feature weights can in factbe recovered from pure 2-D information. For compari-son, Fig. 11(c) shows the PCA Splat of the same imageswith their high dimensional feature vectors weighted bya random α.
Figure 12 shows another example of user-guided lay-out. Assume that the user is describing her family storyto a friend. In order not to disrupt the conversationflow, she only lays out a few photos from her personalphoto collections and expects the computer to gener-ate a similar and consistent layout for a larger set ofimages from the same collection. Figure 12(b) showsthe computer-generated layout based on the learnedfeature weights from the configuration of Fig. 12(a).The computer-generated layout is achieved using the
α-estimation scheme and post-linear, e.g., affine trans-form or non-linear transformations. Only the 37 visualfeatures (9 color moments (Stricker and Orengo, 1995),10 wavelet moments (Smith and Chang, 1994) and 18water-filling features (Zhou et al., 1995)) were usedfor this PCA Splat. Clearly the computer-generatedlayout is similar to the user layout with the visu-ally similar images positioned at the user-indicatedlocations. We should add that in this example nosemantic features (keywords) were used, but it isclear that their addition would only enhance such alayout.2
4. Statistical Analysis
Given the lack of sufficiently large (and willing) hu-man subjects, we undertook a Monte Carlo approach

Visualization and User-Modeling for Browsing Personal Photo Libraries 123
Figure 12. User-modeling for automatic layout. (a) a user-guided layout and (b) computer layout for larger set of photos (4 classes and 2 photosfrom each class).
to testing our user-modeling and estimation method.Thereby simulating 1000 computer generated layouts(representing ground-truth values of α’s), which weremeant to emulate 1000 actual user-layouts or prefer-ences. In each case, α-estimation was performed torecover the original values as best as possible. Notethat this recovery is only partially effective due to theinformation loss in projecting down to a 2-D space. Asa control, 1000 randomly generated feature weightswere used to see how well they could match the userlayouts (i.e., by chance alone).
Our primary test database consists of 142 imagesfrom the COREL database. It has 7 categories of car,bird, tiger, mountain, flower, church and airplane. Eachclass has about 20 images. Feature extraction basedon color, texture and structure has been done off-lineand pre-stored. Although we will be reporting on thistest data set—due to its common use and familiarityto the CBIR community—we should emphasize thatwe have also successfully tested our methodology onlarger and much more heterogeneous image libraries.For example: real personal photo collections of 500+images (including family, friends, vacations, etc.).
The following is the Monte Carlo procedure that wasused for testing the significance and validity of user-modeling with α-estimation:
1. Randomly select M images from the database. Gen-erate arbitrary (random) feature weights α in orderto simulate a “user” layout.
2. Do a PCA Splat using this “ground truth” α.3. From the resulting 2-D layout, estimate α and de-
noted the estimated α as α.
4. Select a new distinct (non-overlapping) set of Mimages from the database.
5. Do PCA Splats on the second set using the origi-nal α, the estimated α and a third random α′ (ascontrol).
6. Calculate the resulting stress in Eq. (8), and layoutdeviation (2-D position error) in Eq. (9) for the orig-inal, estimated and random (control) values ofα, α,and α′, respectively.
7. Repeat 1000 times.
The scatter-plot of α-estimation is shown in Fig. 13.Clearly there is a direct linear relationship between theoriginal weights α and the estimated weights α. Notethat when the original weight is very small (<0.1) orvery large (>0.9), the estimated weight is zero or onecorrespondingly. This means that when one particularfeature weight is very large (or very small), the corre-sponding feature will become the most dominant (orleast dominant) feature in the PCA, therefore the es-timated weight for this feature will be either 1 or 0.This “saturation” phenomenon in Fig. 13 is seen to oc-cur more prominently for the case of structure (lowerleft of the rightmost panel) that is possibly more pro-nounced because of the structure feature vector beingso (relatively) high-dimensional. Additionally, struc-ture features are not as well defined compared withcolor and texture (e.g., they have less discriminatingpower).
In terms of actual measures of stress and devia-tion we found that the α-estimation scheme yieldedthe smaller deviation 78.4% of the time and smallerstress 72.9%. The main reason these values are less

124 Moghaddam et al.
Figure 13. Scatter-plot of α-estimation: Estimated weights vs. original weights.
than 100% is due to the nature of the Monte Carlotesting and the fact that working with low-dimensional(2-D) spaces, random weights can be close to the origi-nal weights and hence can often generate similar “user”layouts (in this case apparently about 25% of the time).
We should add that an alternative “control” or nullhypothesis to that of random weights is that of fixedequal weights. This “weighting” scheme correspondsto the assumption that there are to be no preferentialbiases in the subspace of the features, that they shouldall count equally in forming the final layout (or de-fault PCA). In an identical set of experiments, replac-ing random weights for comparison layouts with equalweights α = { 1
3 , 13 , 1
3 }T , we found a similar distribu-tion of similarity scores. In particular, since positionalaccuracy is the most direct measure of layout effective-ness, we noted that the α-estimation scheme yieldedthe smaller deviation 72.6% of the time compared toequal weights (as opposed to the 78.4% compared withrandom weights). We therefore note that the results andconclusions of these experiments are consistent despitethe choice of equal or random controls and ultimatelydirect α-estimation of a “user” layout is best.
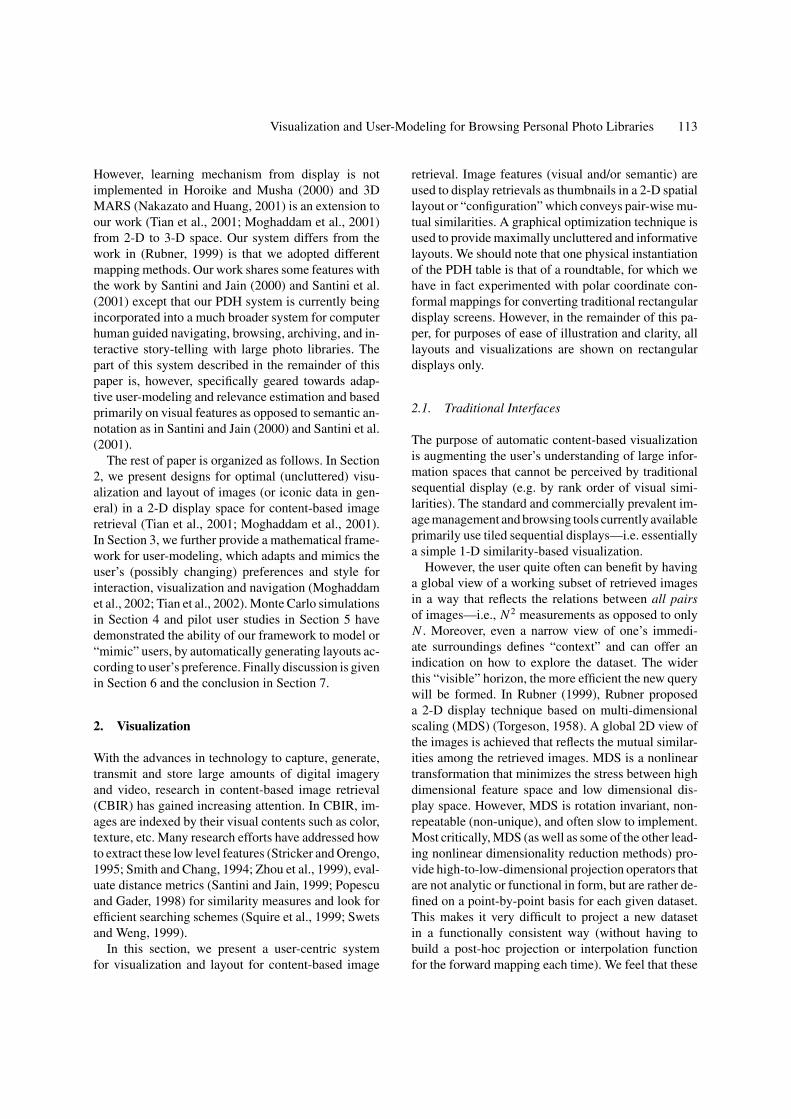
Another control other than random (or equal)weights is to compare the deviation of an α-estimationlayout generator to a simple scheme which assignseach new image to the 2-D location of its (un-weightedor equally weighted) 37-dimensional nearest-neighborfrom the set of images previously laid out by the “user”.This control scheme essentially operates on the prin-ciple that new images should be positioned on screenat the same location as their nearest neighbors in theoriginal 37-dimensional feature space (the default sim-ilarity measure in the absence of any prior bias) and
thus essentially ignores the operating subspace definedby the “user” in a 2-D layout.
The distributions of the outcomes of this MonteCarlo simulation are shown in Fig. 14 where we see thatthe layout deviation using α-estimation (red: mean =0.9691 std = 0.7776) was consistently lower—by al-most an order of magnitude—than the nearest neighborlayout approach (blue: mean = 7.5921, std = 2.6410).We note that despite the non-coincident overlap of thedistributions’ tails in Fig. 14, in every one of the 1000random trials the α-estimation deviation score wasfound to be smaller than that of nearest-neighbour (akey fact not visible in such a plot).
5. User Preference Study
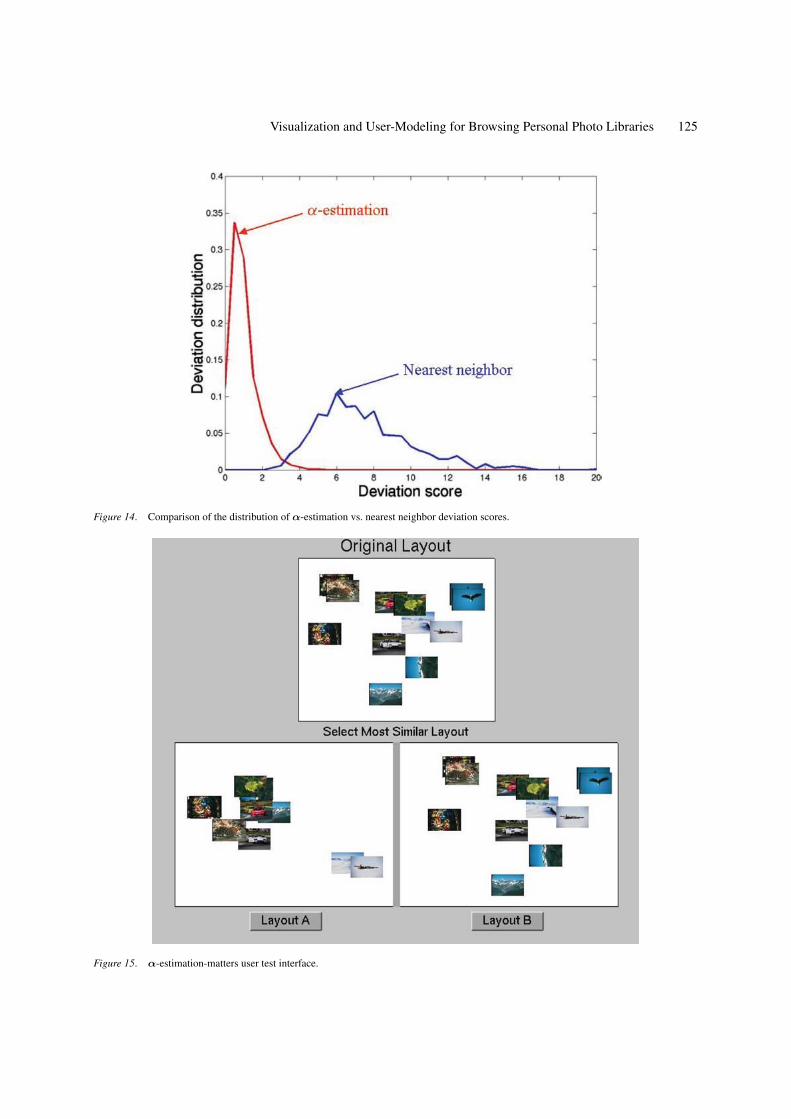
In addition to the computer-generated simulations, wehave in fact conducted a preliminary user study thathas also demonstrated the superior performance ofα-estimation over random feature weighting used asa control. The goal was to test whether the estimatedfeature weights would generate a better layout on anew but similar set of images than random weightings(used as control). The user interface is shown in Fig. 15where the top panel is a coherent layout generated by arandom α on reference image set. From this layout, anestimate of α was computed and used to redo the lay-out. A layout generated according to random weightswas also generated and used as a control. These twolayouts were then displayed in the bottom panels withrandomized (A vs. B) labels (in order to remove anybias in the presentation). The user’s task was to selectwhich layout (A or B) was more similar to the referencelayout in the top panel.
Visualization and User-Modeling for Browsing Personal Photo Libraries 125
Figure 14. Comparison of the distribution of α-estimation vs. nearest neighbor deviation scores.
Figure 15. α-estimation-matters user test interface.

126 Moghaddam et al.
Table 1. Results of user-preference study.
Preference for Preference for User’s consistencyestimates random weights rate
(%) (%) (%)
User 1 90 10 100
User 2 98 2 90
User 3 98 2 90
User 4 95 5 100
User 5 98 2 100
User 6 98 2 100
Average 96 4 97
In our experiment, 6 naıve users were instructed inthe basic operation of the interface and given the fol-lowing instructions: (1) both absolute and relative po-sitions of images matter, (2) in general, similar images,like cars, tigers, etc., should cluster and (3) the rel-ative positions of the clusters also matter. Each userperformed 50 forced-choice tests with no time limits.Each test set of 50 contained redundant (randomly re-occurring) tests in order to test the user’s consistency.
We specifically aimed at not “priming” the subjectswith very detailed instructions (such as “it’s not validto match a red car and a red flower because they areboth red”). In fact, the “naıve” test subjects were toldnothing at all about the 3 feature types (color, texture,structure), the associatedα or obviously the estimationtechnique. In this regard, the paucity of the instructionswas entirely intentional: whatever mental grouping thatseemed valid to them was the key. In fact, this very sameflexible association of the user is what was specificallytested for in the consistency part of the study.
Table 1 shows the results of this user-study. The av-erage preference indicated for the α-estimation-basedlayout was found to be 96% and an average consistencyrate of a user was 97%. We note that the α-estimationmethod of generating a layout in a similar “style” tothe reference was consistently favored by the users.A similar experimental study has shown this to alsobe true even if the test layouts consist of different im-ages than those used in the reference layout (i.e. similarbut not identical images from the same categories orclasses).
6. Discussion
There are several areas of future work. First, moreextensive user-layout studies are needed to replace
Monte Carlo simulations. It is critical to have realusers with different notions of content do layouts andto see if our system can model them. Moreover, wehave already integrated hybrid visual/semantic featureweighting which requires further testing with humansubjects.
We have designed our system with general CBIRin mind but more specifically for personalized photocollections. The final visualization and retrieval in-terface can be displayed on a computer screen,large panel projection screens, or—for example—onembedded tabletop devices (Shen et al., 2001, 2003),designed specifically for purposes of story-telling ormulti-person collaborative exploration of large imagelibraries.
We note that although the focus of this paper hasbeen on visual content analysis, the same framework forvisualization and user-modeling would apply to otherdata entities such as audio files, video clips, documents,or web pages, etc. The main difference would be thechoice of features used, their representations in high-dimensional spaces and the appropriate metrics.
7. Conclusion
In this paper, we proposed an optimized content-basedvisualization technique to generate a 2-D display of theretrieved images for content-based image retrieval. Webelieve that both the computational results and the pilotuser study support our claims of a more perceptuallyintuitive and informative visualization engine that notonly provides a better understanding of query retrievalsbut also aids in forming new queries.
The proposed content-based visualization methodcan be easily applied to project the images from high-dimensional feature space to a 3-D space for moreadvanced visualization and navigation. Features canbe multi-modal, expressing individual visual features,e.g., color alone, audio features and semantic features,e.g., keywords, or any combination of the above. Theproposed layout optimization technique is also a quitegeneral approach and can be applied to avoid over-lapping of any type of images, windows, frames andboxes. For the future work, relevance feedback can beachieved based on the visualization of the optimizedPCA Splat. By grouping the relevant images together,a new user-modeling technique will be proposed.
The PDH project is at its initial stage. We havejust begun our work in both the user interface designand photo visualization and layout algorithms. Many

Visualization and User-Modeling for Browsing Personal Photo Libraries 127
interesting questions still remain as our future researchin the area of content-based information visualizationand retrieval. The next task is to carry out an extendeduser-modeling study by having our system learn thefeature weights from various sample layouts providedby the user. We have already developed a frameworkto incorporate visual features with semantic labels forboth retrieval and layout. Incorporation of relevancefeedback in our framework seems very intuitive and iscurrently being explored. Another challenging area isautomatic “summarization” and display of large imagecollections. Since summarization is implicitly definedby user preference, α-estimation for user-modeling willplay a key role in this and other high-level tasks wherecontext is defined by the user.
Appendix A
A =
∑Ni=1
∑Nj=1 V c2
(i j)
∑Ni=1
∑Nj=1 V c
(i j)Vt
(i j)
∑Ni=1
∑Nj=1 V c
(i j)Vs
(i j)∑Ni=1
∑Nj=1 V c
(i j)Vt
(i j)
∑Ni=1
∑Nj=1 V t2
(i j)
∑Ni=1
∑Nj=1 V t
(i j)Vs
(i j)∑Ni=1
∑Nj=1 V c
(i j)Vs
(i j)
∑Ni=1
∑Nj=1 V t
(i j)Vs
(i j)
∑Ni=1
∑Nj=1 V s2
(i j)
β =
α pc
αpt
α ps
and b =
∑Ni=1
∑Nj=1 d2
i j Vc
(i j)∑Ni=1
∑Nj=1 d2
i j Vt
(i j)∑Ni=1
∑Nj=1 d2
i j Vs
(i j)
Define the following terms:
V c(i j) =
Lc∑k=1
∣∣X(k)c(i)
− X(k)t( j)
∣∣p(A.1)
V t(i j) =
Lt∑k=1
∣∣X(k)t(i) − X(k)
t( j)
∣∣p(A.2)
V s(i j) =
Ls∑k=1
∣∣X(k)s(i)
− X(k)s( j)
∣∣p(A.3)
and subsequently simplify Eq. (1) to:
J =N∑
i=1
N∑j=1
(d p
i j − α pc V c
(i j) − αpt V t
(i j) − α ps V s
(i j)
)2
(A.4)
To minimize J , we take the partial derivativesof J relative to α
pc , α
pt , α
ps and set them to zero,
respectively.
∂ J
∂αpc
= 0
∂ J
∂αpt
= 0 (A.5)
∂ J
∂αps
= 0
We thus have:N∑
i=1
N∑j=1
V c2
(i j) · α pc +
N∑i=1
N∑j=1
V c(i j)V
t(i j) · α
pt
+N∑
i=1
N∑j=1
V c(i j)V
s(i j) · α p
s =N∑
i=1
N∑j=1
d2i j V
c(i j) (A.6)
N∑i=1
N∑j=1
V c(i j)V
t(i j) · α p
c +N∑
i=1
N∑j=1
V t2
(i j) · αpt
+N∑
i=1
N∑j=1
V t(i j)V
s(i j) · α p
s =N∑
i=1
N∑j=1
d2i j V
t(i j) (A.7)
N∑i=1
N∑j=1
V c(i j)V
s(i j) · α p
c +N∑
i=1
N∑j=1
V t(i j)V
s(i j) · α
pt
+N∑
i=1
N∑j=1
V s2
(i j) · α ps =
N∑i=1
N∑j=1
d2i j V
s(i j) (A.8)
Using the following matrix/vector definitionsEquations (A.6–A.8) are easily simplified
A · β = b (A.9)
Subsequently β is obtained as a constrained (β > 0)linear least-squares solution of the above system. Theweighting vector α is then simply determined by thepth root of β where we typically use p = 2.
Appendix B
Let
Pi = p(i)(x, y) =( xi
yi
)and Pi = p(i)(x, y) =
( xi
yi
),
and Eq. (9) is rewritten as
J =N∑
i=1
||Pi−Pi||2 (B.1)
Let Xi be the column feature vector of the i th image,where
Xi =
X(i)c
X(i)t
X(i)s
, i = 1, . . . , N .

128 Moghaddam et al.
X(i)c , X(i)
t and X(i)s are the corresponding color, texture
and structure feature vector of the i th image and theirlengths are Lc, Lt and Ls , respectively. Let
X′i =
αcX(i)c
αtX(i)t
αsX(i)s
be the weighted high-dimensional feature vector. Theseweights αc, αt , αs are constrained such as they alwayssum to 1.
Pi is estimated by linearly projecting the weightedhigh-dimensional features to 2-D dimension. Let X =[X1, X2, . . . , XN], it is a L × N matrix, where L =Lc + Lt + Ls . Pi is estimated by
Pi = U T (X′i − Xm) i = 1, . . . , N (B.2)
where U is a L×2 projection matrix, Xm is a L×1 meancolumn vector of X′
i, i = 1, . . . , N . Substitute Pi byEq (B.2) into Eq. (B.1), the problem is therefore oneof seeking the optimal feature weights α, projectionmatrix U , and column vector Xm such as J in Eq. (B.3)is minimized, given Xi, Pi, i = 1, . . . , N .
J =N∑
i=1
||U T (X′i − Xm) − Pi ||2 (B.3)
In practice, it is almost impossible to estimate op-timal α, U and Xm simultaneously based on the lim-ited available data Xi , Pi , i = 1, . . . , N . We thus makesome modifications. Instead of estimatingα, U and Xm
simultaneously, we modified the estimation process tobe a two-step re-estimation procedure. We first esti-mate the projection matrix U and column vector Xm ,and then estimate feature weight vector α based on thecomputed U and Xm , and iterate until convergence.
Let U (0) be the eigenvectors corresponding to thelargest two eigenvalues of the covariance matrix of X,where X = [X1, X2, . . . , XN], X(0)
m be the mean vectorof X.
We have
P(0)i = (U (0))T
(Xi − X(0)
m
)(B.4)
P(0)i is the projected 2D coordinates of the un-
weighted high dimensional feature vector of the i thimage. Ideally its target location is Pi. To considerthe alignment correction, a rigid transform (Zwillinger,
1995) is applied.
P(0)i = A · P(0)
i + T (B.5)
where A is a 2 × 2 matrix and T is a 2 × 1 vector. A, Tare obtained by minimizing the L2-norm of Pi − P(0)
i .Therefore J in (B. 3) is modified to
J =N∑
i=1
∥∥AU (0)(X′
i − X(0)m
) − (Pi − T )∥∥2
(B.6)
Let U = AU (0), Xm = X(0)m and Pi = Pi − T , we
still have the form of Eq. (B.3).Let us rewrite
U T =[
U11, . . . U1(Lc+Lt +Ls )
U21, . . . , U2(Lc+Lt +Ls )
]
After some simplifications on Eq. (B.3), we have
J =N∑
i=1
‖αc Ai + αt Bi + αsCi − Di‖2 (B.7)
where
Ai =[∑Lc
k=1 U1k X(k)c (i)∑Lc
k=1 U2k X(k)c (i)
]
Bi =[∑Lt
k=1 U1(k+Lc) X(k)t (i)∑Lt
k=1 U2(k+Lt ) X(k)t (i)
]
Ci =[∑Ls
k=1 U1(k+Lc+Lt ) X(k)s (i)∑Ls
k=1 U2(k+Lc+Lt ) X(k)s (i)
]and Di = U T Xm + Pi ,
Ai , Bi , Ci and Di are the 2 × 1 feature vectors, respec-tively.
To minimize J , we take the partial derivatives of Jrelative to αc, αt , αs and set them to zero, respectively.
∂ J
∂αc= 0
∂ J
∂αt= 0 (B.8)
∂ J
∂αs= 0
We thus have:
E · α = f (B.9)

Visualization and User-Modeling for Browsing Personal Photo Libraries 129
where
E =
∑Ni=1 AT
i Ai∑N
i=1 ATi Bi
∑Ni=1 AT
i Ci∑Ni=1 BT
i Ai∑N
i=1 BTi Bi
∑Ni=1 BT
i Ci∑Ni=1 CT
i Ai∑N
i=1 CTi Bi
∑Ni=1 CT
i Ci
,
f =
∑Ni=1 AT
i Di∑Ni=1 BT
i Di∑Ni=1 CT
i Di
andα is obtained by solving the linear equations (B.9).
Acknowledgments
The authors would like to thank the reviewers fortheir valuable comments and suggestions. This workwas supported in part by Mitsubishi Electric ResearchLaboratories (MERL), Cambridge, MA and NationalScience Foundation Grants CDA 96-24396 and EIA99-75019.
Notes
1. High-resolution version of all the figures in this paper can befound at http://www.ifp.uiuc.edu/∼qitian/ijcv/.
2. In addition to using random weights as a control we have alsotested other default weighting schemes such as using equalweights, which have yielded similar benchmarking results. Never-theless, we have used random weighting in order to minimize anysystematic bias that might arise due to a deterministic weightingscheme.
References
Balabanovic, M., Chu, L., and Wolff, G. 2000. Storytelling with dig-ital photographs. In Proceedings of CHI2000, April. The Hague,The Netherlands.
Dietz, P. and Leigh, D. 2001. DiamondTouch: A multi-usertouch technology. In Proceedings of ACM UIST’01, Nov.,Orlando, FL.
Horoike, A. and Musha, Y. 2000. Similarity-based image retrievalsystem with 3-D visualization, In Proceedings of IEEE Int’lConf. on Multimedia and Expo, New York, vol. 2, pp. 769–772.
Jolliffe, I.T., Principal Component Analysis, Springer-Verlag,New York, 1986.
Kang, H. and Shneiderman, B. 2000. Visualization methods forpersonal photo collections: Browsing and searching in thephotofinder. In Proceedings of IEEE International Conference onMultimedia and Expo (ICME2000), New York City, New York.
Mimio, www.mimio.com/meet/mimiomouse.
Moghaddam, B., Tian, Q., and Huang, T.S. 2001. Spatial visualiza-tion for content-based image retrieval. In Proceedings of IEEEInternational Conference on Multimedia and Expo (ICME01),August 22–25, Tokyo, Japan.
Moghaddam, B., Tian, Q., Lesh, N., Shen, C., and Huang, T.S. 2002.PDH: A human-centric interface for image libraries. In Proceed-ings of IEEE International Conference on Multimedia and Expo(ICME02), Aug., vol. 1, pp. 901–904.
Nakazato, M. and Huang, T.S. 2001. 3D MARS: Immersive vir-tual reality for content-based image retrieval. In Proceedings ofIEEE Int’l Conf. on Multimedia and Expo, Aug. 22–25, Tokyo,Japan.
Popescu, M. and Gader, P. 1998. Image content retrieval from im-age databases using feature integration by choquet integral. SPIEConference Storage and Retrieval for Image and Video DatabasesVII, San Jose, CA.
Rubner, Y. 1999. Perceptual metrics for image database navigation.Ph.D. dissertation, Stanford University.
Santini, S., Gupta, A., and Jain, R. 2001. “Emergent semanticsthrough interaction in image databases,” IEEE Transactions onKnowledge and Data Engineering, 13(3):337–351.
Santini, S. and Jain, R. 1999. Similarity measures. IEEE Transactionson PAMI, 21(9):871–883.
Santini, S. and Jain, R. 2000. Integrated browsing and queryingfor image databases. IEEE Multimedia Magazine, July-SeptemberIssue, pp. 26–39.
Shen, C., Lesh, N., Moghaddam, B., Beardsley, P., and Bardsley,R. 2001. Personal digital historian: User interface design. In Pro-ceedings of Extended Abstract of CHI 2001. April, Seattle WA,pp. 29–30.
Shen, C., Lesh, N., Vernier, F., Forlines, C., and Frost, J. 2002.Sharing and Building Digital Group Histories. In ACM Con-ference on Computer Supported Cooperative Work (CSCW),Nov.
Shen, C., Lesh, N., and Vernier, F. 2003. Personal digital historian:Story sharing around the table. ACM Interactions, March/April2003 (also MERL TR2003–04).
Smeulders, A.W.M., Worring, M., Santini, S., Gupta, A., and Jain, R.2000. Content-based image retrieval at the end of the early years.IEEE Transactions on Pattern Analysis and Machine Intelligence,22(12):1349–1380.
Smith, J.R. and Chang, S.F. 1994. Transform features for textureclassification and discrimination in large image database. In Proc.IEEE Intl. Conf. on Image Proc., pp. 407–411.
Squire, D.M., Muller, H., and Muller, W. 1999. Improving responsetime by search pruning in a content-based image retrieval sys-tem, using inverted file techniques. In Proc. of IEEE Wrkshop onCBAIVL, June, pp. 45–49.
Stricker, M. and Orengo, M. 1995. Similarity of color Images.In Proc. SPIE Storage and Retrieval for Image and VideoDatabases.
Swets, D. and Weng, J. 1999. Hierarchical discriminant anal-ysis for image retrieval. IEEE Transactions on PAMI,21(5):386–401.
Tian, Q., Moghaddam, B., and Huang, T.S. 2001. Display optimiza-tion for image browsing. In 2nd International Workshop on Multi-media Databases and Image Communications (MDIC’01), Sept.17–18, 2001, Amalfi, Italy, pp. 167–173.
Tian, Q., Moghaddam, B., and Huang, T.S. 2002. Visualization,estimation and user-modeling for interactive browsing of image

130 Moghaddam et al.
libraries. International Conference on Image and Video Retrieval(CIVR’02), July 18–19, London, UK, pp. 7–16
Torgeson, W.S. 1958. Theory and Methods of Scaling. John Wileyand Sons: New York, NY.
Vernier, F., Lesh, N., and Shen, C. 2002 Visualization techniques forcircular tabletop interface. In Proceedings of AVI’02, May, Trento,Italy, pp. 257–266.
Zhou, S.X., Rui, Y., and Huang, T.S. 1999. Water-filling al-gorithm: A novel way for image feature extraction basedon edge maps. In Proc. IEEE Int’l. Conf. On Image Proc.,Japan.
Zwillinger, D. (Ed.). 1995. Affine Transformations, Section 4.3.2 inCRC Standard Mathematical Tables and Formulae. CRC Press:Boca Raton, FL, pp. 265–266.