visualization and analysis of scimago journal &...
TRANSCRIPT
1
Visualization and analysis of SCImago Journal & Country Rank structure via journal clustering Antonio J. Gómez-Núñez CSIC, SCImago Research Group Associated Unit. Faculty of Communication and Documentation, Granada, SPAIN. [email protected] Benjamín Vargas-Quesada CSIC, SCImago Research Group Associated Unit. Department of Information and Communication, Faculty of Communication and Documentation, University of Granada, Granada, SPAIN. [email protected] Zaida Chinchilla-Rodríguez CSIC, SCImago Research Group Associated Unit. CSIC, Institute of Public Goods and Policies, Madrid, SPAIN [email protected] Vladimir Batagelj University of Ljubljana, Faculty of Mathematics and Physics. Ljubljana, SLOVENIA. [email protected] Félix de Moya Anegón CSIC, SCImago Research Group Associated Unit. CSIC, Institute of Public Goods and Policies, Madrid, SPAIN [email protected]

2
Visualization and analysis of SCImago Journal & Country Rank structure via journal clustering
Abstract
Purpose
The objective was to visualize the structure of SCImago Journal & Country Rank (SJR) coverage of the extensive citation network of Scopus journals, examining this bibliometric portal through an alternative approach, applying clustering and visualization techniques to a combination of citation-based links.
Methodology
Three SJR journal-journal networks containing direct citation, co-citation and bibliographic coupling links are built. The three networks were then combined into a new one by summing up their values, which were later normalized through geo-normalization measure. Finally, the VOS clustering algorithm was executed and the journal clusters obtained were labeled using original SJR category tags and significant words from journal titles.
Findings
The resultant scientogram displays the SJR structure through a set of communities equivalent to SJR categories that represent the subject contents of the journals they cover. A higher level of aggregation by areas provides a broad view of the SJR structure, facilitating its analysis and visualization at the same time.
Value
This is the first study using Persson’s combination of most popular citation-based links (direct citation, co-citation and bibliographic coupling) in order to develop a scientogram based on Scopus journals from SJR. The integration of the three measures along with performance of the VOS community detection algorithm gave a balanced set of clusters. The resulting scientogram is useful for assessing and validating previous classifications as well as for information retrieval and domain analysis.
Keywords: Citation-based links; Classification; Clustering; Information Visualization; Scientograms; SCImago Journal & Country Rank

3
Introduction
Information visualization has emerged as a discipline of great interest at the crossroads of bibliometrics and scientometrics, providing multiple visual representations known as scientograms or science maps (Moya-Anegón et al., 2007). They can facilitate, for instance, the analysis of a scientific domain by depicting the structure of research output through a set of subject disciplines along with their relationships and interactions (Vargas-Quesada and Moya-Anegón, 2007). Generally, these maps are derived from the scientific literature included in academic databases by defining (1) a unit of analysis, such as papers, journals or categories, and (2) a unit of measure based on citation links (direct citation, co-citation, coupling), the text (title, abstract, addresses) or a combination of both. Apart from showing the disciplinary structure of science and research, scientograms enable one to explore the sequential evolution of research, identify research fronts, detect emerging or decadent topics, and find areas of interdisciplinary efforts.
The Web of Science (WoS) (Thomson Reuters, 2009) and Scopus (Elsevier, 2004) are currently held to be the top databases for academic and scientific information by the majority of research community, given their extensive coverage over disciplines and time. In addition to supplying detailed bibliographic information from a vast number of prestigious peer-reviewed journals from all over the world, both databases have citation indices that serve to develop numerous bibliometric indicators. These indicators, which can be qualitative or quantitative, are of great value in evaluating science and research, particularly for decision- and policy-makers. However, in developing and designing indicators and tools relying on scientific literature included in databases, a correct classification of publications is essential for arriving at consistent and reliable results.
Generating scientograms calls for the association and distribution of the items to be represented, which are mapped according to their influence, similarity or interactions with others. The degree of relatedness may be calculated in several ways, for instance, considering the co-occurrence of significant words from parts of the text (title, abstract, keywords…) or the number of shared references. Through statistical techniques such as clustering or factor analysis one can uncover interrelated subject groups, thereby perceiving a breakdown of scientific knowledge into different disciplines. The array of software for network visualization and analysis includes Pajek (Batagelj and Mrvar, 1997), Gephi (Bastian et al., 2009), Sci2 Tool (Sci2 Team, 2009) and VOSViewer (Van Eck and Waltman, 2010), featuring different clustering algorithms that decompose the network into several groups of strongly interrelated or similar items (sub-networks). Thus, visualization software is an effective solution for the refinement of literature classification in databases as well.
Clustering and Information Visualization
Among the diverse statistical and bibliometric techniques used for classification and visualization analysis we have factor analysis (Leydesdorff, 2006; Vargas-Quesada et al., 2008), reference analysis (Glänzel and Schubert, 2003; Archambault et al., 2011; Gómez-Núñez et al., 2011) and clustering. The latter has become very popular in studies of subject groups within citation or text networks. In the field of information visualization, clustering methods have been frequently used by researchers to delineate the structure of knowledge and research.

4
The classification scheme of different disciplines and/or sub-disciplines of scientific knowledge must be consistent and effective. As stated by Boyack and Klavans (2014) “science mapping, when reduced to its most basic components, is a combination of classification and visualization”. Some significant proposals involving clustering to build maps of science based on WoS and Scopus (Klavans and Boyack, 2009) aim to develop a consensual map of science derived from previously examined maps.
Many clustering experiments have been conducted on different levels of aggregation. At the document level, Small (1999a; 1999b) developed a hierarchical map of science through a method that combined fractional counting of cited documents, single- and complete-linkage clustering and two-dimensional ordination based on a geometric triangulation process. Ahlgren and Colliander (2009) tested the performance of the complete-linkage clustering method for visualizing and classifying a set of 43 documents of the journal ‘Information Retrieval’ according to several similarity measures based on document text, coupling and a hybrid approach. A combination of graphic presentations and clustering was also adopted by Boyack et al. (2011), yet they applied average-link clustering on several similarity matrices based on significant words extracted from the title, abstract and keywords of the Medical Subject Headings (MeSH) of over 2 million scientific articles gathered from the Medline database. More recently, Waltman and Van Eck (2012) employed a new multilevel clustering algorithm on a direct citation network comprising nearly 10 million publications in order to create an automatic classification from clusters detected. Boyack et al. (2013) introduced reference pair proximities to enhance the accuracy of traditional co-citation clustering, and verified the improvement by comparing their results with the traditional co-citation clustering approach. Later on, Boyack et al. (2014) classified a total of over 25 million articles from Scopus in four research levels, ranging from most applied to most basic science, adapting the earlier approach of Narin et al. (1976); by clustering documents on the basis of co-citation and bibliographic coupling links they generated a final map of science representing the average research level of all scientific disciplines.
Although some authors claim that there is a lower accuracy of subject classifications and science maps when journals are used as the unit of analysis (Gómez et al., 1996; Klavans and Boyack, 2010; 2016; Ruiz-Castillo and Waltman, 2015), numerous researchers have successfully applied clustering algorithms on journal matrices and networks of citation, co-citation and/or coupling. Rafols and Leydesdorff (2009) carried out a comparative analysis of four classification systems: two generated by indexers —that is, content-based— and two by means of automatic clustering algorithms decomposing the aggregated JCR journal-journal citation matrix. Next, Leydesdorff et al. (2011) applied the algorithm k-core to represent 25 specific categories in the Arts & Humanities Citation Index to then integrate the generated representation on a previously developed global map of science (Rafols et al., 2010). Leydesdorff and Rafols (2012) took a citation matrix consisting of 9,162 journals from the Science Citation Index Expanded of 2009 and developed interactive maps. They executed various clustering algorithms to detect groups of similar journals and put them into different well-defined clusters. Chang and Chen (2011) deployed the method of minimum span clustering (MSC) on a square citation matrix of approximately 1,600 journals of the Social Science Citation Index (SSCI). In an effort to analyze, validate, and improve classification schemes, various researchers from the Centre for Research & Development Monitoring

5
(Expertisecentrum Onderzoek en Ontwikkelingsmonitoring, ECOOM) in Katholieke Universiteit Leuven developed several studies involving information visualization techniques and different clustering algorithms —for instance, the Ward or Louvain Method (Blondel et al., 2008) executed on journal cross-citation and hybrid matrices (Janssens et al., 2009; Zhang et al., 2009). In one of these publications (Zhang et al., 2010) the same methodology was applied at the ISI category level, i.e. using a higher level of aggregation. Later, Börner et al. (2012) presented a methodology for designing and updating the map of science and the classification system constructed for the University of California, San Diego (UCSD) by applying clustering techniques on similarity matrices of journals from Web of Science (WoS) and Scopus.
In general, the implementation of clustering procedures on large networks and data matrices involves complex calculations and operations as well as high requirements for hardware and software. The visualization of the dataset must be clear enough to ensure understanding and facilitate handling. Computer programs such as Pajek or VOSViewer are considered excellent tools for the analysis and visualization of large datasets. In addition, these programs integrate clustering algorithms to classify the data analyzed. On the basis of their sound field record, we chose these two tools to carry out the representation of the structure of the Scopus database through VOS clustering and visualization algorithms (Waltman et al., 2010; Van Eck et al., 2010), using Pajek for prior data preparation and VOSViewer to create the final visualization. All the details of the process are explained in the Methodology section of this paper.
Objective
There are various proposals for constructing global maps representing the structure of science based on academic literature resulting from research activity, but no standard procedure prevails. There is likewise no consensus regarding the underlying classification processes. New approaches and proposals for studying and analyzing this phenomenon are therefore welcome.
Our aim was to enhance visualization of the structure of scientific knowledge harbored in the extensive citation network of Scopus journals included in the SCImago Journal & Country Rank (SJR). A combination of citation-based links, clustering and visualization techniques was used to build a journal scientogram that would be helpful for assessing and validating the results of an earlier research effort aimed at optimizing and updating SJR journal classification (Gómez-Núñez et al., 2014), as well as for information retrieval, evaluation and domain analysis. The combination of direct citation, co-citation and coupling was intended to merge the strengths of these three citation-based links in a single journal-journal network. By doing so, inherent weaknesses of each measure when used separately could be compensated. To the best of our knowledge, this study is the first attempt that adopts Persson’s combination of most popular citation-based links to develop a global scientogram based on Scopus journals from SJR. A further intention was to assess the reliability of our approach by comparing the scientogram generated with others created through previous research proposals, for instance using single or combined citation-based links between scientific journals or publications, running clustering algorithms and performing related visualization techniques.
Material
A two-year time window (2009-2010) covering the citation data from a total of 18,891 journals of the SJR portal (SCImago, 2007a) was designed. Information in the SJR is based on Scopus

6
data, so that it includes all the journals collected by the Scopus database, which makes it possible to develop output indicators for domain analysis and the rankings of both countries and journals (SCImago, 2007b). From this data set only citation occurring within the period 2000-2010 was counted. Citation links were first calculated at the level of items, and subsequently grouped by journals.
Methodology
Data processing and formatting
By using relational database management software and SQL, three journal networks formed by pairs of journals were built, with a numerical value indicating the degree of relatedness between every pair. Each network entails a different type of citation-based link, namely, direct citation, co-citation and bibliographic coupling. While direct citation refers to asymmetrical associations between two journals via a direct link, co-citation and coupling represent symmetrical associations by indirect links between pairs of journals being jointly cited (co-citation) or sharing references (bibliographic coupling). From this step onward, all calculations and operations were executed through Pajek software. Thus, according to Persson’s approach, the three networks were combined into a new one by summing up their values. The newly created network is made up of what Persson named Weighted Direct Citation (WDC) links (Persson, 2010). The process of integration of the three citation-based links as well as their interrelations can be better assimilated through the diagram designed by Persson and displayed below:
C
A B
D
Diagram 1: Persson’s scheme for combination of citation-based links Looking at this diagram, the link initially established between journals A and B through direct citation is additionally boosted by the fact that both journals share a reference to journal C (coupling link), and are jointly cited by journal D (co-citation link). Imagine that journal A cites journal B a total of 10 times, and they have 15 shared references to journals, and are simultaneously cited by 20 journals; then the value measuring the relatedness strength between the pair of journals A and B in the final WDC network would be 45.
However, a substantial modification from the original diagram is introduced so as to represent both the directions involved in direct citation links. In view of this diagram, and given that A, B, C and D are journals, integration of the three citation-based links could be expressed through the formula:

7
Formula 1: c_ij = ABC + DAB + max (AB,BA)
where ABC refers to journal coupling, DAB to journal co-citation and AB or BA to journal direct citation links.
As in Persson’s approach, we assume the three citation-based links are supplementary. However, the dissimilar range of values (of the scale) measuring the relatedness strength between journals in each citation-based link network might involve unequal weights and, consequently, different levels of influence of the citation-based links integrating the final WDC network. At any rate, a further normalization of the WDC network values will also prove useful for offsetting a potential imbalance. This is evidenced by the scientogram generated, which, from the standpoint of visualization, is in consensus with other proposals using citation-based links either separately or paired (see sections ‘Results’ and ‘Discussion and Conclusions’). The values from the resulting WDC network were therefore normalized using geo-normalization, a similarity measure close to Salton’s cosine; it divides elements of the matrix by the geometric mean of both diagonal elements (Batagelj and Mrvar, 2003). The formula used for the calculation is given below:
Formula 2:
VOS clustering performance
In addition to visualization functions, Pajek offers plenty of options and utilities, including clustering methods to generate consistent subject groups from data networks. Among others, the community detection algorithms of Louvain and VOS, which are hierarchical divisive algorithms working from the modularity function of Newman and Girvan (2004), can be found in Pajek. Several initial tests showed that community detection algorithms provided interesting and very similar results that outperformed other clustering solutions such as clustering with relational constraints or islands. Alternative tests with other clustering algorithms like k-means, single linkage and complete linkage were executed in R statistical software, but the results were not satisfactory: most of the distributions were skewed, with a few crowded journal clusters and an abundance of small clusters and singletons. Only the Ward method, likewise used in a related study (Gómez-Núñez et al., 2016) gave us acceptable results despite the generation of a couple of superclusters of journals. Therefore, on the basis of previous tests and because of their integration in Pajek and VOSViewer software, the VOS method algorithm was selected and run on the normalized journal network integrating the three citation-based links.
In the words of its developers (Waltman et al., 2010), the VOS clustering algorithm features a resolution parameter capable of detecting small size communities (generally used as a synonym of clusters) if an appropriate value of parameterization is provided. They also suggest that a higher resolution parameter implies a parallel increment of clusters given. Bearing in mind these considerations, several tests with different values in the resolution parameter of the algorithm were run. In this way, alternative solutions offering different decompositions of

8
the journal network, and subsequently producing different sets of communities, were generated. The final goal was to obtain a consistent classification system efficiently depicting the various fields of science and research from the scientific literature compiled by Scopus.
At this point, the variety of communities identified by the VOS algorithm had to be labeled. To do so, the tags of the original categories of SJR classification system were recycled, so that the number of links to SJR categories of journals being grouped was calculated for each community. Simultaneously, the link frequencies were transformed into percentages and tf-idf weights were assigned by adopting the formula previously designed by Salton and Buckley (1988) as follows:
Formula 3:
where wi,j, total weighted score; catfi,j, raw frequency of category ‘i’ into cluster ‘j’; N, total number of clusters; and clufi, number of clusters containing category ‘i’.
Finally, the categories were sorted according to tf-idf weights, while those amounting to at least 33% of the total set of cited categories were selected for delineating the topic of each community.
Due to their comprehensiveness and overlapping, original SJR categories termed as ‘miscellaneous’ or ‘multidisciplinary’ were discarded for labeling procedures. On occasion this led to the deletion of many links pointing to those categories, and therefore some communities needed to be labeled by recalculating percentages and tf-idf weights. Moreover, because of the repetition of exactly the same category tags in certain communities, some were labeled a posteriori by extracting significant terms from the titles of the journals encompassed. By using this mixed approach, the cluster-based subject structure obtained gave tags of well-established core categories from the SJR classification system on the one hand, and on the other hand, innovative and updated tags derived from text analysis of the journal titles. This would appear to be a reasonable and effective approach to ensure a balanced and dynamic subject structure.
Visualization of database structure
When executing VOS community detection algorithm in Pajek, (1) the normalized journal network and (2) the corresponding partition containing the final set of communities generated by VOS were exported to be read by VOSViewer software. Then, both files were loaded in VOSViewer; and finally, after fine-tuning some minor settings, the visualization process of the normalized network of journals integrating the three citation-based links could be performed.
Results
Generating a new classification of Scopus journals included in SJR platform
Table 1 shows the number of communities produced by the VOS algorithm with the resolution parameter values used in different tests. According to our classification purposes and taking into account the current number of categories in WoS and Scopus databases, a solution providing around 250-300 communities would effectively represent the structure of science.

9
Furthermore, the minimum community size should be no less than 10 journals in order to ensure subject grouping that defines a topic with acceptable consistency and uniformity. After analyzing the results of the different tests, the parameter resolution value 15 was deemed to be optimal for the development of the scientogram depicting the structure of Scopus, providing 270 communities with more than 10 journals (another 578 were below the threshold).
In the original classification of the SJR platform, a universe of 18,891 journals is distributed over a set of 308 subject categories. This means an average number of 61.33 journals per cluster in the SJR system. The new classification proposal based on VOSViewer algorithm with resolution parameter 15 and threshold 10 amounts to total of 17,729 journals spread over 270 communities, resulting in an average of 65.66 journals per cluster. It can be assumed that distribution of journals over categories is similar for the SJR and VOS systems. However, even though more than 1,000 journals are included in SJR system, the set of SJR categories is also larger than the VOS one, having 38 more categories. While this could favor a lower concentration of journals over categories under the SJR classification system, it was not actually the case in our experience. Distributions showing the ‘total number of clusters’, the ‘total number of classified journals’ and the ‘average number of journals’ per cluster over the different resolution parameters of VOS, above and below the threshold fixed for community size, can be seen in Table 1.
Total number of clusters
Total number of classified journals
Average number of journals per cluster
Median Standard Deviation
VOS VOS Threshold 10
VOS VOS Threshold 10
VOS VOS Threshold 10
VOS VOS Threshold 10
VOS VOS Threshold 10
Resolution Parameter
10 531 174 18,891 18,271 35.58 105.01 1 81.5 69.28 86.52
11 593 200 18,891 18,212 31.86 91.06 1 71 62.63 79.68 12 662 225 18,891 18,080 28.54 80.36 2 61 55.01 69.54 13 723 234 18,891 18,018 26.13 77.00 2 62 51.23 65.46 14 787 261 18,891 17,896 24.00 68.57 2 49 46.63 59.85 15 848 270 18,891 17,729 22.28 65.66 2 47 43.48 56.32 16 904 297 18,891 17,665 20.90 59.48 2 44 39.90 51.23 17 973 308 18,891 17,504 19.42 56.83 2 40 37.96 49.98 18 1,043 337 18,891 17,422 18.11 51.70 2 37 40.02 49.82 19 1,120 348 18,891 17,266 16.87 49.61 2 37 31.95 41.48 20 1,170 367 18,891 17,135 16.15 46.69 2 35 29.76 38.15
Table 1: Total number of clusters, total number of classified journals, average number of journals per cluster, median and standard deviation for VOS clustering with resolution parameter 10-20 (without and
with threshold 10)
Although the number of communities generated by the algorithm grows by increasing the value of the resolution parameter, when the threshold of 10 journals is applied as the

10
minimum cluster size, the number of clusters below the threshold (therefore, not useful for our purposes) increases as well. In other words, there is a positive correlation between the increase in the resolution parameter value and the increase in the number of clusters under the threshold. With regard to the number of assigned journals, VOSViewer’s developers state that all journals are assigned to a single community or group during the clustering procedure. Yet when the increase of the resolution parameter is compared to the total number of journals assigned to communities exceeding the threshold of 10, a negative correlation between the two variables is observed. Hence, the higher the resolution parameter value, the lower the number of clusters with more than 10 journals.
Before continuing, it is important to stress two important issues arising from the labeling process developed with our methodology. First, the use of SJR category tags resulted in the emergence of multiple communities named with exactly the same tags. This meant that several clusters had to be re-labeled by means of a textual component. In addition, all the possible combinations of SJR category tags among communities resulted in a number of tags that did not equal the final number of communities. Secondly, we should point out that the multi-assignation of journals is not derived from the algorithm performance itself, but is rather a consequence of our labeling process, which makes it possible to assign a journal to more than one category, causing some overlapping. As seen in Figure 1, journal multi-assignment is not too high: over 60% of journals were assigned to a single subject category; almost 30% were assigned to two categories; just over 9% to three categories; and a residual percentage of journals were assigned to four categories.
Figure 1: Journal multi-assignment in VOS classification solution
The final journal assignment from the proposed methodology can be found at the following link: http://www.ugr.es/~benjamin/vos15_classification.pdf
10732
5250
1646
101 0
2000
4000
6000
8000
10000
12000
1 2 3 4
Num
ber o
f Jou
rnal
s
Number of Categories
VOS Resol. Param. 15
11
The challenge of validating cluster solutions based on a comparison of different types of citation links —namely, direct citation, co-citation and coupling— has been faced in the past (Klavans and Boyack, 2006; Boyack and Klavans, 2010; Klavans and Boyack, 2016). Still, further analysis and evidence is needed to identify the most accurate citation-based link proposal. The complementary approach integrating three citation-based links appears to lead towards a more balanced and complete clustering and visualization solution, bridging the strengths and specificities of each of the most popular citation-based links. Moreover, the use of three citation-based links should improve the “partial perspective” of journal relatedness obtained when only direct citation (Wang and Waltman, 2016) or any other relatedness measure between journals is used alone.
An initial assessment of our classification results was made by comparing the journal classification at category level with other existing journal classifications, such as JCR and SJR subject categories. This would allow us to validate the VOS-based journal classification against the well-established and endorsed classification of JCR and the original classification of the SJR platform. A ranking of top-20 categories of JCR, SJR and VOS in relation to the number of journals assigned, both in raw data and percentage-wise (calculated taking into account journal overlap) revealed similar distributions, especially between JCR and VOS, as well as a coincidence of 8 categories out of the 20 for the three systems (Gómez-Núñez et al., 2014).
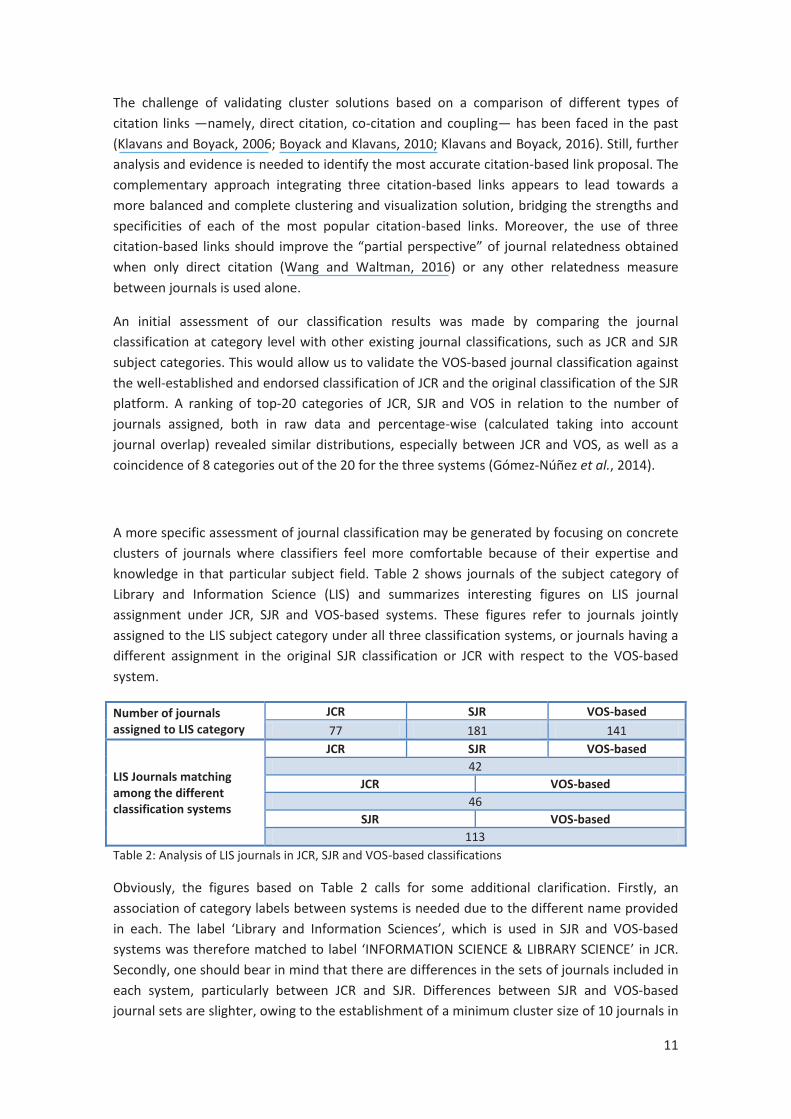
A more specific assessment of journal classification may be generated by focusing on concrete clusters of journals where classifiers feel more comfortable because of their expertise and knowledge in that particular subject field. Table 2 shows journals of the subject category of Library and Information Science (LIS) and summarizes interesting figures on LIS journal assignment under JCR, SJR and VOS-based systems. These figures refer to journals jointly assigned to the LIS subject category under all three classification systems, or journals having a different assignment in the original SJR classification or JCR with respect to the VOS-based system.
Number of journals assigned to LIS category
JCR SJR VOS-based 77 181 141
LIS Journals matching among the different classification systems
JCR SJR VOS-based 42
JCR VOS-based 46
SJR VOS-based 113
Table 2: Analysis of LIS journals in JCR, SJR and VOS-based classifications
Obviously, the figures based on Table 2 calls for some additional clarification. Firstly, an association of category labels between systems is needed due to the different name provided in each. The label ‘Library and Information Sciences’, which is used in SJR and VOS-based systems was therefore matched to label ‘INFORMATION SCIENCE & LIBRARY SCIENCE’ in JCR. Secondly, one should bear in mind that there are differences in the sets of journals included in each system, particularly between JCR and SJR. Differences between SJR and VOS-based journal sets are slighter, owing to the establishment of a minimum cluster size of 10 journals in

12
the VOS-based system. This gave rise to a reduction of more than 1,000 journals through the classification process performed. Finally, it should be stressed that the three classification systems allow for journal multi-assignment, that is, journals included in several subject categories at the same time. Matching LIS journals among systems obeyed the reasoning that journals are assigned to the LIS category in all cases regardless of whether they are also assigned to any other category.
Despite the different sizes of the sets of journals attributed to the category of LIS in each system, it is seen that matching leaves 42 journals, meaning that almost 55% of LIS journals from JCR are also assigned to the same category in SJR and VOS-based systems. The list takes in well-known and representative journals of LIS, such as ‘Information Research’, ‘Journal of Documentation’, ‘Library and Information Science Research’, ‘Scientometrics’, ‘Journal of the American Society for Information Science and Technology’, ‘Journal of Information Science’, ‘Research Evaluation’, ‘Library Trends’, ‘Aslib Proceedings’, etc.
A comparison of journal assignment to the LIS category in SJR and VOS-based systems gives even more interesting results since the sets of journals are quite similar. From the 181 journals assigned to the LIS category in SJR, a total of 113 are included in the LIS category of the VOS-based system as well. Accordingly, over 62% of these journals are classified under the same subject category. This figure is more significant if we consider that 19 of the 49 journals not appearing in the LIS category from the VOS-based system were excluded from the classification process because of the threshold defined for minimum cluster size. Once again, the most representative journals are present in the LIS categories of SJR and VOS-based systems. A striking example of new journal classification refers is seen, for instance, with ‘Jounal of Informetrics’, which is simultaneously classified under SJR categories of Statistics and Probability, Computer Science Applications, Management Science and Operations Research, Applied Mathematics, and Modeling and Simulation; while it is only assigned to the LIS subject category in the VOS-based system.
Analyzing and mapping the structure of Scopus
The alternative approach proposed for assessing the journal classification results, which is also the main focus of this research, is based on the elaboration of a scientogram using the VOS algorithm for clustering, and visualizing a journal-journal network built on a combination of citation-based links between Scopus journals included in the SJR platform.
From the perspective of information visualization and taking into account the logical limitations of our bi-dimensional space, (1) an overall analysis of the whole scientogram depicting the community-based classification system will be undertaken together with (2) a brief study of some disciplines easily identified with the naked eye. We must recall that the final scientogram comprises a total of 17,729 SJR journals after discarding the other 1,162 journals below the fixed threshold. This set of journals will have to be classified a posteriori using a different method such as reference analysis or ‘sibling journals’, where the new categories inherited by journals will be assigned to those outside the set but formerly in the same subject category. Likewise, the initial 848 communities obtained were finally reduced to 270.

13
The scientogram in Figure 2 shows how the journals of the SJR database are clustered on the basis of their citation, co-citation and coupling links. The size of the spheres (denoting journals) and their labels are proportional to their relation or interaction with the rest. The greater the interaction, the larger the size. The color of a sphere indicates the community (category) to which each journal was ascribed by the VOS algorithm. The scientogram developed after VOS clustering is governed by the principles of visualization of VOS, which can be thought of as an enhanced MDS (Multidimensional Scaling), balanced by weights and adjacencies to alleviate the two main drawbacks of MDS: (1) its tendency to place the most important items in the center of the picture, and (2) a propensity to create circular representations (Van Eck et al., 2010). This is achieved by equating the closeness among items to the inverse of their similarities, while their weights are equivalent to their similarities.
Figure 2: Scientogram of SJR journals This map can be seen in high resolution at: http://www.ugr.es/local/benjamin/Figure2.tif
As mentioned earlier, by examining the scientogram one can distinguish different groups of journals ascribed to communities reflected by a particular color. Each community represents a subject category, which at the same time may be included in a higher level of aggregation, that is, a subject area. Due to space limitations and to enhance visualization, the journal labels are removed and SJR subject area labels are introduced to offer a clear, well-structured view of SJR knowledge organization based on the academic journals compiled. Figure 3 displays 24 subject areas for the SJR database. All labels are roughly placed in the dense parts of the maps grouping several communities.

14
Figure 3: Scientogram of the 24 SJR subject areas identified http://www.ugr.es/local/benjamin/Figure3.tif
Around the lower left-hand side of the scientogram we find a sort of light-brown horn where journals of ‘Mathematics’ are aggregated. Proceeding clockwise (on the left), journals of ‘Physics and Astronomy’, are followed by journals of categories strongly related to Physics and Chemistry, such as ‘Materials Science’ ‘Chemical Engineering’ or ‘Energy’. The latter borders on ‘Earth and Planetary Sciences’ to the right, and ‘Environmental Sciences’ just above. Proceeding upward, journals of ‘Agricultural and Biological Sciences’ under ‘Chemistry’ (on the left) and ‘Veterinary’ (on the right) are identified. Just above this we find journals of the area ‘Pharmacology, Toxicology and Pharmaceutics”. Moving toward the top of this scientogram, scientific areas related to biomedical and allied sciences are detected, for instance, ‘Biochemistry, Genetics, and Molecular Biology’ and ‘Dentistry’, with ‘Immunology and Microbiology’ and ‘Medicine’ crowning the scientogram. From here, going down again clockwise, it is easy to identify the ‘Neuroscience’ area followed by ‘Nursing’ and ‘Psychology’, which bridges directly over to ‘Social Sciences’ journals. The bottom part of the scientogram harbors journals of the category ‘Arts and Humanities’ in the other horn-shape appearing on the right side. Between the two horns and moving from right to left, we come across journals of three interdisciplinary areas, namely, ‘Economics, Econometrics and Finance’, ‘Business, Management and Account’ and ‘Decision Sciences’. Finally, the journals of ‘Computer Sciences’ appear next to journals of ‘Mathematics’, the starting point of this circular visual tour.
Having completed this overall analysis, a focus on some specific categories or communities is called for. For instance, Figure 4 clearly shows how mathematics journals are located and aggregated according to their citation-based links. Looking carefully, we spot basic and general

15
mathematics journals at the bottom, in light brown color. Then, ascending along the horn, ‘Applied Mathematics’ journals appear in light blue and purple, just interacting with journals of the areas ‘Physics and Astronomy’ on the left and ‘Computer Sciences’ on the right.
Figure 4: SJR Mathematics journals http://www.ugr.es/local/benjamin/Figure4.tif
Other disciplines, such as Library & Information Sciences (LIS), do not constitute such a cohesive and well-defined community as the one depicted for Mathematics. In Figure 5 some of the core journals of LIS category appear relatively disperse in red color; this was done by zooming in the map, to progressively descend and reduce the aggregation level until finding particular journals. Thus, mainly interrelating with journals of ‘Business, Management and Accounting’ we find the LIS journals Annual Review of Information Science and Technology, Scientometrics, Journal of the American Society for Information Science and Technology, El Profesional de la Información, Cybermetrics, Journal of Information Science, Online Information Review, Information Research, Electronic Library, Informing Science, Liber Quarterly, Serials Review, etc. These journals are also close to the areas of ‘Economics, Econometrics and Finance’ and ‘Social Sciences’.

16
Figure 5: SJR Library and Information Science journals http://www.ugr.es/local/benjamin/Figure5.tif
The dispersion of LIS journals is primarily due to the high degree of interdisciplinarity of journals in the field, dealing with a wide variety of topics and, therefore, having broad and diversified subject coverage. In other words, these journals publish research works that belong to different scientific disciplines in the same subject area. From the standpoint of information visualization, this makes journals of LIS appear relatively near ‘Computer Sciences’, ‘Business, Management and Accounting’, or ‘Social Sciences’. The divisive effect of journals from certain disciplines is accentuated by the requirement to represent scientograms in two dimensions (2D), as they are ultimately visualized on a static computer screen or a sheet of paper. This makes the depth dimension (Z) disappear, leaving disciplines separated. In a three dimensional (3D) scientogram they would be situated together or even interwoven.
Discussion and Conclusions
This study aspired to align classification and visualization and, more concretely, to endorse information visualization as a useful tool not only for information retrieval, evaluation and domain analysis, but also for supporting and supplementing classification. Accordingly, the methodological proposal presented in this study promotes the construction of:
1. A newly updated SJR classification scheme, improved in terms of a smoother distribution of journals over categories, thereby providing a lower concentration of journals in the categories (communities) having greater power of attraction, or in other words, with a higher influence or capacity to include journals. In a previous paper (Gómez-Núñez et al., 2011) based on an iterative process of reference analysis cited by the SJR journals, just five

17
categories were sufficient to bring together 25% of 14,166 classified journals. Now, with the new classification system, at least 19 categories are needed to accumulate just over 25% of the classified journals. Taking into account that the number of journals here is substantially higher (17,729), this factor is of great importance. The wide margin could have favored a higher concentration of journals in the categories with the highest power of attraction, but this does not actually occur in the new classification system.
2. A scientogram or map of science based on SJR journals and their subsequent subject assignment derived from applying VOS community detection clustering. Despite various differences in the data set, methodology and techniques used in our proposal, there is considerable resemblance between this scientogram and those of Moya-Anegón et al. (2007) or Leydesdorff et al. (2015a; 2015b). Indeed, the scientogram shape, like a croissant, was evoked by Leydesdorff et al. (2013), who asserted that “this croissant-like structure also accords with Klavans and Boyack’s (2009) conclusion that a consensus has increasingly emerged regarding the shape of journal maps based on aggregated citations”. Once more, Klavans and Boyack’s research (2010) is useful for validating our scientogram by pointing out that “researchers have, from the beginning, sought to show that their maps are accurate in the sense that they correspond with reality”. According to their view, coherent relationships established between journals and subject clusters, as detected in our scientogram, can be used as a qualitative means of self-validation.
In light of both the classification and the visualization results presented here, it seems clear that Persson’s combination of citation-based links, i.e. Weighted Direct Citation, stands as a useful alternative unit of measure to generate, improve or update classification systems or scientograms based on journals or other distinct aggregation levels. Following this approach, the particular strengths and weakness of each measure are drawn into the WDC, and the weaknesses can be dealt with. In our opinion, this combination provides a fairer and more balanced approach, lending itself to offset the disadvantages and supplement the advantages of the three citation-based links while providing a more comprehensive perspective of journal relatedness. The higher number of variables ensures a richer and broader comparison. We also strongly believe this approach helps maximize the cluster effect among the final set of communities detected, creating more cohesive and distinctive subject communities.
Although most communities detected represent solid groups of allied journals thematically related in the scientogram, it is also true that particular disciplines such as ‘Library & Information Sciences’ (LIS) do not constitute a cohesive or well-defined community. This can be explained by the high degree of interdisciplinarity of the corresponding journals and the broad variety of topics covered. One means of overcoming such a flaw in performance would be to classify according to a finer unit of analysis, e.g. articles instead journals, as suggested by some authors (Gómez et al., 1996; Klavans and Boyack, 2010; 2016; Ruiz-Castillo and Waltman, 2015). It does not imply that journal classification is unhelpful, only that it depends on the purpose of the final classification carried out.
In the process of aggregating journals within the SJR subject areas displayed in the map we detected some communities representing SJR categories that could be placed either in a different location of the two-level (area-category) classification hierarchy, or in two locations at once. This happens, for instance, with journals of highly interdisciplinary areas, such as

18
‘Engineering’, widely spread over the map and interacting with journals on Computer Sciences, Chemistry, Medicine, Business, Environment, etc. Something similar is seen for LIS journals, presently occupying the Social Sciences area of SJR, though some of the core journals of this category appear under the area of ‘Business, Management and Accounting’ on the map.
In sum, it can be concluded that information visualization is a very powerful tool for analysis, assessment and validation of results supporting a classification. Visualization alone, however, cannot and should not be used as a tool, since the multidisciplinarity and interdisciplinarity of the units being represented, together with the limitations of a two-dimensional space like a paper sheet or a computer screen, will cause distortion of the results. Therefore, just as we proceeded here, the development of traditional classification schemes should be supported and validated by means of information visualization techniques. In the opposite sense, the complementarity of classification and visualization is underlined by Leydesdorff et al. (2016), who recommends that classifications be associated with maps of science at different levels of granularity, so as to allow browsing from the highest level of aggregation (fields of science) to the lowest one (journals) by zooming in the map.
As a final thought, we propose that further research might adopt a similar approach, combining the three citation-based links used in this work, but previously assigning weights to balance a potential asymmetry or greater influence of any of the three. In normalizing the combined journal-journal network, the use of new similarity measures between journals could prove beneficial. Accurate measures to validate both the classifications and the scientograms generated would be a valuable asset to consolidate the methodological approach presented here.
Bibliographic References
Ahlgren, P., and Colliander, C. (2009). “Document–document similarity approaches and science mapping: Experimental comparison of five approaches”. Journal of Informetrics, Vol. 3 No. 1, pp. 49–63.
Archambault, E., Beauchesne, O. H., and Caruso, J. (2011). “Towards a multilingual, comprehensive and open scientific journal ontology”, in E.C. M. Noyons, P. Ngulube and J. Leta (Eds.), ISSI 2011, Proceedings of the 13th International Conference of the International Society for Scientometrics and Informetrics in Durban, South Africa, 2011, pp. 66–77.
Bastian M., Heymann S., Jacomy M. (2009). “Gephi: an open source software for exploring and manipulating networks”. International AAAI Conference on Weblogs and Social Media.
Batagelj, V., and Mrvar, A. (2003).”Density based approaches to network analysis: Analysis of Reuters terror news network”. http://www.cs.cmu.edu/~dunja/LinkKDD2003/papers/Batagelj.pdf. Accessed 15-12-2015.
Batagelj, V., and Mrvar, A. (1997). “Program Package Pajek/Pajek-XXL”. http://mrvar.fdv.uni-lj.si/pajek/. Accessed 15-12-2015.

19
Blondel, V.D., Guillaume, J.L., Lambiotte, R., and Lefebvre, E. (2008). “Fast unfolding of communities in large networks”. Journal of Statistical Mechanics: Theory and Experiment, P10008.
Börner, K., Klavans, R., Patek, M., Zoss, A.M., Biberstine, J.R., Light, R.P., Larivière, V., and Boyack, K.W. (2012). “Design and update of a classification system: The UCSD map of science”. PloS ONE, Vol. 7 No. 7, e39464.
Boyack, K.W., and Klavans, R. (2010). “Co-Citation analysis, bibliographic coupling, and direct citation: Which citation approach represents the research front most accurately?” Journal of the American Society for Information Science and Technology, Vol. 61 No. 12, pp. 2389–2404.
Boyack, K.W., Patek, M., Ungar, L.H., Yoon, P., and Klavans, R. (2014). “Classification of individual articles from all of science by research level”. Journal of Informetrics, Vol. 8 No. 1, pp. 1–12.
Boyack, K.W., Newman, D., Duhon, R.J., Klavans, R., Patek, M., Biberstine, J.R., Schijvenaars, B., Skupin, A., Ma, N., and Börner, K. (2011). “Clustering more than two million biomedical publications: Comparing the accuracies of nine text-based similarity approaches”. PloS ONE, Vol. 6 No. 3, e18029, DOI: 10.1371/journal.pone.0018029.
Boyack, K.W., Small, H., and Klavans, R. (2013). “Improving the accuracy of co-citation clustering using full text”. Journal of the American Society for Information Science and Technology, Vol. 64 No. 9, pp. 1759–1767.
Boyack, K.W., Small, H., and Klavans, R. (2014). “Creation of a highly detailed, dynamic, global model and map of science”. Journal of the American Society for Information Science and Technology, Vol. 65 No. 4, pp. 670–685.
Chang, Y.F., and Chen, C. (2011). “Classification and visualization of the social science network by the minimum span clustering method”. Journal of the American Society for Information Science and Technology, Vol. 62 No. 12, pp. 2404–2413.
Elsevier (2004). Scopus. http://www.scopus.com/. Accessed 15-12-2015.
Glänzel, W., and Schubert, A. (2003). “A new classification scheme of science fields and subfields designed for scientometric evaluation purposes”. Scientometrics, Vol. 56 No. 3, pp. 357–367.
Gómez, I., Bordons, M., Fernández, M.T., and Méndez, A. (1996). “Coping with the problem of subject classification diversity”. Scientometrics, Vol. 35 No. 2, pp. 223–235.
Gómez-Núñez, A.J., Vargas-Quesada, B., Moya-Anegón, F., and Glänzel, W. (2011). “Improving SCImago Journal & Country Rank (SJR) subject classification through reference analysis”. Scientometrics, Vol. 89 No. 3, pp. 741–758.
Gómez-Núñez, A.J., Batagelj, V., Vargas-Quesada, B., Moya-Anegón, F., and Chinchilla-Rodríguez, Z. (2014). “Optimising SCImago Journal & Country Rank classification by community detection”. Journal of Informetrics, 8(2), 369-383.

20
Gómez-Núñez, A.J., Vargas-Quesada, B., Moya-Anegón, F. (2016). “Updating the SCImago journal and country rank classification: A new approach using Ward's clustering and alternative combination of citation measures”. Journal of the Association for Information Science and Technology, Vol. 67 No. 1, pp. 178–190.
Janssens, F., Zhang, L., De Moor, B., and Glänzel, W. (2009). “Hybrid clustering for validation and improvement of subject-classification schemes”. Information Processing & Management, Vol. 45 No. 6, pp. 683–702.
Klavans, R., and Boyack, K.W. (2006). “Identifying a better measure of relatedness for mapping science”. Journal of the American Society for Information Science and Technology, Vol. 57 No. 2, pp. 251–263.
Klavans, R., and Boyack, K.W. (2009). “Toward a consensus map of science”. Journal of the American Society for Information Science and Technology, Vol. 60 No. 3, pp. 455–476.
Klavans, R., & Boyack, K. W. (2010). “Toward an objective, reliable and accurate method for measuring research leadership”. Scientometrics, Vol. 82 No. 3, pp. 539-553.
Klavans, R., and Boyack, K.W. (in press). “Which type of citation analysis generates the most accurate taxonomy of scientific and technical knowledge?” Journal of the Association for Information Science and Technology.
Leydesdorff, L. (2006). “Can scientific journals be classified in terms of aggregated journal-journal citation relations using the Journal Citation Reports?” Journal of the American Society for Information Science and Technology, Vol. 57 No. 5, pp. 601–613.
Leydesdorff, L., Hammarfelt, B., and Salah, A. (2011). “The structure of the Arts & Humanities Citation Index: A mapping on the basis of aggregated citations among 1,157 journals”. Journal of the American Society for Information Science and Technology, Vol. 62 No. 12, pp. 2414–2426.
Leydesdorff, L., and Rafols, I. (2012). “Interactive overlays: A new method for generating global journal maps from Web-of-Science data”. Journal of Informetrics, Vol. 6 No. 2, pp. 318–332.
Leydesdorff, L., Rafols, I., and Chen, C. (2013). “Interactive overlays of journals and the measurement of interdisciplinarity on the basis of aggregated journal-journal citations”. Journal of the American Society for Information Science and Technology, Vol. 64 No. 12, pp. 2573–2586.
Leydesdorff, L., Moya-Anegón, F., and Guerrero-Bote V. (2015a). “Journal maps, interactive overlays, and the measurement of interdisciplinarity on the basis of Scopus data (1996–2012)”. Journal of the Association for Information Science and Technology, Vol. 66 No. 5, pp. 1001-1016.
Leydesdorff, L., Moya-Anegón, F., and de Nooy, W. (2015b). “Aggregated journal–journal citation relations in Scopus and Web of Science matched and compared in terms of networks, maps, and interactive overlays”. Journal of the Association for Information Science and Technology. http://onlinelibrary.wiley.com/doi/10.1002/asi.23372/full. Accessed 25-04-2015. DOI: 10.1002/asi.23372.
21
Leydesdorff, L., Bornmann, L., and Zhou, P. (in press). “A reproducible journal classification and global map of science based on aggregated journal-journal citation relations”. Journal of Informetrics.
Moya-Anegón, F., Vargas-Quesada, B., Chinchilla-Rodríguez, Z., Corera-Álvarez, E., Munoz-Fernández, F.J., and Herrero-Solana, V. (2007). “Visualizing the marrow of science”. Journal of the American Society for Information Science and Technology, Vol. 58 No. 14, pp. 2167–2179.
Narin, F., Pinski, G., and Gee, H.H. (1976). “Structure of the biomedical literature”. Journal of the American Society for Information Science, Vol. 27 No. 1, pp. 25–45.
Newman, M., and Girvan, M. (2004). “Finding and evaluating community structure in networks”. Physical Review E, Vol. 69 No. 2, 026113.
Persson, O. (2010). “Identifying research themes with weighted direct citation links”. Journal of Informetrics, Vol. 4 No. 3, pp. 415–422.
Rafols, I., and Leydesdorff, L. (2009). “Content-based and algorithmic classifications of journals: Perspectives on the dynamics of scientific communication and indexer effects”. Journal of the American Society for Information Science and Technology, Vol. 60 No. 9, pp. 1823–1835.
Rafols, I., Porter, A.L., and Leydesdorff, L. (2010). “Science overlay maps: A new tool for research policy and library management”. Journal of the American Society for Information Science and Technology, Vol. 61 No. 9, pp. 1871–1887.
Ruiz-Castillo, J., and Waltman, L. (2015). “Field-normalized citation impact indicators using algorithmically constructed classification systems of science”. Journal of Informetrics, Vol. 9, No. 1, pp. 102-117.
Salton, G., and Buckley, C. (1988). “Term-weighting approaches in automatic text retrieval”. Information Processing & Management, Vol. 24 No. 5, pp. 513–523.
Sci2 Team. (2009). Science of Science (Sci2) Tool. Indiana University and SciTech Strategies, https://sci2.cns.iu.edu.
SCImago (2007a). SCImago Journal & Country Rank. http://www.scimagojr.com/. Accessed 15-12-2015.
SCImago (2007b). “SCImago journal & country rank: un nuevo portal, dos nuevos rankings”. El Profesional de la Información, Vol. 16 No. 6, pp. 645–646.
Small, H. (1999a). “1996 map of science: A network representation of the 43 fourth-level clusters based on data from the 1996 Science Citation Index”. In K. Börner and D. MacPherson (Eds.), 1st Iteration (2005): The Power of Maps, Places & Spaces: Mapping Science. http://www.scimaps.org/detailMap/index/1996_map_of_science__30. Accessed 15-12-2015.
Small, H. (1999b). “Visualizing science by citation mapping”. Journal of the American Society for Information Science, Vol. 50 No. 9, pp. 799–813.
Thomson Reuters (2009). Web of Science. http://wokinfo.com/. Accessed 15-12-2015.

22
Van Eck, N.J., Waltman, L., Dekker, R., and Van den Berg, J. (2010). “A comparison of two techniques for bibliometric mapping: Multidimensional Scaling and VOS”. Journal of the American Society for Information Science and Technology, Vol. 61 No. 12, pp. 2405–2416.
Van Eck, N.J., and Waltman, L. (2010). “Software survey: VOSviewer, a computer program for bibliometric mapping”. Scientometrics, Vol. 84 No. 2, pp. 523–538.
Vargas-Quesada, B., Moya-Anegón, F., Chinchilla-Rodríguez, Z., Corera-Álvarez, E., and Guerrero-Bote, V. (2008). “Evolución de la estructura científica española: ISI Web of Science 1990-2005”. El Profesional de la Información, Vol. 17 No. 1, pp. 22–37.
Vargas-Quesada, B., and Moya-Anegón, F. (2007). Visualizing the structure of science. Springer, New York.
Waltman, L., and Van Eck, N.J. (2012). “A new methodology for constructing a publication-level classification system of science”. Journal of the American Society for Information Science and Technology, Vol. 63 No. 12, pp. 2378–2392.
Waltman, L., Van Eck, N.J., and Noyons, E.C.M. (2010). “A unified approach to mapping and clustering of bibliometric networks”. Journal of Informetrics, Vol. 4 No. 4, pp. 629–635.
Wang, Q., and Waltman, L. (2016). “Large-scale analysis of the accuracy of the journal classification systems of Web of Science and Scopus”. Journal of Informetrics, Vol. 10 No. 2, pp. 347–364.
Zhang, L., Liu, X., Janssens, F., Liang, L., and Glänzel, W. (2010). “Subject clustering analysis based on ISI category classification”. Journal of Informetrics, Vol. 4 No. 2, pp. 185–193.
Zhang, L., Glänzel, W., and Liang, L. (2009). “Tracing the role of individual journals in a cross-citation network based on different indicators”. Scientometrics, Vol. 81 No. 3, pp. 821–838.
View publication statsView publication stats