visual summary. world equity prices during crises(a) sources: global financial data inc. and bank...
Post on 19-Dec-2015
213 views
TRANSCRIPT

Visual summary
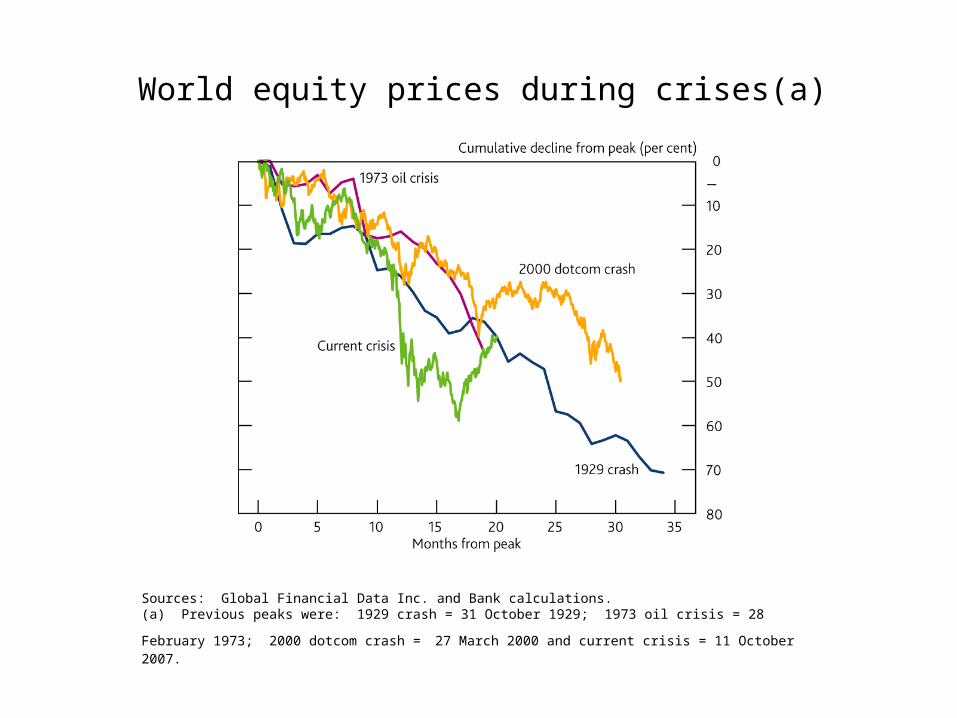
World equity prices during crises(a)
Sources: Global Financial Data Inc. and Bank calculations.
(a) Previous peaks were: 1929 crash = 31 October 1929; 1973 oil crisis = 28 February 1973; 2000 dotcom crash = 27 March 2000 and current crisis = 11 October 2007.
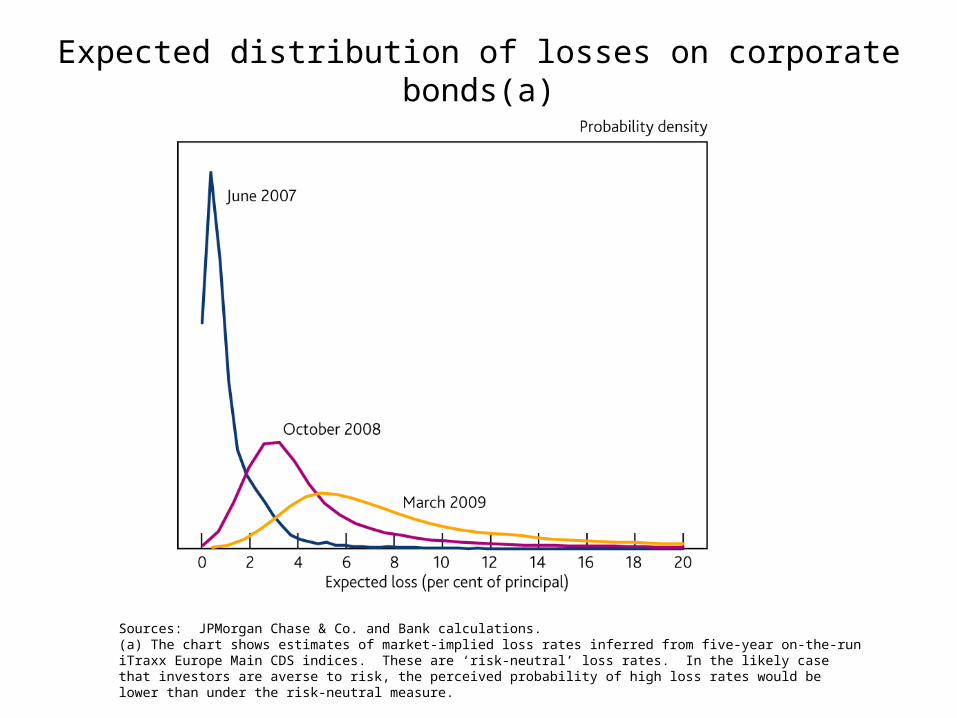
Expected distribution of losses on corporate bonds(a)
Sources: JPMorgan Chase & Co. and Bank calculations.(a) The chart shows estimates of market-implied loss rates inferred from five-year on-the-run iTraxx Europe Main CDS indices. These are ‘risk-neutral’ loss rates. In the likely case that investors are averse to risk, the perceived probability of high loss rates would be lower than under the risk-neutral measure.
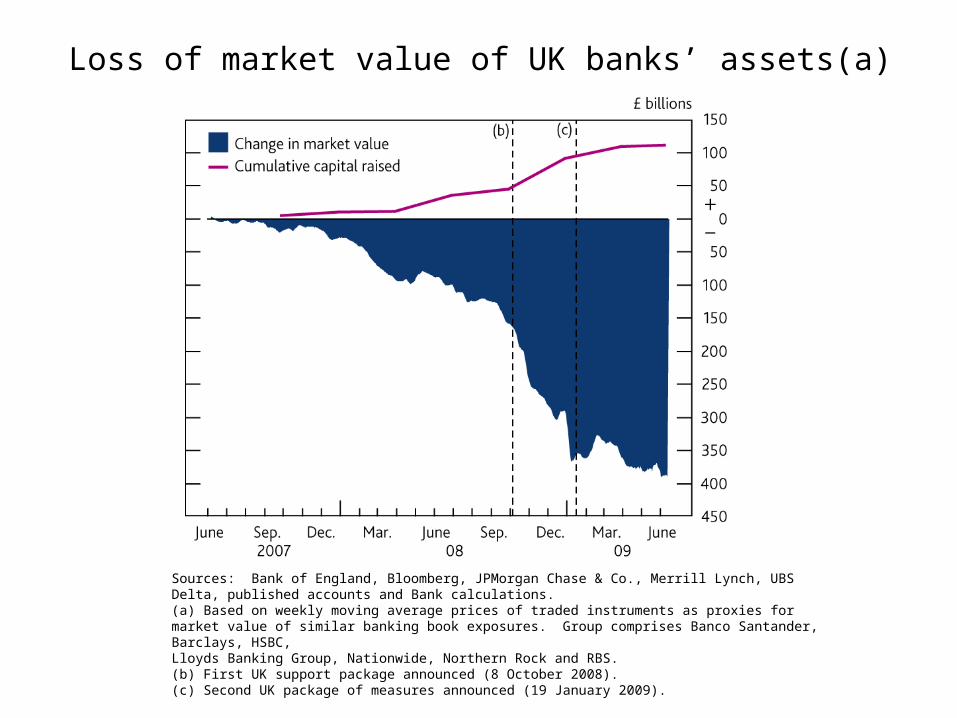
Loss of market value of UK banks’ assets(a)
Sources: Bank of England, Bloomberg, JPMorgan Chase & Co., Merrill Lynch, UBS Delta, published accounts and Bank calculations.(a) Based on weekly moving average prices of traded instruments as proxies for market value of similar banking book exposures. Group comprises Banco Santander, Barclays, HSBC, Lloyds Banking Group, Nationwide, Northern Rock and RBS.(b) First UK support package announced (8 October 2008).(c) Second UK package of measures announced (19 January 2009).

UK corporate lending growth(a)
Source: Bank of England.(a) Bars show contributions to the twelve-month growth rate in the stock of lending.(b) Includes consolidated banking groups of Barclays, Lloyds Banking Group, HSBC, Nationwide and RBS.
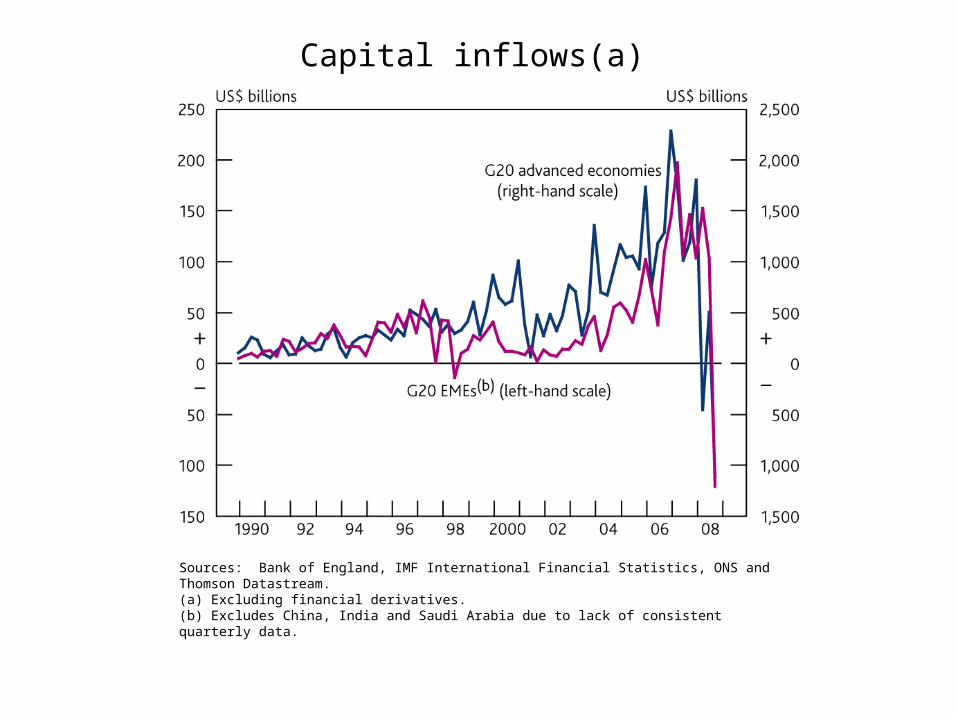
Capital inflows(a)
Sources: Bank of England, IMF International Financial Statistics, ONS and Thomson Datastream.(a) Excluding financial derivatives.(b) Excludes China, India and Saudi Arabia due to lack of consistent quarterly data.
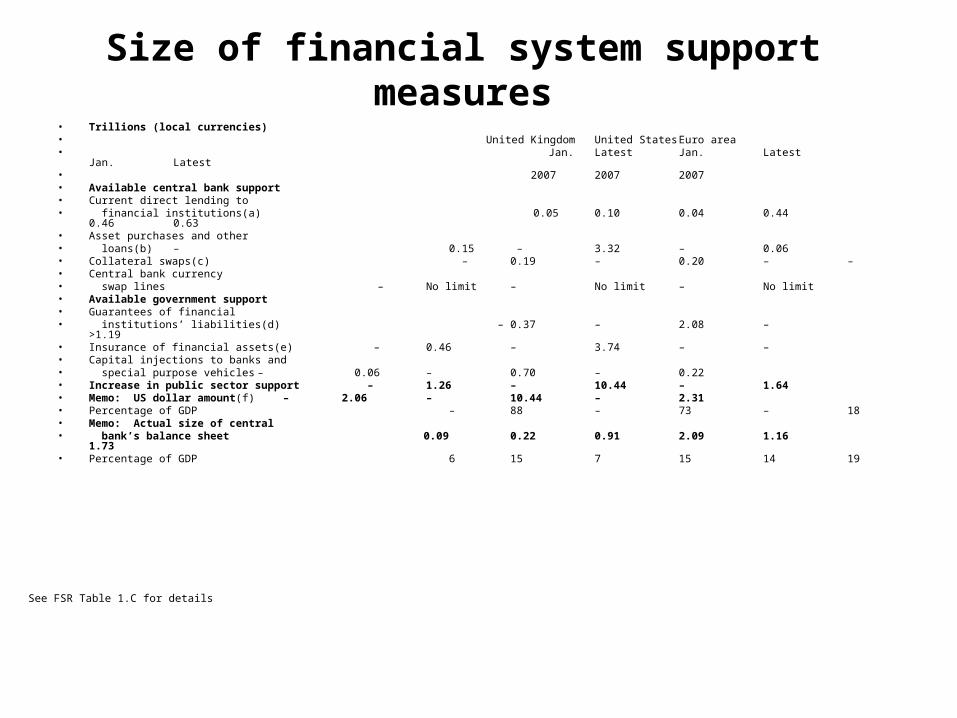
Size of financial system support measures• Trillions (local currencies)• United Kingdom United States Euro area• Jan. Latest Jan. Latest Jan. Latest• 2007 2007 2007• Available central bank support• Current direct lending to• financial institutions(a) 0.05 0.10 0.04 0.44 0.46 0.63• Asset purchases and other• loans(b) – 0.15 – 3.32 – 0.06• Collateral swaps(c) – 0.19 – 0.20 – –• Central bank currency • swap lines – No limit – No limit – No limit• Available government support• Guarantees of financial• institutions’ liabilities(d) – 0.37 – 2.08 – >1.19• Insurance of financial assets(e) – 0.46 – 3.74 – –• Capital injections to banks and• special purpose vehicles – 0.06 – 0.70 – 0.22• Increase in public sector support – 1.26 – 10.44 – 1.64• Memo: US dollar amount(f) – 2.06 – 10.44 – 2.31• Percentage of GDP – 88 – 73 – 18• Memo: Actual size of central• bank’s balance sheet 0.09 0.22 0.91 2.09 1.16 1.73• Percentage of GDP 6 15 7 15 14 19
See FSR Table 1.C for details
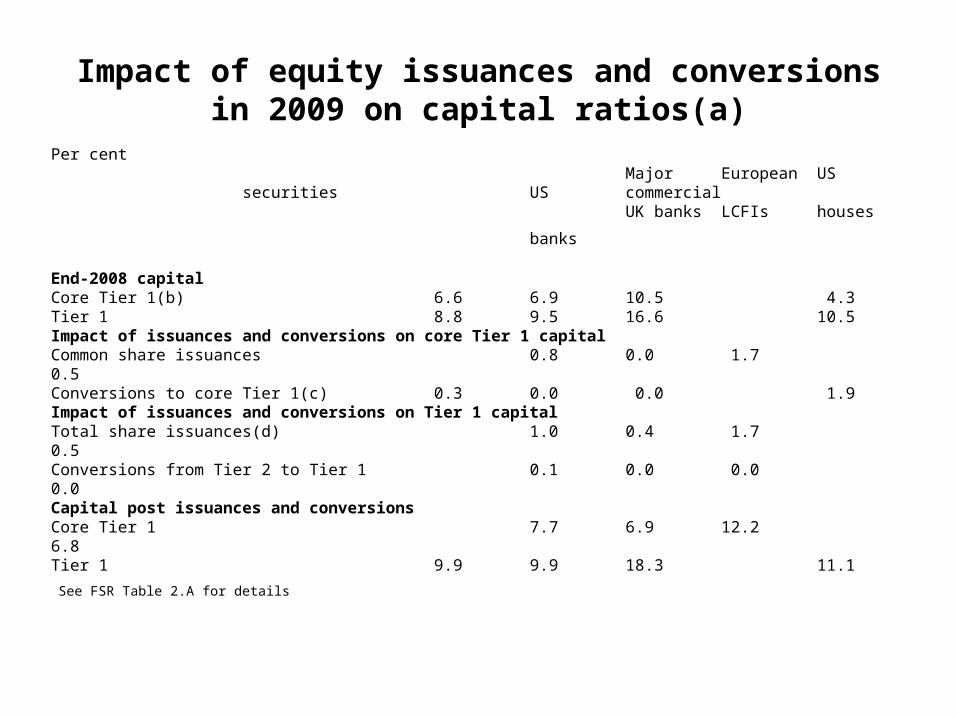
Impact of equity issuances and conversions in 2009 on capital ratios(a)
See FSR Table 2.A for details
Per centMajor European US securities
US commercialUK banks LCFIs houses
banks
End-2008 capitalCore Tier 1(b) 6.6 6.9 10.5 4.3Tier 1 8.8 9.5 16.6 10.5Impact of issuances and conversions on core Tier 1 capitalCommon share issuances 0.8 0.0 1.7 0.5Conversions to core Tier 1(c) 0.3 0.0 0.0 1.9Impact of issuances and conversions on Tier 1 capitalTotal share issuances(d) 1.0 0.4 1.7 0.5Conversions from Tier 2 to Tier 1 0.1 0.0 0.0 0.0Capital post issuances and conversionsCore Tier 1 7.7 6.9 12.2 6.8Tier 1 9.9 9.9 18.3 11.1
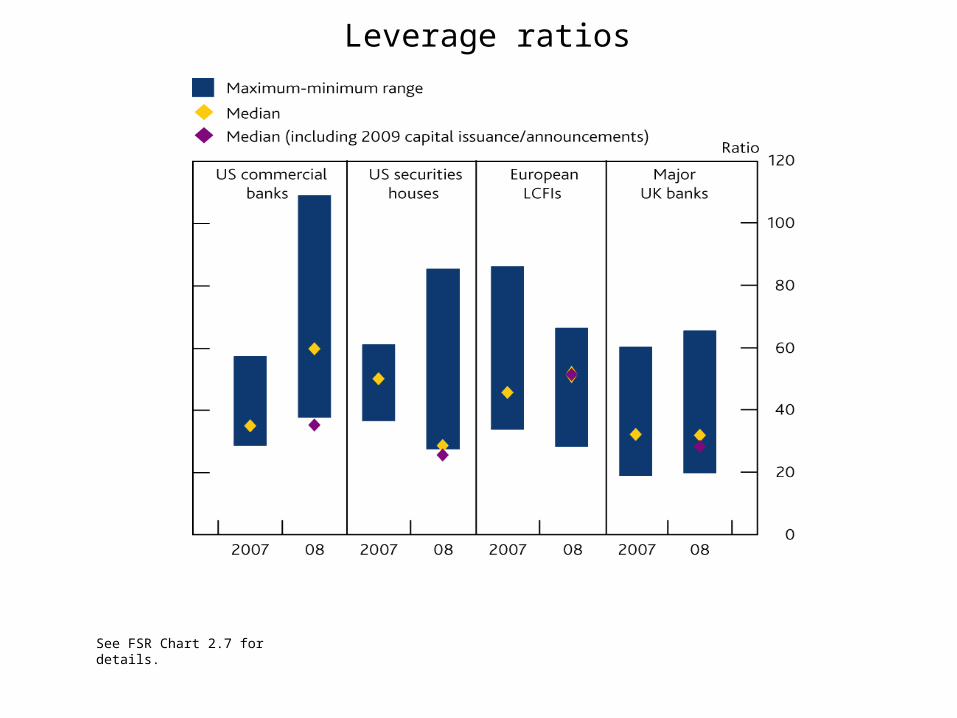
Leverage ratios
See FSR Chart 2.7 for details.
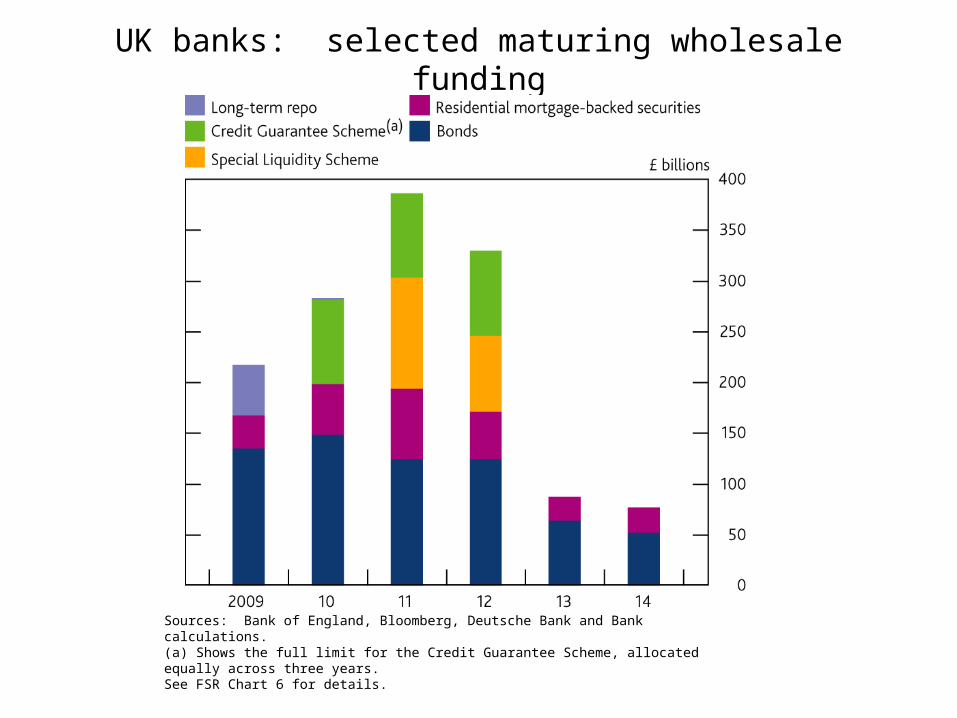
UK banks: selected maturing wholesale funding
Sources: Bank of England, Bloomberg, Deutsche Bank and Bank calculations.(a) Shows the full limit for the Credit Guarantee Scheme, allocated equally across three years.See FSR Chart 6 for details.
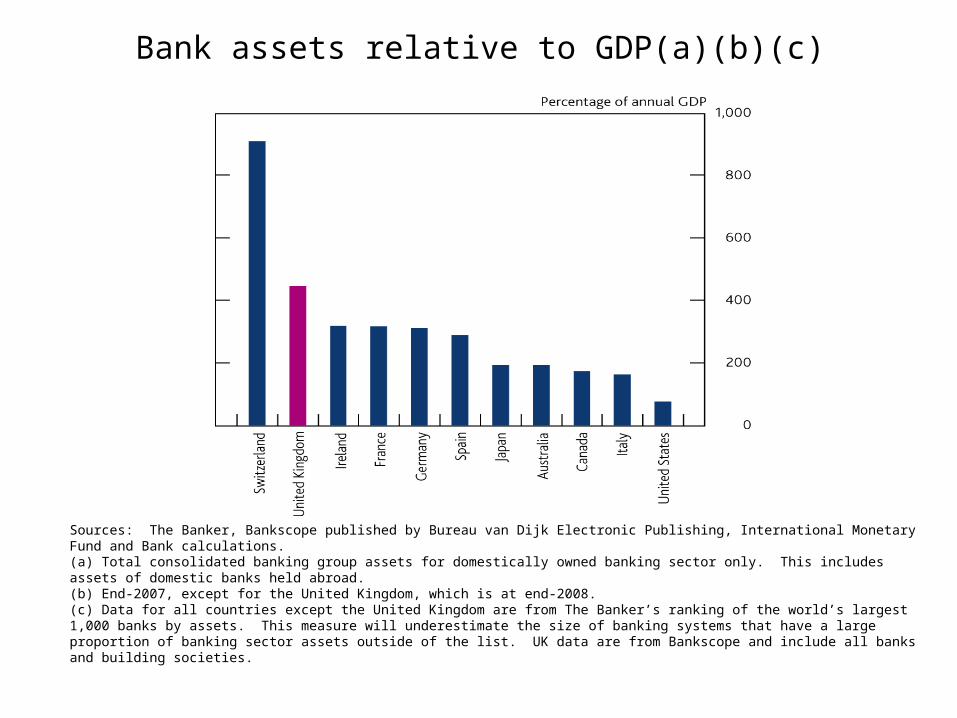
Bank assets relative to GDP(a)(b)(c)
Sources: The Banker, Bankscope published by Bureau van Dijk Electronic Publishing, International Monetary Fund and Bank calculations.(a) Total consolidated banking group assets for domestically owned banking sector only. This includes assets of domestic banks held abroad. (b) End-2007, except for the United Kingdom, which is at end-2008.(c) Data for all countries except the United Kingdom are from The Banker’s ranking of the world’s largest 1,000 banks by assets. This measure will underestimate the size of banking systems that have a large proportion of banking sector assets outside of the list. UK data are from Bankscope and include all banks and building societies.