visual search for change: a probe into the nature of...
TRANSCRIPT
Visual Cognition: Special Issue on Change Blindness and Visual Memory.In press (to appear late 1999)
Do not quote without permission from the author(s)
Visual Search for Change: A Probe intothe Nature of Attentional Processing
Ronald A. Rensink
Cambridge Basic ResearchNissan Research & Development, Inc.
A set of visual search experiments tested the proposal that focused attention is needed to detectchange. Displays were arrays of rectangles, with the target being the item that continuallychanged its orientation or contrast polarity. Five aspects of performance were examined:linearity of response, processing time, capacity, selectivity, and memory trace. Detection ofchange was found to be a self-terminating process requiring a time that increased linearly withthe number of items in the display. Capacity for orientation was found to be about 5 items, avalue comparable to estimates of attentional capacity. Observers were able to filter out bothstatic and dynamic variations in irrelevant properties. Analysis also indicated a memory forpreviously-attended locations. These results support the hypothesis that the process needed todetect change is much the same as the attentional process needed to detect complex staticpatterns. Interestingly, the features of orientation and polarity were found to be handled insomewhat different ways. Taken together, these results not only provide evidence that focusedattention is needed to see change, but also show that change detection itself can provide newinsights into the nature of attentional processing.
Change blindness is a rather striking phenomenon: a change made to an image during asaccade, flicker, or other such interruption will often be difficult to detect, even when it is largeand easily seen once noticed (Rensink, O'Regan, & Clark, 1997; Simons & Levin, 1997). Muchhas been made of the "negative" aspect of this phenomenonÑthe fact that detecting change canbe difficult, even after several seconds of viewing. For example, it has been used as evidence forthe idea that observers never form a detailed, spatiotopic "picture" of their surroundings (Rensinket al., 1997; Simons, 1996). It has also been used to support the idea that withdrawing attentionfrom a representational structure causes it to lose spatial and temporal coherence (Rensink, 1997,this issue).
But such blindness has its limits. Although some types of change require large amountsof time before being seen, others are detected more quickly (Rensink et al., 1997; Simons, 1996).And even those changes that are difficult to notice are eventually seen, and seen clearly. As I would like to thank Ian Thornton, Carol Yin, Greg Zelinsky, and an anonymous reviewer for comments on an earlier draft of this paper. Iwould also like to thank Monica Strauss, Nayantara Santhi, Janis Breeze, and Carolyn Harp for their help in running the experiments. Parts ofthis paper were presented at the 19th European Conference on Visual Perception, Strassburg, France, Sept. 9-13, 1996. Correspondence may beaddressed to R.A. Rensink, Cambridge Basic Research, Nissan Research & Development, Inc., 4 Cambridge Center, Cambridge, MA 02142USA.

Visual Search for Change 2
such, this "positive" aspect of change blindnessÑthe eventual perception of changeÑyields aninteresting set of effects in its own right, one that also has the potential to provide new insightsinto the way that we see.
As an example of how this potential can be developed, this paper examines visual searchfor change in arrays of simple stimuli. It has been argued that focused attention is needed to seechange (Rensink, 1997, this issue). It has also been argued that focused attention is needed tosee static patterns not immediately evident to an observer (e.g., Treisman & Gormican, 1988;Wolfe, 1994). If both these views are correct, it may be possible to extend the frameworkdeveloped for the attentional search of static spatial patterns to the case of changingspatiotemporal patterns. And visual search for change may in turn shed new light on the natureof the attentional processes involved.
Attention and the Perception of ChangeIn what follows, the connection between focused attention and visual perception is taken
to be that given by coherence theory (see Rensink, this issue). This theory assumes that object-based attention is intimately involved with the formation of representational structures withspatiotemporal coherence. More precisely (see Figure 1):
i) Prior to focused attention, structures are formed rapidly and in parallel across the visualfield. These preattentive structures (or "proto-objects") can be quite complex, but havelimited spatial coherence (see, e.g., Rensink & Enns, 1995, 1998). Their temporalcoherence is similarly limitedÑthey are volatile, and so need to be constantlyregenerated. As such, they are simply replaced when a new stimulus appears at theirretinal location.
ii) Focused attention acts like a hand to "grab" proto-objects from this flux and stabilizethem. While held, these structures form a coherence field corresponding to anindividuated object. This coherence allows the object to retain its continuity1 acrosstime, so that any new stimulus at that location is treated as the transformation of anexisting structure rather than the appearance of a new one.
iii) After focused attention is released, the coherence field is no longer maintained, and theobject dissolves back into the original set of proto-objects. As such, there is little (if any)visual short-term memory of structure apart from what is currently being attended.
------------------ Insert Figure 1 about here ------------------
This concept of an object as a spatiotemporal coherence field is akin to the notion of an objectfile (Kahneman, Treisman, & Gibbs, 1992) but much more dynamic, with the field existing onlyas long as attention is being directed to the object. (For a more extensive discussion of thesematters, see Rensink, this issue.) Among other things, coherence theory implies that there islittle visual short-term memory (vSTM) apart from what is being attended; indeed, it suggeststhat muchÑif not allÑof vSTM may be the same as attentional hold.2 This position issupported not only by results on change blindness, but also by results indicating a lack ofattentional aftereffect even on static displays (Wolfe, 1996). In any event, the systematicinvestigation of change detection carried out here will provide a more thorough test of thisproposal.
The ApproachThe approach taken here will be based on the detection of change under "flicker"
conditions (Rensink et al., 1997). In these conditions, an original and a modified imagecontinually alternate until the observer responds (Figure 2). A blank field briefly appearsbetween each image; the transients generated by this field swamp the local motion signals thatwould normally draw attention to the location of the change.
------------------ Insert Figure 2 about here ------------------

Visual Search for Change 3
All experiments will involve the detection of change, where observers report whether ornot a change exists in the display. To avoid any influence of meaning (or "gist") onperformance, displays will be simple arrays of rectangles. Target items (when present) willchange their properties, while distractor items retain theirs. This approach is somewhat akin tothat of Phillips (1974) and Pashler (1988), except that (i) simpler displays are used, and (ii)performance is not measured in terms of accuracy on briefly-presented displays, but rather interms of the reaction time (RT) needed for displays of longer duration. As shown below, thisapproach can allow the disentanglement of several potentially confounding factors, such as thespeed and capacity of the underlying mechanisms.
The issue examined here is whether the mechanism used for change detection is the sameas the attentional mechanism believed to be used in search for complex static patterns (e.g.,Treisman & Gormican, 1988). This will be done by examining various aspects of visual searchfor change, and comparing these to what is believed true of focused attention. In particular, fiveaspects will be examined: linearity of response, processing time, capacity limit, between-dimension selectivity, and memory for spatial location. Investigating the first of these involvesdetermining if visual search for change is formally similar to search for complex static patterns.Investigating the next three involves showing that their characteristics are compatible with whatis known about focused attention. Occam's razor can then be invoked to conclude that theprocesses involved are not just formally similar, but identical. Having established this identity, itwill then be shown that search for change can be used to shed light on other aspects of attentionalprocessing, such as whether it has a memory of where it has been.
GENERAL METHODEach of the experimental conditions used well-known visual search methodology in
which observers search as rapidly as possible for a target among a set of distractor items (e.g.,Rensink & Enns, 1995; Treisman & Gormican, 1988). Each display was composed of an arrayof rectangles, with the two values of the changing property distributed roughly equally amongthe rectangles (Figure 2). The target did not have a unique feature in any displayÑit was simplythe item that continually changed its properties. Each distractor, in contrast, retained itsproperties. In the interests of simplicity, only the properties of orientation and contrast polarityare examined here.
Displays were composed of 2, 6 or 10 items. Items were outlined rectangles ofdimension 1.2° _ 0.4°. These were positioned at random on an imaginary 5 _ 4 grid of possiblelocations, with density controlled, i.e., the average inter-item distance was approximately thesame for all displays. The display area subtended approximately 15° _ 12° of visual angle. Theposition of each item in the grid was jittered by ±0.5°. The locations of all items were identicalin the pair of displays used in each trial.
The temporal pattern (or cadence ) used in all experiments is shown in Figure 2. Aftershowing the first set of rectangles for a fixed display time (or on-time ), the display was blankedfor a brief interval (ISI, or off-time ), during which the entire field was set to the color of thedisplay background. The next set of rectangles then appeared for a similar on-time, followed bya blank field for a similar off-time. The display then cycled back to the first set of rectangles,with the entire display sequence repeating until the observer responded. The color of the blanksand the display backgrounds were always the same (medium gray), so that the items appeared tocontinually flicker on a motionless background.
Off-times were always 120 ms. With this value, differences in the motion signalscreated by the change are not sufficient to draw attention to the target (Pashler, 1988; Phillips,1974; see also Appendix A for empirical verification). Since the target cannot be determinedfrom any single display, attention must form the items into objects with sufficient spatiotemporalcoherence to support the perception of change.
A Macintosh computer was used to generate the displays, control the experiments, andcollect the data. Each condition tested 12 adult observers with normal or corrected-to-normalvisual acuity. In all experiments, half the observers were naive to RT testing and visual search

Visual Search for Change 4
methodology, while the other half had extensive experience with search tasks. Observerscompleted 3 sets of 60 trials in each condition. Each condition was blocked, and conditions werecounterbalanced in regards to presentation order.
The target was present on half the trials (chosen randomly) and absent in the other half.Observers were asked to determine the presence or absence of the target as quickly as possible,while maintaining an accuracy of at least 90%. Target presence or absence was reported bypressing one of two response keys. Visual feedback was given after each response.
In all experiments, the independent variable was the set size , defined as the number ofitems in the display. The primary dependent variable was the search slope , defined here as theslope of RT over display size; the inverse of this measure is the search rate . Another measureoccasionally used was the baseline , defined as the (extrapolated) RT for a display of size of 1.Search slopes and baselines were obtained for each observer by an unweighted least-squares fitof the average RTs obtained for each set size. Although accuracy fell below 90% for someparticularly difficult conditions, this did not appear to have much effect on search slopes(Appendix B), largely eliminating the possibility of speed-accuracy tradeoffs influencing theresults.
Data analyses usually focused on mean search slopes for the observers in eachexperiment. Unless otherwise indicated, differences were analyzed using within-observer t -tests.For some conditions, between-observer analyses were also carried out. None of these latteranalyses took advantage of the fact that some observers were common to both conditions;instead, the more conservative assumption was made that observers were sampled independently.All statistical tests were two-sided, and all reported differences were significant at the p < .05level or better. Although target-absent measures will occasionally be used, consideration willusually be limited to target-present measures, since these are less susceptible to higher-levelstrategic influences (Chun & Wolfe, 1996).
ASPECT 1: LINEARITY OF REACTION TIMES
Issues According to coherence theory, focused attention is needed to see change. To ascertain
whether this is indeed the case, the first step is to determine if search for change is formallysimilar to search for static patterns. If so, the framework developed for spatial patterns can belegitimately applied to spatiotemporal patterns, allowing both kinds of search to be measured andanalyzed in much the same way.
At first glance, establishing formal similarity would appear to be a straight-forwardmatter. Given that focused attention is needed to see change, detecting a target under flickerconditions will require an attentional scan of the display, with attention now being used to detecta spatiotemporal (and not just spatial) pattern. However, visual search for change isgranularÑresponses are usually made after a display alternation. This is not fatal from the pointof view of analysis, since performance can always be measured in terms of the number ofalternations needed. But the framework developed for static search is based on RTs and searchslopes rather than alternations, and it would be useful if these measures could be maintained.3Earlier change-detection studies (e.g., Rensink, 1996; Zelinsky, 1997) have shown that RTs andsearch slopes are useful measures of performance. But a careful investigation is still needed toestablish their legitimacy.
The first issue in this regard is the extent to which the averaging of responses for a givenset size provides a reliable estimate of RT. If the variance of responses is sufficiently high,averaging will allow the granular nature of the change-detection task to be ignored. Just as theaverage height of a population can be measured to millimeter precision using a ruler with onlycentimeter increments, so too can highly precise RTs be determined by averaging over coarsermeasures (Ulrich & Giray, 1989). The question is whether the variance in responses here is largeenough for this to occur.

Visual Search for Change 5
The second issue is whether average RTs increase linearly with set size, so that searchslopes can be used to describe performance. The detection of change has several components:loading information into vSTM, holding it across a blank interval, comparing the stored to thevisible information in the new display, andÑif search needs to be continuedÑunloading vSTMand shifting attention to a new location. Although some of these operations are used in searchfor static patterns, others are not. If any of these additional actions requires time that does notincrease linearly with set size, RT linearity will fail, and slopes will therefore not be legitimatemeasures of performance.
Thus, to establish a formal similarity between search for change and search for staticpatterns, it is critical that RT linearity be verified. Note that such linearity does not necessarilyimply that search is carried out sequentially on an item-by-item basis. As for the case of staticpatterns, attention could be directed to several (or even all) items in parallel, with detectionsimply taking longer when more items are included (see e.g., Townsend, 1990).
If search does turn out to be linear, it then becomes important to determine if it terminatesafter the target has been found. The critical measure here is the slope ratio , defined as the ratioof target-absent to target-present slopes. If the process is self-terminatingÑas is true forcomplex static patterns (Treisman & Gormican, 1988)Ñthis ratio will be about 2. Notehowever, that its exact value may vary somewhat, since strategic factors can influence how longobservers continue to search for absent targets (Chun & Wolfe, 1996).
ApproachExperiment 1 examined search for change at two very different on-times: a short on-time
of 80 ms and a long on-time of 800 ms. Observers were run on both the 80 ms and 800 msconditions to allow within-observer comparisons. Experiment 1A examined the case oforientation change. Here, all items were black, with orientations either horizontal or vertical.Experiment 1B examined the corresponding case of polarity change. Items here were verticallyoriented, and could be either black or white.
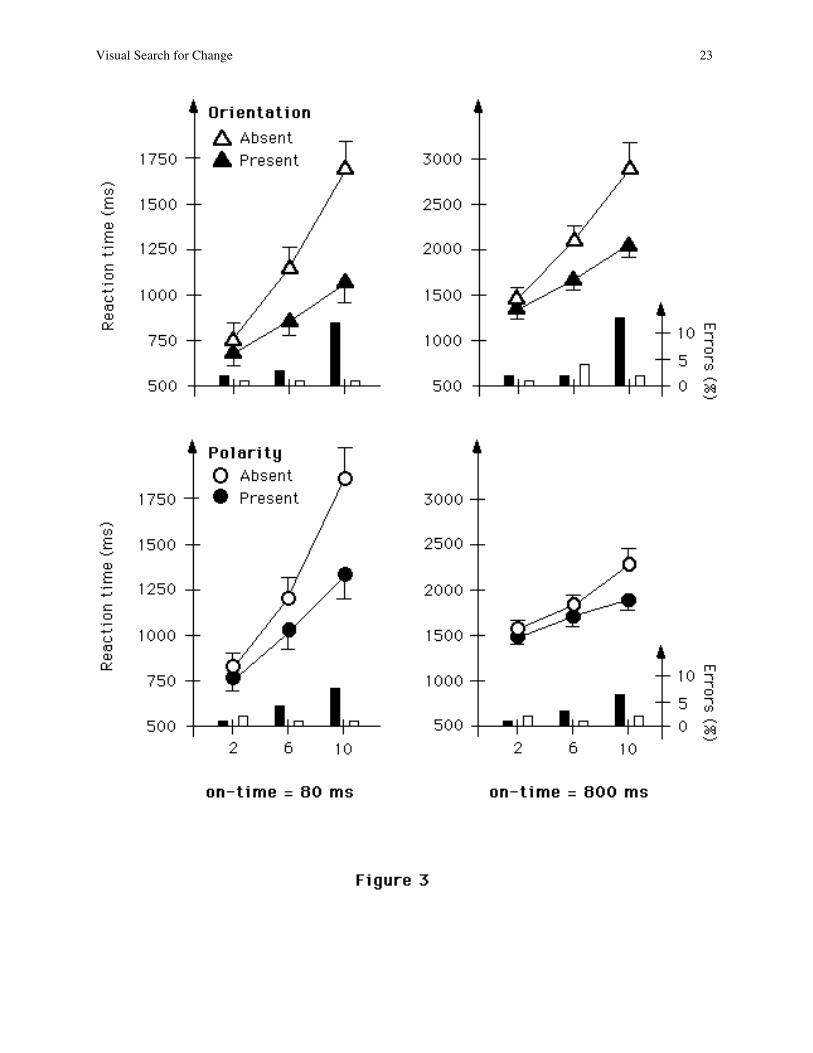
Results Reaction times for the various conditions are shown in Figure 3. As is evident from the
figure, approximately linear behavior was found in all conditions, with target-absent slopesgreater than target-present slopes.
Linearity was tested by comparing the RT increments from 2 to 6 items against thosefrom 6 to 10 items: if RT is a linear function of set size, these increments should be identical.For orientation change at 80 ms, no significant difference was found for the target-presentresponses ( p > .15). A slight positive acceleration appeared in target-absent responses, but thedifference in increments just failed to reach significance ( p < .07). For on-times of 800 ms,target-present increments were not significantly different ( p > .4), and neither were target-absentincrements ( p > .1). In all cases, the fit of the RT data to a straight line was excellent, with r2measures exceeding 0.99.
------------------ Insert Figure 3 about here ------------------
A somewhat similar pattern was found for polarity change. For on-times of 80 ms, nosignificant difference was found for the target-present responses ( p > .2), although a positiveacceleration did appear in the target-absent case ( p < .02). Likewise, for on-times of 800 ms, noreliable difference between increments was found for target-present responses ( p > .5), and apositive acceleration was found for target-absent responses ( p < .01). However, even whereacceleration occurred, a strong linear trend still existedÑ r2 values for all conditions weregreater than 0.97.
Given that average RT is effectively a linear function of set size, it follows that slopes area valid measure of performance, and so can be used to determine if search is self-terminating.For orientation change at 80 ms, target-present slopes were 48 ms/item, and target-absent slopes

Visual Search for Change 6
115 ms/item, yielding a slope ratio of 2.4. Although target-absent slopes were reliably greaterthan twice the target-present slopes ( p < .03), this ratio is still consistent with a self-terminatingsearch (Chun & Wolfe, 1996). For on-times of 800 ms, slopes were 85 ms/item and 174ms/item, yielding a slope ratio of 2.04. Target-absent slopes differed significantly from target-present slopes ( p < .0003), but not from twice the target-present slopes ( p > .85).
Self-terminating search was also found for polarity change. For on-times of 80 ms,slopes were 69 ms/item and 127 ms/item, yielding a ratio of 1.9. Consistent with this, target-absent slopes differed from target-present slopes ( p < .001), but not twice the target-presentslopes ( p > .5). For on-times of 800 ms, slopes were 51 ms/item and 92 ms/item, resulting in aratio of 1.8. Again, target-absent slopes differed from target-absent slopes ( p < .002), but notfrom twice the target-present slopes ( p > .4).
Discussion These results clearly show that search for change behaves much like search for complex
static patterns. Target-present responses in all conditions were reliably linear, with the RTincrement between set sizes of 2 and 6 being much the same as the RT increment between setsizes of 6 and 10. Target-absent responses did not have quite this degree of linearity. However,reaction times for target-absent trials reflect strategic considerations as well as perceptualprocessing (Chun & Wolfe, 1996), and so slight deviations from linearity are not unreasonable.In any event, a conservative approach will be taken here in subsequent experiments, with theanalyses of slopes based only on target-present data.
Finally, the data not only show that the search process is linear, but also that it is self-terminating, i.e., it ends as soon as the target is found. Consequently, visual search for changebehaves much like visual search for complex static patterns, and so can be analyzed using thesame formal framework.
ASPECT 2: PROCESSING TIME
Issues Although Experiment 1 showed that search slopes are meaningful measures, it did not
consider what these slopes signify. Presumably, search slope reflects an overall processing timeP , i.e., the time needed to load information into vSTM, hold it across the temporal gap, compareit, andÑif necessaryÑunload vSTM and shift processing to the next candidate item(s). Ifcoherence theory is correct and focused attention is involved, processing should never be fasterthan the speed of attentional search in complex static patterns.
ApproachBefore proceeding with the analysis, note that the results of Experiment 1 indicate a
potential complication: search slopes are not always constant. Although the slopes for polaritychange were roughly the same with both 80 and 800 ms on-times ( p > .05), this was not true fororientation change ( p < .0002). As such, it is important to first determine the extent to whichsearch slope is affected by on-time.
Experiment 2 examined performance at several values of on-time: 80 ms, 160 ms, 320ms, 480 ms, 640 ms, and 800 ms. Measures for the first and the last of these were taken directlyfrom Experiment 1; measures for the others were obtained from separate sets of observers.Although less powerful than a complete within-observer comparison, this test should provide arough determination of the extent to which slopes are influenced by on-time.
Experiment 2A examined the case of orientation. As in Experiment 1A, all items wereblack, with orientations either horizontal or vertical. Experiment 2B examined the correspondingcase of polarity. As in Experiment 1B, items were vertically oriented, and could be either blackor white.
Results

Visual Search for Change 7
Slopes for the various conditions are shown in Figure 4. For orientation, there appears tobe an overall trend for slope to increase with on-time; a one-way ANOVA confirms that thistrend does reach significance (F(5,66) = 2.38; p < .05). However, this is largely due to the 800ms condition: when this is removed from consideration, the trend effectively disappears (F(4,55)= 1.43; p > .2). Between-observer comparisons show that the 800 ms condition is not onlyslower than the 80 ms condition, but the 160 ms condition as well ( p < .03). In contrast, nosignificant differences were found between any on-times of 640 ms or less ( p > .05 for allpairwise comparisons). Thus, although slope does increase with on-time, this is significant onlyfor on-times longer than 640 ms. For smaller values, no strong trend emerges: even the best-fitting line has a poor fit (r2 = 0.64). To a first approximation, then, search slope for on-times of80-640 ms is constant, with an average value of about 60 ms/item.4
------------------ Insert Figure 4 about here ------------------
For polarity, there is no overall tendency for slope to vary with on-time (F(5,66) =0.62; p > .6). Although search for the 80 ms condition appears to be slightly slower, between-observercomparisons fail to show that it differs from the speed of any other condition (all p s > .1). Ittherefore appears that search slope is largely unaffected by on-time, at least over the range of 80-800 ms. Within this range, the average slope is about 54 ms/item.
The baseline values for the various conditions are also shown in Figure 4. As is evidentfrom the figure, baselines for both types of change are largely identical. (In the interests ofclarity, baselines for orientation have been lowered by 100 ms). Between-observer comparisonshowed no reliable differences between the two types of change for any condition (all p s > .15).Neither were there any reliable differences between target-present and target-absent baselines(all p s > .2). However, baselines did increase linearly with on-time. For orientationÑexcludingthe 800 ms conditionÑthe slope was 1.04 (r2 > 0.99); for polarity it was 1.03 (r2 > 0.98). Theonly exception to this pattern occurred for the 80 ms baselines: no significant differences werefound between these and the 160 ms baselines, either for orientation ( p > .2) or polarity ( p > .9).
Discussion These results show that over a fairly wide range of on-times, search speed does not vary
with on-time. Under these conditions, speed is evidently governed by intrinsic processingconstraints rather than factors such as stimulus quality or memory limitations. The extent of thisprocessing range depends on the property involved: for orientation, it extends from 80 to 600 ms;for polarity, it continues to at least 800 ms.
Assuming that target-present slopes represent half the actual search slope (Chun &Wolfe, 1996; Treisman & Gormican, 1988), and that search slope is due entirely to processingconstraints, the processing time P can be readily determined: for orientation, it is about 120ms/item; for polarity, 108 ms/item. In accord with the prediction of coherence theory, both ofthese values are greater than the 30-50 ms/item thought to be needed for attentional shifts instatic displays (Julesz, 1984; Wolfe, 1994).
The near-coincidence of the estimates for orientation and polarity suggests thatprocessing time may be much the same for all basic properties (or "features"). If true, this wouldprove to be useful for determining which properties are features. However, it is unlikely thatprocessing time is the same for all features: between-observer comparison of the slopes for the80 ms conditions shows that the difference between orientation and polarity is very close tosignificance ( p < .06). More investigation is needed to settle this matter. Among other things, itis necessary to determine if similar processing times are found for other known features (such ascolor and size), and if these values depend on the particular shapes of the items.
Although the baselines are not constant, they vary in a simple way, increasing directlywith on-time. This behavior is a direct consequence of the granular nature of the changedetection task: an observer must wait for a display alternation before a change can be perceived.Thus, when on-time is increased, so is the average time of the nearest alternation, and

Visual Search for Change 8
consequently, the average time of each response. The failure to find a strong difference betweenthe 80 and 160 ms on-times may stem from the relatively fast (< 300 ms) alternation time inthose conditions. If this is smaller than the variance in decision and motor processes, it wouldallow an observer to effectively overcome the quantization effects that occur with slowercadences.
ASPECT 3: CAPACITY
Issues Another aspect of performance is the capacity C , i.e., the maximum number of items that
an observer can see change at any one time (i.e., at any single alternation). If on-time is longenough to let the process pick up all the items it can, performance will not be limited by intrinsicprocessing speed, but by the maximum number of items that can be held across the temporal gap.If coherence theory is correct, this can be identified with the span of attention, or equivalently,the capacity of vSTM (believed to be about 5 itemsÑsee, e.g., Luck & Vogel, 1997; Phillips,1974; Pylyshyn & Storm, 1988). As such, no more than about 5 items ought to be seen tochange at any single alternation.5
Approach To determine how many items are held across a gap, consider the case where one item is
held. Starting from the onset of the first new display, one of the items in that display (i.e., theitem at the attended location) can be compared with the item held in memory. Assuming that nochange has been detected, the contents of memory must then be cleared, attention shifted to anew item, and the contents of the next item entered into memory, after which the process waitsfor the next alternation to begin. Consequently, only one item on average is examined peralternation, and so the search rate is identical to the alternation rate. Thus, if the displayalternates every 100 ms, the search slope will also be 100 ms/item.
Following the same logic, if two items are held across each gap, search should be twice asfast. Thus, if the display alternates every 100 ms, the slope will now be 50 ms/item. Moregenerally,
search slope = alternation time / hold. (1)Transposing terms, this yields:
hold = alternation time / search slope. (2)= (on-time + off-time) / search slope. (3)
Hold describes how many items on average are held across each temporal gap. Note that it doesnot assume memory to be limited to whatever can be extracted from a single display; its contentsmight be loaded in over several alternations.
Capacity C can be defined as the asymptotic hold that exists with increasing on-time; inthis case, the items are gathered over a single display. To determine the value for C , equation (3)was used to transform the speeds obtained in Experiment 2 into holds. This was done both forchanges in orientation and changes in polarity. Capacity was then taken to be the asymptoticvalue of hold as on-times increased.
Note that hold provides an alternate way to analyze performance. If search is process-limited, search slope s will have a constant value P (i.e., the processing time); equation (2) thenindicates that hold will increase linearly with alternation time, the proportionality constant being1/ P . Similarly, if search is limited by memory, hold h will have a constant value C (i.e., thecapacity); equation (1) then implies that search slope increases linearly with alternation time, theproportionality constant being 1/ C . As such, s and h are duals , behaving in similar ways underthe two different kinds of resource-limited conditions (Figure 5).
------------------ Insert Figure 5 about here ------------------
Visual Search for Change 9
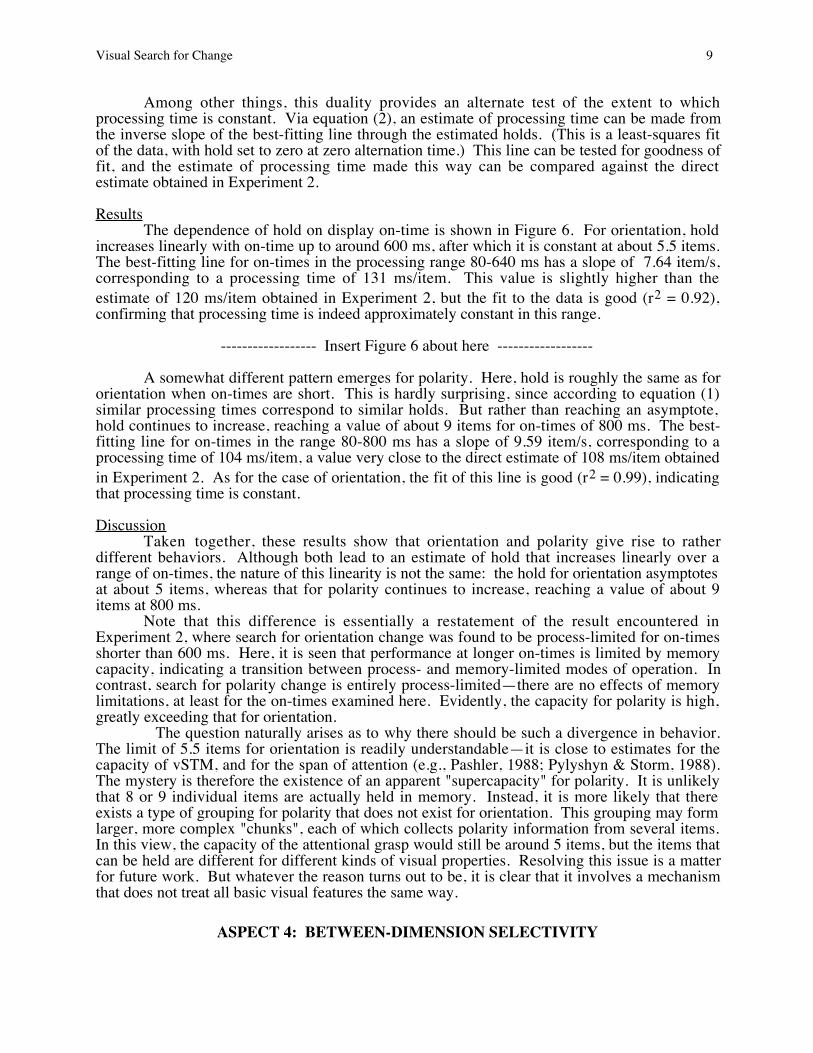
Among other things, this duality provides an alternate test of the extent to whichprocessing time is constant. Via equation (2), an estimate of processing time can be made fromthe inverse slope of the best-fitting line through the estimated holds. (This is a least-squares fitof the data, with hold set to zero at zero alternation time.) This line can be tested for goodness offit, and the estimate of processing time made this way can be compared against the directestimate obtained in Experiment 2.
Results The dependence of hold on display on-time is shown in Figure 6. For orientation, hold
increases linearly with on-time up to around 600 ms, after which it is constant at about 5.5 items.The best-fitting line for on-times in the processing range 80-640 ms has a slope of 7.64 item/s,corresponding to a processing time of 131 ms/item. This value is slightly higher than theestimate of 120 ms/item obtained in Experiment 2, but the fit to the data is good (r2 = 0.92),confirming that processing time is indeed approximately constant in this range.
------------------ Insert Figure 6 about here ------------------
A somewhat different pattern emerges for polarity. Here, hold is roughly the same as fororientation when on-times are short. This is hardly surprising, since according to equation (1)similar processing times correspond to similar holds. But rather than reaching an asymptote,hold continues to increase, reaching a value of about 9 items for on-times of 800 ms. The best-fitting line for on-times in the range 80-800 ms has a slope of 9.59 item/s, corresponding to aprocessing time of 104 ms/item, a value very close to the direct estimate of 108 ms/item obtainedin Experiment 2. As for the case of orientation, the fit of this line is good (r2 = 0.99), indicatingthat processing time is constant.
Discussion Taken together, these results show that orientation and polarity give rise to rather
different behaviors. Although both lead to an estimate of hold that increases linearly over arange of on-times, the nature of this linearity is not the same: the hold for orientation asymptotesat about 5 items, whereas that for polarity continues to increase, reaching a value of about 9items at 800 ms.
Note that this difference is essentially a restatement of the result encountered inExperiment 2, where search for orientation change was found to be process-limited for on-timesshorter than 600 ms. Here, it is seen that performance at longer on-times is limited by memorycapacity, indicating a transition between process- and memory-limited modes of operation. Incontrast, search for polarity change is entirely process-limitedÑthere are no effects of memorylimitations, at least for the on-times examined here. Evidently, the capacity for polarity is high,greatly exceeding that for orientation.
The question naturally arises as to why there should be such a divergence in behavior.The limit of 5.5 items for orientation is readily understandableÑit is close to estimates for thecapacity of vSTM, and for the span of attention (e.g., Pashler, 1988; Pylyshyn & Storm, 1988).The mystery is therefore the existence of an apparent "supercapacity" for polarity. It is unlikelythat 8 or 9 individual items are actually held in memory. Instead, it is more likely that thereexists a type of grouping for polarity that does not exist for orientation. This grouping may formlarger, more complex "chunks", each of which collects polarity information from several items.In this view, the capacity of the attentional grasp would still be around 5 items, but the items thatcan be held are different for different kinds of visual properties. Resolving this issue is a matterfor future work. But whatever the reason turns out to be, it is clear that it involves a mechanismthat does not treat all basic visual features the same way.
ASPECT 4: BETWEEN-DIMENSION SELECTIVITY
Visual Search for Change 10
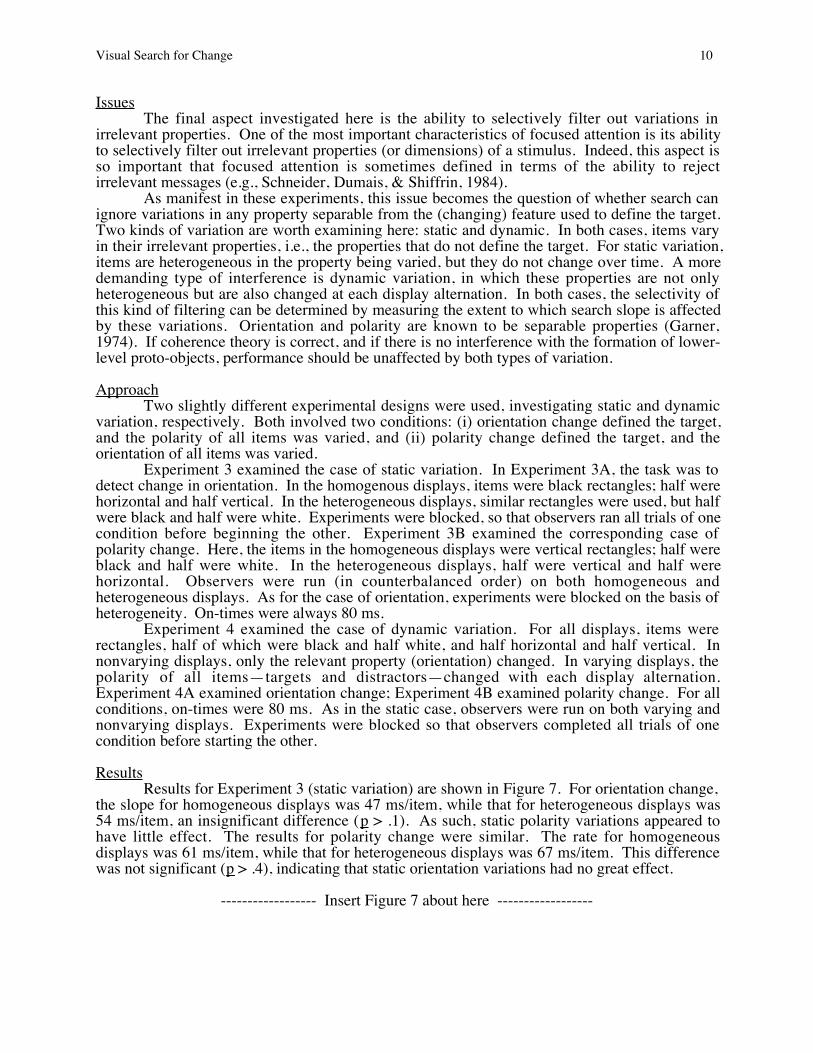
Issues The final aspect investigated here is the ability to selectively filter out variations in
irrelevant properties. One of the most important characteristics of focused attention is its abilityto selectively filter out irrelevant properties (or dimensions) of a stimulus. Indeed, this aspect isso important that focused attention is sometimes defined in terms of the ability to rejectirrelevant messages (e.g., Schneider, Dumais, & Shiffrin, 1984).
As manifest in these experiments, this issue becomes the question of whether search canignore variations in any property separable from the (changing) feature used to define the target.Two kinds of variation are worth examining here: static and dynamic. In both cases, items varyin their irrelevant properties, i.e., the properties that do not define the target. For static variation,items are heterogeneous in the property being varied, but they do not change over time. A moredemanding type of interference is dynamic variation, in which these properties are not onlyheterogeneous but are also changed at each display alternation. In both cases, the selectivity ofthis kind of filtering can be determined by measuring the extent to which search slope is affectedby these variations. Orientation and polarity are known to be separable properties (Garner,1974). If coherence theory is correct, and if there is no interference with the formation of lower-level proto-objects, performance should be unaffected by both types of variation.
ApproachTwo slightly different experimental designs were used, investigating static and dynamic
variation, respectively. Both involved two conditions: (i) orientation change defined the target,and the polarity of all items was varied, and (ii) polarity change defined the target, and theorientation of all items was varied.
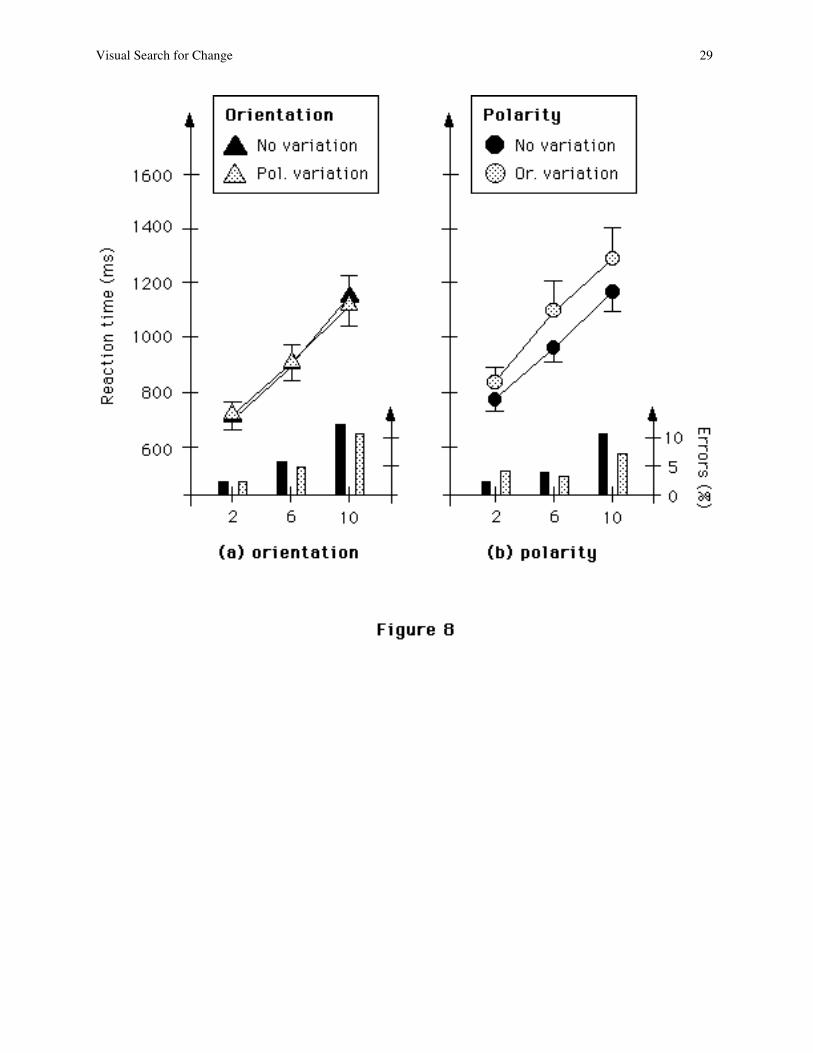
Experiment 3 examined the case of static variation. In Experiment 3A, the task was todetect change in orientation. In the homogenous displays, items were black rectangles; half werehorizontal and half vertical. In the heterogeneous displays, similar rectangles were used, but halfwere black and half were white. Experiments were blocked, so that observers ran all trials of onecondition before beginning the other. Experiment 3B examined the corresponding case ofpolarity change. Here, the items in the homogeneous displays were vertical rectangles; half wereblack and half were white. In the heterogeneous displays, half were vertical and half werehorizontal. Observers were run (in counterbalanced order) on both homogeneous andheterogeneous displays. As for the case of orientation, experiments were blocked on the basis ofheterogeneity. On-times were always 80 ms.
Experiment 4 examined the case of dynamic variation. For all displays, items wererectangles, half of which were black and half white, and half horizontal and half vertical. Innonvarying displays, only the relevant property (orientation) changed. In varying displays, thepolarity of all itemsÑtargets and distractorsÑchanged with each display alternation.Experiment 4A examined orientation change; Experiment 4B examined polarity change. For allconditions, on-times were 80 ms. As in the static case, observers were run on both varying andnonvarying displays. Experiments were blocked so that observers completed all trials of onecondition before starting the other.
Results Results for Experiment 3 (static variation) are shown in Figure 7. For orientation change,
the slope for homogeneous displays was 47 ms/item, while that for heterogeneous displays was54 ms/item, an insignificant difference ( p > .1). As such, static polarity variations appeared tohave little effect. The results for polarity change were similar. The rate for homogeneousdisplays was 61 ms/item, while that for heterogeneous displays was 67 ms/item. This differencewas not significant ( p > .4), indicating that static orientation variations had no great effect.
------------------ Insert Figure 7 about here ------------------

Visual Search for Change 11
The results for Experiment 4 (dynamic variation) are shown in Figure 8. For orientation,search in nonvarying displays was 53 ms/item, whereas search in varying displays was 50ms/item, an insignificant difference ( p > .4). The case of polarity change showed a smallslowdown of 70 ms in the baselines of the varying displays ( p < .05)Ñpresumably the changingorientations made it slightly more difficult to verify targets. But more importantly, search slopesremained unaffected: the slope for nonvarying displays was 49 ms/item, while that for varyingdisplays was 56 ms/item ( p > .3). Thus, the dynamic variation of irrelevant properties appearednot to interfere with search.
------------------ Insert Figure 8 about here ------------------
DiscussionThe results of Experiments 3 and 4 are clear: variation in separable propertiesÑwhether
static or dynamicÑcan be filtered out quite well. As a methodological note, it is worth pointingout that (as for the case of processing time) the technique used here is quite general, and mayprovide a useful way to determine which pairs of visual properties are separable from each other.
But more importantly for present purposes, these results verify yet another predictionmade from the assumption that attention is needed to see change. This verificationÑtogetherwith the compatibility found for the other aspects examinedÑindicates that visual search forchange is not just something formally similar to search for complex static patterns, but rather,involves attentional processes that are largely the same.
ASPECT 5: SPATIAL MEMORY TRACE
Issues Up to this point, the granular nature of the change-detection task has been largely
ignoredÑindeed, Experiment 1 was expressly designed to show that granularity can bedisregarded when measuring slopes and baselines. But the natural partitioning of reaction timesin this task allows measurement not only of their averages, but also of their distribution aftereach alternation. Such a perspective is unique to change detection6, and may prove useful foranalyzing various aspects of attentional processing.
As an example of this, consider the issue of whether attention leaves a memory trace thatallows it to avoid items already examined.7 Recent studies argue that no such trace exists; insuch a case, attention can revisit previously-attended items, and so the true speed of search willbe about twice the measured speed (Horowitz & Wolfe, 1998). However, if speed is doubled,equation (3) forces the estimates of attentional capacity to be doubled as well. The estimate fororientation will then be 10-11 items, a value rather discrepant with other measures of attentionallimits.
It is important to note here that capacity itself is not changed by the existence ornonexistence of a memory trace. According to coherence theory, at least two kinds of memorymechanisms exist. The first is the hold of the coherence field; this is effectively a memory of"what", existing only as long as attention is focused on the constituent items. The second is thetrace of locations that have been attended; this is effectively a memory of "where", and beingnonattentional, may last for a considerable time. Indeed, such a trace may be related to therepresentation of layout in a scene (Rensink, this issue).
Thus, the existence of a memory trace does not affect change-detection capacity per se .What it does affect is the estimate of this quantity. The key issue here is whether the originalestimates of capacity are valid. If so, this will indicate that measured speed is similar to truespeed, and consequently, that a memory trace does exist. If not, true speed will be twicemeasured speed, and the estimates obtained earlier will need to be doubled. In this latter case,the identification of change-detection capacity with attentional capacity will be compromised,and thus challenge the view that search for change is carried out by the same attentionalmechanism as used for static patterns.

Visual Search for Change 12
Approach One way to determine whether the estimates of capacity are valid is to examine the
distributions of reaction times within a trial. This can be done by considering the fraction ofresponses made in each epoch , i.e., each interval between the appearance of a given display andthe appearance of the following one. The responses analyzed here will be those for the searchfor orientation change in Experiment 1, with on-times of 800 ms. Performance for this conditionis memory-limited, with response distributions determined by change-detection capacity.
If there is no memory trace, the capacity estimate is about 11 items. If this estimate isvalid, it should be possible to load all items of a display into vSTM during the 800 ms of theinitial display (epoch 0), and compare them during the 800 ms of the next display (epoch 1).More precisely, since the total display time is 1600 ms (even more if the intervening off-time isincluded), and the processing time is 120 ms/item, it should be possible to process at least1600/120 = 13.3 items, more than on any display.8 Consequently, responses ought to be foundmostly within the first epoch, with perhaps a few stragglers in the succeeding ones. This willapply to both target-present and target-absent responses for all set sizes.
In contrast, if a memory trace exists, the capacity estimate is about 5 items. If thisestimate is valid, target-present responses for set size 10 will be distributed across the first two orthree epochs. Meanwhile, target-absent responses will be mostly gone from epoch 1:determining absence requires that all items be examined, and this will not be complete until atleast the second epoch. For set size 6, behavior will depend on the capacity of the individualobserver. For observers with a capacity of 6 or more, all responses can be made during epoch 1.For observers with a capacity of less than 6, target-present responses will be distributed over atleast two epochs, while target-absent responses will be largely absent from epoch 1. Finally, forset size 2, all responses should occur during epoch 1.
Results Distributions of target-present and target-absent responses were determined for each
observer. Data were pooled for the 6 observers with a capacity of 6 or more (high-capacityobservers; median = 8.0 items), and for the 6 observers with a capacity of less than 6 (low-capacity observers; median = 4.2 items).
Distributions for the high-capacity observers are shown in Figure 9. Most responses forset sizes 2 and 6 fall in epoch 1; this is expected from both views of attentional memory. Moreinteresting is set size 10. Here, target-present responses still fall mostly in epoch 1 (66.0%), butthere is now an appreciable presence in epoch 2 (29.0%). Importantly, target-absent responsesare less common in epoch 1 (31.2%) than in epoch 2 (44.9%). Although the number ofresponses in epoch 1 is not small, 2 of the 6 observers had capacities greater than 10; if theirresponses are removed, the proportion of epoch 1 responses falls to 14.6%. As such, this patternindicates that the median capacity for high-capacity observers is much closer to 8 than it is to 16.
------------------ Insert Figure 9 about here ------------------
Distributions for the low-capacity observers are shown in Figure 10. As before, mostresponses for set size 2 fall in epoch 1. Importantly, effects due to capacity limits already beginto appear at set size 6: most target-present responses fall in epoch 1 (59.0%), but a considerablenumber now fall in epoch 2 (32.2%); meanwhile, target-absent responses are less common inepoch 1 (27.5%) than in epoch 2 (43.2%). Both trends are heightened for set size 10. Fewertarget-present responses fall in epoch 1 (31.4%) than in epoch 2 (43.7%), and there is now anappreciable presence in epoch 3 (18.0%). Target-absent responses are almost completely absentfrom epoch 1 (2.8%). Interestingly, fewer responses occur in epoch 2 (28.4%) than in epoch 3(33.5%), with a considerable number also falling in epochs 4 and 5 (34.2%).9 This pattern isconsistent with observers having a median capacity of 4.2, but not 8.4.
------------------ Insert Figure 10 about here ------------------

Visual Search for Change 13
DiscussionThe distributions of reaction times across epochs show that the estimates of capacity
derived from measured search slopes are at least approximately true. At the very least, capacitiesare certainly not twice the estimated values. Thus, the identification of change-detectioncapacity with attentional capacity can be maintained. And so the position developed hereremains consistent.
But if the capacity estimates are valid, this implies that measured search speed is the sameas true search speed. And this in turn implies that the attentional process examined here doeshave a memory of where it has been.
This conclusion appears to be at odds with work showing that visual search involves nomemory trace (Horowitz & Wolfe, 1998). However, the task here is different in several ways.To begin with, set sizes are smaller: whereas Horowitz & Wolfe used sizes as high as 16, sizeshere extended only to 10. It may be that a limited amount of memory exists, enough to storeseveral locations; if so, such a memory would be useful for the relatively small displays usedhere, but not for larger ones. Alternatively, the critical factor could be the nature of the taskitself. Horowitz & Wolfe used a static target, which required determining shape but not location.In contrast, the task here requires observers to compare successive items at the same location.For this, information about the exact location of an item is vital, and it may be that obtaining thisinformation somehow produces a memory trace. However this situation is resolved, the outcomeshould cast new light on our understanding of attentional processing.
SUMMARY
The experiments presented here provide considerable evidence for the proposal thatfocused attention is required to see change. Experiment 1 showed that visual search for changeis a self-terminating process that requires time linear in the number of items in the display. Thisestablishes that search slopes and baselines are valid measures of performance for this task, sothat it is formally similar to the attentional search for complex static patterns.
The results of subsequent experiments showed that this similarity is more than justformal. First of all, processing times for orientation and contrast polarity were found to beapproximately constant for on-times between 80-640 ms, with a value of about 100-120 ms/item.Although these values are higher than those for most attentional searches of static displays, thisis to be expected: the detection of change requires operations not needed for detecting staticpatterns (e.g., loading information into vSTM), and so processing each item simply requiresmore time.
Another result indicating that search for change is mediated by focused attention is thefinding that only a limited amount of information can be held across a temporal gap. Theestimate found here for orientationÑ5.5 itemsÑis consistent with other estimates of attentionalcapacity (e.g., Pylyshyn & Storm, 1988). Interestingly, estimates based on polarity change leadto an apparent "supercapacity" of at least 9 items. Presumably, polarity enables a form ofgrouping, so that even though only 5 items are held, each may be a "chunk" that collectsinformation from several structures in the display. But whatever the explanation, the finding thatproperties similar in regards to processing speed are not similar in regards to capacity indicatesthat simple features are not treated alike by all visual mechanisms. Evidently, a divide of somekind exists.
The final piece of evidence stems from the ability of observers to ignore variations inirrelevant properties. It was found that both static and dynamic variations in irrelevant propertiescould be effectively filtered out, leading to search slopes similar to those for nonvaryingdisplays. Given that these four aspects of the search process are compatible with known aspectsof focused attention, it would appear that the mechanisms involved in visual search for changeare largelyÑif not entirelyÑthe same as the attentional mechanisms involved in search forcomplex static patterns.
Visual Search for Change 14
As a demonstration that the granular nature of these experiments can be used to exploreother, less-understood aspects of focused attention, the distribution of responses across differentalternations was analyzed. It was found that the estimates of attentional capacity made here wereconsistent with those derived via other types of study. This was then used to argue that theattentional process involved in change detection does create a memory trace of where it has been.
Taken together, the implication of these results is clear: visual search for change involvesa limited-capacity process that is not just formally similar to the attentional process used forstatic patterns, but involves largely the same mechanisms. Visual search for spatiotemporalpatterns can therefore be considered to be a direct extension of visual search for static patterns.As such, we not only have a sound theoretical framework that links change blindness to focusedattentionÑwe also have a sound methodological framework that can let us use this phenomenonto explore the various attentional processes involved in our perception of the world.
References
Chun, M.M., & Wolfe, J.M. (1996). Just say no: How are visual searches terminated when thereis no target present? Cognitive Psychology , 30, 39-78.
Cowan, N. (1998). Evolving conceptions of memory storage, selective attention, and theirmutual constraints with the human information-processing system. Psychological Review ,104, 163-191.
Garner, W.R. (1974). The Processing of Information and Structure . Potomac, MD: Erlbaum.
Horowitz, T.S., & Wolfe, J.M. (1998). Visual search has no memory. Nature , 394, 575-577.
Julesz, B. (1984). A brief outline of the texton theory of human vision. Trends in Neuroscience ,7, 41-45.
Kahneman, D., Treisman, A., & Gibbs, B. (1992). The reviewing of object files: Object-specificintegration of information. Cognitive Psychology, 24, 175-219.
Luck, S.J., & Vogel, E.K. (1997). The capacity of visual working memory for features andconjunctions. Nature , 390, 279-280.
Pashler, H. (1988). Familiarity and visual change detection. Perception & Psychophysics, 44,369-378.
Phillips, W.A. (1974). On the distinction between sensory storage and short-term visualmemory. Perception & Psychophysics, 16, 283-290.
Pylyshyn, Z.W., & Storm, R.W. (1988). Tracking multiple independent targets: Evidence for aparallel tracking mechanism. Spatial Vision, 3, 179-197.
Rensink, R.A. (1996). The attentional capacity of visual search under flicker conditions.Perception, 25 (suppl.), 2.
Rensink, R.A. (1997). How much of a scene is seen? The role of attention in scene perception.Investigative Ophthalmology & Visual Science, 38, 707.
Rensink, R.A. (this issue). The dynamic representation of scenes. Visual Cognition .
Rensink, R.A., & Enns, J.T. (1995). Preemption effects in visual search: Evidence for low-level grouping. Psychological Review , 102, 101-130.
Rensink, R.A., & Enns, J.T. (1998). Early completion of occluded objects. Vision Research , 38,2489-2505.
Rensink, R.A., O'Regan, J.K., and Clark, J.J. (1997). To see or not to see: The need for attentionto perceive changes in scenes. Psychological Science , 8, 368-373.
Visual Search for Change 15
Sagi, D., & Julesz, B. (1985). "Where" and "what" in vision. Science , 228, 1217-1219.
Simons, D.J. (1996). In sight, out of mind: When object representations fail. PsychologicalScience , 7, 301-305.
Simons, D., & Levin, D. (1997) Change blindness. Trends in Cognitive Sciences, 1, 261-267.
Schneider, W., Dumais, S.T., & Shiffrin, R.M. (1984). Automatic and control processing andattention. In R. Parasuraman & D.R. Davies (Eds.), Varieties of Attention (pp. 1-27).Orlando: Academic.
Townsend, J.T. (1990). Serial vs. parallel processing: Sometimes they look like Tweedledumand Tweedledee but they can (and should) be distinguished. Psychological Science , 1, 46-54.
Treisman, A., & Gormican, S. (1988). Feature analysis in early vision: Evidence from searchasymmetries. Psychological Review , 95, 15-48.
Ulrich, R., & Giray, M. (1989). Time resolution of clocks: Effects on reaction timemeasurementsÑgood news for bad clocks. British Journal of Mathematical and StatisticalPsychology , 42, 1-12.
Wolfe, J.M. (1994). Guided search 2.0: A revised model of visual search. Psychonomic Bulletin& Review , 1, 202-238.
Wolfe, J.M. (1996). Post-attentive vision. Investigative Ophthalmology & Visual Science, 37,S214.
Zelinsky, G.J. (1997). Eye movements during a change detection search task. InvestigativeOphthalmology & Visual Science, 38, 373.
Appendix A - Sensitivity of Performance to Off-time (ISI)
In the experiments here, off-times (ISIs) are always 120 ms. Earlier studies with grid-likepatterns showed that if this value is used, differences in the motion signals created by thechanges are not large enough to draw attention to the target (Phillips, 1974). Indeed, studies withletter arrays show that off-times as short as 67 ms may be sufficient for this (Pashler, 1988). Butthe displays used here are somewhat different than these, and so may still be affected by low-level motion signals, either as motion energy picked up by low-level sensors or as apparentmotion created by the low-level correspondence of successive items. Note that the simpleexistence of such signals is not the issue here: rather, it is whether the signals generated by theflickering targets are sufficiently distinct from those generated by the flickering distractors. Ifso, the increased salience of the targets might cause search to be sped up, thereby skewingestimates of attentional properties.
To determine if this might be the case, a set of control experiments had observers searchfor change in an array of rectangles, much as in Experiment 1. On-times were always 160 ms;off-times were 80, 120, or 160 ms. 10 observers participated in each experiment. Between-observer comparisons were carried out on both target-present and target-absent slopes.
The results are shown in Figure A1. For orientation, off-times of 120 ms led to slopes of53.4 ms/item (target present) and 101.7 ms/item (target absent). Reducing off-times to 80 ms ledto slopes of 47.9 and 82.0 ms/item, an insignificant different ( p > .6; p > .4). Increasing off-times to 160 ms led to slopes of 56.0 and 115.0 ms/item, which again were not significantlydifferent ( p > .7; p > .6). Even the differences between the 80 and 160 ms conditions were notfound to be significant ( p > .4; p > .15). A one-way ANOVA showed a similar lack of effect

Visual Search for Change 16
both for target-present slopes (F(2,27) = 0.06; p > .9) and target-absent slopes (F(2,27) = 0.88; p > .4).
------------------ Insert Figure A1 about here ------------------
A similar pattern was found for polarity. Off-times of 120 ms led to slopes of 48.3 and66.8 ms/item. Reducing off-times to 80 ms yielded slopes of 45.4 and 64.2 ms/item, aninsignificant difference ( p > .8; p > .8). Increasing off-times to 160 ms led to slopes of 49.5 and90.4 ms/item. Although the target-absent slopes here were somewhat larger, neither slopediffered significantly from its corresponding 120 ms value ( p > .9; p > .2). The 80 ms and 160ms conditions were not found to be significantly different ( p > .7; p > .1) A one-way ANOVAalso indicated no significant effect of off-time either for target-present (F(2,27) = 0.32; p > .7) ortarget-absent slopes (F(2,27) = 1.42; p > .2).
Taken together, these results show that differences in off-times do not cause largedifferences in speed for the particular cadences tested here. This is unlikely to occur if motionsignals affect search rateÑin particular, it would not be expected that speeds for the 80 ms and160 ms conditions would differ so little. Thus, for off-times of 120 ms there would seem to belittle influence of the motion signals generated by the flickering display items.
Appendix B - Speed-Accuracy Trade-offs
In the experiments carried out here, some conditions are particularly difficult. Twogeneral strategies are usually available to an observer to handle such a situation: decrease speedor decrease accuracy. Since either of these will do, speed and accuracy can be traded off invarious proportions. This presents a potential problem for the analyses of the results here, sincethe determination of some aspects of attention (e.g., capacity) depends upon the absolute valuesof the search slopes, and not just a relative speedup or slowdown. As such, it is important todetermine if the search rates in the experiments here are affected by a speed-accuracy trade-off.
The most obvious possibility in this regard is that the observer only checks a subset of theitems and then guesses a response, without having actually seen the target. The errors found inthe main set of experiments are mostly false negatives (target misses), something that might beexpected if the observer checks a subset of the items and then responds "no" if the target is notseen. If this were the strategy used, the speeds measured in the experiments would be artificiallyhigh: although an increase in RTs would be caused by the greater number of items scanned, thisnumber would be less than that actually in the display.
To determine if such a trade-off is being made, 12 observers were tested on two variantsof a difficult search experiment. Here, items were rectangles similar to those used in the mainexperiments. Half the items were vertical and half horizontal, and half were black and halfwhite, with all combinations being represented equally. To make this task as demanding aspossible, distractors continually changed orientation, while targets maintained a constantorientation. In the detection variant, a constant-orientation target was present half the time andabsent half the time. Observers simply reported whether the display did or did not contain atarget. In the identification variant, a constant-orientation target was always present; half thetime it was white, and half the time it was black. In this variant, observers reported the color ofthe target. For both variants, on-times were 640 ms and off-times 120 ms.
The detection variant is essentially a search task similar to that in the main experimentsreported here, except with a target chosen to make search as difficult as possible. The results ofthis experiment are shown in Figure B1. As is evident, this was an extremely difficult task, withtarget-present slopes averaging 254 ms/item, and target-absent slopes 468 ms/item. As for caseof the main experiments, errors were mostly misses; errors were as high as 16% when 10 itemswere displayed.
------------------ Insert Figure B1 about here ------------------
Visual Search for Change 17
To see whether the high error rate was due to observers skipping items, the same subjectswere run (in counterbalanced order) on the identification task. In this variant, a non-changingitem was always present, so that a definite termination condition always existed. As Figure B1shows, search here was again difficult: target-present slopes for both types of target averaged268 ms/item. Importantly, error rates here were low: average error was only 3.6%; even in theworst condition, errors did not exceed 5%. Thus, speed in this variant was not obtained byskipping items.
Comparing performance for identification against that for detection shows thatidentification is generally about 300 ms faster. However, within-observer comparison indicatedthat search slopes did not differ significantly ( p > .25). Thus, the speed for the detection (a taskrequiring most of the same operations as identification) was unlikely to be due to the high errorrate. Rather, errors were probably due to observers attending to all the items, but not alwaysprocessing them sufficiently to detect the presence (or absence) of change. As such, the searchslopes measured in the main experiments here need not be corrected to compensate for a speed-accuracy trade-off.

Visual Search for Change 18
Footnotes
1. The property of spatiotemporal continuity is sometimes described in terms of maintaining object identity. But"identity" often generates confusion with the rather different concept of semantic identity (cf. "identify") and so thisterm will not be used here. (For further discussion of this point, see Rensink, this issue).
2. There is of course a short-term memory for items that have been previously attended (see e.g., Cowan, 1988).However, in the view taken here this is not a visual memory supporting the formation object tokens . Rather, it is amore abstract memory containing information on object types . (For further discussion, see Rensink, this issue).
3. Performance for search is sometimes measured in terms of detection accuracy on briefly presented displays (e.g.,Sagi & Julesz, 1985). Accuracy measures are also natural for "one-shot" change-detection tasks (e.g., Pashler,1988). But RT slopes are a more common performance measure for static patterns. The issue is therefore whetherRT slopes can be reliably used for the flicker paradigm described here.
4. The fact that search for changing orientation is so difficult provides evidence that superposition cannot be carriedout on unattended structures, for otherwise observers could search for the unique cross-shaped item formed from thehorizontal and vertical rectangles. Instead, the old item is completely replaced by the new. Note that thisreplacement is at the level of proto-objects rather than pixels, for otherwise there would exist remnants of each ofthe two target items in those areas where they do not overlap, causing search to be easy.
5. Long term memory (LTM) may help observers hold on to presented material, and so inflate the estimates ofshort-term capacity. However, given that displays are on for relatively short amounts of timeÑtypically alternatinga few times per secondÑrelatively little information is likely to be transferred into LTM. Empirical support for thisposition comes from the capacity analysis of the results of Experiment 2, which shows that the hold for orientationdoes not change when display on-time times increase from 640 to 800 ms. Such a plateau would not be expected ifa significant amount of information was placed into LTM during the 800 ms of on-time.
6. A distribution of RTs can of course be obtained from search for static targets, as well as from "one-shot" change-detection tasks. However, the flicker paradigm described here is unique in that multiple distributions areobtainedÑone for each epoch (i.e., each interval corresponding to a particular display change). It is the distributionof responses between epochs that is of interest here.
7. The issue of memory effects is most easily described in terms of a serial model of attention, in which attentionoperates on an item-by-item basis. Assuming such a model, the question is whether the attention ever returns to anitem that it has previously encountered. Because of its simplicity, this description will be used when discussing theissue of memory traces.
However, this is not meant to imply that parallel models are to be dismissed in this regard. For a parallelmodel, attention acts concurrently on all items, and so the idea of a previously-attended item is no longer relevant.But memory effects are still an issue. For example, one question is whether the search process has to restart if allitems in the display change their location (Horowitz & Wolfe, 1998). Thus, this concern does not depend onwhether the search process is serial or parallel.
8. This conclusion still holds if the slower rate of 131 ms (obtained from the least-squares fit of hold estimates) isused, since there will be enough time to process at least 1600/131 = 12.2 items.
9. The distributions are normalized by a count that includes errors (such as responses made before epoch 1) andlong RTs (responses made after epoch 5). Consequently, the values for the epochs described can add up to less100%.

Visual Search for Change 19
Figure Captions
Figure 1. Coherence Theory. Early-level processes produce volatile structures rapidly and inparallel across the visual field. Focused attention acts as a hand to "grab" these structures andstabilize them. As long as these structures are being held, they form an individuated object withboth temporal and spatial coherence.
Figure 2. Schematic of flicker paradigm. An original and modified image continually alternate,with a brief blank field presented after each image. The observer views the display until thechange is seen. Since the target (a changing item) cannot be determined from any single display,attention must be applied to form stable structures that can be compared across the temporalgaps.
Figure 3. Results of Experiment 1 (Test for linearity). Upper graphs show results for changes inorientation; lower graphs show results for changes in polarity. [Note that scales on left hand sidediffer by a factor of 2 from those on right hand side.] In all cases, RTs have a strong lineardependence on set size, justifying the use of slope measures. For both types of change, target-absent slopes are about twice the value of target-present slopes, showing that the process is self-terminating.
Figure 4. Results of Experiment 2 (Performance as a function of on-time). (a) Search slopes.For both orientation and polarity, there is no great tendency for slopes to increase with on-time,at least for values up to 640 ms. (b) Baselines. These increase in direct proportion to theincrease in on-time. (For orientation, best-fitting line has slope 0.95 and intercept 561.8; r2 =0.98. For polarity, best-fitting line has slope 1.03 and intercept 568.8; r2 = 0.98.) In theinterests of clarity, orientation baselines have been lowered by 100 ms.
Figure 5. Duality of hold and search slope. (a) For process-limited search, search slope s is aconstant value P (the processing time); hold h increases in proportion to alternation time a, theproportionality constant being 1/P. (b) For memory-limited search, hold h is a constant value C(the capacity); search slope s increases in proportion to alternation time a, the proportionalityconstant being 1/C.
Figure 6. Hold as a function of on-time. Data here are the search slopes of Figure 4,transformed via equation (3) into holds. For both orientation and polarity, hold increases linearlywith on-time. But hold for orientation reaches an asymptote (i.e., capacity) of about 5, whereaspolarity hold continues to increase, reaching a value of about 9 at 800 ms. (For orientation, best-fitting line [in the range 80-640 ms] has slope 7.64 items/s; r2 = 0.92. For polarity, best-fittingline has slope 9.59 items/s; r2 = 0.99.) Dashed lines are linear extrapolations.
Figure 7. Results of Experiment 3 (Effect of static variation). (a) Effect of irrelevant staticvariation on search for orientation change. (b) Effect of irrelevant static variation on search forpolarity change. As is evident, there is no effect of variation for either type of change.
Figure 8. Results of Experiment 4 (Effect of dynamic variation). (a) Effect of irrelevantdynamic variation on search for orientation change. (b) Effect of irrelevant dynamic variation onsearch for polarity change. As is evident, only polarity change is affected by dynamic variation;this is limited to a slight (70 ms) increase in baselines.
Figure 9. Distribution of responses for high-capacity observers. For set sizes 2 and 6, mostresponses occur during epoch 1. For set size 10, target-present responses begin to appear inepoch 2, while more target-absent responses are found in epoch 2 than in epoch 1. This patternis consistent with a median capacity estimate of 8.0 items, but not 16.0 items.

Visual Search for Change 20
Figure 10. Distribution of responses for low-capacity observers. For set size 2, most responsesoccur during epoch 1. For set size 6, target-present responses begin to appear in epoch 2, whilemore target-absent responses are found in epoch 2 than in epoch 1. This pattern is amplified forset size 10, where most target-present responses are spread over the first three epochs, and target-absent responses occur most often in epoch 3. This pattern is consistent with a median capacityestimate of 4.2 items, but not 8.4 items.
Figure A1. Change-detection performance as a function of off-time. (a) Orientation changes.For all three off-times tested, target-present slope was essentially the same. Target-absent slopetended to increase somewhat with off-time, but this increase was not significant. (b) Polaritychange. Again, target-present slopes for all three off-times were much the same, with target-absent slopes showing a slight (though insignificant) increase with off-time.
Figure B1. Detection vs. identification. For both tasks, target-present slopes are largely thesame, while baselines for identification are lower by about 300 ms.

Visual Search for Change 21

Visual Search for Change 22
Visual Search for Change 23

Visual Search for Change 24

Visual Search for Change

Visual Search for Change 26

Visual Search for Change 27

Visual Search for Change 28
Visual Search for Change 29

Visual Search for Change 30

Visual Search for Change 31

Visual Search for Change 32

Visual Search for Change 33