visual resource stewardship conference - argonne...
TRANSCRIPT
Conference Program
November 7‐9, 2017, Argonne National Laboratory, Lemont, IL 60439
2
Visual Resource Stewardship Conference: Landscape and Seascape Management
in a Time of Change
November 7‐9, 2017 Argonne National Laboratory
Lemont, IL 60439 Advanced Photon Source (APS) Conference Center
Building 402 http://vrconference.evs.anl.gov
Please join us as we come together as a community to share ideas and
discuss the issues we face in protecting visual resources in an era of major
landscape change, and at the dawn of unprecedented change to our
national seascapes.
Registration is open.
The registration form is at http://vrconference.evs.anl.gov.
The registration fee is $200 (USD), $50 for students.

3
CONFERENCE STEERING COMMITTEE
Robert Sullivan, Argonne National Laboratory (Chair)
Paul Gobster, U.S. Department of Agriculture, Forest Service
John McCarty, U.S. Department of Interior, Bureau of Land Management
Mark Meyer, U.S. Department of Interior, National Park Service
James Palmer, Scenic Quality Consultants
Rick Smardon, State University of New York
CONFERENCE PARTNERS
Argonne National Laboratory
U.S. Department of Agriculture, Forest Service
U.S. Department of Interior, Bureau of Land Management
U.S. Department of Interior, National Park Service
State University of New York,
College of Environmental Science and Forestry

4
5
GETTING TO ARGONNE
Argonne is easily accessible by car or public transportation from downtown Chicago, as well as from Chicago's two
airports. To reach Argonne from O'Hare International Airport, take I‐294 south to I‐55. Exit west on I‐55 (toward St.
Louis) and continue for about four miles to Cass Avenue. Exit south on Cass and turn right at the Argonne sign on
Northgate Road, immediately south of I‐55. Follow Northgate Road to the Argonne Information Center.
To reach Argonne from Midway Airport, take Cicero Avenue north to I‐55. Enter I‐55 south and continue for about 14 miles to Cass Avenue. Exit south on Cass and turn right at the Argonne sign on Northgate Road, immediately south of I‐55. Follow Northgate Road to the Argonne Information Center (Building 224).
Please note: If using GPS directions, use 9700 S. Cass Avenue, Lemont, IL 60439 as the address (Argonne, IL is not recognized as the correct address). All visitors must check in at the Visitor’s Center to pick up their visitors badge/gate pass. Visitor gate passes are available for pickup at the Argonne Information Center (Building 224) at the Main Gate entrance off Cass Avenue between the hours of 6:30 a.m.–5:00 p.m. Monday–Friday. Once you have checked in at the visitor’s center and obtained your pass you will proceed past the security gate and turn left on Outer Circle Drive; pass Eastwood Drive, Southwood Drive, and Meridian Road; and then turn left at the Advanced Photon Source and proceed past the Argonne Guest House (Bldg. 460) to the APS Conference Center (Building 402). Signs along the way direct you to the Conference Center. Registration is in the lobby of building 402, and the conference rooms (Auditorium and Rooms E1100‐E1200) are located off the lobby.
A valid driver’s license is required to pick up your visitors pass at the visitors center. In addition, Argonne accepts the following alternate access control options:
U.S. passport Original school‐ or university‐issued ID or state‐issued firearms/concealed carry license that contains a
photograph PLUS a birth certificate Original school‐ or university‐issued ID or state‐issued firearms/concealed carry license that contains a
photograph PLUS a Social Security card All federally issued identification All HSPD‐12 cards All photo IDs from other DOE/NNSA Laboratories
Badge and Gate Pass Requirements:
Wear your badge or gate pass conspicuously, photo side out, in a location above the waist and on the front of the body while you’re on Argonne property.
Protect your badge or gate pass against loss, theft or misuse. Badges and gate passes should not be altered, photocopied, counterfeited, reproduced, photographed or
posted on the Internet. When not on U.S. Department of Energy‐owned or leased property, badges should be removed or obscured
from visual access. Report lost or stolen badges immediately to Argonne Protective Force.
6
TABLE OF CONTENTS
CONFERENCE PROGRAM ........................................................................................................................................................ 7
KEYNOTE SPEAKER .................................................................................................................................................................. 9
TECHNICAL BREAKOUT SESSIONS 1A AND 1B ....................................................................................................................... 10
TECHNICAL BREAKOUT SESSIONS 2A AND 2B ....................................................................................................................... 11
TECHNICAL BREAKOUT SESSIONS 3A AND 3B ....................................................................................................................... 12
TECHNICAL BREAKOUT SESSIONS 4A AND 4B ....................................................................................................................... 13
TECHNICAL BREAKOUT SESSIONS 5A AND 5B ....................................................................................................................... 14
TECHNICAL BREAKOUT SESSIONS 6A AND 6B ....................................................................................................................... 15
ABSTRACTS ............................................................................................................................................................................ 16
LODGING INFORMATION ...................................................................................................................................................... 63
FOR MORE INFORMATION .................................................................................................................................................... 64
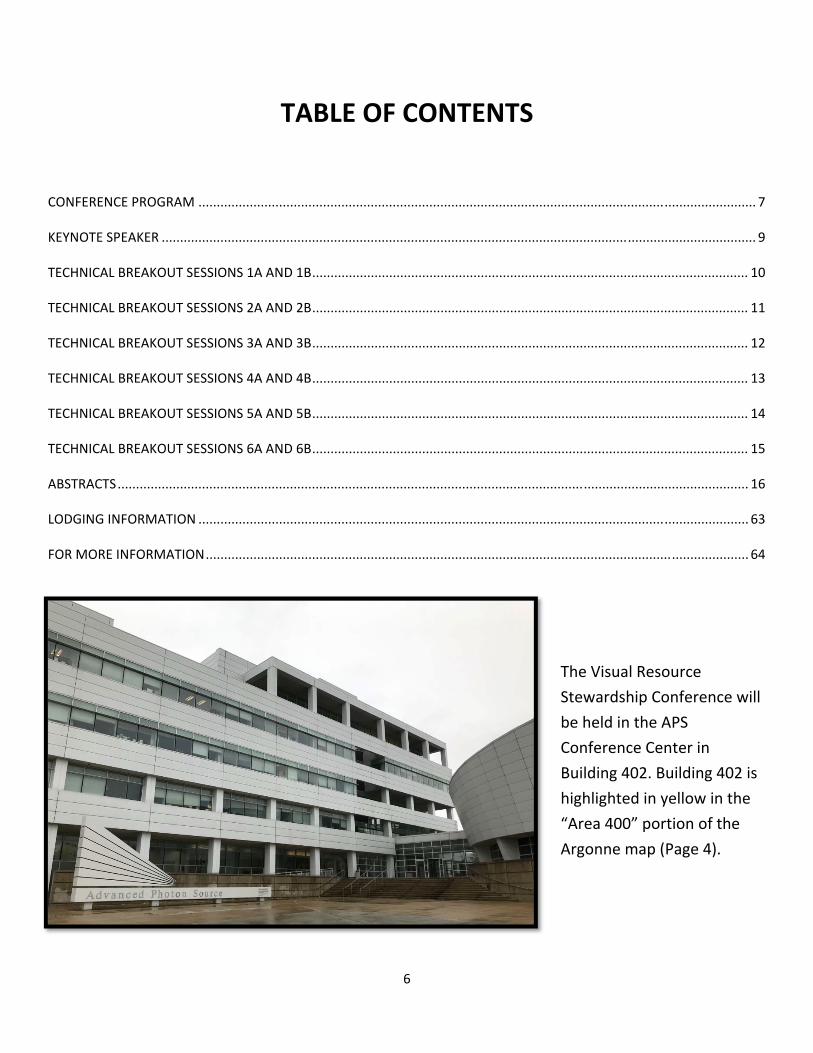
The Visual Resource
Stewardship Conference will
be held in the APS
Conference Center in
Building 402. Building 402 is
highlighted in yellow in the
“Area 400” portion of the
Argonne map (Page 4).

7
VISUAL RESOURCE STEWARDSHIP CONFERENCE PROGRAM
Tuesday, November 07, 2017
7:30 am to 8:30 am Registration (APS Conference Center, Bldg. 402, Lobby)
8:30 am to 8:45 am Welcome (APS Auditorium) Robert Sullivan, Argonne National Laboratory
8:45 am to 9:45 am Keynote Address: On Values, Metaphors, and Realities: How Do You Take in the Glory of a Dandelion? (Auditorium) Dr. David Maddox, The Nature of Cities
9:45 am to 10:00 am Break (Auditorium)
10:00 am to 11:00 am Plenary Session: New Directions and Challenges in Federal Stewardship of Visual Resources (Auditorium) Moderated by Brad Cownover, U. S. Forest Service
11:00 am to 11:45 am Plenary Session: Scenic America ‐ Taking the Long View (Auditorium) Mark Falzone, Scenic America
11:45 am to 1:15 pm Lunch (Argonne Guest House Restaurant, Bldg. 460)
1:15 pm to 2:45 pm Guided Discussion: Scenic Value Assessment & Quantification (Auditorium) Richard Smardon, State University of New York, and Robert Ribe, University of Oregon
2:45 pm to 3:00 pm Break (Auditorium)
3:00 pm to 4:30 pm Technical Breakout Sessions 1a (Rm. A1100) and 1b (Rm. E1100/1200) (See page 10)
4:30 pm to 5:15 pm
5:30 pm‐7:30 pm
Plenary Session: Protecting Night Skies and Naturally Dark Conditions in National Parks (Auditorium) Frank Turina, National Park Service Evening Reception (Freund Lodge, Bldg. 600– shuttle bus from APS Conference Center will be provided)

8
CONFERENCE PROGRAM
Wednesday, November 08, 2017
8:00 am to 9:30 am Technical Breakout Sessions 2a (Rm. A1100) and 2b (Rm. E1100/1200) (See page 11)
9:30 am to 10:15 am Break (Auditorium)
10:15 am to 11:45 am Technical Breakout Sessions 3a (Rm. E1100/1200) and 3b (Auditorium) (See page 12)
11:45 am to 1:15 pm Lunch (Argonne Guest House Restaurant, Bldg. 460)
1:15 pm to 2:45 pm Guided Discussion: Building Visual Resource Professional Capacity and Community (Auditorium) Robert Sullivan, Argonne National Laboratory, and James Palmer, Scenic Resource Consultants
2:45 pm to 3:00 pm Break (Auditorium)
3:00 pm to 4:30 pm Technical Breakout Sessions 4a (Rm. E1100/1200) and 4b (Rm. A1100) (See page 13)
4:30 pm to 5:15 pm Plenary Session: The Role of the Public in Visual Impact Assessment (Auditorium) James Palmer, Scenic Resource Consultants, and Robert Sullivan, Argonne National Laboratory
Thursday, November 09, 2017
8:00 am to 9:30 am Technical Breakout Sessions 5a (Rm. A1100) and 5b (Rm. E1100/1200) (See page 14)
9:30 am to 9:45 am Break (Auditorium)
9:45 am to 11:30 am
11:30 am to 12:00 pm
Technical Breakout Sessions 6a (Auditorium) and 6b (Rm. E1100/1200) (See page 15) Closing Remarks (Auditorium) Conference Steering Committee
9
KEYNOTE SPEAKER
David Maddox, Executive Director, The Nature of Cities
David Maddox is committed to the
health of the natural environment
and its importance for the creation of
sustainable, resilient, livable, and
just cities. After a PhD in ecology and
statistics at Cornell he spent 10 years
at the Nature Conservancy working
on climate change and stewardship.
In 2012, David founded and is
Executive Director of The Nature of
Cities, a transdisciplinary essay and discussion site—with 600+
writers from around the world, from scientists to civil society,
designers to artists—on cities as ecosystems of people, nature, and
infrastructure. He is also a composer, playwright, and theatre
artist. He lives in New York City.
10
TECHNICAL BREAKOUT SESSIONS 1A AND 1B Session 1a (Tuesday 3:00‐4:30 PM, Rm. A1100)
Establishing and Protecting Visual Resource Values
Cultural Ecosystem Services as Part of Scenic Resource Management?
Richard Smardon, State University of New York
Evidentiary Challenges in Bringing Cultural Ecosystem Services into Visual Resource
Stewardship: A Model of Landscape Evaluation for Planning
Robert Ribe, University of Oregon
Legal Powers to Protect Scenery
John Nagle, University of Notre Dame
Session 1b (Tuesday 3:00‐4:30 PM, Rm. E1100‐1200)
Identifying Visual Resource Values I
Community Forestry Practice and Visible Stewardship: A Case Study Evaluation in British
Columbia
Ashley Smith, Indigenous and Northern Affairs Canada; and Stephen Sheppard, University of
British Columbia
Long Distance Landscapes: Conducting a Baseline Visual Assessment for the Pacific
Northwest National Scenic Trail
Brad Cownover and Matthew Ramich, United States Forest Service
Getting in the Game: A National Park Service Approach to Visual Resource Inventory
Melanie Peters, Ksienya Taylor, Mark Meyer, National Park Service; and Robert Sullivan,
Argonne National Laboratory

11
TECHNICAL BREAKOUT SESSIONS 2A AND 2B Session 2a (Wednesday 8:00‐9:30 AM. Rm. A1100)
Identifying Visual Resource Values II
Giving Landscapes a Voice: Using Social Media and Web‐based Technologies in BLM’s
Visual Resource Inventory Process
Allysia Angus, Bureau of Land Management; Chris Bockey and Whitney May, Logan
Simpson Design
The Use of Crowdsourced and Georeferenced Photography to Aid in Visual Resource
Planning and Conservation
Lacey Goldberg, The Pennsylvania State University; Timothy Murtha, University of Florida;
and Brian Orland, University of Georgia
Identifying the Valued Ordinary, as a Step toward Scenic Landscape Conservation
Brian Orland and J. Calabria, University of Georgia; Lacey Goldberg, and Tara Mazurczyk,
The Pennsylvania State University; Timothy Murtha, University of Florida; M. Thomas, M.
Welch‐Devine, and A. Wolfe, University of Georgia
Session2b (Wednesday 8:00‐9:30 AM, Rm. E1100/1200)
Visual Resources in Urban Environments
Visual Resource Stewardship at the Neighborhood Scale: Measuring Small‐Scale
Landscape Change in Response to a Vacant Land Reuse Program
Paul Gobster, United States Forest Service; William Stewart, Douglas Williams, and Carena
van Riper, University of Illinois; and Allison Grenen, Northwestern University
Documenting and Modeling Care as a Visual Resource of Disinvested Urban
Neighborhoods
Joan Iverson Nassauer, Noah Webster, and Lanfei Liu, University of Michigan
A Visual Analysis Methodology Applied in Urban Environments: Public Participation and
Alternatives Analysis
Darrin Gilbert and Jason Pfaff, Power Engineers, Inc.
12
TECHNICAL BREAKOUT SESSIONS 3A AND 3B Session 3a (Wednesday 10:15‐11:45 AM, Rm. E1100/1200)
Cultural Resources in Scenic Landscapes
Viewing the Landscape of the George Washington Memorial Parkway
Paul Kelsch, Virginia Tech
Preserving the Cultural and Visual Character of the Blue Ridge Parkway’s Historic
Designed Motor Road Landscape
Gary Johnson, National Park Service (Retired)
Clearing Trails: Proven Methods for Organizing the Complexities of National Historic Trail
Impact Analysis
Craig Johnson, Environmental Planning Group, LLC
Session 3b (Wednesday 10:15‐11:45 AM, Auditorium)
Visual Resource Programs and Planning
Protecting Scenery at Multiple Scales
John McCarty, Bureau of Land Management, and Carol McCoy, National Park Service
Protecting America's Treasured Landscapes: The National Park Service Visual Resources
Program Mark Meyer, National Park Service and Robert Sullivan, Argonne National
Laboratory
Scenic Resource Management and US Forest Service Forest Planning
Nancy Brunswick, United States Forest Service
13
TECHNICAL BREAKOUT SESSIONS 4A AND 4B Session 4a (Wednesday 3:00‐4:30 PM, Rm. E1100/1200)
Visual Resource Management Approaches and Applications
Integrating Visual and Cultural Resource Evaluation and Impact Assessment for
Landscape Conservation Design and Planning
Tara Mazurczyk, The Pennsylvania State University; Timothy Murtha, University of Florida;
Lacey Goldberg, The Pennsylvania State University; and Brian Orland, University of Georgia
Cascade Head Scenic Research Area: Protecting Place along the Oregon Coast; Managing
for a Law that Gives Practical Consideration to Our Ties to a Landscape
Jessica Dole, United States Forest Service
Visual Resources, an Integral Part of Park Resource and Visitor Use Management
Planning
Gary Johnson, National Park Service (Retired)
Session 4b (Wednesday 3:00‐4:30 PM, Rm. A1100)
Visual Resource Research and Methodology Issues
Ecology of Scale in Visual Landscape Assessments
Richard Sutton, University of Nebraska
Collaborative Research to Determine Visual Impact Assessment Best Practices
James Palmer, Scenic Resource Consultants
Comparing Visual Impact Analysis under the National Environmental Policy Act and
Section 106 of the National Historic Preservation Act
Robert Sullivan, Argonne National Laboratory; Mark Meyer, National Park Service; and
Daniel O’Rourke, Argonne National Laboratory
14
TECHNICAL BREAKOUT SESSIONS 5A AND 5B Session 5a (Thursday 8:00‐9:30 AM, Rm. A1100)
Renewable Energy Impact Assessment and Mitigation
An Overview of Visual Impact Analysis for Offshore Wind Energy
Richard Warner, Bureau of Ocean Energy Management
The Maine Wind Energy Act in a Time of Change
Terrence DeWan, Terrence J. DeWan and Associates
Land Art Generator Initiative
Elizabeth Monoian and Robert Ferry, Land Art Generator Initiative
Session5b (Thursday 8:00‐9:30 AM, Rm. E1100/1200)
Visualization/Simulation 1
Real‐time Landscape Assessment—The Claytor Lake Visual Management Study
Patrick Miller and Peter Sforza, Virginia Tech
Expanding the Use of Visualization Technology—3D Modeling
Tracy Perfors, Bureau of Land Management
Exploring Visualization Tools for Communicating Natural Resource Management
Information
Kevin Colby and Kelly Ortiz, United States Forest Service

15
TECHNICAL BREAKOUT SESSIONS 6A AND 6B Session 6a (Thursday 9:45‐11:30 AM, Auditorium)
Visualization/Simulation 2
Visualizing Landscape Impacts: The Development and Application of a New Spatial
Analysis Tool
Brent Chamberlain, Kansas State University
Modeling Coastal Sedimentation and Erosion for Design Applications within the Field of
Landscape Architecture and Architecture
Aidan Ackerman and Jonathan Cave, Boston Architectural College
U3D‐DSS: A Novel Decision Support System for Community Directed Green Infrastructure
Design
Mark Lindquist, Victoria Campbell‐Arvai, Alec Foster, Shannon Sylte, and Frank Deaton,
University of Michigan
Emerging Technologies for Visual Resource Management
Jason Pfaff and Shawn Jackson, Power Engineers, Inc.
Session 6b (Thursday 9:45‐11:30 AM, Rm. E1100/1200)
Visual Impact Mitigation
Effective Integration of Visual Analyses, Mitigation, and Reclamation for Linear Projects
Craig Johnson, Environmental Planning Group, LLC
Mitigating Visual Impacts of Utility‐Scale Energy Projects
Joseph Donaldson, Ecology and Environment, Inc.
Reclaiming Visual Stewardship in Tucson, Arizona—Is It Possible?
Ellen Alster, Pima County Department of Transportation
Surface Color Treatment of Transmission Line Structures
Brandon Colvin, Bureau of Land Management
16
ABSTRACTS
PLENARY SESSIONS AND GUIDED DISCUSSIONS
All plenary sessions and guided discussions will take place in the APS Auditorium.
~*~*~*~*~*~*~*~*~*~*~*~*~*~*
Plenary Session (Tuesday 10:00 AM‐11:00 AM)
New Directions and Challenges in Federal Stewardship of Visual Resources
Matthew Arnn, Chief Landscape Architect, United States Forest Service
John McCarty, Chief Landscape Architect, Bureau of Land Management
Mark Meyer, Visual Resource Specialist, National Park Service
Richard Warner, Cultural Resources Specialist, Bureau of Ocean Energy Management
Abstract
The need to protect and preserve natural, cultural, and scenic resources is an escalating imperative for
those tasked with managing public lands and waters. The recent increase in onshore and offshore energy
development activities compromises critical visitor experiences when it encroaches on landscapes and
seascapes cherished for their naturalness, scenic beauty, and cultural significance. National priorities for
energy development, which include conventional and renewable energy resources, have placed unusually
high pressure on landscapes and offshore areas that are ideal for solar, wind, geothermal, oil and gas, and
other energy‐related development. The demand for new electric transmission and pipeline corridors to
carry this energy to market may also potentially alter the landscape’s visual character. The role of public
land and offshore management agencies involves accommodating the demand for resource development
while protecting the visual value and the integrity of its natural character.
The Bureau of Land Management, US Forest Service, National Park Service, and Bureau of Ocean Energy
Management are tasked with managing public lands and seascapes, but the agencies also authorize
onshore/offshore energy development. Representatives from the agencies will update the audience on
current directions taken to meet the escalating challenges in visual resource stewardship. These agencies
share many of the same challenges; however, their approaches to resolve these common issues may vary.
For this presentation, each agency prepared a brief written synopsis on agency history with managing visual
resources, new directions in visual resource stewardship policy, and the challenges they face.
17
Plenary Session (Tuesday 11:00 AM‐11:45 AM)
Scenic America ‐ Taking the Long View
Mark Falzone, President, Scenic America
Abstract
The modern movement to preserve and enhance the visual character of this country was set in
motion in 1965 by President and Lady Bird Johnson, Laurance S. Rockefeller and other visionaries
who saw and sought to remedy a number of serious and mounting threats to America the
Beautiful. That year’s White House Conference on Natural Beauty and signing of the Highway
Beautification Act should have marked the beginning of a new era in scenic conservation.
But fifty years later the threats to America’s visual environment have never been greater, and we
as citizens stand at a critical juncture in determining how our country looks. Do we want America,
fifty years from now, to be full of homogenized landscapes, tarnished roadsides and unattractive
communities? Or do we want to live in a country that values and honors its natural and built
environments?
Scenic America believes that all Americans deserve to live, travel through, and visit places that are
beautiful and unique. To that end we have assembled Scenic America ‐ Taking the Long View, a
guide to realizing the goals of our visionary predecessors like the Johnsons and Rockefellers. The
paper is divided into five topics with overarching challenges to scenic beauty in America,
accompanied by bold but achievable solutions to those problems. The topics include:
Placemaking: Preserving and Enhancing Community Character
Honoring Parks and Open Spaces
Celebrating Byways and Gateways
Mitigating Visual Impacts of Overhead Wires
Promoting Beautiful Highways
18
Guided Discussion (Tuesday 1:15 PM‐2:45 PM)
Scenic Value Assessment and Quantification
Discussion to be led by:
Richard Smardon PhD SUNY Distinguished Service Professor Emeritus,
Dept. of Environmental Studies SUNY college of Environmental Science and Forestry
and
Robert G. Ribe, Institute for a Sustainable Environment & Department of Landscape
Architecture, University of Oregon
This guided discussion will examine the following questions:
1. Should we move toward assessment quantification of “scenic quality" as an ecosystem
service?
2. How should we assess or disaggregate "scenic quality" in order to more accurately and
completely value it?
Key References
Chan K. M.A., T. Satterfield, J. Goldstein (2012) Rethinking ecosystem services to better address
and navigate cultural values. Ecological Economics 74: 8–18
doi:10.1016/j.ecolecon.2011.11.011
Craik, K.H. and E.H. Zube (1976) Issues in Perceived Environmental Quality Research. Institute for
man and Environment, U. Mass, Amherst. Report of Energy‐Related General Research Office,
National Science Foundation (I have scanned portions of this –there is also a book)
Gobster, P. H.; J. I. Nassauer, T. C. Daniel and G. Fry (2007) The shared landscape: what does
aesthetics have to do with ecology? Landscape Ecology 22:959–972
DOI 10.1007/s10980‐007‐9110‐x
I. C. Ivine, _ T. Greaver, J. Phelan, R. D. Sabo, and G. Van Houtven (2017) Terrestrial acidification
and ecosystem services: effects of acid rain on bunnies, baseball, and Christmas trees. Ecosphere
8(6): e 01857. 10.1002/ecs2.1857
Landers, D.H. and A. M. Nahilk (2013) Final Goods and Services Classification System (FEGS‐CS
EPA/600/R‐13/ORD‐004914 US Environmental Protection Agency, Office of Research and
Development, Wash DC, 89p.
19
Millennium Ecosystem Assessment (2005) Ecosystems and Human Well Being: Wetlands and
Water Synthesis. Water Resources Institute, Wash, DC.
Ringold, P. L., J. Boyd, D. Landers, and M. Weber (2013) What data should we collect? A
framework for identifying indicators of ecosystem contributions to human well‐being. Frontiers in
Ecology and the Environment doi: 10.1890/10156
Roly Russell, A. D. Guerry, P. Balvanera, R. K. Gould, X. Basurto, K. M.A. Chan, 6 S. Klain, J. Levine,
and J. Tam (2013) Humans and nature: How knowing and Experiencing nature affect well being
Annul. Rev. Environ. Resour. 2013. 38:6.1–6.30 doi 10.1146/annurev‐environ‐012312‐110838
US Environmental Protection Agency (2009) Valuing the Protection of Ecological Systems and
Services; A Report to the EPA Science Advisory Board. EPA‐SAB‐09‐012, USEPA Wash DC.
20
Plenary Session (Tuesday 4:30 PM‐5:15 PM)
Protecting Night Skies and Naturally Dark Conditions in National Parks
Frank Turina, PhD, Program Manager for Policy Planning and Compliance, National Park Service
Natural Sounds and Night Skies Division
Abstract
Nighttime views and environments are among the critical park features the National Park Service
protects. Protecting views of naturally dark skies enhances the qualities of solitude and
undeveloped wilderness character and provides conditions that animals depend on for survival
and park visitors cherish. The scenic quality of night skies and naturally dark environments also
help visitors connect to the cultural resources and historic settings that parks seek to preserve.
However, preserving the scenic quality of night skies is one component of protecting naturally dark
conditions and natural cycles of light and dark in parks. The NPS recognizes a naturally dark night
sky as more than a scenic canvas; it is part of a complex nocturnal ecosystem that supports both
natural and cultural resources. NPS policy states that the Service will preserve, to the greatest
extent possible, the natural lightscapes of parks, protect natural darkness and other components
of the natural lightscape, minimize light that emanates from park facilities, and seek the
cooperation of park visitors, neighbors, and local government agencies to prevent or minimize the
intrusion of artificial light into parks. Recent and rapid changes in lighting technologies and
applications have produced challenges and opportunities for meeting this policy objective.
This presentation will address NPS policy for protecting park resources and values from the effects
of stray light, and discuss the importance of night skies and natural cycles of light and dark on park
visitors and wildlife. The effects of stray light on park resources will be covered and the six
principles of sustainable outdoor lighting will be presented. This presentation will also focus on
recent technological advances such as lighting networks, smart controls, and enhanced spectral
characteristics that can help parks and communities minimize the effects of stray light on natural
and cultural resources and protect naturally dark condition for future generations of park visitors.
21
Guided Discussion (Wednesday 1:15 PM‐2:45 PM)
Building Visual Resource Professional Capacity and Community
Discussion to be led by Robert Sullivan, Visual Resource Scientist, Argonne National Laboratory,
and James Palmer, Scenic Resource Consultants
Abstract
Like any profession, visual resource management and planning relies in part on a foundation of
professional principles and standards, accepted practices and methods, and research and
development activities. Fundamental to the healthy development of all of these is a community of
practitioners that share ideas and opinions, review and critique each other’s work, collaborate to
obtain funding and conduct projects, share research and project information, identify principles
and set standards where appropriate, and importantly, advise and learn from each other. Critical
to the health of the community of practitioners is education at the university level, which leads to
a common understanding of the scientific and professional knowledge required for competent
practice. And finally, critical to the profession and our shared goal of informed and effective visual
resource management is support from outside the profession, including support from the public,
support from advocacy groups, and from government agencies and leaders to ensure that visual
resource concerns are adequately considered in land and water resource planning and decision
making.
In the U.S., visual resource professionals are few in number, and widely scattered. The discipline
covers many topic areas. Some of us work in relative isolation. Most of us either work for federal
and state agencies, in private practice, or at universities, but there is not always good information
exchange between these groups. These circumstances make effective communication and
collaboration difficult, but it is important to achieve the best quality in our work, and to our
success as individuals and as a profession. There is a cost associated with the lack of cohesion in
our community. Too many of us are working on the same problems without knowledge of each
other’s work. In an era of tightening budgets, we may be missing opportunities for cost‐effective
collaboration. Important research needs are unmet. We lack standards and accepted practices and
methods in a critical time for our profession, as our national landscapes and seascapes are being
transformed by energy development, climate change and other forces. While there is public
support for visual resources, there are few advocates for our profession and its goals. We have no
dedicated professional society, and the principles and methods we use are taught in relatively few
educational institutions.

22
This guided discussion session will be devoted to discussing how we can build a stronger and more
effective community of practice that fosters the sound development and functioning of the key
elements of the foundation described above. We will present the results of an online survey of
conference attendees that asks questions about their perceived needs for better information
dissemination regarding visual resource issues and better communication with peers. The survey
also asks about preferences for various approaches and communication tools that could be used
to foster the sharing of ideas, research results, opportunities, advice, and knowledge. Lastly, the
survey asks about the perceived need for an organization for visual resource professionals.
After presenting the survey results, we will discuss possible paths forward to take action (if it is
desirable) to employ one or more of the approaches or tools discussed in the survey, or others we
identify. We will address the key challenges that have thwarted similar efforts in the past. Desired
outcomes of this preliminary discussion are a short list of candidate approaches/tools, and a list of
people willing to participate in developing a plan to implement at least one of them.
23
Plenary Session (Wednesday 4:30 PM‐5:15 PM)
The Role of the Public in Visual Impact Assessment
Discussion to be led by James Palmer, Scenic Resource Consultants, and Robert Sullivan, Visual
Resource Scientist, Argonne National Laboratory
Abstract
It is appropriate that people participate in decision making that may seriously affect their wellbeing.
The unmistakable trend is toward greater public participation in environmental decision making,
beyond simply identifying issues in the EIS scoping process and commenting on draft EISs. Increasingly,
the public is involved throughout the visual impact assessment (VIA) process, identifying valued places
and views, and providing project‐specific feedback about potential visual impacts. Through the use of
visual simulations and user intercept surveys, viewers are indicating—in the field—the acceptability of
particular proposed projects that may affect the places they value, whether it is their community or
their favorite recreation spot.
The use of user intercept surveys and simulations offers several benefits for VIA. Viewers are sampled
in the potentially affected area, while engaged in location‐appropriate activities that influence their
level of engagement with the surrounding scenery. The survey includes a realistic representation of the
proposed project that is referenced as they make judgments about how the visual change would affect
their enjoyment and future use of the setting. The user intercept survey with simulations offers a much
more realistic setting for the public’s judgement about visual effects, and more importantly, allows a
sample of the potentially impacted users to directly communicate how they think the change will
impact them. Instead of a VIA professional speaking on their behalf about the potential effect on the
view, they speak for themselves.
Few would question the benefit of having people judge for themselves how they will be affected by a proposed visual change. The validity is increased by making these judgements while experiencing the setting where the change will be visible. However, photomontage simulations are only approximations of the potential visual change. In the best of situations, they are close approximations of the appearance of proposed facility at a given time of day in a given lighting situation. In the worst situations, they are serious misrepresentations. They are limited in their accuracy and realism, do not show motion, and lack the dynamic range and detail perceivable by the human eye. At best, simulations are snapshots of a possible reality. Problems with simulations can be very subtle, and it may take a trained professional to spot them. A knowledgeable VIA professional should be aware of the limitations of simulations, and should factor these limitations into their judgements about impacts. Is the public really seeing a complete and accurate representation of the future when they consider visual simulations? If they aren’t, can we really trust their judgements about project impacts? In this discussion, Jim Palmer and Bob Sullivan will start a group discussion by briefly offering
perspectives on the use of intercept surveys and simulations in VIA, and the larger issue of the roles of
the public and the professional in the VIA process. The audience will be invited to participate.

24
TECHNICAL BREAKOUT SESSIONS 1A AND 1B
Session 1a (Tuesday 3:00‐4:30 PM, Rm. A1100)
Establishing and Protecting Visual Resource Values
~*~*~*~*~*~*~*~*~*~*~*~*~*~*
Cultural Ecosystem Services as Part of Scenic Resource Management?
Richard Smardon PhD SUNY Distinguished Service Professor Emeritus,
Dept. of Environmental Studies SUNY college of Environmental Science and Forestry
http://www.esf.edu/faculty/smardon [email protected]
Abstract
Smardon and others (Gobster et al 2007) proposed development of a theory of ecological
aesthetics whereby individuals could learn to value landscapes such as wooded wetlands for their
intrinsic ecological value versus more surface artistic and culturally ingrained aesthetic value
(Smardon 1983, p. 208). Then we had the Millennium Ecosystem Assessment Project (2005) that
proposed the valuation of ecosystem services; regulatory, provisional, ecosystem support and
cultural service provided by nature to us—free of charge. The challenge that I propose to address
is can we utilize cultural ecosystem services (aesthetic, educational and recreational) derived from
scenic landscapes and seascapes for scenic resource management and assessment? In this
paper/presentation I propose to review the work done to date on assessing ecosystem cultural
services related to water based scenic landscape resources and then apply this to an Upstate New
York lake landscape.

25
Evidentiary Challenges in Bringing Cultural Ecosystem Services into Visual Resource Stewardship:
A Model of Landscape Evaluation for Planning
Robert G. Ribe
Institute for a Sustainable Environment & Department of Landscape Architecture
University of Oregon
Abstract
Incorporating broad cultural values and ecosystem services into visual landscape stewardship will
encounter major methodological challenges. To be sanctioned and effective environmental
assessment methods need to fit into the institutional frameworks in which they operate. Scenery
assessment methods, as opposed to the various theories and advocacy that support and contest
them, are arguably already well boxed in by legal constraints. Integrating cultural resource and
ecosystem service values may well violate these limits. Can these expansionary agendas be
robustly satisfied within democratic due process, rules of evidence and separation of powers?
A conceptual model is offered describing how acceptable landscape choices and appraisals are
made by integrating and normatively compounding rational/objective analysis, cultural/normative
narratives and sensible inputs. The theoretical and operational ways in which scenery assessments
play in this model in relation to scientific, legal and planning processes are described. Some
dysfunctional aspects are introduced, as well as how the ambitions of cultural ecosystem services
valuation may violate its basic precepts and theory by usurping political authority. A few
alternative theoretical solutions are explored in the directions of adding perceived cultural values
to the scope of landscape aesthetics, or the parametric valuation of scenery or scenery plus
cultural experiences as ecosystem services. These are founding wanting against basic democratic
governance principles and rejected in favor of traditional planning and impact assessment
methods and processes.
26
Legal Powers to Protect Scenery
John Copeland Nagle, John N. Matthews Professor, University of Notre Dame [email protected]
Abstract
There is a paradox at the heart of environmental law. The environmental quality that people value
the most is the environmental quality that is least likely to be protected by the law.
Scenic values provided much of the original impetus for conserving the environment in the United
States. One would never know that, though, from the ordinary records of environmental law.
Environmental law’s current focus emphasizes objective scientific values that are associated with
particular landscapes. Scenic values receive much less attention.
But if you look hard enough, there are many ways in which the law empowers federal, state, and
local governments to manage the surrounding landscape's appearance. The Organic Act lists scenic
preservation and enjoyment as the first responsibility of the National Park Service. The statutes
governing the Forest Service and the Bureau of Land Management direct those agencies to
consider visual resources in their management of federal public lands. Special entities such as the
Columbia River Gorge National Scenic Area and the Tahoe Regional Planning Agency must
prioritize scenic values. Scenic beauty must be considered whenever a federal agency conducts an
environmental impact statement.
Many state and local governments have their own laws designed to protect the appearance of
their most beautiful landscapes. California, Maine, and Hawai’i are among the leaders that
actively prohibit development that is inconsistent with scenic views. Teton County, Wyoming, is
one of many counties that employs zoning law to protect scenic views. Many cities have
designated special areas whose natural appearance they work to conserve.
Altogether, while the law is not nearly as protective of scenic beauty as one might expect, there
are many tools available for interested governments to conserve their visual resources.

27
Session 1b (Tuesday 3:00‐4:30 PM, Rm. E1100/1200)
Identifying Visual Resource Values I
~*~*~*~*~*~*~*~*~*~*~*~*~*~*
Community Forestry Practice and Visible Stewardship: A Case Study Evaluation in British
Columbia
Ashley Smith MRM, Indigenous and Northern Affairs Canada [email protected]
Stephen Sheppard Professor, Director CALP, UBC [email protected]
Abstract
This study’s findings suggest that biological, cultural and personal factors influence the
development of aesthetic landscape values within the sample communities. Respondents
expressed five categories of aesthetic landscape appreciation during the interview process: non‐
instrumental, ecological, recreational, visible stewardship and utilitarian. Despite variation in
aesthetic valuation of local landscapes, a preferential trend exists towards landscapes that
demonstrate visible stewardship, with higher levels of dispersed canopy retention. Interview
results indicate an overall satisfaction with management of visual quality by community forests.
Results of the Visual Quality Effectiveness Evaluation indicate the sample community forests in my
study have met, and in some cases surpassed, provincial expectations for maintaining and
enhancing visual quality on provincial Crown lands.

28
Long Distance Landscapes: Conducting a Baseline Visual Assessment for the Pacific Northwest
National Scenic Trail
Brad Cownover, United States Forest Service
Matthew Ramich, United States Forest Service
Abstract
This presentation includes technical information and discussion on the goals, methods, results
unique challenges, opportunities and lessons learned in the inventory of long distance landscapes.
Congress designated the Pacific Northwest National Scenic Trail (PNNST), or Pacific Northwest Trail
(PNT), in 2009. This long distance non‐motorized trail stretches from the Continental Divide to the
Pacific Ocean, traversing over 1,200 miles near the Canadian border across northern Montana,
Idaho, and Washington. The United States Forest Service is responsible for the administration of
the PNT. The Forest Service funded and carried out a baseline visual assessment of the entire trail
during Summer 2015, aiding development of the comprehensive management plan; required for
long term management of these trails crossing federal and non‐federal lands.
The baseline assessment documented the Trail’s existing conditions and unique landscape
characteristics, identifying potential risks to scenic resources’ protection; a primary purpose of
nationally designated scenic trails. Understanding these elements defines related areas of the
comprehensive management plan, including recreation settings, opportunities, and access.
Utilizing the concept of ecoregions delineated units (‘landscape rooms’) along the trail, providing a
framework for landscape units and associated character descriptions. Rooms were categorized by
physical appearance, viewing distance, natural integrity, visual quality/scenic attractiveness, etc.
Forest Service and Bureau of Land Management systems for assessing visual (scenic) resources
were utilized. Photographic and Google Earth imagery geo—referenced key trail observation
points. An InDesign document of field data effectively illustrates landscape character across
resource disciplines in the comprehensive management planning process, aiding in long term
monitoring.
29
Getting in the Game: A National Park Service Approach to Visual Resource Inventory
Melanie Peters, Natural Resource Specialist, Air Resources Division, National Park Service,
Ksienya Taylor, Natural Resource Specialist, Air Resources Division, National Park Service,
Mark Meyer, Visual Resource Specialist, Air Resources Division, National Park Service
Robert Sullivan, Visual Resource Scientist, Environmental Science Division, Argonne National
Laboratory [email protected]
Abstract
In 2013 the National Park Service launched a visual resource inventory method designed
specifically to meet NPS needs. Capturing visual experiences accurately and consistently across
diverse landscapes is a key goal. Because most visitors experience parks, first, through their eyes,
their visual experience of the park is important for their enjoyment and appreciation of park
resources.
In the inventory process, each view is mapped and described from the viewers’ perspective. Views
are also evaluated to capture both scenic quality and importance to the visitor experience. This
approach allows the NPS to assess and value visual resources in a holistic way.
Park staff from any background can gain the necessary skills with relatively brief training and field
practice. Because of the vast scale of many park landscapes and the dynamic nature of visual
resource pressures, the capacity of park staff to conduct inventory in a modular way is necessary
for making the inventory sustainable.
Inventory data can be used in spatial analysis to quickly show where views overlap, which portions
of the landscape are truly visible from a given view point, and what the composite value of all
intersecting views is. Robust inventory information allows managers to integrate visual resource
considerations into park planning and management. This is especially important when working
with partners beyond our boundaries to affect project proposals and target critical areas for visual
resource protection.
The NPS visual resource inventory method has already proven effective in diverse park landscapes
and is gaining more traction. Embracing our role in preserving and protecting visual resources is
critical to the continued viability of NPS areas as places of national significance into the future.
30
TECHNICAL BREAKOUT SESSIONS 2A AND 2B
Session 2a (Wednesday 8:00‐9:30 AM, Rm. A1100)
Identifying Visual Resource Values II
~*~*~*~*~*~*~*~*~*~*~*~*~*~*
Giving Landscapes a Voice: Using Social Media and Web‐based Technologies in BLM’s Visual
Resource Inventory Process
Allysia Angus, Landscape Architect / Land Use Planner
BLM Grand Staircase‐Escalante National Monument, [email protected]
Chris Bockey, Environmental Planner/Visual Resource Specialist
Logan Simpson, [email protected]
Whitney May, Environmental Planner/Visual Resource Specialist, Logan Simpson
Abstract
The Federal Land Policy and Management Act in 1976 mandated that the Bureau of Land
Management (BLM) manage public lands under the concept of multiple‐use while protecting
natural, historical, and cultural resources—including the protection of the quality of the scenic
values. Section 201 (a) states that an inventory of all public lands and their resources (including
scenic values) is to be prepared and maintained on a continuing basis. BLM administers over 300
million acres of the land in the United States.
In the early 1980s, BLM developed a Visual Resource Management Program to inventory and set
management objectives for the inherent scenic value of the lands they manage. The Visual
Resource Inventory (VRI) provides the foundation for management of the visual landscape setting
at a regional scale as well as the basis for analysis as projects and activities are planned. It also
provides the data to determine scarcity levels of a particular visual value.
One of the three components to conducting a VRI is gathering information to measure or evaluate
concern for scenic quality or sensitivity to change within the visual environment. The BLM system
quantifies sensitivity levels as high, medium or low by analyzing six indicators of public concern
which include Type of Users, Amount of Use, Public Interest, Adjacent Land Uses, Special Areas
and Other Factors that may provide indicators of visual sensitivity.

31
Historically, capturing the indicators identified above have been paper exercises relegated to BLM
staff and their knowledge of the area and the public they interact with. As VRIs have evolved,
discussions have led to different methods and approaches in having a more comprehensive and
inclusive process for obtaining sensitivity information so that it can be a useful tool in land
management decisions.
As part of the Grand Staircase‐Escalante National Monument (GSENM) VRI, GSENM staff is
currently working with Logan Simpson staff on the development of using web‐based interactive
survey platforms as the next generation of media for capturing and synthesizing data and
information related to visual sensitivity.
This panel‐based discussion will walk through previous iterations of sensitivity data gathering as
well as provide lessons learned during testing and implementation of current online data gathering
methodologies and processes.
32
The Use of Crowdsourced and Georeferenced Photography to Aid in Visual Resource Planning
and Conservation
Lacey Goldberg, Hamer Center for Community Design, The Pennsylvania State University
Timothy Murtha, College of Design, Construction & Planning, University of Florida
Brian Orland, College of Environment+Design, University of Georgia
Abstract
The advent of Web 2.0 and the growth of social media platforms have fostered an environment for
the documentation and sharing of landscape imagery. In addition to looking at the site scale, using
these big data allows for visual landscape assessment at the regional scale. At larger scales,
photographs may reveal broad patterns in the landscape including preference for certain land
cover types and ease (or lack of) access to visual and cultural resources. Studies have shown that
clustering of georeferenced photos indicates interest in a point of view within the landscape or a
particular visual or cultural resource. This clustering can also aid in prioritizing visual resource
conservation efforts by indicating preference for certain locations over others. Frequency of use,
“liking”, of photos recorded as metadata provides a metric of citizen evaluation, both local and
visitor, to the greater process of visual resource planning and conservation. Alternatively,
crowdsourced photography can document visual impacts of landscape change as experienced by
the people of the place. Sites like Google Earth, Panoramio and Flickr permit users worldwide to
upload and share georeferenced photographs, while others like FrackTracker.org archive
landscape impacts, in this case, those associated with development from the natural gas industry
all over the U.S. This paper uses the state of Pennsylvania as a case study example to discuss the
opportunities for crowdsourced and georeferenced photography to aid in visual resource
conservation and planning.

33
Identifying the Valued Ordinary, as a Step toward Scenic Landscape Conservation
Brian Orland, College of Environment+Design, University of Georgia
J. Calabria, College of Environment+Design, University of Georgia
Lacey Goldberg, Hamer Center for Community Design, The Pennsylvania State University
Tara Mazurczyk, Hamer Center for Community Design, The Pennsylvania State University
Timothy Murtha, University of Florida, College of Design, Construction & Planning, University of
Florida
M. Thomas, M. Welch‐Devine, and A. Wolfe, College of Environment+Design, University of Georgia
Abstract
The Georgia Scenic Byways program (GDOT, 2017) is a “grassroots effort … to identify, preserve,
promote and protect treasured corridors throughout the state.” There are fifteen such corridors
designated by Georgia DOT, their only protection is a restriction on roadside billboards. Despite
frequent avocation of the beauties of Georgia highways, there is no systematic articulation of the
physical attributes of a scenic landscape, how such attributes would be identified and thus
protected, nor the expertise or resources to devote to new discoveries. Furthermore, any state‐
wide initiative would likely miss features of local significance such as abandoned farms and
homesites, historic burial grounds or valued historic vistas—the landscape features to which
people are attached and that they might deem worthy of protection. This paper presents a model
“scenic beauty detector” using social media and augmented reality mechanisms to direct
interested citizens to examine road stretches with potential for identification as scenic highways
and to record their support and criteria for such designation. We argue that the characteristics of
valued scenic highways reside in the photographic records that people make with their
geolocation‐enabled cell phones that are then retrievable via tools such as Google Earth. We
further argue that other, undesignated stretches bearing the same “affordances” (Gibson, 1977)
would also be candidates for state designation. Citizen data collectors guided by GIS analyses that
locate these affordances via their smartphones augment existing records of known visual
resources with in situ evaluations, capturing photos and geolocation evidence for use in the
Georgia Scenic Byway designation process.
34
Session2b (Wednesday 8:00‐9:30 AM, Rm. E1100/1200)
Visual Resources in Urban Environments
~*~*~*~*~*~*~*~*~*~*~*~*~*~*
Visual Resource Stewardship at the Neighborhood Scale: Measuring Small‐Scale Landscape
Change in Response to a Vacant Land Reuse Program
Paul Gobster, United States Forest Service Northern Research Station‐Chicago [email protected]
William Stewart, Douglas Williams, and Carena van Riper, University of Illinois
Allison Grenen, Northwestern University
Abstract
Visual assessments are usually conceived of and applied to large‐area landscapes such as national
forests. Yet the visual resource is an important cultural ecosystem service at all scales of
landscape, from small sites to regional and national scales. In urban landscapes, the neighborhood
scale is particularly relevant to people’s everyday perception and experience of cities, and the
recent availability of high resolution aerial and street‐level imagery through sources such as
Google has opened up new opportunities to incorporate neighborhood scale visual assessments
into urban research and planning activities. In this study we adapted systematic social observation
and urban ecology vegetation assessment methods to identify visual signs of stewardship made by
local residents to vacant lots purchased through the Chicago Large Lot Program. Mowing and
weed removal and improvements such as gardens and fences express an aesthetic of care that can
communicate personal and community values. We were particularly interested in assessing how
these and other visual signs of condition and care changed as a function of residents’ participation
in the program, and in coding images of lots before and after the time of purchase we were able to
document important aspects of landscape change at the lot level. Large lot condition and care
were also positively related to the proximity and care of the purchaser’s previously owned
property on the block. And while block level changes were less apparent over the short time frame
of the study so far, we did find significant relationships between block level elements of care and
the percent of available large lots purchased on a block. We discuss these and other key findings
and the utility of the approach in advancing visual resource stewardship goals in the urban
landscape.
35
Documenting and Modeling Care as a Visual Resource of Disinvested Urban Neighborhoods
Joan Iverson Nassauer, School for Environment and Sustainability, University of Michigan
Noah Webster, and Lanfei Liu, Institute for Social Research, University of Michigan
Abstract
In two neighborhoods of Detroit, MI, USA, that were characterized by high residential vacancy
rates, we conducted a census of cues to care, vacant parcels, and abandoned houses on 8967
residential properties, including 3650 occupied properties. To measure these dimensions of care,
we developed an instrument and employed it to gather data from 2009 Google Street images,
which we subsequently field checked for changes in 2011. We extracted four binomial
independent variables from these data to describe all residential properties as having: good
landscape care, poor landscape care, property vacancy, house abandonment. We extracted two
dependent variables to describe occupied properties as cases in our analytic models: 1) the
presence of apparent mowing (no/yes) and; 2) other cues to landscape care measured on a four‐
point scale (1=no cues; 4=presence of flowers, hedges, lights, and/or ornaments). We used three
different distance metrics (Euclidean distance, Euclidean area, and Cadastral adjacency) to analyze
the effects of nearby parcel care on the care of occupied residential parcels. We found that care
of occupied parcels was related to: greater distance from the nearest abandoned house, fewer
abandoned homes located within 50 meters of the occupied parcel, and a greater number of more
well‐cared‐for parcels located within 100, 150, and 200 meters. Cadastral adjacency of well‐cared
for and vacant parcels also powerfully related to occupied parcel care. This paper describes our
census instrument and details the results of our analytical models across the three types of
distance metrics.
36
A Visual Analysis Methodology Applied in Urban Environments: Public Participation and
Alternatives Analysis
Darrin Gilbert and Jason Pfaff, Power Engineers, Inc.
Abstract
Darrin Gilbert and Jason Pfaff will present a process for evaluating visual impacts and engaging the
public for projects in urban areas. Much of the focus on visual resource analysis is on natural or
pristine landscapes. However, the greatest need and some of the most intense opposition comes
from projects located in urban environments where over 80% of the population lives, works and
plays. Having a defensible methodology and engaging the public in the evaluating visual resources
helps to inform project design and is critical, not only to obtaining state and local permits, but in
helping to protect our sensitive developed landscapes. This presentation includes a case study
review involving the development of a 230 kV transmission line.
37
TECHNICAL BREAKOUT SESSIONS 3A AND 3B
Session 3a (Wednesday 10:15‐11:45 AM, Rm. E1100/1200)
Cultural Resources in Scenic Landscapes
~*~*~*~*~*~*~*~*~*~*~*~*~*~*
Viewing the Landscape of the George Washington Memorial Parkway
Paul Kelsch, Ph.D., Associate Professor, Landscape Architecture, Virginia Tech [email protected]
Abstract
This paper investigates the importance of views along the George Washington Memorial Parkway,
especially their role in transforming the Potomac River waterfront from Washington DC to Mount
Vernon VA from land into landscape. It discusses the original design of a narrative sequence of
views by landscape architect Wilbur Simonson, and its importance in the ideological purpose of
the parkway, the commemoration of George Washington. It places this emphasis on views within
the discourse of landscape painting and cultural geographic interpretation of landscape ideology,
showing the complexities of landscape values embedded in landscape paintings and revealing a
similar complexity in the design of the original segment of the parkway. It concludes with a
discussion of the values of a cultural geographic approach for landscape management.

38
Preserving the Cultural and Visual Character of the Blue Ridge Parkway’s Historic Designed
Motor Road Landscape
Gary Johnson ASLA, National Park Service (Retired) [email protected]
Abstract
This paper presents a methodology that incorporates highway safety barrier warranting
determination, historic integrity and effect evaluation and visual resource analysis for managing
repair and safety undertakings proposed within the historic designed Blue Ridge Parkway motor
road landscape. This methodology incorporates three aspects of affect determination that allow
for:
describing the visual and historic character of the Parkway’s roadside landscape,
assessing the ability of a particular roadside location to visually absorb the introduction of a
new safety feature, and
for applying the criteria of adverse effect to more precisely determine
the degree to which a historic landscape would be affected.
A two‐step assessment process includes first a safety screening to determine if placement of a
safety feature is warranted. If so, then a second step evaluates the undertaking/action to
determine the level of effect it would have on the Parkway’s historic designed roadway landscape.
39
Clearing Trails: Proven Methods for Organizing the Complexities of National Historic Trail Impact
Analysis
Craig Johnson, Environmental Planning Group, LLC [email protected]
Abstract
National Historic Trail management and planning is nothing if not complex, and completing National Environmental Policy Act‐related impact analyses for these trails is certainly no exception. With the involvement of multiple agencies and planning initiatives, developing an understanding of the regulatory and planning framework alone becomes a challenging task. Further compounding this task is the fact that multiple resources are involved, and that a wide variety of data sources may or may not be available. However, by first organizing information into several key categories, and then establishing impact thresholds that directly relate to these categories, the challenge of National Historic Trail analysis can be successfully streamlined to focus on the key factors that potentially affect these trails. This paper introduces a proven approach to organizing and analyzing impacts to National Historic Trails—providing a concise and direct correlation between information and data, analysis, and determinations of consistency with planning documents.
40
Session 3b (Wednesday 10:15‐11:45 AM, Auditorium)
Visual Resource Programs and Planning
~*~*~*~*~*~*~*~*~*~*~*~*~*~*
Protecting Scenery at Multiple Scales
John McCarty, Chief Landscape Architect, Bureau of Land Management [email protected]
Carol McCoy, Chief, Air Resources Division, National Park Service [email protected]
Abstract
Breathtaking and culturally significant views are important to our national heritage and the human
spirit. The protection of scenery and historic properties is explicitly called out by several federal
statutes. According to National Park Service visitor surveys, 90% of visitors to national parks
consider scenic views an extremely or very important resource to protect and preserve. National,
regional, and local economies benefit from this tourism. By adopting thoughtful and intentional
management strategies, we can collectively ensure that important scenery endures for the benefit
of future generations.
This paper presents ideas on how to cultivate thoughtful management of public scenic resources,
which encompass both natural and cultural settings. It suggests ways to accomplish positive
outcomes through alternative approaches to traditional regulatory instruments. It emphasizes
promoting effective visual resource stewardship at the grass roots and local community level and
encouraging cooperative stewardship among states, industry, private property owners and
stakeholders to identify upfront important scenic views and visual resources to forge a collective
management strategy for their stewardship into the future.
This session will first explore how scenery stewardship may be accomplished at multiple scales
through a shared conservation commitment by public, private, and industry stakeholders at the
local, state, and federal level. What steps to protect scenic resources can be drawn from existing
methods (e.g., various separate agency approaches) and others being contemplated by federal
agencies. The audience will be invited to share ideas on challenges that need considered for
effective results and to offer suggestions for improving visual resource protection at multiple
scales.

41
Protecting America's Treasured Landscapes: The National Park Service Visual Resources Program
Mark Meyer, Visual Resource Specialist, Air Resources Division, National Park Service
Robert Sullivan, Visual Resource Scientist, Environmental Science Division, Argonne National
Laboratory [email protected]
Abstract
Through the National Park Service (NPS) Organic Act, Congress established NPS to manage park
and monument areas to“. . . conserve the scenery and the natural and historic objects and the wild
life therein . . . by such means as will leave them unimpaired for the enjoyment of future
generations.” With this central mission, NPS has been entrusted with some of the most
spectacular and historically significant landscapes throughout the country. The concept of planning
and managing the visual landscape as a resource has been in place in the United States since the
1970’s. The NPS has successfully addressed visual resource issues and management at multiple
park units, but each one had to develop its own approach because until now, there has not been a
service‐wide program to support parks for visual resources. Over the last several years, NPS has
developed a program that establishes service wide support to parks for managing visual resources
within the context of the NPS mission. The program includes conducting inventory and evaluation
of visual resources; providing guidance on assessing the visual impacts of projects; assisting parks
in the inclusion of visual resources in park planning documents to assure long‐term management
along with other park resources; and developing policy and guidance documents to help assure
consistency of visual resource management across the service. This session will provide an update
of the program elements and activities to date that have supported the growth of the program.
42
Scenic Resource Management and US Forest Service Forest Planning
Nancy A. Brunswick, Regional Landscape Architect, USDA Forest Service, Intermountain Region
Abstract
The US Forest Service released a new planning rule in 2012. This rule provides fundamental
changes in how scenic resources are addressed compared to the original 1982 rule that defined
the plans currently being revised in the Intermountain Region. Forest Plans guide the management
direction for National Forests for a 15‐year period. Management areas and focus are defined to
provide for forest resource restoration and conservation while providing a sustainable flow of
benefits, services, and uses.
The 1982 rule utilized the 1974 Visual Management System (VMS) for developing direction for
scenic resources. A number of foundation premises and processes in the VMS have changed. VMS
is based on an assessment that is conducted by experts (landscape architects) following a defined
mapping and valuation process resulting in scenic classes. The expert translates biophysical
features of the landscape into formal design parameters (Daniel, 2001). A basic premise in VMS is
that human modifications in a natural landscape detracted from the scenic quality and that
managing the degree of change due to management alterations was the primary guideline for the
system (Visual Quality Objectives). The focus on degree of change did not adequately address the
values that make individual landscapes special including cultural features.
The 2012 rule utilizes the principles in the 1995 Scenery Management System (SMS). The SMS
builds on VMS principles, but includes fundamental changes. The 2012 rule mandates defining
valued “scenic character” for areas, which contributes developing the desired condition,
objectives, and guidelines for scenic resource management. This involves an advancement to
include a human perception and aesthetic judgement by individuals who view and value the
landscape (Daniel, 2001) and includes an understanding of special places (FSH 1909.12_20, 2015).
Integrating special places adds a layer of complexity which includes social science concepts of
memories, symbolic meanings, and spiritual values as they are applied to the landscape (Daniel,
2001). Scenic Integrity Objectives (SIOs) provide the direction for maintaining, restoring, or
enhancing the landscape to move toward the desired scenic character. This paper explores the
change between the two management systems, integrating the more familiar expert assessment
with the inclusion of exploring human perception, and aesthetic judgement by the public.
43
TECHNICAL BREAKOUT SESSIONS 4A AND 4B
Session 4a (Wednesday 3:00‐4:30 PM, Rm. E1100/1200)
Visual Resource Management Approaches and Applications
~*~*~*~*~*~*~*~*~*~*~*~*~*~*
Integrating Visual and Cultural Resource Evaluation and Impact Assessment for Landscape
Conservation Design and Planning
Tara Mazurczyk, Hamer Center for Community Design, The Pennsylvania State University
Timothy Murtha, College of Design, Construction & Planning, University of Florida
Lacey Goldberg, Hamer Center for Community Design, The Pennsylvania State University
Brian Orland, College of Environment+Design, University of Georgia
Abstract
While there is an increased need for cultural resource conservation and management in North
America, there are few approaches that provide robust integration and combined assessment of
visual and cultural resources. Determining the scenic value of important views and identifying
potential risk for loss of that view are core components needed to design protection preserving
scenic quality and the cultural resources contributing to scenic value and overall sense of place.
Our research, focused on the Appalachian Landscape Conservation Cooperative, uses a model to
integrate cultural resources and visual resources for landscape scale conservation priorities. The
goal of this paper was to describe our approach and compare how visual and cultural resources
contribute to landscape scale conservation priorities in the Appalachian LCC. We investigated how
‘place’ can be studied from the perspective of visual resources, while compared to what we know
from cultural resource databases, including the National Registry, agency‐based, and state‐wide
datasets. In collaboration with Appalachian LLC, the study measures visual quality as compared to
viewshed threats (e.g., energy and development expansion) to better inform cultural resource
planning and management across the Pennsylvania landscape. Prominent ridgelines, knolls, and
viewpoints, for example, are integral to the creation of rural and urban aesthetic character. By
evaluating potential landscapes for conservation priority, we can begin to bring awareness to
important resources for public investment and inform federal, private, public, and business sectors
to engage in conservation of scenic and cultural heritage.

44
Cascade Head Scenic Research Area: Protecting Place along the Oregon Coast; Managing for a
Law that Gives Practical Consideration to Our Tie to a Landscape
Jessica Dole, Forest Landscape Architect, Siuslaw National Forest
Abstract
The 9,670 acre Cascade Head Scenic Research Area (Cascade Head) was established by President
Ford in 1974. Cascade Head is a picturesque place of serene estuary, dramatic headlands,
changing atmosphere, and has had a strong appeal to people for centuries.
It was the first land in United States nationally designated primarily to ensure protection of its
scenic values. It was established “to provide present and future generations with the use and
enjoyment of certain ocean headlands, rivers, streams, estuaries, and forested areas, to insure the
protection and encourage the study of significant areas for research and scientific purposes, and
to promote a more sensitive relationship between man and his adjacent environment." The Area
contains the whole headlands and estuary, an experimental forest, Nature Conservancy meadow
land, and is recognized by the United Nations as a world Biosphere Reserve.
Dynamic forces of nature shape this scenic and cultural landscape of the Cascade Head Area.
Existing character of the landscape with its rural houses and some farms, forest management, and
associated research and low‐key recreation use, and distinct natural areas of estuary, meadows,
forest, headland, and coastline ‐ is the basis of the effort to protect the character and restore the
landscape of Cascade Head. This talk with address scenery management’s role in protecting this
dynamic coastal environment, Cascade Head.
45
Visual Resources, an Integral Part of Park Resource and Visitor Use Management Planning
Gary Johnson ASLA, National Park Service (Retired) [email protected]
Abstract
This paper presents a resource and visitor use planning approach where a landscape classification
methodology and visual resource inventory were incorporated into a National Park Service (NPS)
management planning project on the Blue Ridge Parkway. The approach incorporates a
compilation of NPS and US Forest Service landscape classification, visitor use and resource
management planning processes and the author’s idea about how these can be integrated and
applied on the ground.
An integral part of the management planning process was coming to an agreed upon
understanding of what resources and visitor experiences are in the park/NHD and where they are
located. That was a prerequisite to developing alternative management concepts and defining and
applying management zone prescriptions in the alternatives. An inventory and classification of the
park/NHD landscape into a range of distinct resource landscape units (RLUs) was the first step in
understanding park resources and visitor experiences. Next the RLUs were analyzed to compare
and contrast the spatial distribution of important natural, cultural and visual resources and
contemporary infrastructure throughout the park/NHD. The landscape inventory, classification
and additional analysis provided the basis for developing resource protection and visitor use
alternatives and management prescriptions for each resource landscape unit of the park/NHD.
Visual resources were addressed at the RLU scale as character defining features and more
specifically in the proposed management concept, zones and prescriptions.
46
Session 4b (Wednesday 3:00‐4:30 PM, Rm. A1100)
Visual Resource Research and Methodology Issues
~*~*~*~*~*~*~*~*~*~*~*~*~*~*
Ecology of Scale in Visual Landscape Assessments
Richard Sutton, The Program in Landscape Architecture, University of Nebraska
Abstract
Background readings on scale plus twenty‐one visual landscape assessment studies from 1968 to
2006 were examined to understand the nature and use of scale and its relationship to the visual
environment. The objectives of this study were to:
1) describe the concept of scale as applied to visual assessments,
2) review scale use in selected visual assessments, and
3) identify issues that need further research to better integrate scale into visual landscape
assessments and theory.
Basic concepts and features relating observers with landscape and scale required defining scale,
bounding visibility, perceiving scale, seeing hierarchically, and visualizing grain and extent.
Finally, it recommends further research for defining, recognizing, and incorporating scale into
visual landscape studies should:
1) explicate use of absolute and relative scale,
2) compare traditional and multi‐scalar, hierarchical approaches,
3) examine and revise the current reliance on substitution of distance for extent or scale,
4) compare space/mass interactions, not simply masses, to determine visual grain,
5) design research protocols in which psychophysical metrics correlate more logically with
eco‐physical metrics.

47
Collaborative Research to Determine Visual Impact Assessment Best Practices
James Palmer, Scenic Quality Consultants
Abstract
It has been generally accepted practice that photosimulations should be based on a single‐frame
photograph taken with a “normal” lens—a 55mm focal length on a 35mm format camera. This was
the Scottish Natural Heritage’s recommendation in its Visual Representation of Windfarms: Good
Practice Guidance (Horner + Maclennan & Envision 2006). However, this recommendation was
changed to the equivalent of a 75mm focal length lens in their most recent guidance (Scottish
Natural Heritage 2014) based on a study by Hunter (2012).
It is proposed to investigate the “best” focal length to represent actual landscape views—which is
the goal of photosimulations—through a low cost collaborative research project. A prototype
validation study was conducted in Co. Wicklow, Ireland, where seven photographs were taken
with FX‐equivalent focal lengths between 30mm and 90mm at each of three viewpoints.
Participants were asked to evaluate how well each photograph represents the visible landscape in
terms of its context. The results indicate that a focal length slightly longer than 50mm is thought to
best capture the scope of a landscape view. These results generally support the use of a “normal”
focal length lens, and contradict Hunter’s (2012) recommendations.
Conference attendees and others will be invited to replicate this protocol to help determine a
standard focal length for single‐frame photosimulations.
References
Horner + Maclennan & Envision (2006), Visual Representation of Windfarms: Good Practice
Guidance. Inverness, Scotland: Scottish Natural Heritage.
Hunter, P. (2012), The Effect of Focal Length on Perception of Scale and Depth in Landscape
Photographs: Implications for Visualisation Standards for Wind Energy Developments. University
of Sterling, Sterling, UK. (Summary available at:
http://www.highland.gov.uk/download/downloads/id/1024/university_of_stirling_study_of_visua
lisation_standards.pdf)
Scottish Natural Heritage (2014), Visual Representation of Wind Farms. Version 2.1. Scottish
Natural Heritage, Inverness, Scotland.
48
Comparing Visual Impact Analysis under the National Environmental Policy Act and Section 106
of the National Historic Preservation Act
Robert Sullivan, Visual Resource Scientist, Environmental Science Division, Argonne National
Laboratory [email protected]
Mark Meyer, Visual Resource Specialist, Air Resources Division, National Park Service
Daniel O’Rourke, Principal Cultural Resources Specialist, Environmental Science Division, Argonne
National Laboratory [email protected]
Abstract
In considering the effects of proposed projects or activities on society and the environment,
assessment of visual impacts is important to several resources. Obviously, visual impacts affect
purely scenic resources and people’s scenic experiences of the visual landscape. However, other
resources and experiences have an important visual component or aspect that may be affected by
the visual impacts of projects or activities, including wild and scenic rivers, wilderness, historic
sites and trails, and cultural landscapes.
The nature and process for considering a visual impact can also vary depending on the law being
applied. Two laws, the National Historic Preservation Act and the National Environmental Policy
Act, require the consideration of visual impacts; however, there are differences in the way that the
laws define the resource, which influences how a visual effect is characterized.
Section 106 of the National Historic Preservation Act requires federal agencies to consider the
impacts of their undertakings on the integrity of properties either listed or eligible for listing in the
National Register of Historic Places. Under Section 106, the potential visual impacts from a
proposed project or activity are considered with respect to their potential effects on the integrity
of setting, feeling, and association of historic properties.
Visual impacts must also be considered under the National Environmental Policy Act (NEPA) not
only for their potential to affect historic properties but also for their potential effects on scenic
resources present in the landscape and the scenic experiences of people who view the landscape.
In essence, visual impact analysis (VIA) under Section 106 looks at impacts to places, while a NEPA
visual impact analysis includes both impacts to the people at those places and to the larger
landscape. While both analyses assess visual impacts, the analyses are fundamentally different in
nature, and where there are potential impacts to historic properties, both analyses should be
conducted to fully address the potential visual impacts from proposed projects or activities.

49
TECHNICAL BREAKOUT SESSIONS 5A AND 5B
Session 5a (Thursday 8:00‐9:30 AM, Rm. A1100)
Renewable Energy Impact Assessment and Mitigation
~*~*~*~*~*~*~*~*~*~*~*~*~*~*
An Overview of Visual Impact Analysis for Offshore Wind Energy
Richard Warner, Bureau of Ocean Energy Management, [email protected]
Abstract
The Bureau of Ocean Energy Management (BOEM) is the bureau within the United States (U.S.)
Department of the Interior responsible for managing offshore energy resources on the U.S. Outer
Continental Shelf (OCS). The Bureau coordinates energy development, environmental protection,
and economic development though the responsible management of offshore resources, based on
the best available science. BOEM achieves these goals by balancing the needs of multiple interests
for the OCS with the development of offshore wind energy facilities.
This paper will present a brief overview of BOEM’s regulatory framework for offshore renewable
energy, along with an overview of the status of offshore wind energy projects in U.S. waters. Also
discussed in this paper is how visual impact analysis (VIA) will be integrated into the environmental
analysis of proposed wind energy projects, followed by a summary of unique characteristics of VIA
for offshore wind, and the challenges encountered thus far. The conclusion presented an overview
of lessons learned, and a summary of the future of VIA at BOEM.
50
The Maine Wind Energy Act in a Time of Change
Terrence DeWan, Terrence J. DeWan and Associates
Abstract
The 2008 Maine Wind Energy Act (WEA) established a protocol to assessing potential visual
impacts of wind turbines on the Maine landscape. The WEA stipulates that wind project VIAs must
consider several factors, including impacts on scenic resource of state or national significance
(SRSNS); existing character of the surrounding area; viewer expectations; the extent, nature and
duration of public uses of SRSNSs; and potential effect on continued use and enjoyment.
The WEA also defined SRSNSs; set a fixed 8‐mile limit for viewshed evaluation; and allowed for
expedited permitting within large portions of the state, excluding those areas with ecological,
recreational, and scenic values.
This paper reviews several significant changes to the visual impact assessment protocols of the
WEA that have been proposed and/or enacted as a result of public opposition to the law over the
past decade. These include:
A change in the law that allows communities to opt out of expedited permitting review, (39
have done so thus far).
Amendments to the Site Location Application that address user surveys, public comments,
photosimulations, cumulative visual impacts, significance ratings for SRSNS, and burden of
proof.
Limitations of the responsibilities of the State’s peer reviewers who provide an objective
evaluation of the VIA.
Pending legislation to increase the area of potential visual effect to 15 miles for project
located near designated scenic resources (e.g., Acadia NP).
Proposed Maine DEP rules that address—among other things—determination of
reasonableness of visual impacts.
51
Land Art Generator Initiative
Elizabeth Monoian and Robert Ferry, Founding Directors, Land Art Generator Initiative
Abstract
The great energy transition will have an impact on our built environment and our visual landscape
like no other technical shift since the automobile. Our cities and countrysides will look different in
2040 than they do today as distributed renewable energy infrastructures expand at a rapid pace.
The common perception of these systems is of standard flat blue solar panels and three‐blade
horizontal axis wind turbines, separated from the public by chain link fences. Many people do not
see these as welcome additions to more cherished cityscapes and rural viewsheds. Rather than
passively accepting these new energy systems as a necessary but aesthetically unfortunate
addition to our cities, we can instead present examples of renewable energy infrastructures that
are cultural icons. In doing so, we can excite and inspire people to want more renewable energy,
not only because it is a required response to greenhouse gas emissions reduction mandates, but
because it is sexy and culturally relevant.
The Land Art Generator Initiative (LAGI) is a part of a global conversation on the shifting aesthetics
of sustainable infrastructure. By presenting examples of utility‐scale renewable energy
infrastructures as public art, LAGI is inspiring the general public about the beauty of our
sustainable future, and showing policy makers and city planners that net‐positive energy
installations can be placemaking tools, economic development drivers, and educational venues
while they help to power the grid.
The paper will demonstrate how LAGI is playing an important role in defining the design influence
of renewable energy on our constructed environments.
52
Session5b (Thursday 8:00‐9:30 AM, Rm. E1100/1200)
Visualization/Simulation 1
~*~*~*~*~*~*~*~*~*~*~*~*~*~*
Real‐time Landscape Assessment—The Claytor Lake Visual Management Study
Patrick Miller, Patrick A. Miller, Ph.D., FASLA, FCELA, Professor of Landscape Architecture and
Associate Dean for Graduate Studies and Outreach, Virginia Tech [email protected]
Peter Sforza, Director and Research Scientist, Center for Geospatial Information Technology,
Virginia Tech [email protected]
Abstract
How many of us have worked on visual assessment studies that sit on a shelf in a planner’s office
collecting dust? Or, how many of us have watched the eyes of an engineer or planner glaze over as
you try to explain visual characteristics, such as visual complexity or sensitivity, of a landscape of
concern to them. But the moment that you produce real images of the landscape they come to
life. The Claytor Lake Visual Management Study was completed for American Electric Power
Company (AEP), at the request of residents who live around the lake. It was seen as a dynamic tool
that could be viewed in the 3rd‐dimension in an office or the home of a resident, to see the
landscape and to visualize how proposed landscape changes would affect this scenic landscape. In
addition, the application or tool included panoramic photos and design guidelines for possible
development that would take place in different locations around the lake. The platform for this
dynamic tool was Google Earth, a free, available and easy to use software that could be used by
citizens and public officials in making decisions about development around the lake.
53
Expanding the Use of Visualization Technology—3D Modeling
Tracy Perfors, Natural Resource Specialist, Bureau of Land Management
Abstract
The Bureau of Land Management (BLM) uses three‐dimensional (3D) models viewable in Google
Earth in addition to traditional visual resource analysis tools to plan, visualize, and mitigate new
landscape‐altering projects. A rough model can be made in minutes, allowing for quick and
inexpensive pre‐planning. Even when sites are inaccessible due to winter snow, timing, cost, or
other access issues, modeling gives an approximation of the look of the final project and identifies
scenery concerns. Alternatives can be worked through "on the fly" during meetings with
stakeholders or in the field (with an internet connection), and mitigations can be made before
major time or expense has been poured into an alternative.
When project proponents submit a final project design, sophisticated 3D models show the project
more intuitively than any diagram or text could, since people naturally think and react to their
world in 3D. As a Google Earth file, the model can be easily shared over email or website to any
stakeholders or members of the public who have this free program on their computer. Viewers
can investigate how the project looks from whatever viewpoints interest them, and not be limited
to the handful of viewpoints chosen by the agency.
Finally, models help create photographic visual simulations when working with unusual facilities or
dirt work which cannot be simply copied and “Photoshopped in” from other projects.
54
Exploring Visualization Tools for Communicating Natural Resource Management Information
Kevin Colby, Landscape Architect, Arapaho & Roosevelt National Forests & Pawnee National
Grassland, United States Forest Service [email protected]
Kelly Ortiz, Forest Landscape Architect, Rio Grande National Forest, United States Forest Service
Abstract
Planning is often in two dimensions, but we see the world in three dimensions. Google Earth is a
useful tool for project design and visualization. Google Earth has several advantages:
It's easy
It's free and widely available
It's portable (office and field)
One can design in 3D
One can export the file for layout notes
This presentation highlights our use of Google Earth for:
Vegetation management
Communication towers
Development/Building envelope
Building
Oil and gas development
The presentation discusses six projects: A typical Forest Service vegetation management project
with clearcutting, thinning and prescribed burning of vegetation; the “scalloping” of a clearing for
a powerline near Rocky Mountain National Park; a communication tower facility on a prominent
mountaintop; a building envelope study for the Chimney Rock National Monument, and two
building development projects—one for a ski lodge next to Colorado’s premier mountain
interstate highway and one on Hawaii.
The presentation consists of “stills” (pictures/graphics manipulated in PhotoShop and Corel) and
movies from the Google Earth files on the projects (fly throughs).
55
TECHNICAL BREAKOUT SESSIONS 6A AND 6B
Session 6a (Thursday 9:45‐11:30 AM, Auditorium)
Visualization/Simulation 2
~*~*~*~*~*~*~*~*~*~*~*~*~*~*
Visualizing Landscape Impacts: The Development and Application of a New Spatial Analysis Tool
Brent Chamberlain, Assistant Professor, Director for the Advanced Landscape and Immersive
Visualization Environment (ALIVE!) Laboratory, Landscape Architecture and Regional & Community
Planning, Kansas State University http://brentchamberlain.org
Abstract
Balancing cultural and ecological planning objectives can be rewarding and simultaneously,
exceedingly challenging. This presentation will highlight a custom viewshed analysis tool that has
been applied in conjunction with 1) an ecosystem service‐oriented spatial analysis method to
investigate the relationship between visual aesthetics, cultural significance and ecological value of
the landscape; 2) operational forest planning over large landscapes; and 3) assessing differences
between highway scenic routes within the US. The viewshed tool enables a nuanced representation
of visual quality, providing a very different result than the standard (binary) representation. The tool
combines concepts of visual magnitude, a computationally efficient algorithm, and a representation
of the continuous experience, to help planners and scientists better evaluate potential visual
impacts or opportunities stemming from planning projects. Visual magnitude creates a normalized
value of potential impact, and when coupled with a route, offers a significant improvement over
traditional viewshed methods for the evaluation of impact across large spaces. The tool that will be
demonstrated also calculates perceived horizon and ridgelines (as opposed to geographic
ridgelines). These analyses enable planners and scientists to identify possible visual obstructions or
unsightly changes to these important physical features, offering an expedient way to estimate
possible visual impact. Currently, these analyses are often done using 3D visual renderings, which
can be cumbersome and expensive. Overall, this presentation will provide insights learned through
practical application and vetted through scientific peer‐review with the aim to provide new tools so
support visual resource stewardship.

56
Modeling Coastal Sedimentation and Erosion for Design Applications within the Field of
Landscape Architecture and Architecture
Aidan Ackerman, Boston Architectural College, Landscape Architecture Faculty
aidan.ackerman@the‐bac.edu
Jonathan Cave, Boston Architectural College, Master of Landscape Architecture Candidate
jonathan.cave@the‐bac.edu
Abstract
Uncertainty of future coastline geophysical conditions is increasingly magnified by the growing
severity of acute and chronic weather events induced by climate change. In the face of these threats,
21st century coastal human relationships will be of temporality, of response and recovery, and of
restoration. These dynamics will require visual exploration of theoretical conditions within the built
environment, and application of these conditions to future scenarios. Building information modeling
technology currently used within the field of architecture and engineering can offer a framework
which can be further applied to inform modeling and simulation of natural systems, supporting
exploration of the interplay between infrastructural and ecological elements through data‐driven
models and simulations.
This research examines the development of an interdisciplinary three‐dimensional visual modeling
methodology used to simulate erosion, storm surges, and sea level rise of a beach community in
southern Rhode Island. Using historic data of coastal conditions for Misquamicut, Rhode Island,
the researchers identified patterns of coastal change. These patterns were then modeled and
visualized, and flow dynamics of granular materials were applied to simulate a variety of future
conditions which incorporated hydrological dynamics along the Rhode Island shoreline. The
resulting sedimentation and erosion patterns were translated into an emergent modeling
methodology which can be applied to numerous coastal conditions. The use of this methodology
by landscape architects and allied professions can improve testing of a design concept through
accurate portrayals of environmental systems and scenarios. These efficiencies will be critical to
the success of ecological design in the face of 21st‐century environmental issues.

57
U3D‐DSS: A Novel Decision Support System for Community Directed Green Infrastructure Design
Mark Lindquist, Victoria Campbell‐Arvai, Alec Foster, Shannon Sylte, and Frank Deaton, University of
Michigan
Abstract
Green infrastructure (GI) can have a positive ecological and social contribution in urban
environments and is also seen as an essential component in efforts to rebuild the resilience of
legacy cities. Despite the recognized importance of GI there is a missed opportunity to more fully
involve residents in GI planning and design, which can lead to more successful and resilient
outcomes. Integrating the concept of ecosystem services (ES) into public participation processes
can enhance outcomes but requires robust decision support systems (DSS) that can more
effectively incorporate community needs. Complicating this integration is the challenge that the
value of specific urban ES will vary greatly both between and within cities, influenced by the
environmental and socio‐economic characteristics of the community in question. As such,
collaboration and engagement with community members to specify the ES that are important and
meaningful to them must be a part of any GI imitative and requires a DSS that is flexible and
adaptable to different communities and contexts. This paper describes the development of a novel
DSS that uses Structured Decision Making to identify stakeholder needs which are then
incorporated into a 3D visualization based DSS using the Unity game engine. The DSS is evaluated
in the context of a Greenway planning and design project in the City of Detroit that included
multiple stakeholders with varying interests and the success of the DSS assessed. The paper ends
with the identification of future research needs.
58
Emerging Technologies for Visual Resource Management
Jason Pfaff and Shawn Jackson, Applied Technologies Group at POWER Engineers, Inc.
Abstract
Jason Pfaff and Shawn Jackson will present the latest tools and emerging technology for Visual
Resource Managers. The presentation will cover Augmented Reality, Virtual Reality, Drones and
advanced visualization technology to help analyze, design and plan for new projects in the seen
environment. Used with traditional visual management systems ‐ in the field or for desktop review
‐ the tools can better promote best practice and facilitate better communication to the public and
regulatory agencies.

59
Session 6b (Thursday 9:45‐11:30 AM, Rm. E1100/1200)
Visual Impact Mitigation
~*~*~*~*~*~*~*~*~*~*~*~*~*~*
Effective Integration of Visual Analyses, Mitigation, and Reclamation for Linear Projects
Craig Johnson, Environmental Planning Group, LLC [email protected]
Abstract
With the recent approval of several large‐scale transmission lines and pipeline analyses that are
now moving toward construction, it is critically important to assure that these projects are
implemented based on the findings and assumptions within their associated impact analyses.
Although this seems an obvious next step, it has not always occurred successfully on past projects,
and can be a challenging endeavor depending on how analysis findings and mitigation measures
are applied and tracked. More specifically, degrees of impact and application of mitigation
measures are often described in text, and/or on forms that do not specifically delineate what
portions of the project features they relate to. This paper focuses on effective and proven
methods for not only analyzing visual impacts to linear projects, but also structuring the analyses
for ease in successfully carrying mitigation measures through the design, planning, construction,
and reclamation processes.

60
Mitigating Visual Impacts of Utility‐Scale Energy Projects
Joseph Donaldson, ASLA, PLA, Ecology and Environment, Inc. [email protected]
Abstract
Visual resources are often a focal point of controversy and uncertainty and are becoming a
growing concern for agencies, developers, and the public alike for the variety of utility‐scale
energy projects, including transmission, substation, power plant, and renewable energy projects.
Agencies are increasingly challenged to interpret and enforce regulations for visual resources and
balance multiple and often conflicting purposes for public lands. Developers are challenged by
uncertainties about visual impacts of their proposed projects, often strong public reactions and
opposition, and how impacts can best be mitigated cost‐effectively. The public is most often
concerned about impacts to views, changes to visual character and quality, and the effects of
these on their property values and quality of life. Developers and utilities are finding that facility
sites and potential transmission routes are increasingly constrained and agency requirements for
mitigating visual impacts are expansive and costly. This paper focuses on approaches, processes,
and techniques for mitigating visual impacts of utility‐scale energy projects and explores the
effectiveness of some commonly employed mitigation techniques.
61
Reclaiming Visual Stewardship in Tucson, Arizona—Is It Possible?
Ellen Barth Alster, Senior Landscape Architect, Pima County Department of Transportation
Abstract
The Sonoran Desert landscape encompassing Tucson, Arizona consists of sweeping skies
punctuated by mountain ranges and saguaro silhouettes. As development occurred a few decades
ago, land use codes and design practices arose to protect this unique scenery. As the generation of
practitioners who developed these codes and practices retired, the existing codes have been
ineffectual at integrating utility planning and design into the urban landscape. Using Tucson as an
example, this paper discusses the decline of visual stewardship and impediments towards
improvement. Utility poles, which are becoming the dominant element in the Tucson skyline, are
the primary focus. As newer requirements have translated into increasingly larger poles, previous
mitigation practices that integrated poles into the landscape were discontinued. Whether this was
a conscious and deliberate urban design decision agreed upon among utilities, local government
and the public is unclear. Additionally, old poles remain years after they are replaced, cluttering
urban streets.
In contrast with Tucson’s eroding visual stewardship related to utility design, it remains a priority
for some communities. Which are these communities and how have they been successful? How
has the energy industry begun to lead visual stewardship and what has caused them to do so?

62
Surface Color Treatment of Transmission Line Structures
Brandon Colvin, Landscape Architect, Bureau of Land Management [email protected]
Abstract
With the increasing need for reliable energy infrastructure in the United States, the once natural
openness of the Wild West has now evolved to a web of infrastructure scattered across the
landscape. BLM public lands managed under a multiple‐use mission are no exception to this rapid
expanse of development.
While projects built on BLM land go through in‐depth environmental analysis, including making
recommendations for proper design features and mitigation measures to reduce impacts to visual
resources, it is often difficult for BLM staff to solidify the full implementation of these measures.
This is sometimes a result of BLM staff not having the expertise or tools necessary to simulate
design features and mitigation measures. Having a visual simulation to show the net gain these
measures provide in reducing impacts to visual resources is an invaluable asset in project
development.
This presentation captures the process that the BLM followed to warrant the color treatment of
transmission structures on a recent 500kV transmission line through a highly scenic and publicly
sensitive landscape. It will highlight the process of using 2D visual simulation techniques to
conduct a color analysis of the natural landscape. It will also demonstrate how utilizing these
techniques proved an invaluable source of information in aiding BLM decision makers in selecting
the most appropriate surface color treatment for the structures of this project.
63
LODGING INFORMATION
Argonne Guest House
Building 460
9700 South Cass Avenue
Lemont, IL 60439
Phone: (630) 739‐6000
The Argonne Guest House is located onsite. An Argonne visitor's pass is required to enter the Argonne facility. The room rates are $88.40 for single occupancy or $98.80 for double occupancy. Mention the group name – Visual Resources Stewardship. https://www.anlgh.org/
The following hotels are located near Argonne National Laboratory. The hotels offer group rates
for conference attendees.
Chicago Marriott Southwest at Burr Ridge
1200 Burr Ridge Pkwy, Burr Ridge, IL 60527
Phone: (630) 986‐4100
http://www.marriott.com/hotels/travel/chisw‐chicago‐marriott‐southwest‐at‐burr‐ridge
Chicago Marriott Southwest at Burr Ridge is a 16‐minute drive from the conference facility.
A group rate for Argonne Visual Resource Stewardship Conference is available.
Aloft Bolingbrook
500 N Janes Avenue, Bolingbrook, Illinois 60440
Phone: (630) 410‐6367
http://www.aloftbolingbrook.com/
The Aloft Bolingbrook is a 15‐minute drive from the conference facility.
A group rate for Argonne Visual Resource Stewardship Conference is available.
SpringHill Suites by Marriott Chicago Bolingbrook
125 Remington Blvd, Bolingbrook, IL 60440
Phone: (630) 759‐0529
http://www.marriott.com/hotels/travel/chibl‐springhill‐suites‐chicago‐bolingbrook
SpringHill Suites Bolingbrook is a 15‐minute drive from the conference facility. A group rate for
Argonne Visual Resource Stewardship Conference is available.
For additional information, contact Robert Sullivan, 630‐252‐6182, [email protected].

64
FOR MORE INFORMATION
For additional information about the conference, including
questions about registration, directions, lodging, and
presentations, contact Robert Sullivan, 630‐252‐6182,