visual modeling for exploratory problem solving on
TRANSCRIPT

VISUAL MODELING FOR EXPLORATORY PROBLEM
SOLVING ON COMPUTER SCIENCE LESSONS
Sergei A. Kostousov and Irina V. Simonova Herzen State Pedagogical University of Russia
Moika River, 48, St. Petersburg, 191186, Russia
ABSTRACT
The purpose of the article is to identify conditions for the effective use of visual modeling tools that can help reduce the difficulty level of solving problems during the teaching high school students programming. Visual modeling tools are a type of software that allows you to create visual abstractions that reproduce concepts and objects of the real world with their relationships, which can help in solving the problem. In this paper, we focused on preformal models based on intellect- and concept-maps. The article gives a classification and describes techniques for using various visual modeling tools to solve problem tasks. Formed skills of working with such tools will allow students to produce, represent and express independently their knowledge. In addition, these tools allow structuring the process of solving the problem, optimizing the time for solving each stage of solving a problem task. The article presents the results of comparing the learning outcomes of the control and experimental groups, which show that the proposed visual modeling tools can help in solving the programming problem tasks.
KEYWORDS
Programming Learning, Problem-Based Learning, Visual Modeling Tools, School IT Education
1. INTRODUCTION
The development of information society demands a high level of information literacy that needs to be formed at school. Preparing future professionals for a wide range of positions requires as well gathering a programming competency. This competency should be improved to the requested level in the university but the formation can be started at school. It is worth noting that programming is a complex activity that requires thoughtful study and independence in the development of knowledge and skills. The analysis of teaching literature and experience of teachers shows that reproductive method prevails for this discipline. This way of learning does not develop creative skills to solve problems independently. The improvement of programming competence can be reached by problem-based learning (Yusri, 2018): the process of problem solving problem correlates with an increase of creativity (Maker, 2004) and problem tasks are closer to real-life problems (Jonassen, 2005). However, problem solving is a less manageable process and its embedding in discipline is not a trivial task.
The aim of our research is an addition of methods for teaching computer science to school students (10-17 y.o.) with tools that may decrease described gap. We focused on deep-learning methods using a problem-based approach enhanced with computer modeling tools for knowledge visualization.
Modern education and teaching methods cannot rest satisfied with the transfer of information from the teacher to the student, since information becomes knowledge only after it is built into the student's internal cognitive schemes (Scardamalia, Bereiter, 2006). Pedagogical studies rise a question how to overcome the passivity of the students and give them opportunity to extract, create and apply new knowledge. Considering the learning process from this point of view, we are challenged by following issues: how to involve the student in the learning process? how can a teacher promote student building of mental models? how can information/communication technologies help?
DOI: 10.33965/celda2019_201911L033 16th International Conference on Cognition and Exploratory Learning in Digital Age (CELDA 2019)
1

Since the area of our research is a computer science education, we use computer technology as an object of study and as a learning instrument. It is necessary to create those learning conditions where the use of software tools will help students thoughtfully and critically interpret the concepts they learn while completing training tasks. To achieve it we propose different visual modeling tools. These tools will be considered as a type of software that allows constructing visual abstractions reproducing the concepts and objects of the real world with their relationship that can help to solve a problem (Koznov, 2012). Formed skills of working with such tools will allow students to independently produce, present and express their knowledge (Jonassen, 2005, Brilingaite, 2018). Furthermore, these tools allow you to structure the learning process by allocating time to solve each stage of a problem task.
In order to involve students in the learning process, the reproductive method of teaching can be enhanced by problem-based learning. For example, researches (De Corte, 2004, Yew, Goh, 2016) present the results of the comparison of the learning outcomes of the control group and the group where the problem approach was implemented. The students in the experimental group demonstrated a higher level of academic performance and metacognitive skills. Moreover, authors note that the effect turned out to be stable in the subsequent training, there was also a positive correlation with the skills of adaptation of students in the next stages of training.
However, the review of papers (Dolmans, 2016, Hüttel, 2017) shows that the problem based learning does not always provide an increase and sometimes may cause even a decrease of academic performance: cognitive load, context, learning time and etc. should be considered.
According to those provisions, we try to make the problem solving more manageable (Sawyer, 2018, Ünal, 2017) and propose the method of using visual modeling tools in solving problems on computer science lessons for school students.
2. THE USE OF VISUAL MODELS FOR THE PROBLEM SOLVING
To build a teaching methodology, it is necessary to distinguish terms “a task” and “a problem”. We analyzed a number of definitions of these concepts of different authors (Makhmutov, 1997, Jonassen, 2005, Maker, 2008) and proposed our working definitions.
The task is a situation with some initial conditions, containing in itself such an unknown, overcoming which the target state will be reached. The solution of the problem will be the achievement of the target state, and the process of the solution will be the way to overcome this unknown. We distinguish two criteria for classification: complexity and problematic. The complexity of the task is an indicator of amount of actions necessary to achieve a solution. Problematic determines the degree of uncertainty of the task.
Reproductive tasks (tasks with a very first level of problematic) are tasks in which the initial and target states are precisely defined, and students know the solution method but do not know the solution itself. At the same time, even for a complex task, the student will either know how to solve it, or own universal methods for finding a solution.
A problem task (hereinafter called the problem) is a kind of task where the target state is not defined or the initial conditions are not determined, or the solution process is not known to the student. In this case, the complexity of the task can be either low or high. In real life, problem tasks are more common, and therefore it is important to learn how to solve them. Note that the "problematic" for some tasks may depend on the student’s level of training.
In the classification presented by (Jacob, 1976) and supplemented (Maker, 2008), six types of problems are distinguished. The first type includes those problems both the teacher and the student knew both the initial conditions of the problem and the method for solving it, but only the teacher knew the answer (was described as reproductive tasks). The second type differs from the first one that the problem is known to both participants, only the teacher knows the solution method and the correct answer. The third type has clearly formulated conditions of the problem, but more than one method can be used to find a solution. The fourth type includes problems with known conditions, but there is not the only way to solve it and not the only one correct answer, but not every method and not every solution are admissible. The fifth type has clearly defined conditions, but neither the teacher nor the student knows the method of solving and answering. The sixth type (the maximum level of problematic) assumes that neither the initial conditions of the problem, nor the method of its solution, nor the solution itself are known either to the student or to the teacher. The second and
ISBN: 978-989-8533-93-7 © 2019
266

third types will be considered as “well-structured”, while the tasks of the following types will be considered as “ill-structured”.
Our experience (Kostousov, Kudryavtsev, 2017) shows that the solution of a problem situation by students is more difficult to manage than the solution of reproductive tasks, even quite complex ones. In order to improve the manageability of training, as was already described, we propose the method of using visual modeling tools for working with knowledge on various stages of the solution process.
Table 1 presents the framework of using tools for visual modeling to work with the knowledge on the stages of solving problems of various types, proposed by us in (Kostousov, Kudryavtsev, 2017). Experimental learning has shown that the use of tools allows the students to visualize and structure educational information, which contributes to the formation of skills to reformulate the task, to make the transition from intuitive understanding to formalized description, including algorithmic.
Table 1. Knowledge visualization tools supporting different stages of problem solving
Stage of solution process Well-Structured Ill-Structured
1. Identify problem Mind map 2. Create problem space (incl. context) Concept map
3. Search potential solutions Decision tree – Causal model
4. Evaluate and choose solutions – Argument map 5. Implement solution Project diagram, Process diagram 6. Check and verify Argument mapping 7. Reflection Mind map
On the other hand, our pedagogical experience shows that the use of all tools at once for schoolchildren’s
problem is inexpedient: the consistent acquaintance with these tools is necessary, the rationale for choosing a tool depending on the goals and the stage of solving the problem. It should also be noted that the use of the tools listed in Table 1 leads to an increase in the cognitive load on students.
Therefore, we decided to introduce pre-formal visual models that will allow visualizing the elements of the problem in free form. Our hypothesis was that such models would help the student understand the “gap” between the target state and the initial conditions and work out their own solution. We propose the use of preformal visual models based on the intellect- and concept-maps (Wang, 2018). I-map can structure brainstorming and c-map can allow to visualize the structure of the application (Kwon, 2019) articulating different possible ways of productions.
3. EXPERIMENT AND DEMONSTRATION
3.1 First Experiment
To test the hypothesis, the pedagogical experiment (Kostousov, Simonova, 2019) was conducted with students (15-17 y.o.), who studied the section of algorithmization and programming. The algorithms for searching and sorting arrays were considered. The purpose of the experiment was to determine whether the visual models help to fix the knowledge obtained as a result of the student’s decisions.
To compare the results, 3 groups of students were allocated: the control group (9 people) and two experimental groups: using a table model (9 people) and a visual one (10 people). The students for the groups were randomly selected from 120 people. Since the study examined a small sample, the analysis was performed using the Mann-Whitney test.
It is known that students' learning of the algorithms for searching and sorting arrays causes the students considerable difficulties (Donley, 2018), therefore the algorithms themselves in all three groups were developed together with the teachers, with active discussion with the students. The algorithms for the linear and binary searches, as well as the bubble sorting algorithms, the smallest method and the use of ready-built sorts have been developed.
16th International Conference on Cognition and Exploratory Learning in Digital Age (CELDA 2019)
267
The problem in this case was not directly in the development of the algorithm, but in the fact that the students needed to understand which algorithms to use in what situations. We focused not so much on the achieving a practical result, but rather on the quality of learning and the students' self-assessment of the results obtained.
At first, both groups were familiar with the algorithms. A discussion of the characteristics of the developed algorithms was conducted with the control group. A comparison table was proposed to the group with a verbal model, in which the algorithms were in one dimension, and the characteristics for comparison were described in another - the students had to fill in the table.
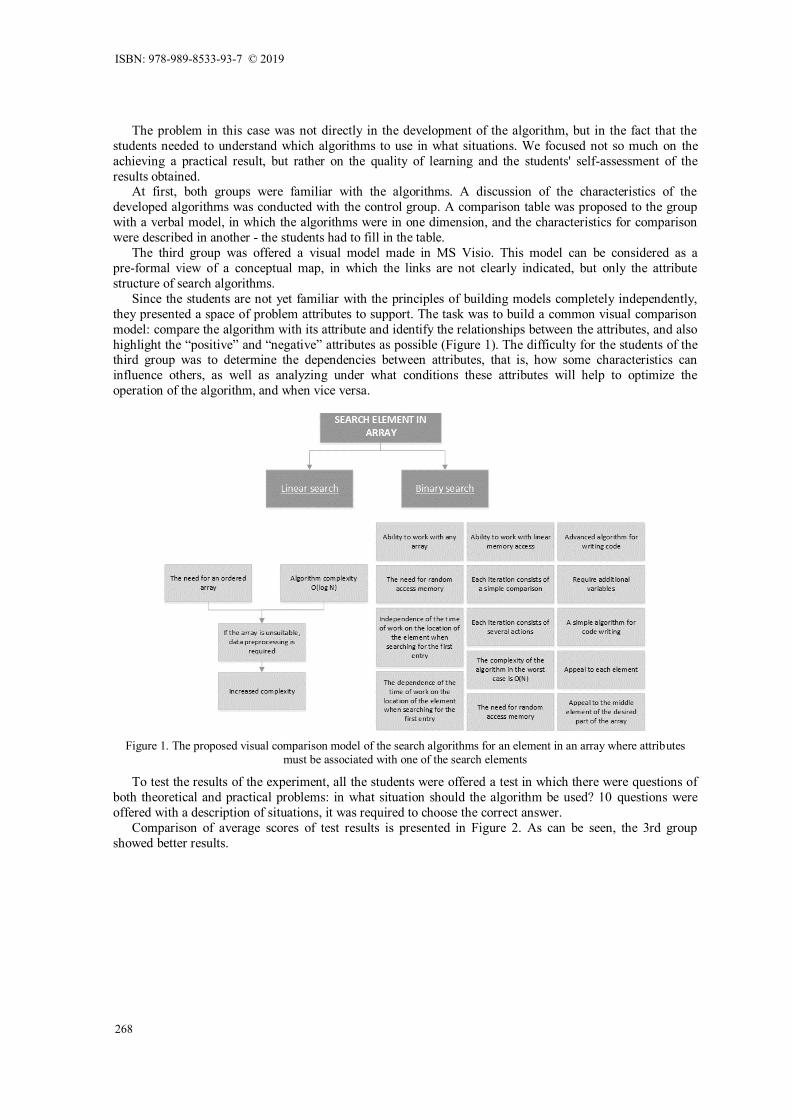
The third group was offered a visual model made in MS Visio. This model can be considered as a pre-formal view of a conceptual map, in which the links are not clearly indicated, but only the attribute structure of search algorithms.
Since the students are not yet familiar with the principles of building models completely independently, they presented a space of problem attributes to support. The task was to build a common visual comparison model: compare the algorithm with its attribute and identify the relationships between the attributes, and also highlight the “positive” and “negative” attributes as possible (Figure 1). The difficulty for the students of the third group was to determine the dependencies between attributes, that is, how some characteristics can influence others, as well as analyzing under what conditions these attributes will help to optimize the operation of the algorithm, and when vice versa.
Figure 1. The proposed visual comparison model of the search algorithms for an element in an array where attributes must be associated with one of the search elements
To test the results of the experiment, all the students were offered a test in which there were questions of both theoretical and practical problems: in what situation should the algorithm be used? 10 questions were offered with a description of situations, it was required to choose the correct answer.
Comparison of average scores of test results is presented in Figure 2. As can be seen, the 3rd group showed better results.
ISBN: 978-989-8533-93-7 © 2019
268

Figure 2. Chart of the average score of the control test in groups
For a more correct comparison of samples, the Mann-Whitney test (1) was used:
(1) where Tx is the largest sum of ranks, nx is the largest of the sample volumes n1 and n2.
The comparison showed an unreliable difference between the control group and the group where table models were used (the empirical value of the criterion is 36.5, the critical value is 23). The comparison of two experimental groups also turned out to be unreliable (the empirical value of the criterion is 25, the critical value is 23). However, a comparison of the control group and the group where visual models were applied showed a significant difference (the empirical value of the criterion is 11.5, the critical value is 23).
We also conducted a cluster analysis for the test results for three samples. In the calculations, the “nearest neighbor method” was used; the measure of similarity is the ratio of twice the number of common units to the total number of units in the two compared lines. The results showed that the experimental group with visual models had a higher percentage of similarity (average 92%, minimum ~ 85%) than the other two (average value ~ 85, minimum ~ 68%). This can be interpreted as more similar knowledge were gathered by students of the experimental group. Those results encouraged us to provide the advanced experiment.
3.2 Second Experiment
The purpose of this experiment was the clarifying applicability of the proposed method for different types of problems that are appropriate for teaching programming. The advanced experiment was conducted throughout the whole semester for the experimental and control groups.
Preliminary questioning done in both groups showed that the majority of students in each group are studying programming with the aim to continue education in the field of computer science.
At the beginning the “entrance task” was carried out, consisting of 4 standard training tasks with single solutions, to assess the level of students' readiness of using basic algorithmic structures; the visual modeling tools were not used. According to the results (Figure 3) it can be said that the initial level of both groups is quite similar – their compareness can be representative.
Figure 3. Chart of the average score of the control test in groups
16th International Conference on Cognition and Exploratory Learning in Digital Age (CELDA 2019)
269

Further task was “point in the triangle”: determine whether the point lies inside the triangle according to the coordinates of the point and the vertices of the triangle. The task can be attributed to the different levels of complexity and problematic depending on the condition. For example, it is possible to describe in detail the idea of the algorithm and do not impose strict requirements on the solution, the complexity can be estimated with a rather low rank. The complexity can be increased without increasing the problematic by adding constraints to the condition (we required the use of functions). On the other hand, it is possible to strengthen the problematic without describing the idea of the algorithm, while leaving the requirements for the condition. And finally, it is possible to present this task to the students, without explaining the schema of the solution and specifying the conditions, while raising its problematic and reducing the complexity.
A discussion of the solution method was conducted with the control group, and an experimental constructed a visual model, where the solution methods, data and the structure of the chosen solution method were reflected. The experimental group showed better results (Figure 3).
Next task was “recursive algorithm”: “from the rectangle a square of the largest possible area was cut off. From the remaining rectangle, the square of the largest possible area was cut off again, so repeated N times. The result was a rectangle of size A on B. Develop a program that displays all possible sizes of the original rectangle on the screen”.
The task can be attributed to the second or third level of problematic depending on the stated conditions. For example, a condition for the mandatory use of a recursive algorithm is introduced, that is, a solution method is indicated, therefore the level of problematic of this task is second, and the level of complexity is higher than that of the previous one.
The development of recursive algorithms causes significant difficulties for the students, so before solving this problem they were offered an additional task, which required to build a visual model of the states of the call stack when finding Fibonacci numbers by the recursive method. The process of building a model allowed each student to understand the main ideas and stages of the recursive algorithm. This technique has reduced the complexity of the problem of cutting squares.
One dimension arrays - a set of tasks for working with one-dimensional arrays: the use of search, sorting, comparisons, etc. Such tasks can be attributed to the second level of problematic (for some even the first), since the solution process only requires the application of the methods studied. However, the level of problematics increased, since in constructing a visual model, it was necessary to correlate the corresponding attributes and characteristics with each of the algorithms, following the relationship between these attributes.
The exam-final task: work with the files, arrays, elements of a windowed application, operators for exception handling. The task had a high level of complexity, because it required the use of many operations to solve, however, the problem was 2 levels, because the exam first required to check operational skills, not creative abilities. Building models for this task was not carried out for any of the groups.
The comparison results are shown in diagram 3. In general, the results are higher for the experimental group. Despite the fact that initially the level of the first group was slightly higher, the increment on subsequent tasks became more noticeable. However, the results of the final exam differed slightly.
Also, comparisons were made of the results of passing tests. With the experimental group, conceptual models were developed for applying subroutines and comparing the characteristics of algorithms for working with arrays. According to the test results, the questions in which checked the knowledge of procedures and functions, the students of the experimental group received higher scores. However, the control group did a better job with the array test questions. Perhaps the abundance of models caused a strong cognitive load, or it was not carried out enough with after action review on the results, or other factors had an impact. This requires an additional research.
We also estimated the time to solve problems in the control and experimental groups. To do this, we tracked the time for completing two tasks: creating a form for registering and entering and setting an exam. A reproductive method was applied with the control group: the code was written on the discussion board. A visual model was built with the experimental group, where possible solutions, the architecture of using subroutines, work with files, etc., are displayed. But the students themselves wrote the application themselves. Comparison with the exam is valid as for both assignments similar work ideas are used, but due to the formulation of the assignment and decontextualization of the exam, these similar features can only be seen by abstracting.
ISBN: 978-989-8533-93-7 © 2019
270

As can be seen from chart 4 (part with the registration and entry form), the experimental group showed a longer working time and a greater spread, in the difference with the control group, where the tasks were handed out almost simultaneously (the difference is less than 5 minutes). However, on the exam, the results were reversed: the experimental students were quicker, the time gap was smaller, and the results were higher.
Figure 4. Compareness of time spent (min) and results for two tasks for each group
The calculated values of Wilcoxon signed-rank test show a significant difference for both groups: the control group (2) has a difference in the direction of increasing time, and the experimental one (3) in the direction of decreasing time:
(2); (3) Therefore we can assume that the less manageable independent solution process can lead students to
provide more effective solutions in the future.
4. CONCLUSION
Contemporary world requires the use of new techniques in learning process. Education should not only give information but has to provide the methods of knowledge production and information technologies can make this process more efficient. We propose the method of using visual models tool to scaffold gathering knowledge and support the search of different solutions while solving learning problems. Our experiments demonstrate an improvement of academic performance. Visual models can make the solution process more manageable. We can conclude that proposed approach can help in education but further research is needed.
REFERENCES
Brilingaite A., et al, 2018. Competency Assessment in Problem-Based Learning Projects of Information Technologies Students. Informatics in Education, 17(1), 21-44.
De Corte E., et al., 2004. The CLIA-model: A framework for designing powerful learning environments for thinking and problem solving. European Journal of Psychology of Education, 19(4), 365-384.
Dolmans, D. H., et al., 2016. Deep and surface learning in problem-based learning: a review of the literature. Advances in health sciences education, 21(5), 1087-1112.
Donley, K. S., 2018. Coding in the Curriculum: Learning Computational Practices and Concepts, Creative Problem Solving Skills, and Academic Content in Ten to Fourteen-Year-Old Children. A Dissertation Submitted to the Temple University Graduate Board, Temple University.
Hüttel, H., & Gnaur, D., 2017. If PBL is the answer, then what is the problem?. Journal of Problem Based Learning in Higher Education, 5(2).
Jacob W. et al., 1976. The creative vision: A longitudinal study of problem finding in art. New York, NY: Wiley.
16th International Conference on Cognition and Exploratory Learning in Digital Age (CELDA 2019)
271

Jonassen, D. H., 2005. Tools for representing problems and the knowledge required to solve them. Knowledge and information visualization, Springer Berlin Heidelberg, 82-94.
Kivimäki, V. et al, 2018. Supporting understanding of students’ learning via visual self-assessment. In EUNIS Annual Congress.
Kostousov S.A., Kudryavtsev D.V., 2017. Towards a framework of using knowledge tools for teaching by solving problems in technology-enhanced learning environment, Proceedings of the International Association for Development of the Information Society (IADIS) International Conference on Cognition and Exploratory Learning in Digital Age. Algarve, Portugal. 246-251.
Kostousov S.A., Simonova I.V., 2019. Visual modeling on programming lessons with elements of problem solving in the high school. Information Innovative Technologies: Materials of the International scientific–рractical conference. /Ed. Uvaysov S. U., Ivanov I.A. – M.: Association of graduates and employees of AFEA named after prof. Zhukovsky, 2019, 348 p.
Koznov D. V., 2012. Fundamentals of Visual Modeling. Moscow, BINOM Publ. Kwon K., Cheon J., 2019. Exploring Problem Decomposition and Program Development through Block-Based Programs.
International Journal of Computer Science Education in Schools, 3(1), n1. Maker C. J., et al., 2008. Development of creativity: The influence of varying levels of implementation of the
DISCOVER curriculum model, a non-traditional pedagogical approach. Learning and Individual Differences, 18(4), 402-417.
Makhmutov M. I.,1977. Organizing problem-based learning at school. Moscow: Prosveshenie. 240p. Sawyer R., et al, 2018. Filtered Time Series Analyses of Student Problem-Solving Behaviors in Game-Based Learning.
International Educational Data Mining Society. Scardamalia M., Bereiter C., 2006. Knowledge building: Theory, pedagogy, and technology. In K. Sawyer (Ed.),
Cambridge Handbook of the Learning Sciences (pp. 97-118). New York: Cambridge University Press. Ünal E., Çakir H., 2017. Students' Views about the Problem Based Collaborative Learning Environment Supported by
Dynamic Web Technologies. Malaysian Online Journal of Educational Technology, 5(2), 1-19. Wang M., et al, 2018. Using cognitive mapping to foster deeper learning with complex problems in a computer-based
environment. Computers in Human Behavior, 87, 450-458. Yew E. H., Goh K., 2016. Problem-based learning: an overview of its process and impact on learning. Health Professions
Education, 2(2), 75-79. Yusri, 2018. The Effects of Problem Solving, Project-Based Learning, Linguistic Intelligence and Critical Thinking on
the Students’ Report Writing. Advances in Language and Literary Studies, [Sl], v. 9, n. 6, p. 21-26.
ISBN: 978-989-8533-93-7 © 2019
272