visimix– productivity tool for the analysis, scale-up and design...
TRANSCRIPT

VisiMix – Productivity Tool for the Analysis, Scale-up and
Design of Mixing Processes in Stirred Tanks
Victor Atiemo-Obeng, Hua Bai, Richard Cope, The Dow Chemical CompanyCesar Gonzalez, Styron LLC
VisiMix International ConferenceBoston, MA
July 13-15th 2011
VisiMix International Conference, Boston, MA, July 13-15, 2011
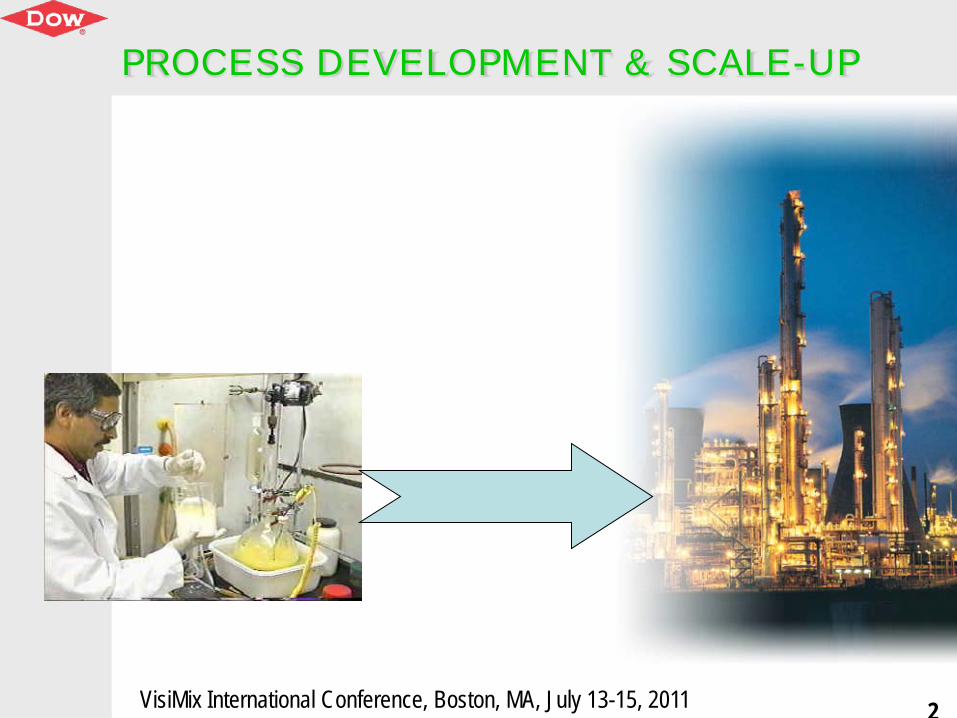
PROCESS DEVELOPMENT & SCALE-UP
2
VisiMix International Conference, Boston, MA, July 13-15, 2011
PROCESS DEVELOPMENT & SCALE-UP
3
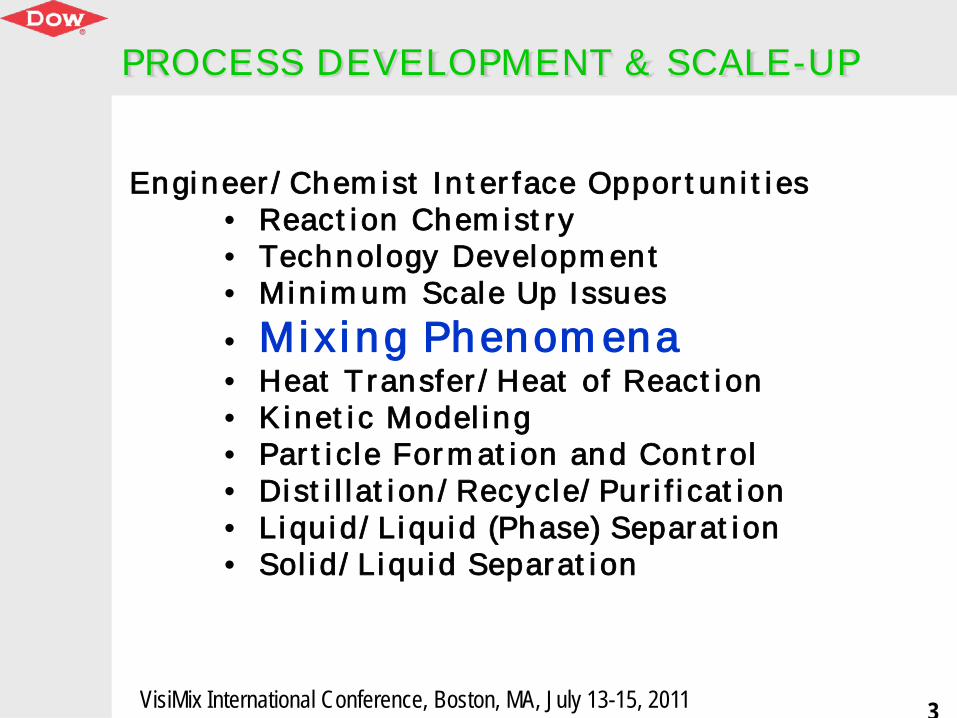
Engineer / Chem ist In t er face Oppor t un i t i es • React i on Chem ist ry• Technology Developm ent• Min im um Scale Up Issues• Mi x i ng Phenom ena• Heat Transfer / Heat of React i on• K inet i c Model i ng• Par t i cle For m at i on and Cont rol• Di st i l lat i on / Recycle/ Pur i f i cat i on• Liquid/ Li quid (Phase) Separat i on• Sol i d/ Li quid Separat i on

VisiMix International Conference, Boston, MA, July 13-15, 2011
Important lesson for Process Development
4
Early assessment of effect of mixing on processOpportunity is higher toinfluence process decisionsavoid /prevent process scale-up problems !!achieve process goals
Cost to make changes is lower
VisiMix International Conference, Boston, MA, July 13-15, 2011
RESOURCES
5
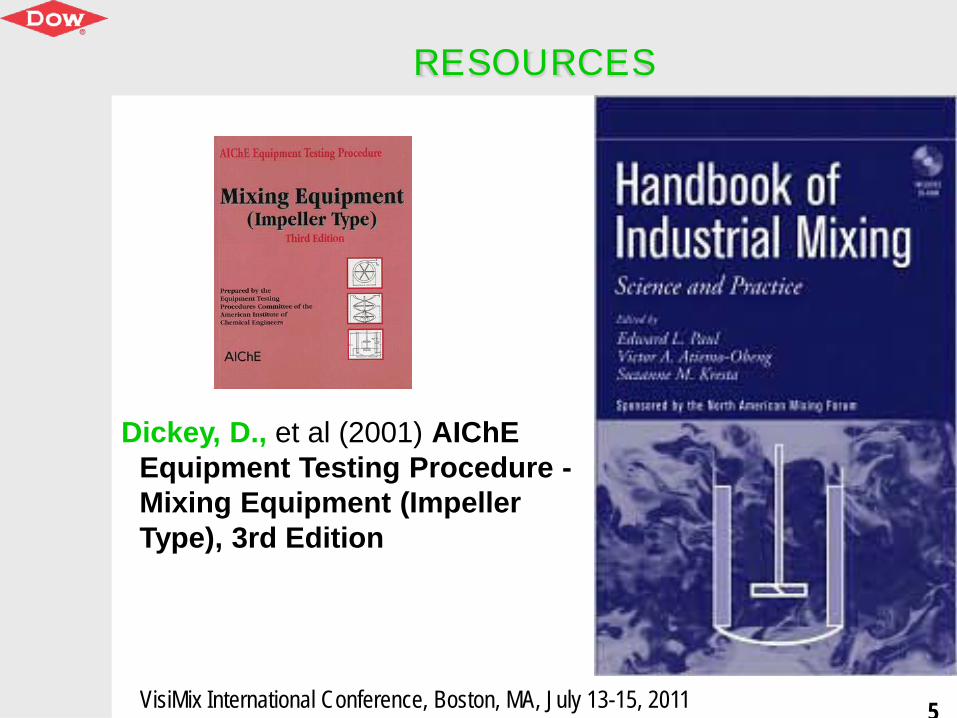
Dickey, D., et al (2001) AIChE Equipment Testing Procedure -Mixing Equipment (Impeller Type), 3rd Edition

VisiMix International Conference, Boston, MA, July 13-15, 2011
Key Steps in Process / Mixing Consulting & Problem Solving
6
Define the cor rect problem to be solved Establish mixing objective/desired process result
Perform analysisDetermine required hydrodynamic environment and
operating conditions, relevant physicochemical phenomena and controlling parameters necessary for process successConfirm with basic calculations, experiments
and/or modelingRecommend / select equipment and/or operating conditions to achieve process resultAscer tain reliability of mechanical design

VisiMix International Conference, Boston, MA, July 13-15, 2011
Mixing Processes: Key Variables to explore
7
Effects of• impeller geometry (type, size, etc.)• impeller speed (rpm)• feed location (sub-surface, near impeller)• feed time in semi-batch• feed concentration• temperature• fluid viscosity•Etc.
VisiMix International Conference, Boston, MA, July 13-15, 2011
Mixing Problem Solving
8
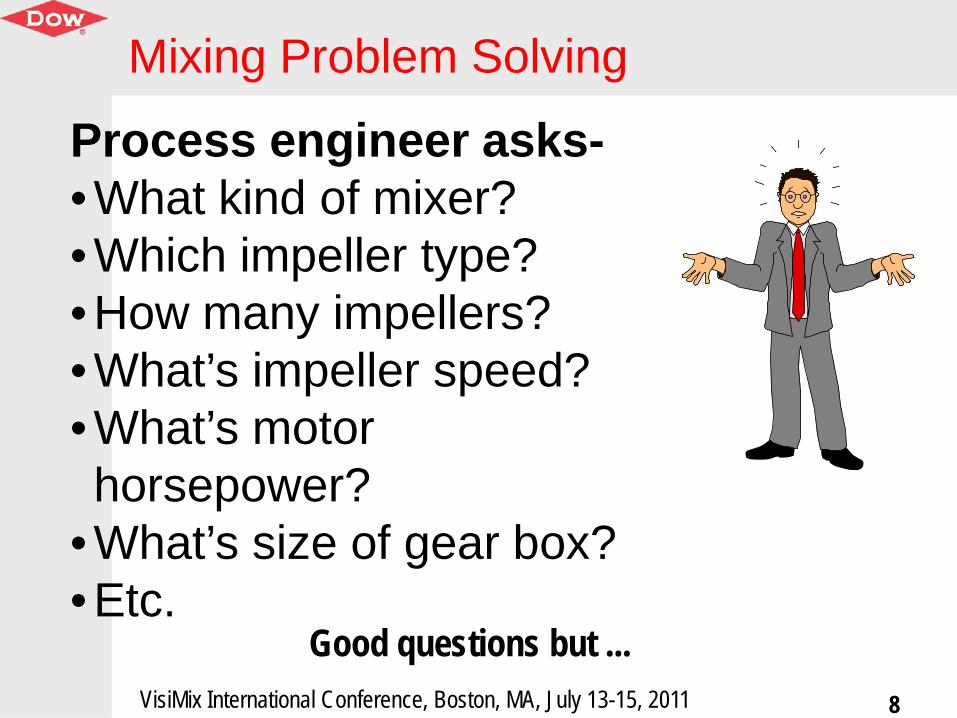
Process engineer asks-• What kind of mixer?• Which impeller type?• How many impellers?• What’s impeller speed?• What’s motor horsepower?
• What’s size of gear box?• Etc.
Good questions but ...
VisiMix International Conference, Boston, MA, July 13-15, 2011
Mixing Problem Solving
9
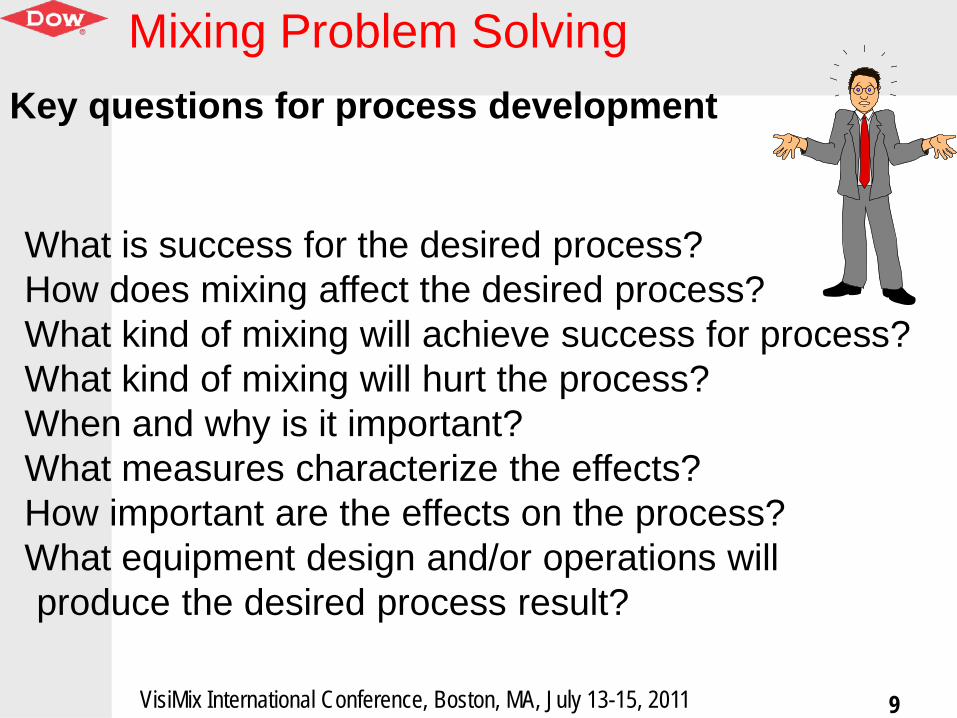
What is success for the desired process?How does mixing affect the desired process?What kind of mixing will achieve success for process?What kind of mixing will hurt the process?When and why is it important?What measures characterize the effects?How important are the effects on the process?What equipment design and/or operations will produce the desired process result?
Key questions for process development
VisiMix International Conference, Boston, MA, July 13-15, 2011
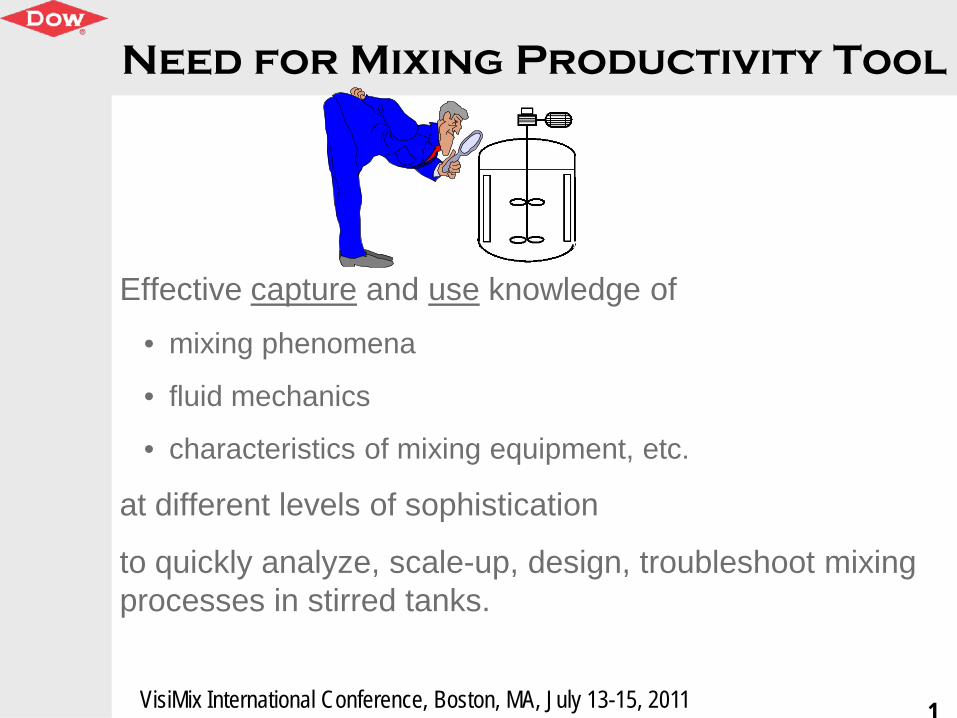
Need for Mixing Productivity Tool
Effective capture and use knowledge of
• mixing phenomena
• fluid mechanics
• characteristics of mixing equipment, etc.
at different levels of sophistication
to quickly analyze, scale-up, design, troubleshoot mixing processes in stirred tanks.
1
VisiMix International Conference, Boston, MA, July 13-15, 2011
Relevance of
11

VisiMix International Conference, Boston, MA, July 13-15, 2011
Relevance of
12
MIXING ASPECTS COVERED:
Hydrodynamics
Turbulence
Single phase Mixing (Blending & Reaction)
Batch, Semi-Batch, Continuous
Liquid-Solid mixing
Liquid-liquid mixing (liquid dispersion)
Liquid-gas mixing (gas dispersion)
Heat Transfer
Mass Transfer in Liquid-solid systems
Mechanical Calculation of Shaft
VisiMix International Conference, Boston, MA, July 13-15, 2011
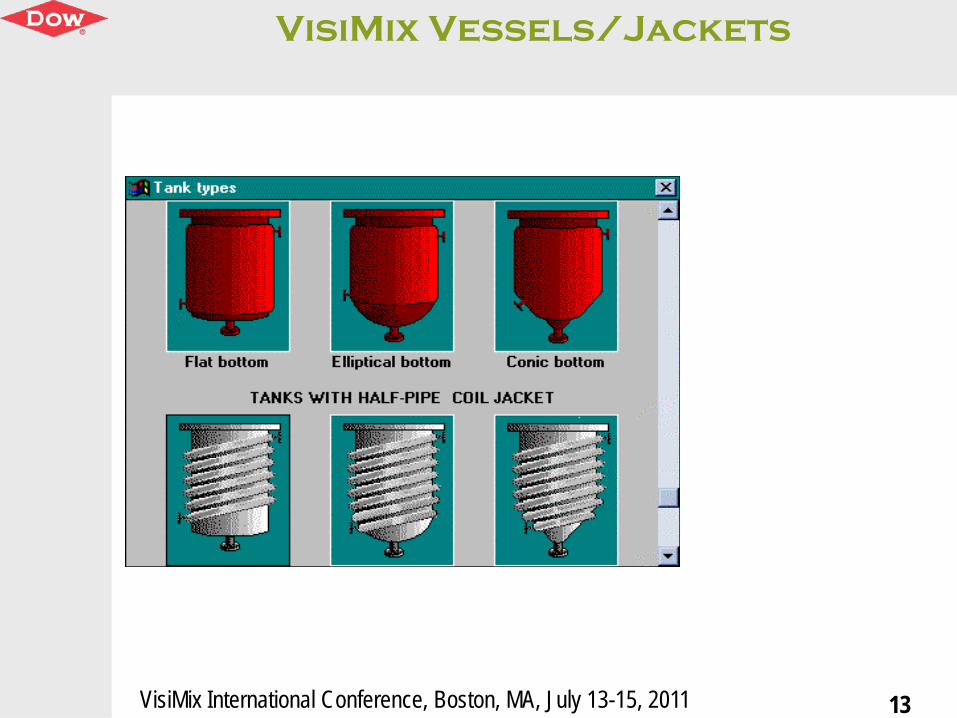
VisiMix Vessels/Jackets
13

VisiMix International Conference, Boston, MA, July 13-15, 2011
VisiMix Impellers
14

VisiMix International Conference, Boston, MA, July 13-15, 2011
VisiMix Baffles
15
VisiMix International Conference, Boston, MA, July 13-15, 2011
RELEVANCE OF
16
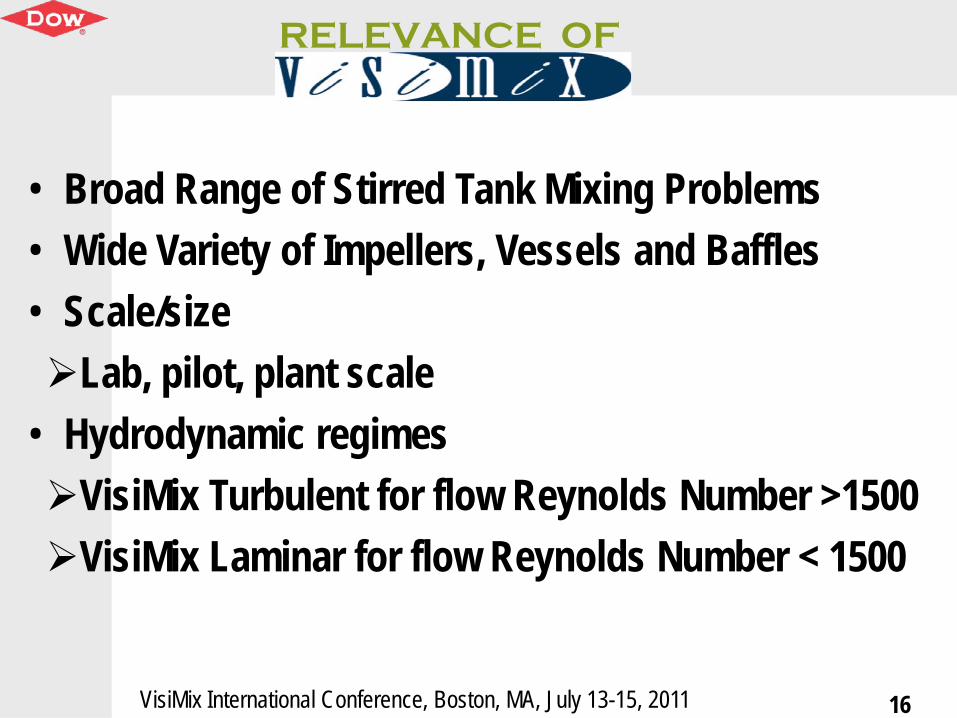
• Broad Range of Stirred Tank Mixing Problems• Wide Variety of Impellers, Vessels and Baffles• Scale/sizeLab, pilot, plant scale
• Hydrodynamic regimesVisiMix Turbulent for flow Reynolds Number >1500VisiMix Laminar for flow Reynolds Number < 1500

VisiMix International Conference, Boston, MA, July 13-15, 2011
Accessibility of
17
VisiMix International Conference, Boston, MA, July 13-15, 2011
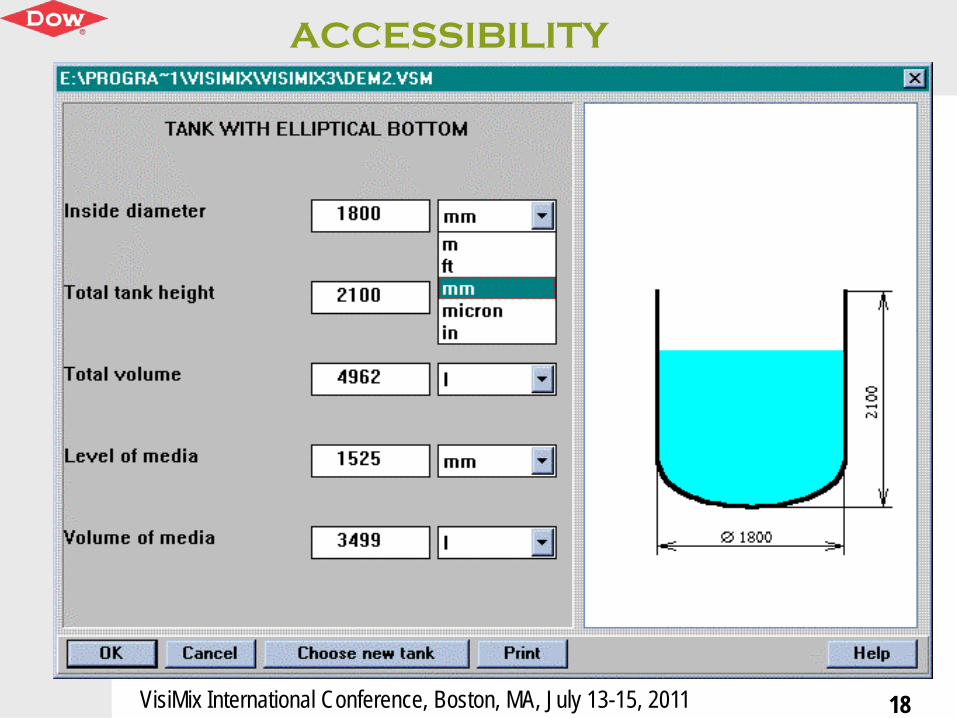
ACCESSIBILITY
18

VisiMix International Conference, Boston, MA, July 13-15, 2011
ACCESSIBILITY
19
VisiMix International Conference, Boston, MA, July 13-15, 2011
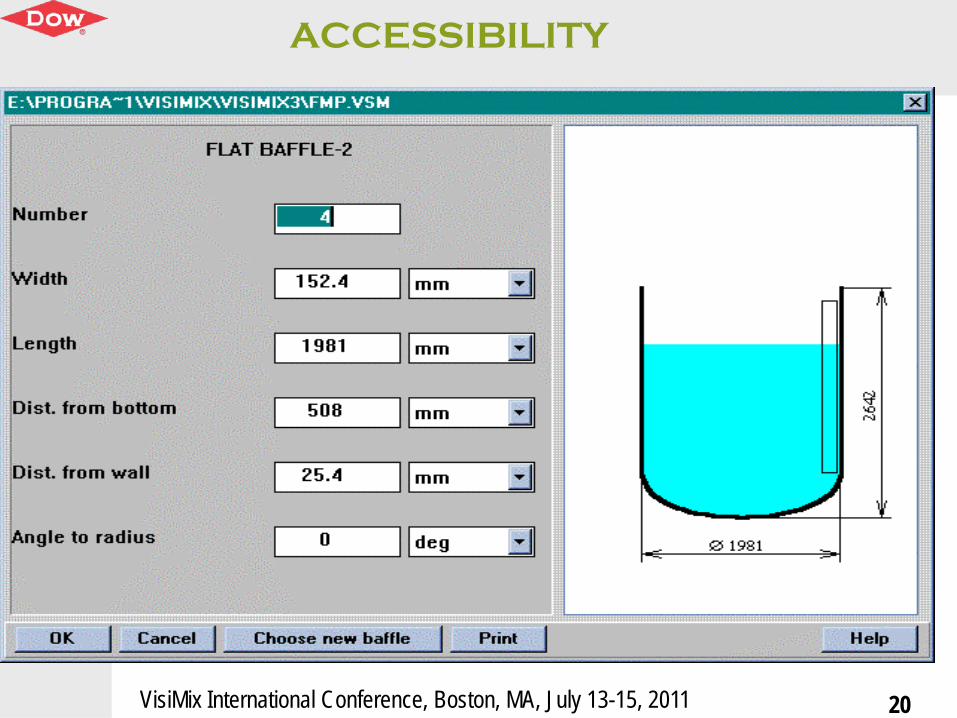
ACCESSIBILITY
20
VisiMix International Conference, Boston, MA, July 13-15, 2011
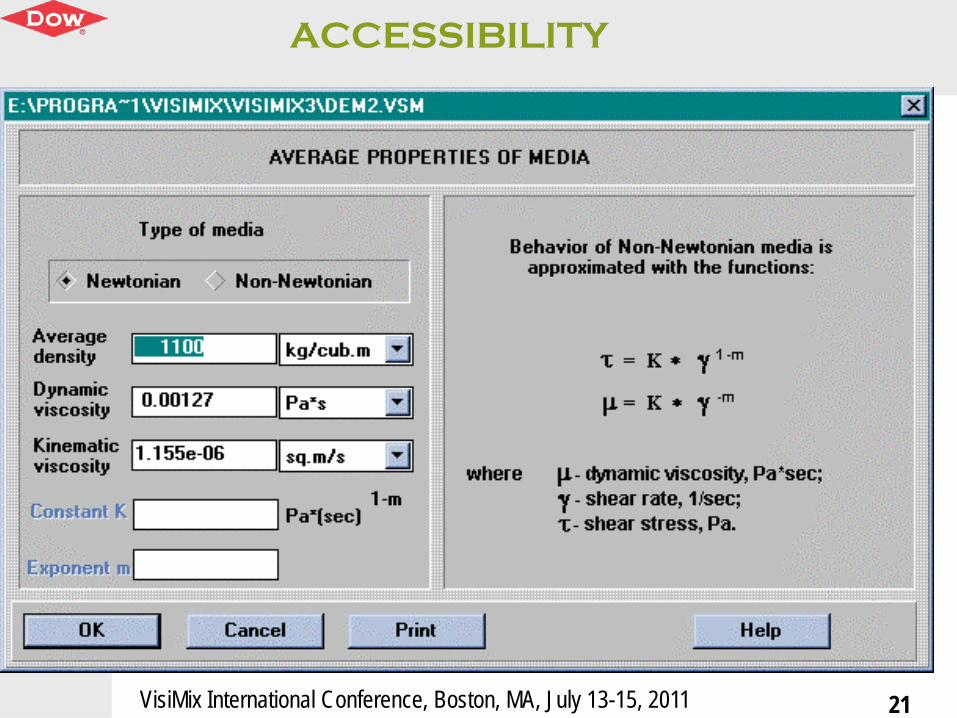
ACCESSIBILITY
21
VisiMix International Conference, Boston, MA, July 13-15, 2011
ACCESSIBILITY
22
VisiMix International Conference, Boston, MA, July 13-15, 2011
ACCESSIBILITY
23
VisiMix International Conference, Boston, MA, July 13-15, 2011
ACCESSIBILITY
24
VisiMix International Conference, Boston, MA, July 13-15, 2011
ACCESSIBILITY OF
25
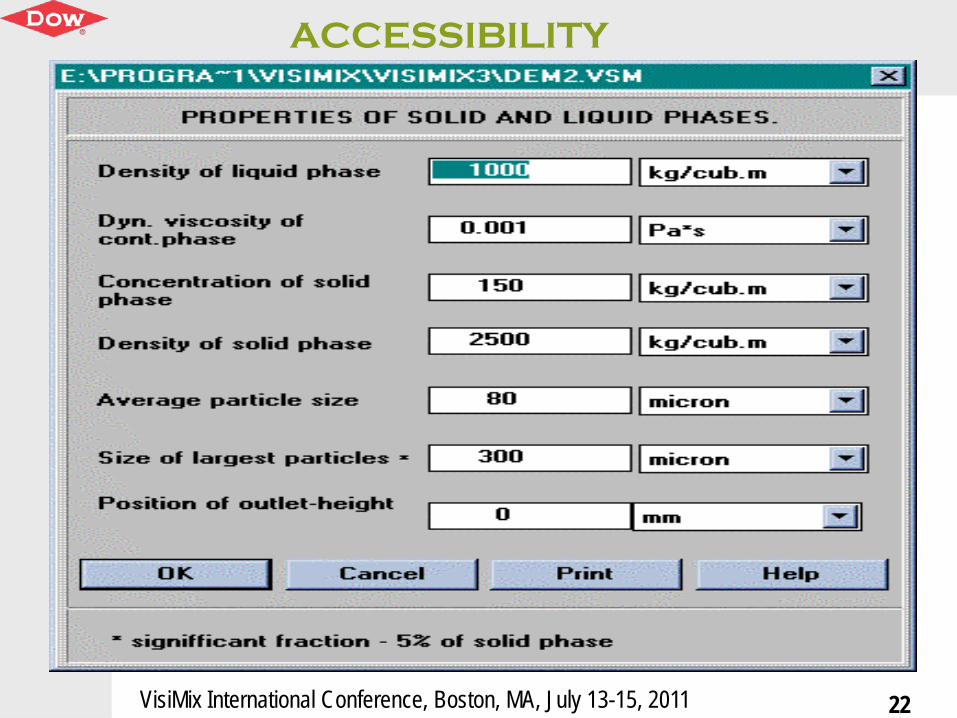
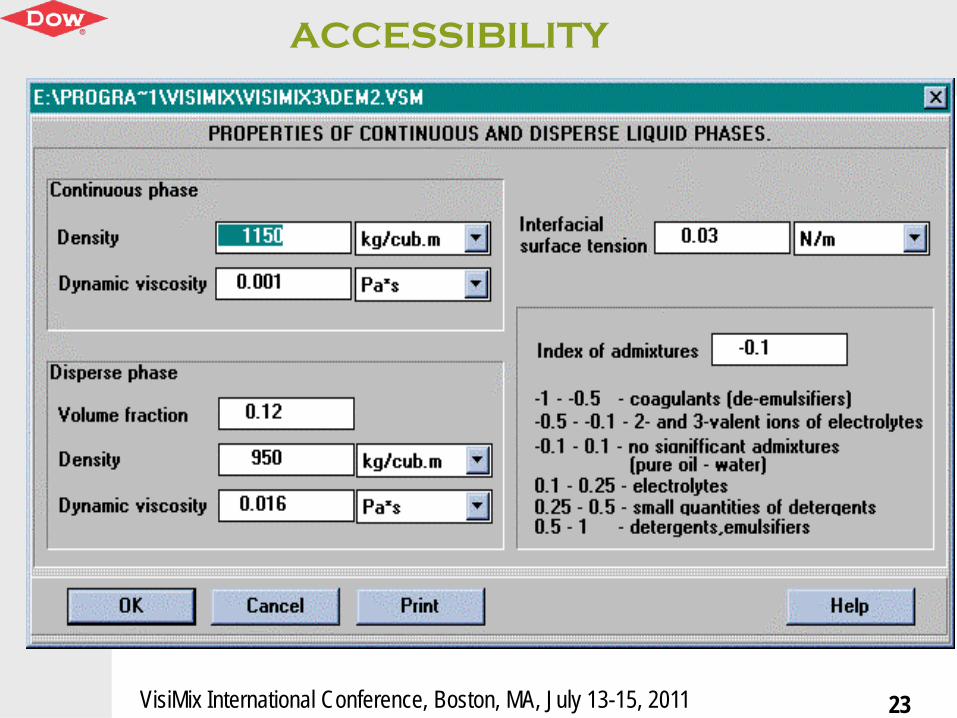
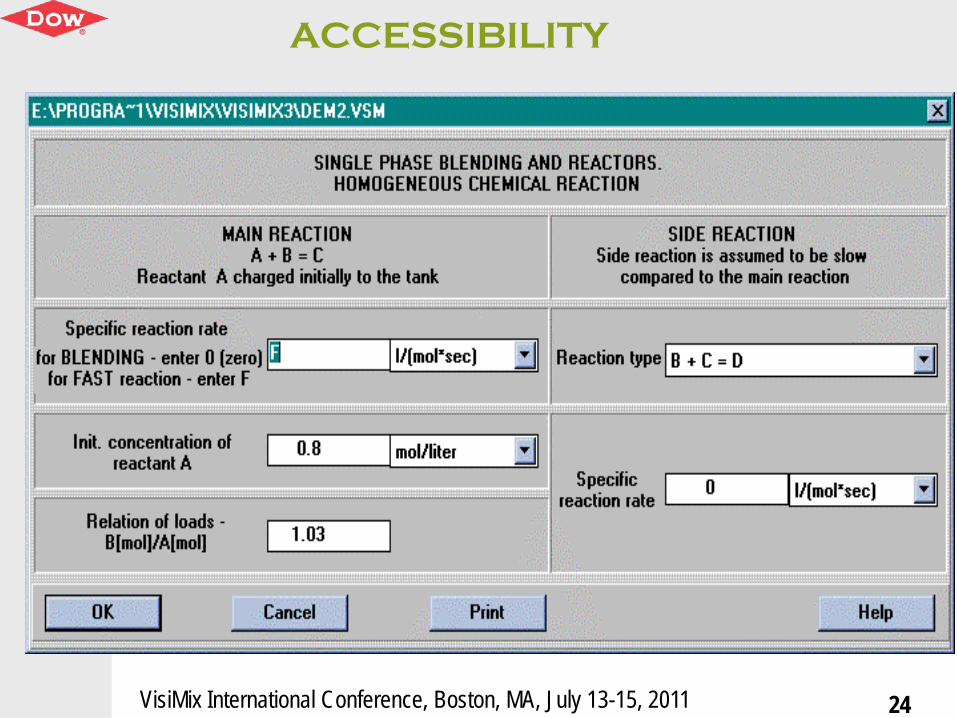
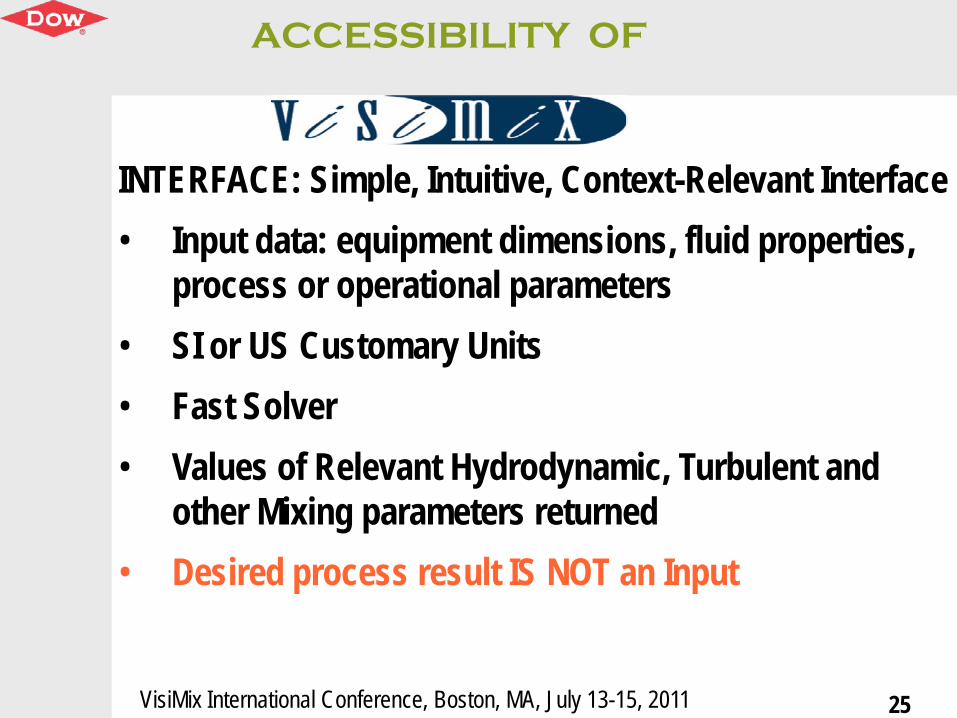
INTERFACE: Simple, Intuitive, Context-Relevant Interface• Input data: equipment dimensions, fluid properties,
process or operational parameters• SI or US Customary Units• Fast Solver• Values of Relevant Hydrodynamic, Turbulent and
other Mixing parameters returned• Desired process result IS NOT an Input

VisiMix International Conference, Boston, MA, July 13-15, 2011
Reliability of
26
VisiMix International Conference, Boston, MA, July 13-15, 2011
Reliability
27
• Comparison with - data - established correlations
• Magnitude as well as functional dependence on key properties and parameters
VisiMix International Conference, Boston, MA, July 13-15, 2011
Reliability
28
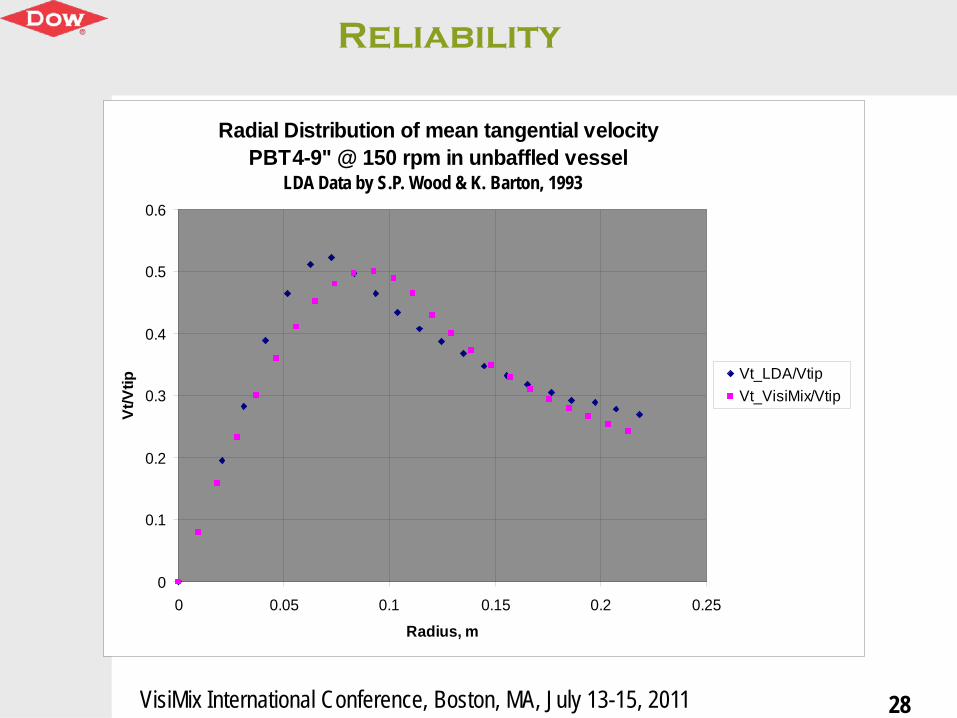
Radial Distribution of mean tangential velocityPBT4-9" @ 150 rpm in unbaffled vessel
0
0.1
0.2
0.3
0.4
0.5
0.6
0 0.05 0.1 0.15 0.2 0.25
Radius, m
Vt/V
tip
Vt_LDA/VtipVt_VisiMix/Vtip
LDA Data by S.P. Wood & K. Barton, 1993

VisiMix International Conference, Boston, MA, July 13-15, 2011
Reliability
29
Radial Distribution of mean tangential velocityDT6-9" @ 150 rpm in unbaffled vessel
0
0.1
0.2
0.3
0.4
0.5
0.6
0.7
0 0.05 0.1 0.15 0.2 0.25
Radius, m
Vt/V
tip
Vt_LDA/VtipVt_VisiMix/Vtip
LDA Data by S.P. Wood & K. Barton, 1993

VisiMix International Conference, Boston, MA, July 13-15, 2011
Reliability
30
Ref.: Ciofalo, M. et al (1996) “Turbulent flow in Closed and Free-surface Unbaffled Tanks Stirred by Radial Impellers”, Chem. Eng.
Sci. 51 (14), pp 3557-3573.Measured
dataVisiMixResults
Vortex Depth @ 139 rpm, m 0.026 0.024Vortex Depth @ 194 rpm, m 0.047 0.047Vortex Depth @ 240 rpm, m 0.073 0.073

VisiMix International Conference, Boston, MA, July 13-15, 2011
Reliability
31
RDT PBT A310Power Number, Po 4.71
5.21.671.31
0.290.3
Ave. Specific Power, W/kg 0.781.0
0.280.26
0.060.06
Mixing time 99%, s 1523
1636
31-
System: WaterT=78 in, H=T, D=T/3, C=T/3, 4 Std. Baffles, N=125
Note: Results calculated with correlations from BHRG-FMP in shaded bold italics
VisiMix International Conference, Boston, MA, July 13-15, 2011
Reliability
32
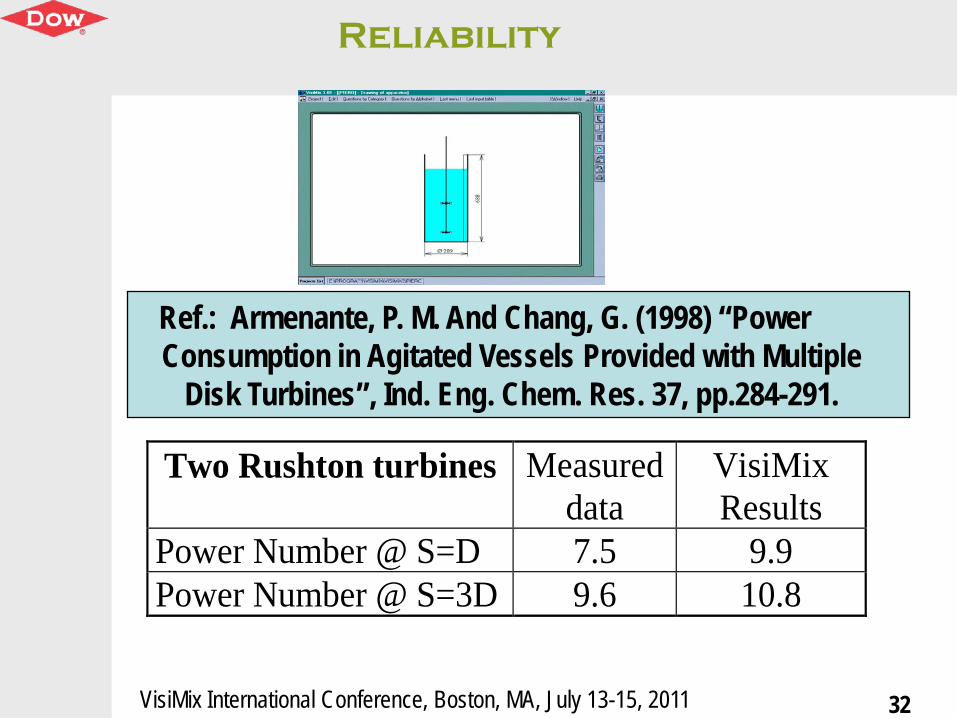
Ref.: Armenante, P. M. And Chang, G. (1998) “Power Consumption in Agitated Vessels Provided with Multiple
Disk Turbines”, Ind. Eng. Chem. Res. 37, pp.284-291.
Two Rushton turbines Measureddata
VisiMixResults
Power Number @ S=D 7.5 9.9Power Number @ S=3D 9.6 10.8

VisiMix International Conference, Boston, MA, July 13-15, 2011
Reliability
33
Ref. Harrop et al (1997) “Impact of suspended solids on the homogenisation of the liquid phase under turbulent conditions in a stirred vessel”, Proceedings of Mixing IX, Paris:
Recent Adv. in Mixing 11 (52), pp41-48System: Water, T=720 mm, H=T, 4 Std. Baffles
A315, D/T=0.42, C=T/4
Note: VisiMix Results courtesy of Dr. Braginsky
N,rpm
W/kgExpt.
W/kgVisiMix
Mixingtime, s
Conducti-vity
Mixingtime, s
Decolori-zation
Mixingtime, sBHRG-
FMP
Mixingtime, s
VisiMix
100 0.038 0.035 19.3 26.6 19.0 24.8150 0.128 0.117 12.3 16.7 12.7 16.6200 0.293 0.278 9.3 11.5 9.6 12.4250 0.544 0.542 7.3 10.0 7.8 9.92300 0.921 0.937 7.3 8.0 6.5 8.27350 1.421 1.490 6.7 7.5 5.7 7.09400 2.123 2.223 5.3 5.8 5.0 6.2

VisiMix International Conference, Boston, MA, July 13-15, 2011
Reliability
34
Liquid/Liquid: 39.1%v Dowtherm E, 61.9%v Shell No. 3747 Oil/Water
Vessel: T=11.1 cm Impeller: RDT, D/T=0.46, C=T/3
Data
d32 µm
VisiMix Results
d32 µm
VisiMix Results
dmean µm
@ 5.0 % (v) dispersed phase, N=174 758 781 574 @ 5.0 % (v) dispersed phase, N=227 608 596 438 @ 5.0 % (v) dispersed phase, N=278 486 486 358 @ 20.0 % (v) dispersed phase, N=174 1108 1065 783 @ 20.0 % (v) dispersed phase, N=227 775 847 622 @ 20.0 % (v) dispersed phase, N=278 646 711 523
Ref.: Ross, et al. (1978) “Droplet Breakage and Coalescence Processes in an Agitated Dispersion. 2. Measurement and Interpretation of Mixing
Experiments”, Ind. Eng. Chem. Fundam., 17 (2) pp 101-108
VisiMix International Conference, Boston, MA, July 13-15, 2011
Reliability
35
0
200
400
600
800
1000
1200
150 170 190 210 230 250 270 290
Mean
drop s
ize, m
icron
Impeller speed, rpm
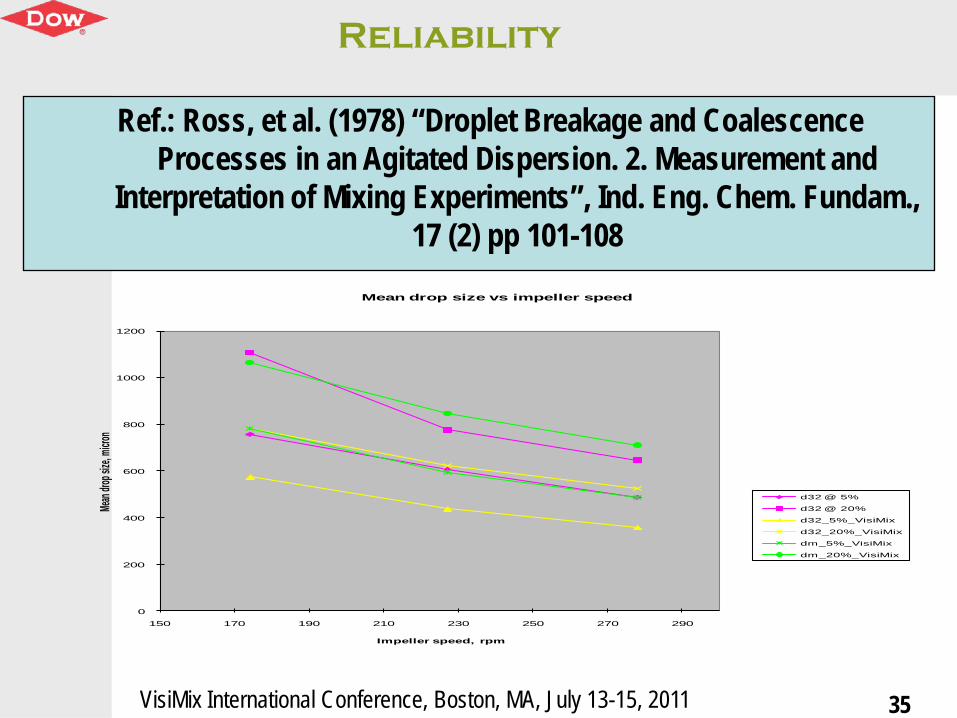
Mean drop size vs impeller speed
d32 @ 5%
d32 @ 20%
d32_5%_VisiMix
d32_20%_VisiMix
dm_5%_VisiMix
dm_20%_VisiMix
Ref.: Ross, et al. (1978) “Droplet Breakage and Coalescence Processes in an Agitated Dispersion. 2. Measurement and
Interpretation of Mixing Experiments”, Ind. Eng. Chem. Fundam., 17 (2) pp 101-108

VisiMix International Conference, Boston, MA, July 13-15, 2011
Reliability
36
• Reasonable match with data or results from established correlations in several selected cases
• Acceptable trends in calculated values• Some results deviate significantly from data
and results from established correlations
VisiMix International Conference, Boston, MA, July 13-15, 2011
VisiMix Application Case #1
37
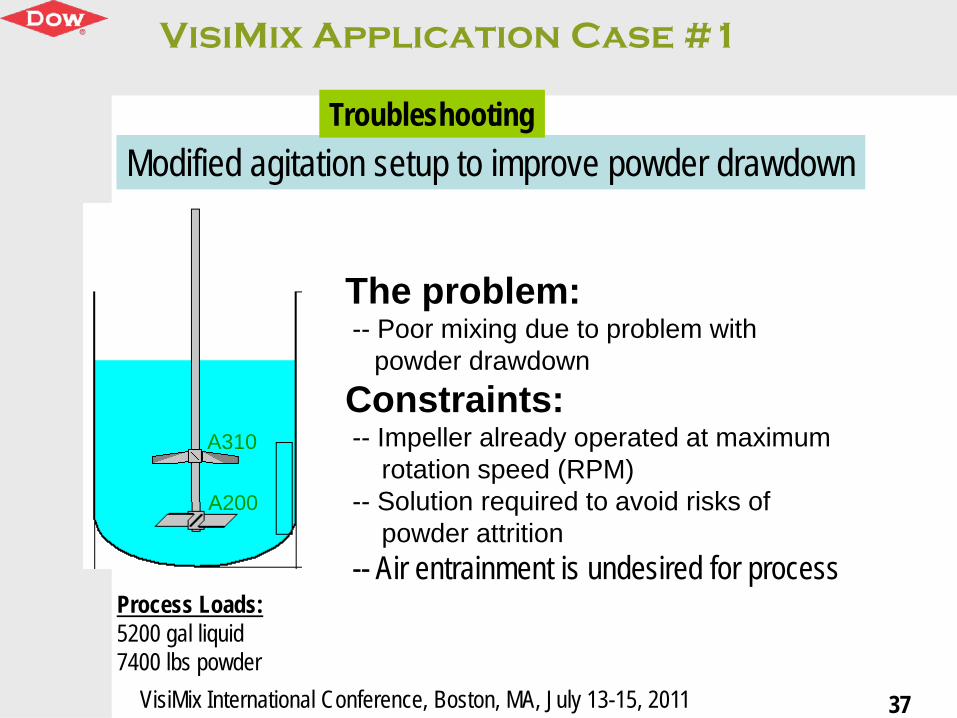
The problem:-- Poor mixing due to problem with
powder drawdownConstraints:-- Impeller already operated at maximum
rotation speed (RPM)-- Solution required to avoid risks of
powder attrition -- Air entrainment is undesired for process
A310
A200
Modified agitation setup to improve powder drawdown
Process Loads:5200 gal liquid 7400 lbs powder
Troubleshooting

VisiMix International Conference, Boston, MA, July 13-15, 2011
VisiMix Application Case #1
38
Previous setup Modified setup
Vortexdepth =H
Vortexdepth >2H
Modification ideas tested / evaluated and further optimized in VISIMIX
-- Switch upper/lower impeller to let A200 (with much higher flow # than A310) at the top-- New positions of both impellers optimized by VISIMIX for maximum powder drawdown
but without causing gas entrainment-- Maintain same shaft RPM to avoid risk of powder attrition-- Implementation: successful modification with almost zero capital
A310 A310
A200
A200
VisiMix International Conference, Boston, MA, July 13-15, 2011
VisiMix Application Case #2
39
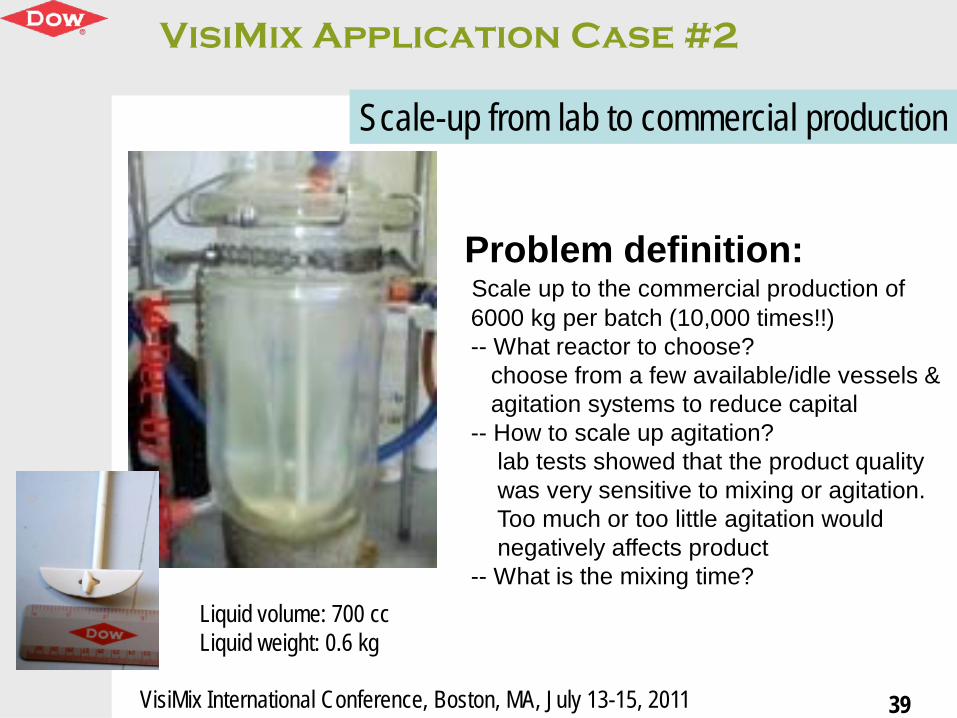
Problem definition:Scale up to the commercial production of 6000 kg per batch (10,000 times!!)-- What reactor to choose?
choose from a few available/idle vessels &agitation systems to reduce capital
-- How to scale up agitation?lab tests showed that the product quality was very sensitive to mixing or agitation. Too much or too little agitation would negatively affects product
-- What is the mixing time?
Scale-up from lab to commercial production
Liquid volume: 700 ccLiquid weight: 0.6 kg

VisiMix International Conference, Boston, MA, July 13-15, 2011
VisiMix Application Case #2
40
Commercial productionReactor:Batch size: 7 m3
Batch weight: 6000 kgLab Reactor:Batch size: 700 ccBatch weight: 0.6 kg
Scale-up by mixing power per unit mass:-- Simulate the lab setup to obtain “mixing power per unit mass”-- Simulate the commercial production with available vessels and agitation systems,
adjust the impeller speed to match the “mixing power per unit mass” -- Verify mixing time -- Successful scale-up implementation
Scale up by 10,000 times with VISIMIX
VisiMix International Conference, Boston, MA, July 13-15, 2011
VisiMix Application Case #3
41
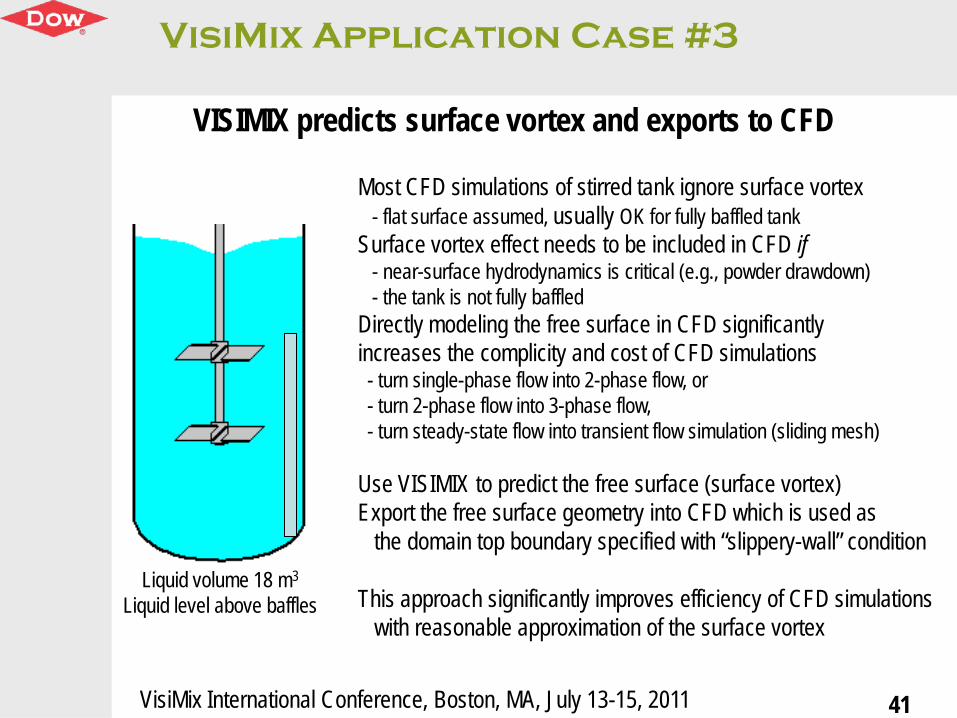
VISIMIX predicts surface vortex and exports to CFD
Most CFD simulations of stirred tank ignore surface vortex- flat surface assumed, usually OK for fully baffled tank
Surface vortex effect needs to be included in CFD if- near-surface hydrodynamics is critical (e.g., powder drawdown)- the tank is not fully baffled
Directly modeling the free surface in CFD significantly increases the complicity and cost of CFD simulations- turn single-phase flow into 2-phase flow, or- turn 2-phase flow into 3-phase flow,- turn steady-state flow into transient flow simulation (sliding mesh)
Use VISIMIX to predict the free surface (surface vortex)Export the free surface geometry into CFD which is used as
the domain top boundary specified with “slippery-wall” condition
This approach significantly improves efficiency of CFD simulationswith reasonable approximation of the surface vortex
Liquid volume 18 m3
Liquid level above baffles

VisiMix International Conference, Boston, MA, July 13-15, 2011
VisiMix Application Case #3
42
Simulation Domain
CFDVISIMIXCFD domain top boundary based on VISIMIX prediction
VisiMix International Conference, Boston, MA, July 13-15, 2011
VisiMix Application Case #4
43
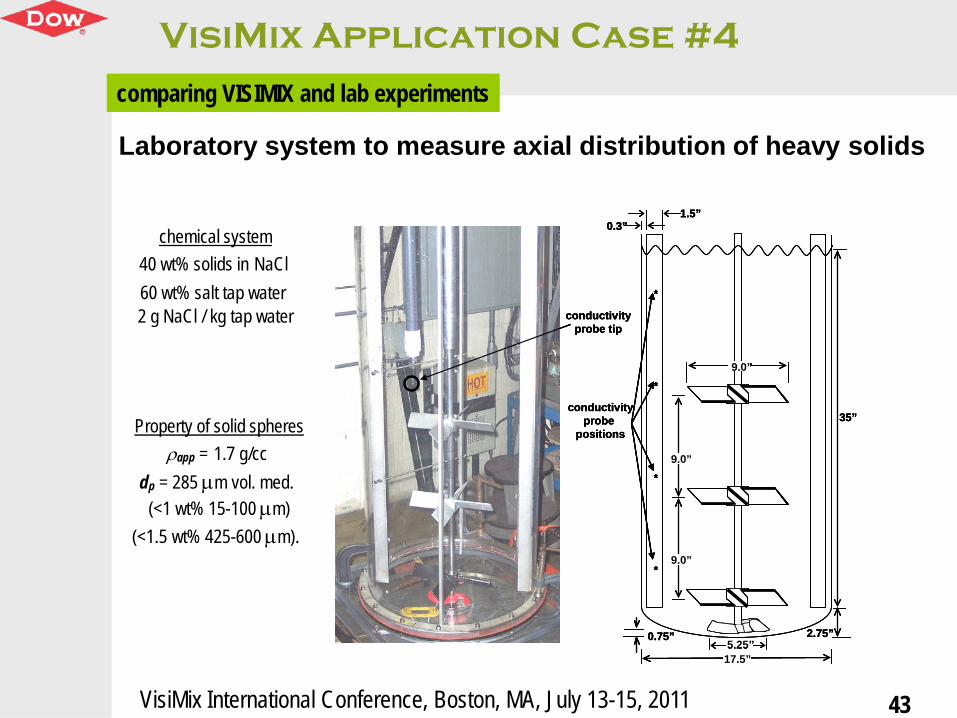
comparing VISIMIX and lab experiments
Laboratory system to measure axial distribution of heavy solids
conductivityprobe tip
9.0”
17.5”5.25”
0.75”
1.5”0.3”
9.0”
9.0”
35”conductivity
probe positions
*
*
*
*
2.75”
conductivityprobe tip
conductivityprobe tip
9.0”
17.5”5.25”
0.75”
1.5”0.3”
9.0”
9.0”
35”conductivity
probe positions
*
*
*
*
2.75”
9.0”9.0”
17.5”5.25”5.25”
0.75”
1.5”0.3”
9.0”9.0”
9.0”9.0”
35”conductivity
probe positions
*
*
*
*
2.75”
chemical system40 wt% solids in NaCl 60 wt% salt tap water2 g NaCl / kg tap water
Property of solid spheresρapp = 1.7 g/cc
dp = 285 µm vol. med.(<1 wt% 15-100 µm)
(<1.5 wt% 425-600 µm).
VisiMix International Conference, Boston, MA, July 13-15, 2011
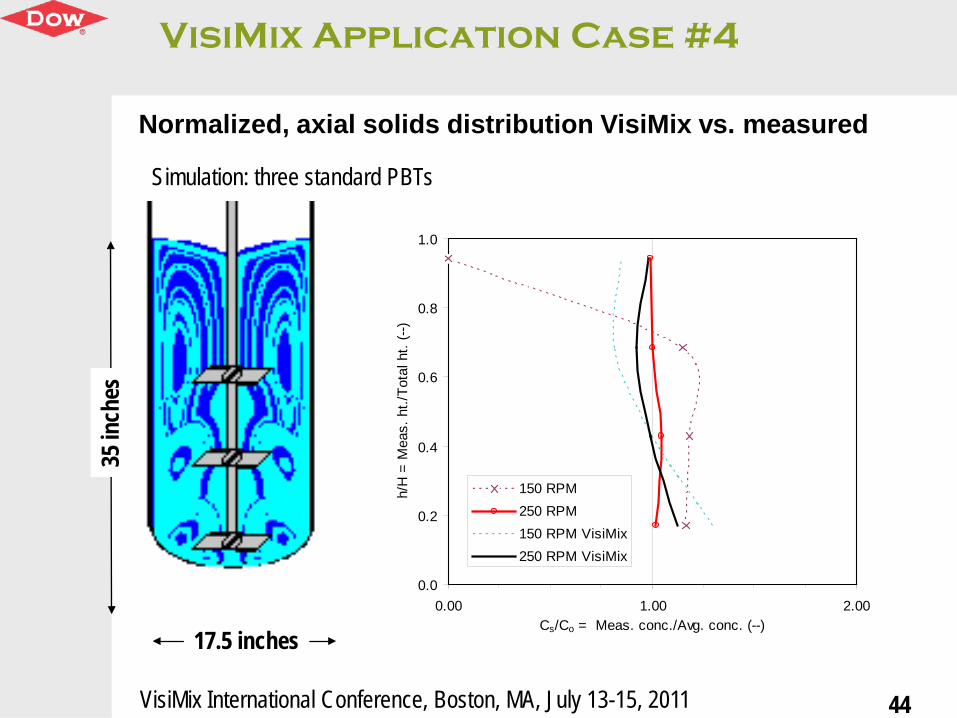
VisiMix Application Case #4
44
0.0
0.2
0.4
0.6
0.8
1.0
0.00 1.00 2.00Cs/Co = Meas. conc./Avg. conc. (--)
h/H
= M
eas.
ht./
Tota
l ht.
(--)
150 RPM250 RPM150 RPM VisiMix250 RPM VisiMix
Normalized, axial solids distribution VisiMix vs. measured
17.5 inches
35 in
ches
Simulation: three standard PBTs

VisiMix International Conference, Boston, MA, July 13-15, 2011
VisiMix Assessment
45
+ Simple, Intuitive, Context-Relevant+ Useful for characterizing and comparing well
defined mixing systems+ No other tool with similar coverage!
VisiMix as an Engineering Productivity Tool
• Rat ing t ool NOT design t ool• Limit ed t o included equipment geomet ries• Limit s of applicabilit y not well def ined