visible structures in number theory structures in number theory peter borwein and loki jorgenson 1....
TRANSCRIPT
Visible Structures in Number Theory
Peter Borwein and Loki Jorgenson
1. INTRODUCTION.
I see a confused mass. Jacques Hadamard (1865-1963)
These are the words the great French mathematician used to describe his initial thoughts when he proved that there is a prime number greater than 11 [11, p. 76]. His final mental image he described as "... a place somehere between the confused mass and the first point". In commenting on this in his fascinating but quirky monograph, he asks "What may be the use of such a strange and cloudy imagery?".
Hadamard was of the opinion that mathematical thought is visual and that words only interfered. And when he inquired into the thought processes of his most distin- guished mid-century colleaugues, he discovered that most of them, in some measure, agreed (a notable exception being George Polya).
For the non-professional, the idea that mathematicians "see" their ideas may be sur- prising. However the history of mathematics is marked by many notable developments grounded in the visual. Descartes' introduction of "cartesian" co-ordinates, for ex- ample, is arguably the most important advance in mathematics in the last millenium. It fundamentally reshaped the way mathematicians thought about mathematics, precisely because it allowed them to "see" better mathematically.
Indeed, mathematicians have long been aware of the significance of visualization and made great effort to exploit it. Carl Friedrich Gauss lamented, in a letter to Hein- rich Christian Schumacher, how hard it was to draw the pictures required for making accurate conjectures. Gauss, whom many consider the greatest mathematician of all time, in reference to a diagram that accompanies his first proof of the fundamental theorem of algebra, wrote
It still remains true that, with negative theorems such as this, transforming personal convictions into objective ones requires deterringly detailed work. To visualize the whole variety of cases, one would have to display a large number of equations by curves; each curve would have to be drawn by its points, and determining a single point alone requires lengthy computations. You do not see from Fig. 4 in my first paper of 1799, how much work was required for a proper drawing of that curve. -Carl Friedrich Gauss (1777-1855)
The kind of pictures Gauss was looking for would now take seconds to generate on a computer screen.
Newer computational environments have greatly increased the scope for visualizing mathematics. Computer graphics offers magnitudes of improvement in resolution and speed over hand-drawn images and provides increased utility through color, anima- tion, image processing, and user interactivity. And, to some degree, mathematics has evolved to exploit these new tools and techniques. We explore some subtle uses of in- teractive graphical tools that help us "see" the mathematics more clearly. In particular, we focus on cases where the right picture suggests the "right theorem", or where it in- dicates structure where none was expected, or where there is the possibility of "visual proof".
December 2001] VISIBLE STRUCTURES IN NUMBER THEORY 897

For all of our examples, we have developed Internet-accessible interfaces. They allow readers to interact and explore the mathematics and possibly even discover new results of their own-visit www.cecm.sfu.calprojects/numbers/.
2. IN PURSUIT OF PATTERNS.
Computers make it easier to do a lot of things, but most of the things they make it easier to do don't need to be done. -Andy Rooney
Mathematics can be described as the science of patterns, relationships, generalized descriptions, and recognizable structure in space, numbers, and other abstracted enti- ties. This view is borne out in numerous examples such as [16] and [15]. Lynn Steen has observed [19]:
Mathematical theories explain the relations among patterns; functions and maps, operators and morphisms bind one type of pattern to another to yield lasting mathematical structures. Application of mathematics use these patterns to "explain" and predict natural phenomena that fit the patterns. Patterns suggest other patterns, often yielding patterns of patterns.
This description conjures up images of cycloids, Sierpinski gaskets, "cowboy hat" surfaces, and multi-colored graphs. However it isn't immediately apparent that this patently visual reference to patterns applies throughout mathematics. Many of the higher order relationships in fields such as number theory defy pictorial representa- tion or, at least, they don't immediately lend themselves intuitively to a graphic treat- ment. Much of what is "pattern" in the knowledge of mathematics is instead encoded in a linear textual format born out of the logical formalist practices that now dominate mathematics.
Within number theory, many problems offer large amounts of "data" that the human mind has difficulty assimilating directly. These include classes of numbers that satisfy certain criteria (e.g., primes), distributions of digits in expansions, finite and infinite series and summations, solutions to variable expressions (e.g., zeroes of polynomials), and other unmanageable masses of raw information. Typically, real insight into such problems has come directly from the mind of the mathematician who ferrets out their essence from formalized representations rather than from the data. Now computers make it possible to "enhance" the human perceptual/cognitive systems through many different kinds of visualization and patterns of a new sort emerge in the morass of numbers.
However the epistemological role of computational visualization in mathematics is still not clear, certainly not any clearer than the role of intuition where mental visu- alization takes place. However, it serves several useful functions in current practice. These include inspiration and discovery, informal communication and demonstration, and teaching and learning. Lately though, the area of experimental mathematics has expanded to include exploration and experimentation and, perhaps controversially, for- mal exposition and proof. Some carefully crafted questions have been posed about how experiment might contribute to mathematics [5]. Yet answers have been slow to come, due in part to general resistance and, in some cases, alarm [11] within the mathemat- ical community. Moreover, experimental mathematics finds only conditional support from those who address the issues formally [7], [9].
The value of visualization hardly seems to be in question. The real issue seems to be what it can be used for. Can it contribute directly to the body of mathematical knowledge? Can an image act as a form of "visual proof"? Strong cases can be made to the affirmative [7], [3] (including in number theory), with examples typically in
898 ?g THE MATHEMATICAL ASSOCIATION OF AMERICA [Monthly 108

1/2
Figure 1. A simple "visual proof' of ?O= ()2t )21=3
the form of simplified, heuristic diagrams such as Figure 1. These carefully crafted examples call into question the epistemological criteria of an acceptable proof.
Establishing adequate criteria for mathematical proof is outside the scope of this paper; interested readers can visit [20], a repository for information related to reason- ing with visual representations. Its authors suggest that three necessary, but perhaps not sufficient, conditions may be:
* reliability: the underlying means of arriving at the proof are reliable and the result is unvarying with each inspection
* consistency: the means and end of the proof are consistent with other known facts, beliefs, and proofs
* repeatibility: the proof may be confirmed by or demonstrated to others
Each requirement is difficult to satisfy in a single, static visual representation. Most criticisms of images as mathematical knowledge or tools make this clear [8], [13].
Traditional exposition differs significantly from that of the visual. In the logical formal mode, proof is provided in linearly connected sentences composed of words that are carefully selected to convey unambiguous meaning. Each sentence follows the previous, specifying an unalterable path through the sequence of statements. Although error and misconception are still possible, the tolerances are extremely demanding and follow the strict conventions of deductivist presentation [12].
In graphical representations, the same facts and relationships are often presented in multiple modes and dimensions. For example, the path through the information is usually indeterminate, leaving the viewer to establish what is important (and what is not) and in what order the dependencies should be assessed. Further, unintended infor- mation and relationships may be perceived, either due to the unanticipated interaction of the complex array of details or due to the viewer's own perceptual and cognitive processes.
December 2001] VISIBLE STRUCTURES IN NUMBER THEORY 899
As a consequence, successful visual representations tend to be spartan in their de- tail. And the few examples of visual proof that withstand close inspection are limited in their scope and generalizability. The effort to bring images closer to conformity with the prevailing logical modes of proof has resulted in a loss of the richness that is intrinsic to the visual.
3. IN SUPPORT OF PROOF.
Computers are useless. They can only give you answers. -Pablo Picasso (1881-1973)
In order to offer the reliability, consistency, and repeatability of the written word and still provide the potential inherent in the medium, visualization needs to offer more than just the static image. It too must guide, define, and relate the information presented. The logical formalist conventions for mathematics have evolved over many decades, resulting in a mode of discourse that is precise in its delivery. The order of presentation of ideas is critical, with definitions preceding their usage, proofs separated from the general flow of the argument for modularity, and references to foundational material listed at the end.
To do the same, visualization must include additional mechanisms or conventions beyond the base image. It isn't appropriate simply to ape the logical conventions and find some visual metaphor or mapping that works similarly (this approach is what limits existing successful visual proofs to very simple diagrams). Instead, an effective visualization needs to offer several key features
* dynamic: the representation should vary through some parameter(s) to demonstrate a range of behaviours (instead of the single instance of the static case)
* guidance: to lead the viewer through the appropriate steps in the correct order, the representation should offer a "path" through the information that builds the case for the proof
* flexibility: it should support the viewer's own exploration of the ideas presented, including the search for counterexamples or incompleteness
* openness: the underlying algorithms, libraries, and details of the programming lan- guages and hardware should be available for inspection and confirmation
With these capabilities available in an interactive representation, the viewer could then follow the argument being made visually, explore all the ramifications, check for coun- terexamples, special cases, and incompleteness, and even confirm the correctness of the implementation. In fact, the viewer should be able to inspect a visual representa- tion and a traditional logical formal proof with the same rigor.
Although current practice does not yet offer any conclusions as to how images and computational tools may impact mathematical methodologies or the underlying epis- temology, it does indicate the direction that subsequent work may take. Examples offer some insight into how emerging technologies may eventually provide an unambiguous role for visualization in mathematics.
4. THE STRUCTURE OF NUMBERS. Numbers may be generated by a myriad of means and techniques. Each offers a very small piece of an infinitely large puzzle. Number theory identifies patterns of relationship between numbers, sifting for the sub- tle suggestions of an underlying fundamental structure. The regularity of observable features belies the seeming abstractness of numbers.
900 ?M THE MATHEMATICAL ASSOCIATION OF AMERICA [Monthly 108
LI
| - I I..
__:r_ _ II * r
_- - M -:-1:::
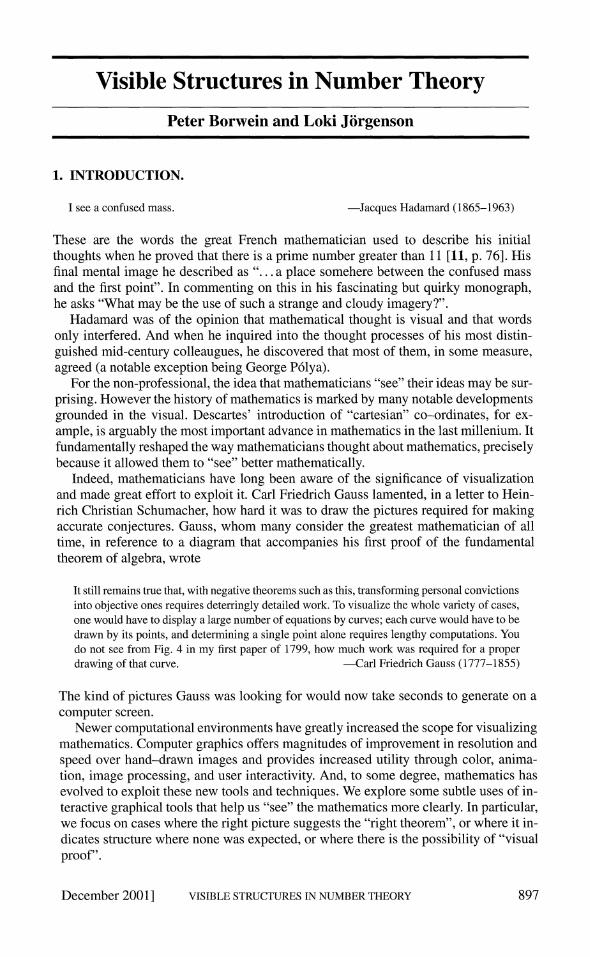
Figure 2. The first 1600 decimal digits of 7r mod 2.
Binary Expansions. In the 17th century, Gottfried Wilhelm Leibniz asked in a letter to one of the Bernoulli brothers if there might be a pattern in the binary expansion of 7. Three hundred years later, his question remains unanswered. The numbers in the expansion appear to be completely random. In fact, the most that can now be said of any of the classical mathematical constants is that they are largely non-periodic.
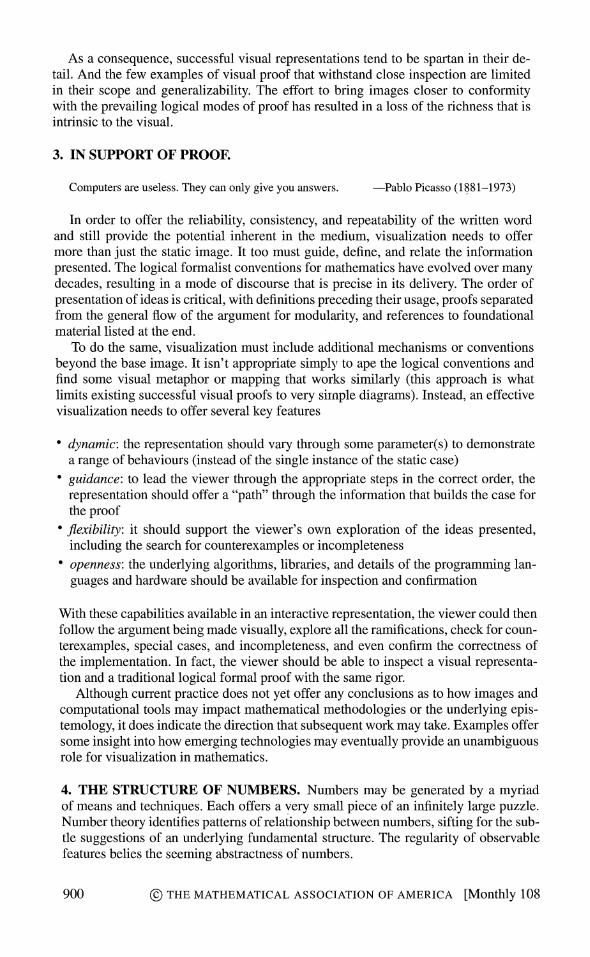
With traditional analysis revealing no patterns of interest, generating images from the expansions offers intriguing alternatives. Figures 2 and 3 show 1600 decimal digits of 7r and 22/7 respectively, both taken mod 2. The light pixels are the even digits and the dark ones are the odd. The digits read from left to right, top to bottom, like words in a book.
What does one see? The even and odd digits of 7r in Figure 2 seem to be dis- tributed randomly. And the fact that 22/7 (a widely used approximation for w7) is ra- tional appears clearly in Figure 3. Visually representing randomness is not a new idea; Pickover [18] and Voelcker [22] have previously examined the possibility of "seeing randomness". Rather, the intention here is to identify patterns where none has so far been seen, in this case in the expansions of irrational numbers.
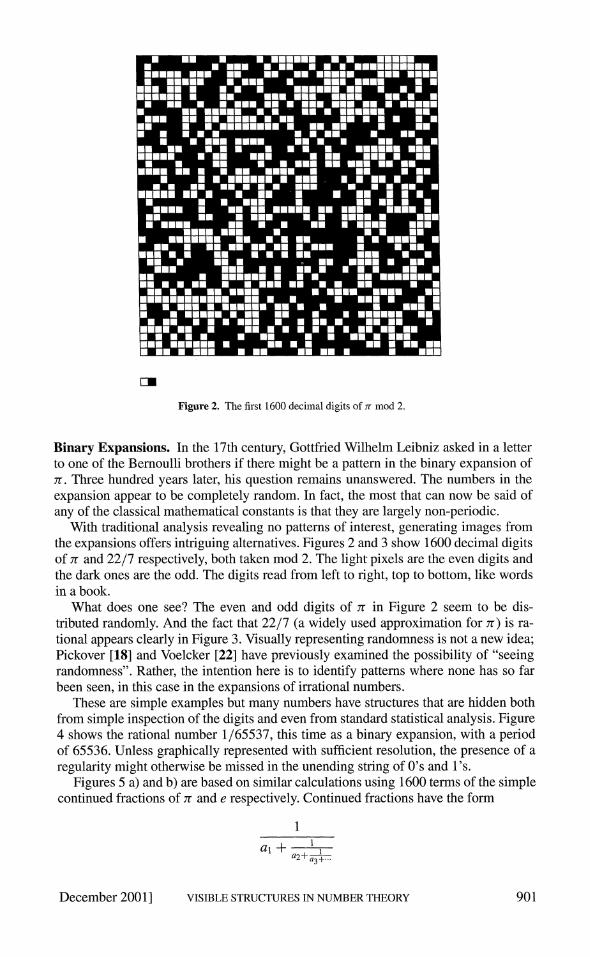
These are simple examples but many numbers have structures that are hidden both from simple inspection of the digits and even from standard statistical analysis. Figure 4 shows the rational number 1/65537, this time as a binary expansion, with a period of 65536. Unless graphically represented with sufficient resolution, the presence of a regularity might otherwise be missed in the unending string of O's and l's.
Figures 5 a) and b) are based on similar calculations using 1600 terms of the simple continued fractions of -r and e respectively. Continued fractions have the form
1
a2+ I3+.H.
December 2001] VISIBLE STRUCTURES IN NUMBER THEORY 901
Eu
Figure 3. The first 1600 decimal digits of 22/7 mod 2.
Figure 4. The first million binary digits of 1/65537 reveal the subtle diagonal structure from the periodicity.
902 nC THE MATHEMATICAL ASSOCIATION OF AMERICA [Monthly 108

.~~~~~~~~~ ME
I- ~ ~ J
LL._j
AILA
I FM I~~~~~~~~~~~~~~~~~~~~~~~~~~~
M -Ij-ja jW1- -
Figure 5. The first 1600 values of the continued fraction for a) 7r and b) e, both mod 4

In these images, the decimal values have been taken mod 4. Again the distribution of the ai of 7r appears random though now, as one would expect, there are more odds than evens. However for e, the pattern appears highly structured. This is no surprise on closer examination, as the continued fraction for e is
[2,1,2,1,1,4,1,1,6,1,1,8,1,1,10,1,1,12,...]
and, if taken as a sequence of digits, is a rational number mod 4. It is apparent from the images that the natures of the various distributions are quite distinct and recognizable. In contrast no such simple pattern exists for exp(3) mod 4.
Presumably this particular visual representation offers a qualitative characteriza- tion of the numbers. It tags them in an instantly distinguishable fashion that would be almost impossible to do otherwise.
Sequences of Polynomials.
Few things are harder to put up with than the annoyance of a good example. -Mark Twain (1835-19 10)
In a similar vein, structures are found in the coefficients of sequences of polyno- mials. The first example in Figure 6 shows the binomial coefficients (n) mod 3, or equivalently Pascal's Triangle mod 3. For the sake of what follows, it is convenient to think of the ith row as the coefficients of the polynomial (1 + x)i taken mod three. This apparently fractal pattern has been the object of much careful study [101.
Figure 7 shows the coefficients of the first eighty Chebyshev polynomials mod 3 laid out like the binomial coefficients of Figure 6. Recall that the nth Chebyshev poly- nomial Tn, defined by Tn (x) = cos (n arccos x), has the explicit representation
n Ln/2i (n-k-i)! Tn(x) = O2 k= Mk!(n- 2k)!(2x)n2k,
and satisfies the recursion
Tn(x) = 2xTn-1(x) -Tn-2(x), n = 2, 3,.
Figure 6. Eighty rows of Pascal's Triangle mod 3
904 ( TIHE MATHEMATICAL ASSOCIATION OF AMERICA [Monthly 108
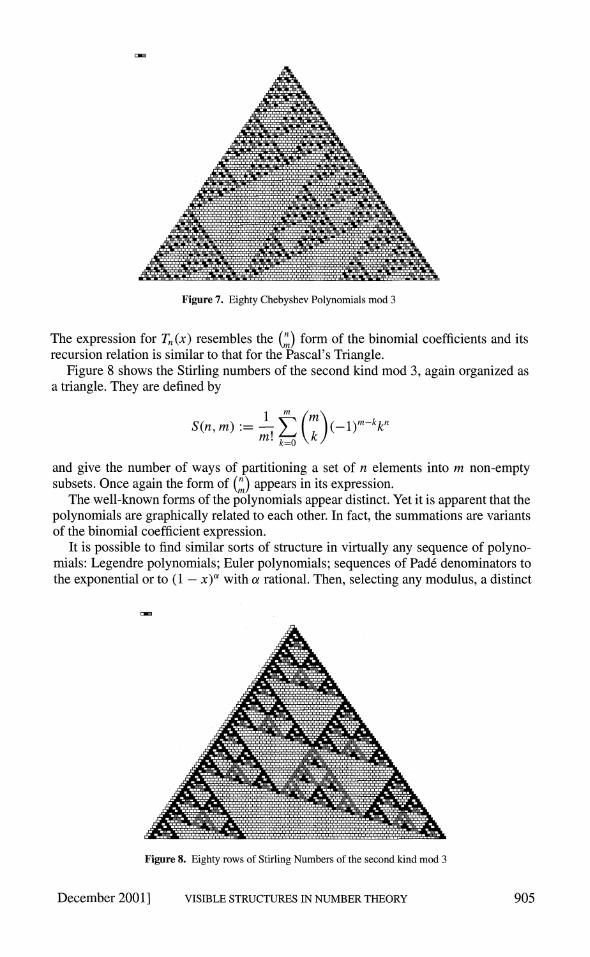
Figure 7. Eighty Chebyshev Polynomials mod 3
The expression for Tn (x) resembles the (m) form of the binomial coefficients and its recursion relation is similar to that for the Pascal's Triangle.
Figure 8 shows the Stirling numbers of the second kind mod 3, again organized as a triangle. They are defined by
and give the number of ways of partitioning a set of n elements into m non-empty subsets. Once again the form of (m) appears in its expression.
The well-known forms of the polynomials appear distinct. Yet it is apparent that the polynomials are graphically related to each other. In fact, the summations are variants of the binomial coefficient expression.
It is possible to find similar sorts of structure in virtually any sequence of polyno- mials: Legendre polynomials; Euler polynomials; sequences of Pade denominators to the exponential or to (1 -x)~ with ae rational. Then, selecting any modulus, a distinct
~~~~Figure 8 . Eghyhows ofe Stirling Numbers of the second kind mod 3,ainogizds
1 e INUB TO 905
S(,m --_! k ' 1
of~~~~~~~~ theiit bioil ofiieteprsin It is possible to find similar sot f sructrenvrtulyayseuneo polyno
. . .. . . . . . . . . . . . . . .
Fiur 8Egty oso STilin Nubr fteseodknLo
pattern emerges. These images indicate an underlying structure within the polynomi- als themselves and demand some explanation. While conjectures exist for their origin, proofs for the theorems suggested by these pictures do not yet exist. And when there finally is a proof, might it be offered in some visual form?
Quasi-Rationals.
For every problem, there is one solution which is simple, neat, and wrong. -H.L. Mencken (1880-1956)
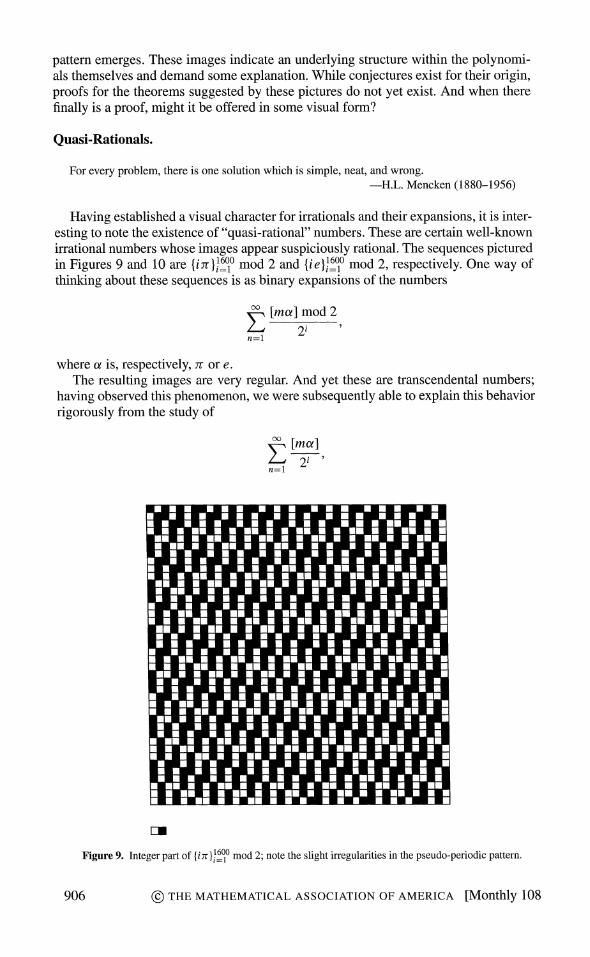
Having established a visual character for irrationals and their expansions, it is inter- esting to note the existence of "quasi-rational" numbers. These are certain well-known irrational numbers whose images appear suspiciously rational. The sequences pictured in Figures 9 and 10 are {iTr11600 mod 2 and {ie1l1600 mod 2, respectively. One way of thinking about these sequences is as binary expansions of the numbers
[ma] mod 2 E 2i
n=1
where a is, respectively, -r or e. The resulting images are very regular. And yet these are transcendental numbers;
having observed this phenomenon, we were subsequently able to explain this behavior rigorously from the study of
Eu2i n=1
Figure 9. Integer part of I{i r1 1600 mod 2; note the slight irregularities in the pseudo-periodic pattern. 906 ? T H AI O
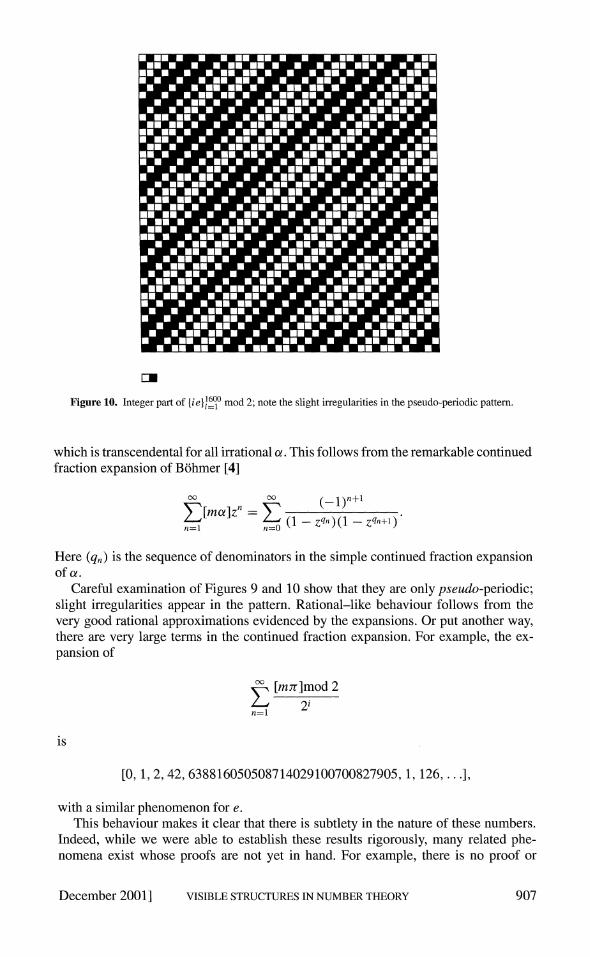
Figure 10. Integer part of {iel1j00 mod 2; note the slight irregularities in the pseudo-periodic pattern.
which is transcendental for all irrational a. This follows from the remarkable continued fraction expansion of Bohmer [4]
[ma]z~ = (-I1)n+l
1 Lo(1- zZqn)(l -Zqln+l)
Here (qn) is the sequence of denominators in the simple continued fraction expansion of a.
Careful examination of Figures 9 and 10 show that they are only pseudo-periodic; slight irregularities appear in the pattern. Rational-like behaviour follows from the very good rational approximations evidenced by the expansions. Or put another way, there are very large terms in the continued fraction expansion. For example, the ex- pansion of
[m7r]mod 2 2i n=1
is
[0, 1,2,42, 638816050508714029100700827905, 1,126, . . .1]
with a similar phenomenon for e. This behaviour makes it clear that there is subtlety in the nature of these numbers.
Indeed, while we were able to establish these results rigorously, many related phe- nomena exist whose proofs are not yet in hand. For example, there is no proof or
December 2001] VISIBLE STRUCTURES IN NUMBER THEORY 907

explanation for the visual representation of
[m7r]mod 2 3i
n=1
Proofs for these graphic results might well offer further refinements to their represen- tations, leading to yet another critical graphic characterization.
Complex Zeros. Polynomials with constrained coefficients have been much stud- ied [2], [17], [6]. They relate to the Littlewood conjecture and many other problems. Littlewood notes that "these raise fascinating questions" [14].
Certain of these polynomials demonstrate suprising complexity when their zeros are plotted appropriately. Figure 11 shows the complex zeros of all polynomials
Pfl(z)= ao +alz +a2Z2 + * * * +anzn
of degree n < 18, where ai = (-1, + 1). This image, reminiscent of pictures for poly- nomials with all coefficients in the set {0, +1} [17], does raise many questions: Is the set fractal and what is its boundary? Are there holes at infinite degree? How do the holes vary with the degree? What is the relationship between these zeros and those of polynomials with real coefficients in the neighbourhood of {- 1, + 1 }?
Some, but definitely not all, of these questions have found some analytic an- swer [17], [6]. Others have been shown to relate subtly to standing problems of some significance in number theory. For example, the nature of the holes involves a old problem known as Lehmer's conjecture [1]. It is not yet clear how these images con- tribute to a solution to such problems. However they are provoking mathematicians to look at numbers in new ways.
4lF .... ..>: . ... __LYX
Figure~~~~~ 1Rootso L,tewo Poyoil of dere at mos 18 for...................... coffcint +. 1.=
908 . THE MATHEMATICAL ASSOCIATIONOFAMERICA[Monthly108h...
Fiue .Root ofLitlwod olnoils of degree a most 18 forcoefficient 4: : 1

5. CONCLUSION. Visualization extends the natural capacity of the mathematician to envision his subject, to see the entities and objects that are part of his work with the aid of software and hardware. Since graphic representations are firmly rooted in verifiable algorithms and machines, the images and interfaces may also provide new forms of exposition and possibly even proof. Most important of all, like spacecraft, diving bells, and electron microscopes, visualization of mathematical structures takes the human mind to places it has never been and shows the mind's eye images from a realm previously unseen.
Readers are encouraged to review this paper in full color on-line [21].
ACKNOWLEDGEMENTS. This work has been supported in part by the NCE for Mathematics of Informa- tion Technology and Complex Systems (MITACS), and in part by research and equipment grants from the Natural Sciences and Engineering Research Council of Canada (NSERC). We thank the Centre for Experi- mental & Constructive Mathematics.
REFERENCES
1. F. Beaucoup, P. Borwein, D. Boyd, and C. Pinner, Multiple roots of [-1, 1] power series. l4ndon Math. Soc. 57 (1998) 135-147.
2. A.T. Bharucha-Reid and M. Sambandham, Random Polynomials, Academic Press, Orlandp, FL, 1986. 3. Alex Bogomolny, http://www.cut-the-knot.com/ctk/pww.html 4. J. Borwein and P. Borwein, On the generating function of the integer part: [nu + y], J. Number Theory
43 (1993) 293-318. 5. J.M. Borwein, P.B. Borwein, R. Girgensohn, and S. Parnes, Making sense of experimental mathematics,
www.cecm.sfu.ca/organics/vault/expmath/ 6. P. Borwein and C. Pinner, Polynomials with {0, +1, -11 coefficients and a root close to a given point,
Canadian J. Math. 49 (1997) 887-915. 7. J.R. Brown, Proofs and pictures, Brit. J. Phil. Sci. 48 (1997) 161-180. 8. T. Eisenberg and T. Dreyfuss, On the reluctance to visualize in mathematics, in Visualization in Teaching
and Learning Mathematics, Mathematical Association of America, Washington, DC, 1991, pp. 25-37. 9. Marcus Giaquinto, Epistemology of visual thinking in elementary real analysis, Brit. J. Phil. Sci. 45
(1994) 789-813. 10. A. Granville, The arithmetic properties of binomial coefficients, in Proceedings of the Organic Mathe-
matics Workshop, Dec. 12-14, http://www.cecm.sfu.ca/organics/, 1995. IMpress, Simon Fraser Univer- sity, Burnaby, BC.
11. John Horgan, The death of proof, Scientific American October, 1993, pp. 92-103. 12. Imre Lakatos, Proofs and refutations: the logic of mathematical discovery, Cambridge University Press,
Cambridge, 1976. 13. Bruno Latour, Drawing things together, in Representation in Scientific Practice, Michael Lych and
Steve Woolgar, eds., MIT Press, Cambridge, MA, 1990, pp. 25-37. 14. J.E. Littlewood, Some problems in real and complex analysis, in Heath Mathematical Monographs, D.C.
Heath, Lexington, MA, 1968. 15. Roger A. Nelson, Proofs Without Words II, More Exercises in Visual Thinking, Mathematical Association
of America, Washington, DC, 2000. 16. Roger A. Nelson, Proofs Without Words: Exercises in Visual Thinking, Mathematical Association of
America, Washington, DC, 1993. 17. A. Odlyzko and B. Poonen, Zeros of polynomials with 0,1 coefficients, Enseign. Math. 39 (1993) 317-
348. 18. C. Pickover, Picturing randomness on a graphics supercomputer, IBM J. Res. Develop. 35 (1991) 227-
230. 19. Lynn Arthur Steen, The science of patterns, Science 240 (1988) 611-616. 20. http://www.hcrc.ed.ac.uk/gal/Diagrams/biblio.html 21. http://www.cecm.sfu.ca/-pborwein/ 22. J. Voelcker, Picturing randomness, IEEE Spectrum 8 (1988) 13-16.
December 2001] VISIBLE STRUCTURES IN NUMBER THEORY 909

PETER BORWEIN is a Professor of Mathematics at Simon Fraser University, Vancouver, British Columbia. His Ph.D. is from the University of British Columbia under the supervision of David Boyd. After a postdoc- toral year in Oxford and a dozen years at Dalhousie University in Halifax, Nova Scotia, he took up his current position. He has authored five books and over a hundred research articles. His research interests span diophan- tine and computational number theory, classical analysis, and symbolic computation. He is co-recipient of the Cauvenet Prize and the Hasse Prize, both for exposition in mathematics. CECM, Simon Fraser University, Burnaby, BC, Canada VSA 1S6 [email protected]
LOKI JORGENSON is an Adjunct Professor of Mathematics at Simon Fraser University, Vancouver, British Columbia. Previously the Research Manager for the Centre for Experimental and Constructive Mathematics, he is a senior scientist at Jaalam Research. He maintains his involvement in mathematics as the digital editor for the Canadian Mathematical Society. His Ph.D. is in computational physics from McGill University, and he has been active in visualization, simulation, and computation for over 15 years. His research has included forays into philosophy, graphics, educational technologies, high performance computing, statistical mechanics, high energy physics, logic, and number theory. CECM, Simon Fraser University, Burnaby, BC, Canada VSA 1S6 [email protected]
910 ? THE MATHEMATICAL ASSOCIATION OF AMERICA [Monthly 108