viscosity increase with temperature in cationic surfactant
TRANSCRIPT

Viscosity Increase with Temperature in CationicSurfactant Solutions Due to the Growth of Wormlike
Micelles
Gokul C. Kalur,† Bradley D. Frounfelker, Bani H. Cipriano,Alexander I. Norman, and Srinivasa R. Raghavan*
Department of Chemical Engineering, University of Maryland,College Park, Maryland 20742-2111
Received July 28, 2005. In Final Form: September 14, 2005
Wormlike micellar solutions based on ionic surfactants typically show an exponential decrease in viscosityupon heating. Here, we report the unusual observation of an increasing viscosity with temperature incertain cationic wormlike micellar solutions. The solutions contain a cationic surfactant with an erucyl(C22, mono-unsaturated) tail and an organic salt, sodium hydroxynaphthalene carboxylate (SHNC). Whenthese solutions are heated, their zero-shear viscosity increases over a range of temperatures. In some cases,the viscosity reaches a peak at a certain temperature and then decreases with further heating. The magnitudeof the viscosity increase, the onset of this increase, and the peak temperature can all be tuned by varyingthe SHNC concentration. Small-angle neutron scattering is used to study the origin of this unusual rheologicalbehavior. The data reveal that the contour length of the micelles increases with temperature, in tandemwith the rise in viscosity. A possible explanation for the contour length increase, based on a temperature-dependent counterion binding, is discussed.
1. IntroductionOver the past several years, there has been a great deal
of interest in the aqueous self-assembly of cationicsurfactants into threadlike or wormlike micelles.1,2 Thesemicelles are long, flexible, cylindrical chains with contourlengths on the order of a few micrometers. The entangle-ment of these wormlike chains into a transient networkimparts viscoelastic properties to the solution. Wormlikemicelles are much like polymers with the importantexception that the micelles are in thermal equilibriumwith their monomers.3 The average micellar length Lh isthus a thermodynamic quantity, and it responds tochanges in solution composition and temperature.
Typically, when a wormlike micellar solution is heated,the micellar contour length Lh decays exponentially withtemperature.3,4 The reason for this is that, at highertemperatures, surfactant unimers can hop more rapidlybetween the cylindrical body and the hemispherical end-cap of the worm (the end-cap is energetically unfavorableover the body by a factor equal to the end-cap energy Ec).Thus, because the end-cap constraint is less severe athigher temperatures, the worms grow to a lesser extent.The reduction in micellar length, in turn, leads to anexponential decrease in rheological properties such as thezero-shear viscosity η0 and the relaxation time tR.4-6
Accordingly, an Arrhenius plot of ln η0 versus 1/T (whereT is the absolute temperature) falls on a straight line, theslope of which yields the flow activation energy Ea. Values
of Ea ranging from 70 to 300 kJ/mol have been reportedfor various micellar solutions.4-6
In this paper, we report an unexpected opposite trendin rheological behavior for certain wormlike micellarsolutions as a function of temperature. Instead of droppingexponentially, the zero-shear viscosity η0 increases overa range of temperatures. We use small-angle neutronscattering (SANS) to show that the increase in viscosityis associated with an increase in micellar length. Thesystem in which we see this unusual behavior is a mixtureof a C22-tailed cationic surfactant, erucyl bis-(hydroxy-ethyl)methylammonium chloride (EHAC) and an aromaticsalt, sodium hydroxynaphthalene carboxylate (SHNC)(Scheme 1). The counterion in SHNC is hydrophobic dueto its naphthalene ring and thus has a tendency to bindstrongly with cationic micelles.7,8 The binding of SHNCreduces the surface charge on EHAC micelles and therebypromotes the growth of long worms. While a few mM ofSHNC are sufficient to induce micellar growth, theincrease in viscosity with temperature is seen only at muchhigher SHNC concentrations.
Previously, one of us had studied the same cationicsurfactant, EHAC, with a different aromatic salt, sodiumsalicylate (NaSal).4,9 The crucial difference between NaSaland SHNC is the presence of an extra benzene ring inSHNC (see Scheme 1). Thus, it is useful to compare thepresent EHAC-SHNC system with the previous EHAC-NaSal system. Both systems exhibit an unusual featurein their phase behavior, viz. the presence of cloud points(liquid-liquid phase separation upon heating) at inter-mediate salt concentrations.9 We will begin this paper byreporting the phase behavior of EHAC-SHNC as afunction of salt and temperature and thereafter proceed
* To whom correspondence should be addressed. E-mail:[email protected].
† Present address: Irix Pharmaceuticals, Inc., Florence, SC.(1) Hoffmann, H. Viscoelastic Surfactant Solutions. In Structure and
Flow in Surfactant Solutions; Herb, C. A., Prud’homme, R. K., Eds.;American Chemical Society: Washington, DC, 1994; p 2.
(2) Yang, J. Curr. Opin. Colloid Interface Sci. 2002, 7, 276.(3) Cates, M. E.; Candau, S. J. J. Phys.-Condens. Matter 1990, 2,
6869.(4) Raghavan, S. R.; Kaler, E. W. Langmuir 2001, 17, 300.(5) Makhloufi, R.; Cressely, R. Colloid Polym. Sci. 1992, 270, 1035.(6) Ponton, A.; Schott, C.; Quemada, D. Colloids Surf., A 1998, 145,
37.
(7) Mishra, B. K.; Samant, S. D.; Pradhan, P.; Mishra, S. B.; Manohar,C. Langmuir 1993, 9, 894.
(8) Horbaschek, K.; Hoffmann, H.; Thunig, C. J. Colloid InterfaceSci. 1998, 206, 439.
(9) Raghavan, S. R.; Edlund, H.; Kaler, E. W. Langmuir 2002, 18,1056.
10.1021/la052069w CCC: $30.25 © xxxx American Chemical SocietyPAGE EST: 6.6Published on Web 00/00/0000

to discuss the unusual viscosity results that are observedin one region of the phase diagram.
2. Experimental SectionMaterials. The EHAC surfactant was a commercial product
from Akzo Nobel, Chicago, IL, and its chemical structure is shownbelow. Details on this material have been reported in our previousstudies.4,9 The same material has also been investigated by othergroups.10-14
SHNC (99% purity) was purchased from Aldrich. Solutionscontaining surfactant and salt were prepared using distilled,deionized water.
Phase Behavior. Phase behavior was recorded by visualobservation. The phase boundaries as a function of temperaturewere determined by noting the incipient formation of a secondphase on heating or cooling (transitions were always determinedfrom one-phase to two-phase states). At the cloud point, the entiresample turned cloudy on heating. The transition temperaturesreported here are reproducible to (0.5 °C.
Rheology. Steady and dynamic rheological experiments wereperformed on a Rheometrics SR5 stress-controlled rheometer. Acouette cell was used with a cup of 27.5 mm diameter and a bob25 mm × 37.5 mm. The cell was heated by fluid circulating froma Julabo high-temperature bath, and the temperature wascontrolled to (0.1 °C. Samples were equilibrated at the tem-perature of interest for at least 20 min prior to experimentation.A solvent trap was used to minimize water evaporation.Frequency spectra were conducted in the linear viscoelasticregime of the samples, as determined from dynamic strain sweepmeasurements.
Small-Angle Neutron Scattering (SANS). SANS measure-ments were made on the NG-3 (30 m) beamline at the NISTCenter for Neutron Research (NCNR) in Gaithersburg, MD.Samples were studied in 2 mm quartz cells. The scattering spectrawere corrected and placed on an absolute scale using calibrationstandards provided by NIST. The data are shown for the radiallyaveraged, absolute intensity I versus the scattering vector q )4π sin(θ /2)/λ, where λ is the wavelength of incident neutrons andθ is the scattering angle.
3. Results
Phase Behavior. We begin by describing the phasebehavior of EHAC/SHNC solutions at a fixed EHACconcentration (cEHAC) of 40 mM. Figure 1 is a plot oftemperature vs salt concentration, and we compare theresults for SHNC (Figure 1b) with those previouslyreported9 for NaSal (Figure 1a). As mentioned earlier,
this comparison is interesting because the SHNC moleculeis identical to NaSal except for the presence of a secondbenzene ring. From Figure 1, we conclude that the SHNCphase diagram shows all the same features as the NaSalone, the difference being that each phase boundary isshifted to a lower salt concentration (along the x axis). Inother words, the SHNC phase diagram is a compressedversion of the NaSal one, while qualitatively remainingthe same.
The progression in EHAC/SHNC phase behavior, pro-ceeding from low to high salt concentration (cSHNC), is asfollows. In the low-salt limit, the samples are one-phaseand highly viscous. In fact, adding less than 10 mM ofSHNC to 40 mM EHAC is enough to induce significantmicellar growth. When cSHNC exceeds about 15 mM,however, the samples phase-separate into two co-existingliquid phases. Similar results are observed for NaSal, witha micellar region at low salt, followed by phase-separationaround 32 mM salt.9 For both SHNC and NaSal, thebiphasic samples are converted into single-phase micellarsolutions by the addition of higher concentrations of salt.At 25 °C, the micellar phase is recovered around 80 mMSHNC; for comparison, the corresponding value for NaSalis around 220 mM.
Remarkably, in the high-salt region of both EHAC/SHNC and EHAC/NaSal phase diagrams, we observe theappearance of cloud-point behavior.9 That is, these high-salt samples phase-separate into co-existing liquid phaseswhen heated beyond their corresponding cloud-pointcurves (shown by solid lines in Figure 1). Cloud-pointphenomena in ionic surfactant solutions are highlyunusual,9,15,16 and their origins in EHAC/salt mixturesare still a matter of speculation. Note that the cloud-pointphenomenon is seen over a wider range of salt concentra-tions for NaSal compared to SHNC (reiterating our earlierpoint that the SHNC phase diagram is a compressedversion of the NaSal one). In the case of SHNC, cloud
(10) Croce, V.; Cosgrove, T.; Maitland, G.; Hughes, T.; Karlsson, G.Langmuir 2003, 19, 8536.
(11) Couillet, I.; Hughes, T.; Maitland, G.; Candau, F.; Candau, S.J. Langmuir 2004, 20, 9541.
(12) Siriwatwechakul, W.; Lafleur, T.; Prud’homme, R. K.; Sullivan,P. Langmuir 2004, 20, 8970.
(13) Shashkina, J. A.; Philippova, O. E.; Zaroslov, Y. D.; Khokhlov,A. R.; Pryakhina, T. A.; Blagodatskikh, I. V. Langmuir 2005, 21, 1524.
(14) Croce, V.; Cosgrove, T.; Dreiss, C. A.; King, S.; Maitland, G.;Hughes, T. Langmuir 2005, 21, 6762.
(15) Warr, G. G.; Zemb, T. N.; Drifford, M. J. Phys. Chem. 1990, 94,3086.
(16) Kalur, G. C.; Raghavan, S. R. J. Phys. Chem. B 2005, 109, 8599.
Scheme 1. Chemical Structures of the Surfactantand Salts Used
Figure 1. Phase behavior of 40 mM EHAC solutions as afunction of temperature and salt concentration. Data are shownfor two salts: (a) NaSal (replotted from ref 9) and (b) SHNC.The cloud-point curve in each case is drawn as a solid curve.
B Langmuir Kalur et al.
points are observed only for cSHNC between ca. 70 and 180mM; at higher cSHNC, the samples remain one-phase overthe range of temperatures studied.
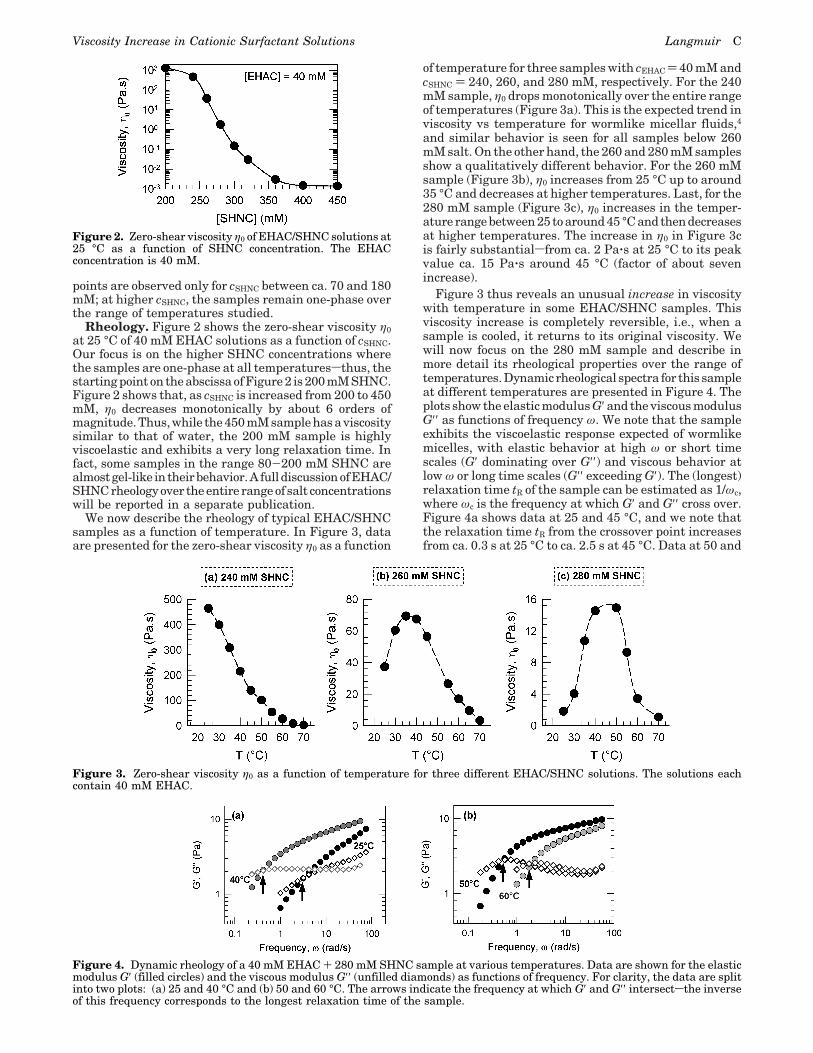
Rheology. Figure 2 shows the zero-shear viscosity η0at 25 °C of 40 mM EHAC solutions as a function of cSHNC.Our focus is on the higher SHNC concentrations wherethe samples are one-phase at all temperaturessthus, thestarting point on the abscissa of Figure 2 is 200 mM SHNC.Figure 2 shows that, as cSHNC is increased from 200 to 450mM, η0 decreases monotonically by about 6 orders ofmagnitude. Thus, while the 450 mM sample has a viscositysimilar to that of water, the 200 mM sample is highlyviscoelastic and exhibits a very long relaxation time. Infact, some samples in the range 80-200 mM SHNC arealmostgel-like in theirbehavior.A fulldiscussionofEHAC/SHNC rheology over the entire range of salt concentrationswill be reported in a separate publication.
We now describe the rheology of typical EHAC/SHNCsamples as a function of temperature. In Figure 3, dataare presented for the zero-shear viscosity η0 as a function
of temperature for three samples with cEHAC ) 40 mM andcSHNC ) 240, 260, and 280 mM, respectively. For the 240mM sample, η0 drops monotonically over the entire rangeof temperatures (Figure 3a). This is the expected trend inviscosity vs temperature for wormlike micellar fluids,4and similar behavior is seen for all samples below 260mM salt. On the other hand, the 260 and 280 mM samplesshow a qualitatively different behavior. For the 260 mMsample (Figure 3b), η0 increases from 25 °C up to around35 °C and decreases at higher temperatures. Last, for the280 mM sample (Figure 3c), η0 increases in the temper-ature range between 25 to around 45 °C and then decreasesat higher temperatures. The increase in η0 in Figure 3cis fairly substantialsfrom ca. 2 Pa‚s at 25 °C to its peakvalue ca. 15 Pa‚s around 45 °C (factor of about sevenincrease).
Figure 3 thus reveals an unusual increase in viscositywith temperature in some EHAC/SHNC samples. Thisviscosity increase is completely reversible, i.e., when asample is cooled, it returns to its original viscosity. Wewill now focus on the 280 mM sample and describe inmore detail its rheological properties over the range oftemperatures. Dynamic rheological spectra for this sampleat different temperatures are presented in Figure 4. Theplots show the elastic modulus G′ and the viscous modulusG′′ as functions of frequency ω. We note that the sampleexhibits the viscoelastic response expected of wormlikemicelles, with elastic behavior at high ω or short timescales (G′ dominating over G′′) and viscous behavior atlow ω or long time scales (G′′ exceeding G′). The (longest)relaxation time tR of the sample can be estimated as 1/ωc,where ωc is the frequency at which G′ and G′′ cross over.Figure 4a shows data at 25 and 45 °C, and we note thatthe relaxation time tR from the crossover point increasesfrom ca. 0.3 s at 25 °C to ca. 2.5 s at 45 °C. Data at 50 and
Figure 2. Zero-shear viscosity η0 of EHAC/SHNC solutions at25 °C as a function of SHNC concentration. The EHACconcentration is 40 mM.
Figure 3. Zero-shear viscosity η0 as a function of temperature for three different EHAC/SHNC solutions. The solutions eachcontain 40 mM EHAC.
Figure 4. Dynamic rheology of a 40 mM EHAC + 280 mM SHNC sample at various temperatures. Data are shown for the elasticmodulus G′ (filled circles) and the viscous modulus G′′ (unfilled diamonds) as functions of frequency. For clarity, the data are splitinto two plots: (a) 25 and 40 °C and (b) 50 and 60 °C. The arrows indicate the frequency at which G′ and G′′ intersectsthe inverseof this frequency corresponds to the longest relaxation time of the sample.
Viscosity Increase in Cationic Surfactant Solutions Langmuir C

60 °C are plotted in Figure 4b, and we observe here thatthe relaxation time drops from ca. 2 s at 50 °C to ca. 0.5s at 60 °C. Dynamic rheology thus reveals an increase inrelaxation time up to 45 °C and a subsequent decrease athigher temperatures.
Figure 5 shows the corresponding steady-shear rheo-logical data at various temperatures for the 280 mM SHNCsample. In all cases, the viscosity exhibits a Newtonianplateau at low shear rates followed by shear-thinning athigh shear rates. The zero-shear viscosity η0 increases inthe range from 25 to 45 °C (Figure 5a), whereas η0decreases beyond 50 °C (Figure 5b). The increase in low-shear viscosity mirrors the increase in relaxation timeobserved in Figure 4. The viscosity at high shear rates,on the other hand, is much less sensitive to temperature,a feature that has been seen in other studies on wormlikemicellar solutions.4
We now return to examining the temperature depen-dence of EHAC/SHNC sample rheology for other SHNCconcentrations. As cSHNC is increased beyond 280 mM, theviscosity increase occurs over a wider range of temper-atures. The sample starts at a lower viscosity, but theratio of peak viscosity to initial viscosity is greater. Thisis shown by the data in Figure 6, where the zero-shearviscosity η0 as a function of temperature is reported forthree more samples with cSHNC ) 360, 400, and 450 mM,respectively. Note that the y axis for these data is in mPa‚s,reflecting the lower viscosities of these samples comparedto those in Figure 3. The sample with 360 mM SHNCexhibits a viscosity increase over the entire range oftemperatures studied (Figure 6a). η0 for this sampleincreases from ca. 2 to 50 mPa‚s, which is a factor of 25increase. The 400 mM sample shows an increase in η0from ca. 1.5 to 6 mPa‚s at 70 °C (factor of 4 increase),followed by a decrease in η0 at higher temperatures (Figure
6b). Finally, the 450 mM sample has a very low viscosityat room temperature (ca. 1.5 mPa‚s) and there is a slightdecrease in this viscosity upon heating (Figure 6c). Thus,a viscosity increase is only observed over a finite rangeof SHNC concentrationssfor an EHAC concentration of40 mM, it occurs between ca. 260 and 420 mM SHNC.
We now revisit the 360 mM sample and probe itsrheology in some more detail. The steady-shear rheologyof this sample over a range of temperatures is presentedin Figure 7. At room temperature (25 °C), this sample isa Newtonian fluid with a viscosity of ca. 2 mPa‚s (i.e.,approximately twice that of water). Upon heating, theviscosity increases, while the sample continues to remaina Newtonian fluid. Around 60 °C, however, the rheologybecomes non-Newtonian, with a shear-thinning responseat high shear rates. The zero-shear viscosity continues toincrease with temperature, and a similar response is seenat 70 °C as well (η0 at 70 °C is ca. 50 mPa‚s). The sample
Figure 5. Steady-shear rheology (viscosity as a function of shear rate) for a 40 mM EHAC + 280 mM SHNC sample at varioustemperatures. For clarity, the data are split into two plots: (a) 25-40 °C and (b) 50-60 °C.
Figure 6. Zero-shear viscosity η0 as a function of temperature for three different EHAC/SHNC solutions. The solutions eachcontain 40 mM EHAC.
Figure 7. Steady-shear rheology (viscosity vs shear rate) fora 40 mM EHAC + 360 mM SHNC sample at various temper-atures.
D Langmuir Kalur et al.

thus changes from a Newtonian fluid at low temperaturesto a viscous, non-Newtonian fluid at high temperatures.This is in direct contrast to the behavior of typical rodlikeor wormlike micellar fluids, which usually transform froma highly viscous and non-Newtonian fluid at low tem-peratures to a Newtonian, low-viscosity fluid at hightemperatures.
SANS. To understand the microstructural origins ofthe observed rheological changes, we turned to SANS.For these experiments, samples were made using D2Oinstead of H2O. We verified that the rheology of EHAC/SHNC samples in D2O matched closely to that of thecorresponding compositions in H2O. Figure 8 shows SANSspectra (I vs q) at various temperatures from a samplecontaining 40 mM EHAC and 360 mM SHNC. Recall fromFigure 6 that the viscosity of this sample monotonicallyincreased with temperature. In turn, the SANS spectrashow a monotonic rise in low-q intensity for this sampleas the temperature is increased from 25 to 65 °C. Theintensity at high q, on the other hand, remains practicallyunchanged with temperature. Note that these SANSspectra resemble those from long cylindrical micelles overthe entire range of temperatures (e.g., the data asymptoteto a slope close to -1 at low q).17 The rise in low-q intensitythus signifies the growth of the cylindrical (wormlike)micelles, i.e., an increase in the micellar contour length,with increasing temperature. The constancy of the high-qdata suggests that the micellar radius remains practicallyunchanged with temperature. The value of this radiuscan be obtained from a cross-sectional Guinier plot, i.e.,a plot of ln(Iq) versus q2 (not shown) and is found to beca. 26 Å. For comparison, the length of a fully extended22-carbon saturated alkyl tail is estimated to be ca. 29 Åfrom the Tanford formula.18
Similar upturns in low-q intensity are seen for otherEHAC/SHNC samples that exhibit a viscosity increasewith temperature. Of particular interest is a samplecontaining 40 mM EHAC + 400 mM SHNC, data for whichare shown in Figure 9. Rheological measurements for thiscomposition in H2O (Figure 6) showed a monotonic risein viscosity between 25 and 65 °C, but the low viscosities(1.5-6 mPa‚s) suggested that the micelles present mustbe rather small (and thereby more amenable to analysis
within the length scales probed by SANS). Indeed, theSANS data in Figure 9 show significant changes between25 and 65 °C. At low temperatures (25 and 35 °C), thereis a plateau in the low-q intensity, and the scattering curveis suggestive of small spherical or ellipsoidal micelles.With increasing temperature, there is a dramatic increasein the low-q intensity and the spectra begin to resemblethat of cylindrical or long ellipsoidal micelles. Thus, asystematic growth of micelles with increasing temperatureis qualitatively evident from the SANS data.
For a more quantitative analysis of the data in Figure9, we use the indirect Fourier transform (IFT) method,which enables analysis of SANS data without assumingany a priori knowledge about the scatterers.19 In thisanalysis, a Fourier transformation of the scatteringintensity I(q) yields the pair distance distribution functionp(r) in real space. The two are related by the followingequation:19
The p(r) function provides structural information aboutthe scatterers in the sample. In particular, the maximumdimension of the scattering entities can be estimated. Notethat, in the simplest form of the IFT technique, it isassumed that the scatterers do not interact.19 Beforeimplementing the IFT methodology, it is useful to firstsubtract the incoherent background from the scatteringdata. This background was estimated from the asymptoticslope of a Porod plot (I(q)q4 vs q4). The IFT calculationwas then performed on the reduced data using thecommercially available PCG software package.
Figure 10 shows the resulting p(r) functions for each ofthe scattering curves in Figure 9 without considering anyinterparticle interactions. At 25 and 35 °C, the p(r)functions are symmetrical, which here is indicative ofspherical micelles. The maximum in p(r), which is akinto a “most probable distance between adjacent scatterers”,corresponds to the radius of the spheres, and p(r) f 0 ata value of r corresponding to the micellar diameter, i.e.,twice the radius.19 The value of this micellar diameter isaround 60 Å at 25 °C and 70 Å at 30 °C. At 45 °C, the p(r)becomes asymmetrical and exhibits a shallow second peak.In this case, p(r) f 0 at a much larger value of r (∼400Å), which gives an upper limit on the size of the structures
(17) Neutron, X-Ray and Light Scattering: Introduction to anInvestigative Tool for Colloidal and Polymeric Systems; Zemb, T.;Lindner, P., Eds.; Elsevier: Amsterdam, 1991.
(18) Tanford, C. The Hydrophobic Effect, 2nd ed.; Wiley: New York,1980. (19) Glatter, O. J. Appl. Crystallogr. 1977, 10, 415.
Figure 8. SANS scattering from a 40 mM EHAC + 360 mMSHNC sample at various temperatures.
Figure 9. SANS scattering from a 40 mM EHAC + 400 mMSHNC sample at various temperatures.
I(q) ) 4π ∫0
∞p(r)
sin (qr)qr
dr (1)
Viscosity Increase in Cationic Surfactant Solutions Langmuir E

present. A shoulder or second peak in p(r) is oftenindicative of interactions between the scatterers, whichcomplicates the interpretation of p(r).20-22 Nevertheless,it is clear that the structures at 45 °C are larger than atthe lower temperatures. Finally, at 65 °C, the p(r) becomesstrongly asymmetrical and exhibits an inflection pointfollowed by an approximately linear decrease. Such alinear decrease is characteristic of cylindrical micelles.20,21
In this case, the p(r) tends to zero around 600 Å, whichprovides an estimate for the maximum length of thecylinders. Our analysis of the SANS data by the IFTmethod thus reveals a growth of micelles from compactspheres at 25 °C to elongated cylinders at 65 °C.
4. DiscussionWe have demonstrated an increase in viscosity with
temperature in solutions of 40 mM EHAC over a rangeof SHNC concentrations (260-420 mM). Using rheologyand SANS, we have shown that the increase in viscosityis due to the growth of cylindrical micelles with increas-ing temperature. The viscosity increase is quitesubstantialsmore than an order of magnitude for manysamples. It is worth reiterating that such an increase inviscosity is very unusual in the case of cationic wormlikemicellar solutions. Specifically, in the case of micellesformed by the EHAC cationic surfactant, a viscosityincrease has not been previously reported to our knowl-edge. Note that EHAC has been studied in conjunctionwith a range of salts, including simple salts such as NaCland KCl, as well as binding counterions such as NaSaland sodium tosylate.4,9 None of these samples, however,showed an increase in viscosity with temperature.
The question then is why we see the viscosity increasewith SHNC and not with other salts. In particular, whydoes SHNC behave differently compared to NaSal, despitethe two counterions being closely related (Figure 1)? Afurther intriguing question is, why do we see the viscosityincrease only over a limited range of SHNC concentra-tions? These questions are related, and we will try to tacklethem together. The significant difference between SHNC
and NaSal is that the hydrophobic moiety is bulkier inSHNC. In turn, this causes SHNC to have a lowersolubility in water compared to NaSal.23 Thus, when addedto water in the presence of cationic micelles, the HNC-
counterions will partition almost entirely to the micelles,with their aromatic portion submerged within the hy-drophobic interior of the micelles (see Figure 11). Evenwhenthere isanexcessofHNC- oversurfactantmolecules,the strongly hydrophobic nature of the counterions willinduce the vast majority of them to segregate toward themicelles. (For simplicity, we assume that the counterionstend to become uniformly distributed over the entiremicelle. Although naphthalene derivatives can π-stack, itis not clear if this will impact the distribution of HNC-
at the micellar interface.).To illustrate the consequences of counterion binding,
take the specific example of a particular EHAC/SHNCcomposition, say 40 mM EHAC + 360 mM SHNC. In thiscase, there are nine times as many SHNC molecules asEHAC, and all of the HNC- counterions are likely to bebound to the micelles. Because of the large excess ofcounterions, not all these ions may be bound strongly,i.e., some HNC- ions may only be partially inserted intothe micelles. This is the scenario we expect at lowtemperatures, and it is depicted schematically on theleft-hand side of Figure 11. Note that, because of the largefraction of bound anions, the micellar interface is expectedto bear a strong negative charge. Due to this unscreenedcharge, the micelles existing in solution are likely to behighly curved structures, i.e., mostly spherical or slightlyelongated micelles. Now consider what happens uponincreasing temperature. The solubility of SHNC in wateris expected to increase with temperature, which means areduction in the tendency of HNC- counterions to bindonto the micelles.23 This may cause some of the weaklybound counterions to desorb from the micelles and releaseinto solution (the resulting micellar interface is depictedschematically on the right-hand side of Figure 11). In turn,we suggest that the micellar surface charge is reduced,thereby leading to a growth of cylindrical micelles withincreasing temperature.
The above mechanism is the simplest one that canaccount for our results. It can be used to explain why the
(20) Glatter,O.;Fritz,G.;Lindner,H.;Brunner-Popela,J.;Mittelbach,R.; Strey, R.; Egelhaaf, S. U. Langmuir 2000, 16, 8692.
(21) Raghavan, S. R.; Fritz, G.; Kaler, E. W. Langmuir 2002, 18,3797.
(22) Hassan, P. A.; Fritz, G.; Kaler, E. W. J. Colloid Interface Sci.2003, 257, 154.
(23) Hassan, P. A.; Valaulikar, B. S.; Manohar, C.; Kern, F.; Bourdieu,L.; Candau, S. J. Langmuir 1996, 12, 4350.
Figure 10. Pair distance distribution functions p(r) corre-sponding to the SANS data in Figure 9 obtained at varioustemperatures for a 40 mM EHAC + 400 mM SHNC sample.The p(r) curves were obtained by an indirect Fourier trans-formation (IFT) of the data without considering any interparticleinteractions (see text for details).
Figure 11. Schematic of the micellar structure in a 40 mMEHAC + 360 mM SHNC solution at low and high temperatures.At low temperatures (left), the micelles are depicted to be shortcylinders or ellipsoids. In this case, most of the HNC- coun-terions are shown bound to the micelle, due to which the micellebears a strong negative charge. At high temperatures (right),the micelles have grown into longer, flexible cylinders (wormlikemicelles). This growth is attributed to the desorption of someof the bound HNC- counterions and the consequent reductionin micellar surface charge.
F Langmuir Kalur et al.

viscosity increase occurs only over a certain range of SHNCconcentrations. The key point is that, if the micelles arealready very long at room temperature, any desorption ofcounterions will have a negligible effect on the micellecurvature. It should be noted that temperature exerts acompeting effect, which is to exponentially decrease themicelle contour length (this is ultimately the reason theviscosity goes through a maximum for many samples).Thus, it is only for micelles that are quite short to beginwith (as indicated by a low viscosity at room temperature)that we see the effects related to counterion desorption.This can explain why the viscosity increase only occursfor cSHNC > 260 mM. On the other hand, the effect is maskedfor cSHNC > 450 mM because in these cases the micellesare so swamped with HNC- counterions that the desorp-tion of a few ions has a negligible effect on micelle charge,and hence curvature.
A similar series of arguments was advanced by Manoharet al.23-25 to describe a temperature-induced transitionfrom multilamellar vesicles to wormlike micelles insolutions of the surfactant cetyl trimethylammoniumhydroxynaphthoate (CTA-HNC). In this case, the HNC-
formed the counterions for the surfactant, and at lowtemperatures, these counterions remained bound to thesurfactant. The resulting low surface charge lead to theformation of vesicular aggregates. However, at hightemperatures, the authors postulated a desorption of someHNC- counterions from the aggregates, resulting in anincreased charge and thereby a transition from vesiclesto wormlike micelles.24,25 Note that, in the case of CTA-HNC, there was always an equimolar concentration ofsurfactant molecules and counterions, whereas in oursamples, we have a large excess of HNC- counterions oversurfactant molecules. Therefore, the desorption of coun-terions has a different consequence in our case than inthat studied by Manohar et al.
One final question is whether the viscosity increase inEHAC/SHNC samples is connected with the cloud-pointphenomenon observed at lower SHNC compositions(Figure 1). To reiterate, the EHAC/SHNC solutions thatshow a viscosity increase do not show cloud pointsover the accessible range of temperatures. Also, thesolutions that have cloud points do not show a viscosityincreasestheir viscosity decreases monotonically withtemperature until their cloud point (much like for the 240mM sample in Figure 3a). Similar trends in viscosity havebeen reported for EHAC/NaSal samples that had cloudpoints.9 In this earlier study, the cloud point was attributedeither to attractive interactions between micelles or to atransition from linear to branched micelles with increasingtemperature.9 Thus, the viscosity increase observed hereappears to have a different origin compared to the cloud-point phenomenon.
ConclusionsIn this paper, we have reported unusual rheological
behavior in micellar solutions of the cationic surfactantEHAC and the binding salt, SHNC. Over a range of SHNCconcentrations corresponding to a large excess of coun-terions over surfactant, these solutions show an increasein viscosity with temperature. The viscosity increase canbe fairly substantial, often exceeding an order of mag-nitude. For some samples, the viscosity rises to a peakand thereafter decreases. Using SANS, we have shownthat the increase in viscosity is caused by an increase inthe contour length of cylindrical micelles. We attributethis micellar growth to a desorption of weakly bound HNC-
counterions from the micelle at elevated temperatures.Such a desorption is believed to reduce the charge densityat the micellar interface and thereby promote the growthof cylindrical structures.
Acknowledgment. We would like to acknowledgeNIST for facilitating the SANS experiments performedas part of this work. This work was partially funded bya grant from NSF-CTS.
LA052069W
(24) Menon, S. V. G.; Manohar, C.; Lequeux, F. Chem. Phys. Lett.1996, 263, 727.
(25) Narayanan, J.; Mendes, E.; Manohar, C. Int. J. Mod. Phys. B2002, 16, 375.
Viscosity Increase in Cationic Surfactant Solutions PAGE EST: 6.6 Langmuir G