visa global travel intentions study 2015 - home - pata2 visa global travel intentions study 2015...
TRANSCRIPT

Visa Global Travel Intentions Study 2015 Caroline Dempsey, Head of Marketing Visa, New Zealand, South Pacific & Australia

Visa Global Travel Intentions Study 2015 2
Disclaimer
Case studies, statistics, research and recommendations are provided "AS IS" and intended for informational purposes only and should not be relied upon for operational, marketing, legal, technical, tax, financial or other advice. You should consult with your legal counsel to determine what laws and regulations may apply to your circumstances. The actual costs, savings and benefits of any recommendations or programs may vary based upon your specific business needs and program requirements. By their nature, recommendations are not guarantees of future performance or results and are subject to risks, uncertainties and assumptions that are difficult to predict or quantify. Visa is not responsible for your use of the information contained herein (including errors, omissions, inaccuracy or non-timeliness of any kind) or any assumptions or conclusions you might draw from its use. Visa makes no warranty, express or implied, and explicitly disclaims the warranties of merchantability and fitness for a particular purpose, any warranty of non-infringement of any third party's intellectual property rights. To the extent permitted by applicable law, Visa shall not be liable to a client or any third party for any damages under any theory of law, including, without limitation, any special, consequential, incidental or punitive damages, nor any damages for loss of business profits, business interruption, loss of business information, or other monetary loss, even if advised of the possibility of such damages.
PATA Conference 2015

Visa Global Travel Intentions Study 2015 3
The Visa Global Travel Intentions Study 2015 was commissioned by Visa to Millward Brown. The study was conducted with 13,603 travellers*, aged 18 years and above across 25 countries in January and February 2015.
Methodology
AFRICA & MIDDLE EAST: Egypt, Kuwait, Morocco, Saudi Arabia, South Africa, United Arab Emirates AMERICAS: Brazil, Canada, Mexico, United States of America
ASIA PACIFIC: Australia, China, Hong Kong, India, Indonesia, Japan, Korea, Malaysia, Singapore, Taiwan, Thailand
EUROPE: France, Germany, Russia, United Kingdom
Where
*Have either travelled in the past 24 months or intend to travel in the next 24 months for business/leisure (non-domestic travel only).
Who
PATA Conference 2015

Visa Global Travel Intentions Study 2015 4
Why do we travel?
People
26%
Activities
18%
Accessibility / Familiarity
17%
Bonding
15%
Experience cultures
13%
Rest & Relax
11%
MAIN TRAVEL MOTIVATIONS IN PAST 2 YEARS
REASONS FOR DESTINATION CHOICE IN THE PAST 2 YEARS
PATA Conference 2015

Visa Global Travel Intentions Study 2015 5 Visa Internal Use Only
Global APAC Europe Americas Africa & Middle East
2015 76%▼ 84%▲ 81%▼ 79%▼ 54%▼
Base: (13603) (6531) (2012) (2007) (3053)
2013 79% 77% 87% 81% 76%
Base: (12631) (5555) (2042) (2026) (3008)
Strong growth in Asia Pacific Leisure travel has touched a wide mass with 3 in 4 respondents travelling in the past two years. More Asian travellers have joined the fold in 2015.
TRAVELLED IN THE PAST 2 YEARS FOR LEISURE
Of sample travelled in the past 2 years for Leisure
76% Base: (13603)
▲▼ higher/lower compared to GTI 2013 PATA Conference 2015

Visa Global Travel Intentions Study 2015 6
NZ remains a top 5 destination for Australian travelers and top 10 for emerging markets India and China
Top 10 Popular Destinations
China
15% 14% 12% 11% 10% 8% 7% 6% 5% 5%
India 15% 14% 12% 10% 8% 7% 5% 5% 4% 4%
16% 12% 11% 9% 7% 6% 6% 6% 6% 5%
Australia
PATA Conference 2015

Visa Global Travel Intentions Study 2015 7 Visa Internal Use Only
Top 5 countries to spend in
New Zealand South Africa
United Arab Emirates
United Kingdom
Maldives
$3,765 $3,765 $3,765 $3,684 $3,625
(127) (41) (277) (178) (38)
While locations such as New Zealand and South Africa attract the highest tourist receipts, travellers to South East Asia spend the least.
Trip spending
Bottom 5 countries to spend in
Laos PDR Cambodia Burma (Myanmar)
Malaysia China
$652 $956 $982 $1,129 $1,141
(41) (44) (37) (271) (375)
MEDIAN SPEND PER TRIP
PATA Conference 2015

Visa Global Travel Intentions Study 2015 8
Hotels and resorts are still the most popular accommodation type, with more than half of the travellers staying at such lodging on their most recent holiday.
Accommodation type
Base: (10309)
70%
ACCOMMODATION TYPE ON MOST RECENT TRIP
16%
31%
44%
10% 10% 14% 4% 2%
Hostel, Guesthouse, Chalet
Bed & Breakfast
1-3 star hotel or resort
4 stars and above
hotel or resort
Boutique hotel
Serviced apartment or house or villa
Friend’s or relative’s
house
Home-stay Others Stayed at starred
hotels/ resorts
PATA Conference 2015

Visa Global Travel Intentions Study 2015 9
Activities and Spending
PATA Conference 2015
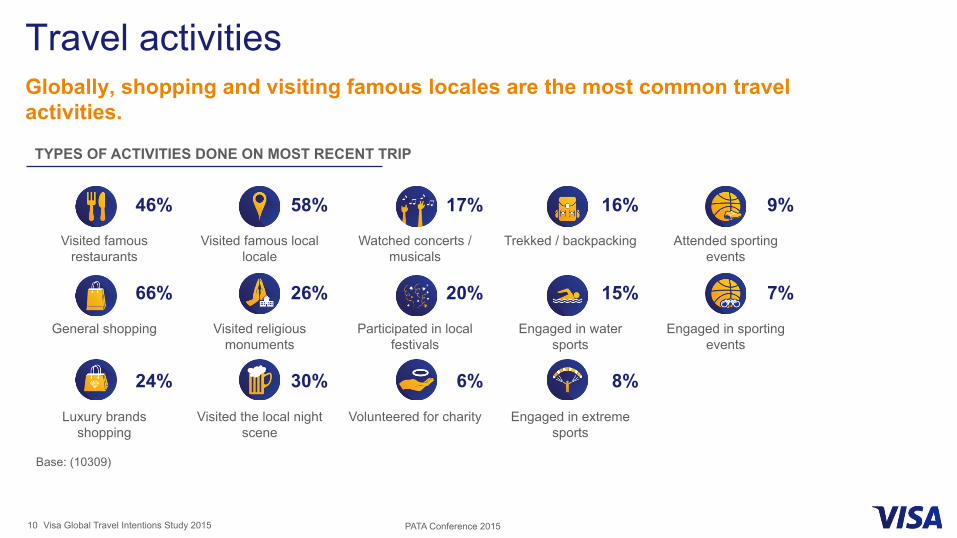
Visa Global Travel Intentions Study 2015 10
46% 58% 17% 16% 9%
Visited famous restaurants
Visited famous local locale
Watched concerts / musicals
Trekked / backpacking Attended sporting events
66% 26% 20% 15% 7%
General shopping Visited religious monuments
Participated in local festivals
Engaged in water sports
Engaged in sporting events
24% 30% 6% 8%
Luxury brands shopping
Visited the local night scene
Volunteered for charity Engaged in extreme sports
Base: (10309)
Globally, shopping and visiting famous locales are the most common travel activities.
Travel activities
TYPES OF ACTIVITIES DONE ON MOST RECENT TRIP
PATA Conference 2015

Visa Global Travel Intentions Study 2015 11
Experience trumps cost
25% ▲ $4780 -6%
% change from 2013-2015
2015 (USD, Median)*
Future spend % change
*The value used is median. The 2015 spend data has taken the assumption of constant exchange rate across 2013 and 2015, using 2013 exchange rate.
PATA Conference 2015

Visa Global Travel Intentions Study 2015 12
Spending power of Chinese travellers
(10309) (725)
Average no. of activities per trip
16% 27%
Trekked / backpacking
30% 57%
Visited the local night scene such as
clubs, bars, etc.
20% 28%
Participated in local
festivals
Travel activities
3.55
4.36
Global China
18%
Global China
Budgeting approach
Global China
I will keep strictly to the budget I planned
46% 56%
29%
Search for the best experience and then sum up
the amount before making adjustments
PATA Conference 2015

Visa Global Travel Intentions Study 2015 13 Visa Internal Use Only
Base: (9660) / (12741) (5313) / (6293) (1517) / (1942) (1424) / (1904) (1406) / (2602)
The future outlook of travel spends is optimistic as globally travellers are intending to spend more in their future holiday.
Trip spending
MEDIAN SPEND PER TRIP
Amount spent last trip
Amount spend next trip
$2,281 $2,051
$1,606
$2,715
$3,202 $3,501 $3,501
$2,501
$4,501
$3,501
Global APAC Europe Americas Africa & Middle East
PATA Conference 2015

Visa Global Travel Intentions Study 2015 14
Young millennials are also intending to spend much more in their next holiday, with the future intended spend almost doubling from before.
Amount intend to spend
18-24 25-35 Millennials 36-44 Superboomers
Amount spent last trip
(median) $1,378 $2,059 $1,882 $2,604 $2,595
Base: (1350) (3161) (4511) (2634) (2515)
Amount intend to spend (median)
$2,501 $3,501 $2,501 $3,501 $3,501
Base: (1934) (3952) (5886) (3329) (3526)
% change 81% 70% 33% 34% 35%
AMOUNT SPENT VS INTEND TO SPEND
Change in future intent to spend amongst Millennials
+33%
PATA Conference 2015

Visa Global Travel Intentions Study 2015 15
Cards are the predominant mode of payment at the booking phase.
Booking payment
Base: (10059)
PAYMENT MODES USED AT BOOKING PHASE
Pay with Payment Cards at the Booking stage
66%
Cash
Any Cards
Money/Bank transfer
Others
Did not make payment at this phase
31%
66%
17%
0%
2%
PATA Conference 2015

Visa Global Travel Intentions Study 2015 16
More travellers carry payment cards to the destination as compared to 2013.
Payment modes carried to destination
2015
Base: (9660)
2013
Base: (9323)
82% 93%
13%
Cash Payment Cards Traveller's cheques
84% 77%
10%
Cash Payment Cards Traveller's cheques
PATA Conference 2015
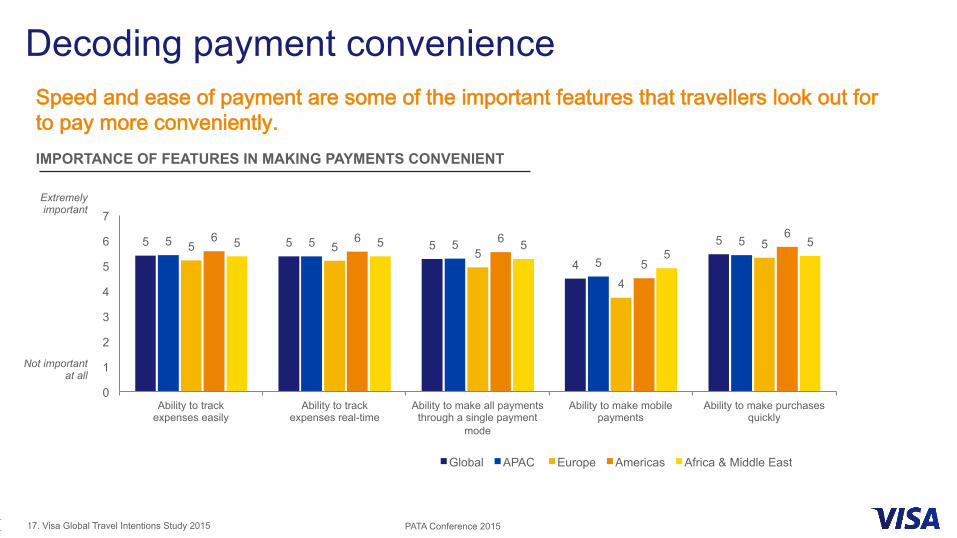
Speed and ease of payment are some of the important features that travellers look out for to pay more conveniently.
Decoding payment convenience
IMPORTANCE OF FEATURES IN MAKING PAYMENTS CONVENIENT
Not important at all
Extremely important
5 5 5 4
5 5 5 5 5
5 5 5 5
4
5 6 6 6
5
6 5 5 5
5 5
0
1
2
3
4
5
6
7
Ability to track expenses easily
Ability to track expenses real-time
Ability to make all payments through a single payment
mode
Ability to make mobile payments
Ability to make purchases quickly
Global APAC Europe Americas Africa & Middle East
PATA Conference 2015 17. Visa Global Travel Intentions Study 2015

Visa Global Travel Intentions Study 2015 18
18-24 25-35 Millennials 36-44 Superboomers
(1475) (3333) (4808) (2811) (2690)
Today’s travellers are hungry for more information from both traditional and online sources throughout the travel journey and this applies to travellers of all ages.
Information sources used at each stage
Planning
Booking (Package)
Booking (Independent)
During
80%
48%
59%
73%
79%
52%
71%
66%
85%
61%
60%
77%
77%
39%
68%
59%
82%
50%
58%
78%
80%
50%
73%
71%
82%
49%
58%
76%
79%
51%
72%
69%
79%
52%
55%
75%
78%
48%
75%
66%
Traditional
Online
PATA Conference 2015

Visa Global Travel Intentions Study 2015 19
Sharing of photos, as well as updating one’s social media profile are the most common forms of sharing post-trip.
Online sharing post trip
Base: (10309)
ONLINE SHARING POST TRIP
Via instant messages
Via email
On a general forum
In an online chat-room
Via a blog
On a travel review site
35%
11%
31%
-%
Posted photos on a private web-space
Posted videos on a public web-space
Via social media status updates
Others
26%
22%
11%
12%
13%
16% did not share experience/ views online after returning home
24%
76%
24%
Base: (10309)
PATA Conference 2015

PATA Conference, Auckland, October 2015
Applying the research

| Visa 21
Proximity payments through
Visa payWave
Remote payment through
Visa Checkout
Peer-to-peer payments through
Visa Direct
Enable digital payments
through Visa Token Services
Explore the long-term
future through Visa Research
Open the network through Visa Developer
and co-innovation
Visa Payment Innovation

Thank you and happy travels
PATA Conference 2015