virginia state university · engineering program are doing research on robotics and unmanned...
TRANSCRIPT

Virginia State University
Annual Financial Report for Fiscal Year Ended June 30, 2014


VIRGINIA STATE UNIVERSITY ANNUAL FINANCIAL REPORT 2013 - 2014
Table of Contents
Pages
MANAGEMENT’S RESPONSIBILITY FOR FINANCIAL
REPORTING AND INTERNAL CONTROLS
1
MANAGEMENT’S DISCUSSION AND ANALYSIS 2-11
FINANCIAL STATEMENTS
Statement of Net Position 12-13
Statement of Revenues Expenditures and Changes in Net
Position
14
Statement of Cash Flows 15 – 16
NOTES TO FINANCIAL STATEMENT 17-37
INDEPENDENT AUDITOR’S REPORT ON FINANCIAL
STATEMENTS
39-41
UNIVERSITY OFFICIALS 42-43

1 | P a g e
The information in this Annual Financial Report, including the accompanying basic financial statements, notes, management’s discussion and analysis, and other information is the responsibility of Virginia State University executive management. Responsibility for the accuracy of the financial information and fairness of its presentation, including all disclosures, rests with the management of the University. Management believes the information is accurate in all material respects and fairly presents the University’s revenues, expenses, and changes in net position as well as its overall financial position. This report was prepared in accordance with generally accepted accounting principles for public colleges and universities in the United States of America as prescribed by the Governmental Accounting Standards Board. Management is responsible for the objectivity and integrity of all representations herein. The Annual Financial Report includes all disclosures necessary for the reader of this report to gain a broad understanding of the University’s operations for the year ended June 30, 2014.
The administration is responsible for establishing and maintaining the University’s system of
internal controls. Key elements of the University’s system of internal controls include: careful selection and training of administrative personnel; organizational structure that provides appropriate division of duties; thorough and continuous monitoring, control, and reporting of operating budgets versus actual operating results; well communicated written policies and procedures; annual self-assessments led by the Controller’s Office; and an internal audit function. Although there are inherent limitations to the effectiveness of any system of accounting controls, management believes that the University’s system provides reasonable, but not absolute, assurances that assets are safeguarded from unauthorized use or disposition, and accounting records are sufficiently reliable to permit preparation of financial statements and appropriate accountability for assets and liabilities.
The Finance, Audit and Facilities Committee of the Virginia State University Board of Visitors
reviews the University’s accounting practices. The Board meets with external independent auditors annually to review the Annual Financial Report and results of audit examinations. The Committee also meets with internal auditors and University financial officers quarterly. These meetings include a review of the scope, quality, and results of the internal audit program.
The Auditor of Public Accounts (APA), the office of the Commonwealth of Virginia’s auditors, has
examined these annual financial statements and their report appears on pages 39 through 41. Their examination includes a study and evaluation of the University’s system of internal controls, financial systems, policies, and procedures, resulting in the issuance of a management letter describing various issues they consider worthy of management’s attention. The University has implemented policies and procedures for the adequate and timely resolution of such issues. No material weaknesses were found on internal control matters by the APA for the fiscal year ended June 30, 2014.

2 | P a g e
INTRODUCTION
Virginia State University (VSU) is an agency of the Commonwealth of Virginia and is governed by a
fifteen member Board of Visitors. The Commonwealth has the authority to exercise oversight over the
University. The University has two major divisions, the Academic Colleges and the Cooperative Extension and
Agricultural Research Services. The University is a component unit of the Commonwealth and is included in
the Commonwealth’s Comprehensive Annual Financial Report (CAFR).
Through a bill sponsored by local attorney Delegate Alfred W. Harris, Virginia Normal
and College Institute was founded in 1882. From 1883 to 1885, James Storum served
as the institute’s first principal. VSU was designated a land grant institution in 1920,
and attained university status in 1979. Today, the University continues as one of
two land grant institutions in the Commonwealth. As a land grant institution, the
University engages in natural resource related research projects and agriculture
extension services. Its mission is to promote and sustain academic programs
that integrate instruction, research, and extension/public service in a design most
responsive to the needs and endeavors of individuals and groups within its scope
of influence. The University consists of seven colleges namely: College of
Agriculture, Reginald F. Lewis College of Business, College of Engineering and
Technology, College of Education, College of Graduate Studies, College of
Humanities and Social Sciences, and College of Natural and Health Sciences.
These colleges provide 35 undergraduate degree programs, 20 graduate degree
programs, 2 doctoral degree programs and 2 certificate programs. Students in the
engineering program are doing research on robotics and unmanned vehicles that will
eventually enhance the Commonwealth of Virginia’s economy by creating jobs in those areas. In addition, the
University has partnerships with Fort Lee, Commonwealth Center for Advanced Manufacturing, and dual
enrollment programs with public schools throughout the Commonwealth of Virginia. Virginia State University
offers services through its land grant programs to small farmers mainly in central and southern Virginia. The
University is dedicated to “Building a Better World” for tomorrow.
OVERVIEW OF THE FINANCIAL STATEMENTS
This discussion and analysis provides an overview of the financial position and results of activities of
Virginia State University for the fiscal year ended June 30, 2014. Prepared by management, the overview should
be read in conjunction with the financial statements and footnotes that follow this section. Comparative
information for the fiscal year ended June 30, 2013 has been provided where applicable. The financial statements
were prepared in accordance with applicable pronouncements and statements of the Governmental Accounting
Standards Board (GASB), which establishes principles and standards for external reporting for colleges and
universities.
The University’s financial report includes three financial statements and related notes:
1. The Statement of Net Position (SNP)
2. The Statement of Revenues, Expenses, and Changes in Net Position (SRECNP)
3. The Statement of Cash Flows (SCF)
James Storum
(Unaudited)

3 | P a g e
These principles require the financial statements be prepared with resources classified for accounting
and reporting purposes into the following net position categories: Current Assets, Noncurrent Assets, and
Deferred Outflows or Resources; Current Liabilities, Noncurrent Liabilities and Deferred Inflows of Resources.
Please note, although the University’s foundations identified under GASB Statement 39, Determining Whether
Certain Organizations are Component Units, are reported in the component unit financial statements, this
Management Discussion and Analysis excludes reference to the foundations except where specifically noted.
STATEMENT OF NET POSITION
The Statement of Net Position (SNP) presents the financial position of the University at the end of the
fiscal year and includes all assets, deferred outflows of resources, liabilities and deferred inflows of resources of
the University. Net position is the difference between the total assets and deferred outflows of resources less
liabilities and deferred inflows of resources. It is one indicator of the current financial condition of the
University, while the changes in net position suggest whether the overall financial condition of the University
has improved or worsened during the year. Categories of the SNP are generally measured using current values.
One notable exception is capital assets, which are stated at historical cost less an allowance for depreciation.
For FY2014, the University’s total net position increased by $16.3 million or 9.1% over the previous
fiscal year.
Total assets and deferred outflows of resources increased by $10.6 million or 3.3% as compared to last
year. Currents assets increased by $7.3 million during FY2014 or 28.0%. Current assets are comprised of cash
and cash equivalents, short term investments, accounts, notes and loans receivable, due from the commonwealth
and affiliates, prepaid expenses, and securities lending. The change is largely attributed to the $1.8 million
increase in cash and cash equivalents, a $4.7 million increase in due from the Commonwealth, and an $805
thousand increase in prepaid expenses.
Noncurrent assets increased by $3.6 million during FY2014, or 1.2%. Noncurrent assets are comprised
of restricted cash and cash equivalents, state appropriations available, investments, notes receivable, and capital
assets net of depreciation. There was a decrease in restricted cash and cash equivalents of $7.6 million
attributable to the spending of bond proceeds for the construction of Gateway II and Howard Quad II residence
halls, in addition to the Multipurpose Center Project. This decrease was offset by an increase in capital assets of
$7.0 million and an overall increase in investments of $4.7 million.
In FY2014, the implementation of the Governmental Accounting Standards Board (GASB) Statement
Number 65 Items Previously Reported as Assets and Liabilities resulted in the reclassification of certain asset
and liability categories to be reported as deferred inflows of resources or deferred outflows of resources in
accordance with its guidelines. This resulted in a $3.2 million reclassification of losses on advanced refundings
that were once recorded in the net total of long term liabilities to an increase in the deferred outflows of resources
category for FY14 and a $3.5 million reclassification for FY13.
Compared to the previous fiscal year, total liabilities and deferred inflows of resources decreased by
$5.7 million or 4.0%. Total liabilities are comprised of current and noncurrent liabilities. Overall, current
liabilities increased by $35 thousand in FY2014. Current liabilities are comprised of accounts payable and other
accrued liabilities, unearned revenues, obligations under securities lending, deposits held in custody, the current
portion of long-term liabilities, and retainage payable. Noncurrent liabilities decreased by $5.8 million or 4.7%
during FY2014. Noncurrent liabilities are comprised primarily of the noncurrent portion of long-term debt
(bonds, notes payable, and installment purchase obligations). The decrease in noncurrent liabilities was the net
result of making scheduled debt service payments
.
A summary of the University’s assets, deferred outflows of resources, liabilities, and deferred inflows of
resources and net position at June 30, 2014 and 2013 follows:

4 | P a g e
Summary of the Statement of Net Position
Year Ended June 30, Increase/(Decrease)
2014 2013 Amount Percent
Assets:
Current assets: $ 33,558,785 $ 26,222,272 $ 7,336,513 28.0%
Noncurrent assets:
Restricted cash and cash equivalents 12,857,122 20,500,941 (7,643,819) (37.3)%
State appropriations available 404,189 894,349 (490,160) (54.8)%
Investments 32,337,992 27,658,146 4,679,846 16.9%
Capital assets, net 250,127,280 243,098,474 7,028,806 2.9%
Other 1,624,550 1,642,649 (18,099) (1.1)%
Total noncurrent assets 297,351,133 293,794,559 3,556,574 1.2%
Deferred outflows of resources 3,207,574 3,525,444 317,890 9.0%
Total assets & deferred outflows of resources 334,117,492 323,542,275 10,575,217 3.3%
Liabilities:
Current liabilities 23,129,188 23,094,486 34,702 0.2%
Noncurrent liabilities 115,969,528 121,747,554 (5,778,026) (4.7)%
Deferred inflows of resources 22,535 26,978 (4,443) (16.5)%
Total liabilities & deferred inflows of resources 139,121,251 144,869,018 (5,747,767) (4.0)%
Net position:
Net investment in capital assets 144,222,711 135,493,028 8,729,683 6.4%
Restricted:
Nonexpendable 8,463,750 8,340,859 122,891 1.5%
Expendable 25,126,993 20,440,750 4,686,243 22.9%
Unrestricted 17,182,787 14,398,620 2,784,167 19.3%
Total net position $ 194,996,241 $ 178,673,257 $ 16,322,984 9.1%
Certain 2013 amounts have been restated to conform to GASB 65 reclassifications.
STATEMENT OF REVENUES, EXPENSES, AND CHANGES IN NET POSITION

5 | P a g e
The Statement of Revenues, Expenses, and Changes in Net Position present the University’s results of
activities for the fiscal year. Presented below is a summarized statement of the University’s Revenues, Expenses,
and Changes in Net Position for the years ended June 30, 2014 and 2013.
Summary of the Statement of Revenues,
Expenses, and Changes in Net Position
Year Ended June 30, Increase/(Decrease)
2014 2013 Amount Percent
Operating revenues $77,594,600 $78,188,624 $(594,024) (0.8)%
Operating expenses 134,001,525 138,771,540 (4,770,015) (3.4)%
Operating income/(loss) (56,406,925) (60,582,916) 4,175,991 6.9%
Nonoperating revenues/(expenses):
State appropriations 39,947,404 43,895,543 (3,948,139) (9.0)%
Federal student financial aid 15,455,682 16,143,069 (687,387) (4.3)%
Other nonoperating revenues/ (expenses) 1,655,196 (1,354,051) 3,009,247 222.2%
Net nonoperating revenues and expenses 57,058,282 58,684,561 (1,626,279) (2.8)%
Income/(loss) before other revenues and
reductions 651,357 (1,898,355) 2,549,712 134.3%
Other revenues:
Capital grants and gifts 467,585 1,159,215 (691,630) (59.7)%
Additions/(reductions) to permanent endowments 398,250 499,074 (100,824) (20.2)%
VCBA 21st Century bond reimbursement program 14,805,792 10,126,777 4,679,015 46.2%
Total other revenues 15,671,627 11,785,066 3,886,561 33.0%
Total increase/(decrease) in net position 16,322,984 9,886,711 6,436,273 65.1%
Net position, beginning of year, as restated 178,673,257 168,786,546 9,886,711 5.9%
Net position, end of year $194,996,241 $178,673,257 $16,322,984 9.1%
Certain 2013 amounts have been restated to conform to GASB 65 reclassifications.
As shown in the table above, there was an increase in net position of $16.3 million or 9.1% in FY2014 as
opposed to an increase of $9.9 million in the previous year’s statement. The net operating loss decreased by $4.2
million or 6.9%, over FY2013. Net nonoperating revenues and expenses decreased by $1.6 million or 2.8% and
total other revenues increased by $3.9 million or 33.0%, in FY2014. Revenues and expenses will be discussed in
further detail in the following sections.
A summary of the University’s revenues for the years ended June 30, 2014 and 2013 appears below:

6 | P a g e
* Net of scholarship allowance
** Other includes: other operating revenues; other nonoperating revenues, net of nonoperating expenses; capital grants and gifts;
additions to permanent endowment; other capital revenues.
Total operating revenues decreased by $594 thousand in FY2014 to $77.6 million from $78.2 million in
the previous year, a decrease of 0.8%. As reflected in the chart above, there were decreases in operating revenues
from student tuition and fees and auxiliary enterprises due to a decline in enrollment. These were partially offset
by an increase in revenues from grants and contracts.
Summary of Revenues
For the years ended June 30, 2014 and 2013
Increase/(Decrease)
2014 2013 Amount Percent
Operating revenues:
Student tuition and fees, net* $ 30,133,099 $ 30,903,430 $ (770,331) (2.5)%
Grants and contracts 18,161,322 17,652,859 508,463 2.9%
Auxiliary enterprises, net* 28,849,210 29,011,197 (161,987) (0.6)%
Other operating revenue** 450,969 621,138 (170,169) (27.4)%
Total operating revenues 77,594,600 78,188,624 (594,024) (0.8)%
Nonoperating revenues/(expenses):
State appropriations 39,947,404 43,895,543 (3,948,139) (9.0)%
Federal student financial aid 15,455,682 16,143,069 (687,387) (4.3)%
Other nonoperating revenues, net** 1,655,196 (1,354,051) 3,009,247 222.2%
Total nonoperating revenues 57,058,282 58,684,561 (1,626,279) (2.8)%
Other revenues:
Capital grants and gifts** 467,585 1,159,215 (691,630) (59.7)%
Additions to permanent endowment** 398,250 499,074 (100,824) (20.2)%
Other capital revenues** 14,805,792 10,126,777 4,679,015 46.2%
Total other revenues 15,671,627 11,785,066 3,886,561 33.0%
Total revenues $ 150,324,509 $ 148,658,251 $ 1,666,258 1.1%
20.0%
12.1%
19.2%26.6%
10.3% 11.8%
Student Tuition & Fees, net*
Grants and contracts
Auxiliary enterprises, net*
State appropriations
Federal student financial aid
Other**

7 | P a g e
For the fiscal year, total nonoperating revenues decreased by $1.6 million. This was primarily a result of
decreased state appropriations of $3.9 million, which was partially offset by a growth in investment income of
$1.5 million.
Other revenues increased by $3.9 million. Reimbursements from the 21st Century bond program of $4.7
million are the major reason for the increase. The increase was offset by a decrease in capital grants and gifts of
$692 thousand, due to a reduction in revenues from the Equipment Trust Fund.
SUMMARY OF EXPENSES
Total operating expenses dropped by $4.8 million in FY2014 compared to the previous fiscal year. This
represents a 3.4% decrease. Comparative summaries of the University’s operating expenses by both natural
classification and function for the years ended June 30, 2014 and 2013 appear below.
The total decrease in operating expenses of $4.8 million was mostly due to a decline in salaries and wages
of $893 thousand, a reduction of $3.8 million in services and supplies and a decrease in depreciation of $1.2
million. Additionally, these were offset by an increase in fringe benefits of $1.1million.
Summary of Expenses by Natural Classification
For the years ended June 30, 2014 and 2013
Increase/(Decrease)
2014 2013 Amount Percent
Salaries and wages $ 52,091,335 $ 52,984,370 $ (893,035) (1.7)%
Fringe benefits 16,693,819 15,588,081 1,105,738 7.1%
Services and supplies 41,252,050 45,071,053 (3,819,003) (8.5)%
Scholarships and fellowships 6,492,730 6,722,640 (229,910) (3.4)%
Utilities 7,478,061 7,233,338 244,723 3.4%
Depreciation 9,993,530 11,172,058 (1,178,528) (10.5)%
Total operating expenses $ 134,001,525 $ 138,771,540 $ (4,770,015) (3.4)%
38.9%
12.5%
30.8%
4.8%
5.6%
7.5% Salaries and wages
Fringe benefits
Services and supplies
Scholarships and fellowships
Utilities
Depreciation

8 | P a g e
The decrease in salaries and wages was a result of a reduction in wage expenses, partially offset by an
increase in salaries. The decrease in expenses for services and supplies was primarily due to a decline in expenses
for maintenance reserve. Depreciation expenses declined as a result of decreases in equipment and library books.
Fringe benefits changed due to the rise in health care costs.
By function, expenses for instruction decreased by $3.0 million. This was caused by a reduction in
salaries and wages of $1.1 million and a decrease in services and supplies of $2.0 million. In addition, expenses
for operation and maintenance of plant declined by $3.0 million, which was the result of a reduction in
maintenance reserve. These reductions were offset by an increase in expenses for auxiliary enterprises of $1.8
million, mostly due to services and supplies.
Summary of Expenses by Function
For the years ended June 30, 2014 and 2013
Increase/(Decrease)
2014 2013 Amount Percent
Operating expenses:
Instruction $38,029,693 $ 40,996,898 $ (2,967,205) (7.2)%
Research 6,657,507 7,654,684 (997,177) (13.0)%
Public service 7,127,168 6,715,936 411,232 6.1%
Academic support 6,710,123 5,734,486 975,637 17.0%
Student services 5,355,114 4,923,043 432,071 8.8%
Institutional support 15,674,454 15,154,621 519,833 3.4%
Operation/maintenance of plant 11,341,166 14,314,006 (2,972,840) (20.8)%
Scholarships and fellowships 3,270,558 3,704,836 (434,278) (11.7)%
Depreciation 9,993,530 11,172,058 (1,178,528) (10.5)%
Auxiliary enterprises 29,798,511 28,011,412 1,787,099 6.4%
Other 43,701 389,560 (345,859) (88.8)%
Total operating expenses $ 134,001,525 $ 138,771,540 $ (4,770,015) (3.4)%
28.4%
5.0%5.3%5.0%4.0%
11.7%
8.5%
2.4%
7.5%
22.2% 0.03%
Instruction
Research
Public service
Academic support
Student services
Institutional support
Operation/maintenance of plant
Scholarships and fellowships
Depreciation
Auxiliary enterprises
Other

9 | P a g e
STATEMENT OF CASH FLOWS
The Statement of Cash Flows (SCF) is concerned with the flow of cash in and out of the University. The
SCF shows changes in the Statement of Net Position (SNP) accounts and the income affect for cash and cash
equivalents. GASB principles define four major categories of cash flows: cash flows from operating activities,
cash flows from noncapital financing activities, cash flows from capital and related financing activities, and cash
flows from investing activities. In addition, it captures both the current operating results and the accompanying
changes in the SNP. These cash flows are crucial to funding the operation of the University. From FY13 to FY14
the University’s SCF shows a $5.8 million decrease in cash and cash equivalents.
Statement of Cash Flows Year Ended June 30, Increase/(Decrease)
2014 2013 Amount Percent
Cash flows from:
Operating activities $(45,538,356) $(52,521,714) $ 6,983,358 13.3%
Noncapital financing activities 56,889,083 60,760,582 (3,871,499) (6.4)%
Capital and related financing activities (16,836,901) (24,551,118) 7,714,217 31.4%
Investing activities (310,501) (744,851) 434,350 58.3%
Net increase/(decrease) in cash and cash
equivalents (5,796,675) (17,057,101) 11,260,426 66.0%
Cash and cash equivalents, beginning of
year 35,905,313 52,962,414 (17,057,101) (32.2)%
Cash and cash equivalents, end of year $ 30,108,638 $ 35,905,313 $(5,796,675) (16.1)%
Overall, there was a $7.0 million decrease in net cash used by operating activities in FY2014 compared
to FY2013. This was primarily a result of a $9.1million decrease in cash used for payables to suppliers, offset
by a reduction in cash received of $817 thousand for grants and contracts, $577 thousand for tuition and fees, and
$544 thousand in other receipts.
Cash flows from noncapital financing activities declined $3.9 million. There were decreases in state
appropriations of $3.9 million and federal student financial aid of $687 thousand. Federal direct lending program
of $248 thousand, gifts of $180 thousand and funds held in custody of $168 thousand offset the reductions.
There was an increase in net cash for capital financing activities of $7.7 million in FY2014 and is
explained as follows. In FY2013, the University spent $9.4 million more in capital assets than in FY2014. This
was offset by a decrease in cash received by $2.4 million from the VCBA 21st Century bond reimbursement
program in FY2014 versus FY2013.
The last major category on the statement of cash flow is investing activities. In total, net cash used for
investing activities declined by $434 thousand. There was an increase in investment income from the prior year
of $1.5 million and a decrease in the purchase of investments of $446 thousand. This was offset by a reduction
in proceeds from the sale and maturities of investments of $1.5 million.
CAPITAL AND DEBT ACTIVITIES
The renewal and replacement of the University’s capital assets is crucial to sustaining the quality of its
academic, research and public service programs. The University continues to invest in capital assets in accordance

10 | P a g e
with its master plan, modernizing its current and older facilities, purchasing new equipment and building new
facilities.
Capital assets, net of depreciation, increased by $7.0 million in FY2014. VSU had a $1.1 million net
increase in construction in progress primarily due to activity on two construction projects: Howard Quad
Residence Hall II and the Multipurpose Center. Buildings increased by $12.9 million, mainly from the
capitalization of Howard Quad Residence Hall II. There was also an increase of $1.1 million in infrastructure
due to the capitalization of the Sanitary and Storm Sewer Project. Depreciation expense for the year totaled $10.0
million.
Proper management of University resources and the replacement and renewal of capital assets requires
the prudent use of debt to finance projects. University bonds are issued pursuant to Section 9(c) of Article X of
the Constitution of Virginia. These bonds are backed by the full faith, credit and taxing power of the
Commonwealth. The use of debt to finance capital projects is managed in accordance with the University’s debt
policy.
As of June 30, 2014, the University had $117.3 million in outstanding long-term debt. This debt consists
of $106.8 million of general obligation bonds, $7.9 million of notes payable, and $2.6 million of installment
purchase obligations. Long-term debt decreased by $3.0 million. This is the result of making debt payments
throughout the year, as well as the effects of the new GASB 65 standard.
FUTURE ECONOMIC OUTLOOK
The “2014-15 Tuition and Fees at Virginia’s State-Supported Colleges and Universities” report published
by the State Council of Higher Education for Virginia (SCHEV) in July 2014, indicates that over much of the last
decade, VSU continues to make college education extremely affordable for our students. As this SCHEV report
indicates, the Governor and General Assembly have made strides to reverse the downward trend in state support
for higher education. The reinvestment in higher education will continue to help public institutions meet the
requirements of the Virginia Education Opportunity Act of 2011, also known as TJ21. This landmark legislation
calls for an additional 100,000 college graduates by the year 2025 to help ensure that the Commonwealth has the
resources it needs to compete successfully in the marketplace of the future.
A large percentage of the University’s students depend on some form of financial aid, such as
scholarships, grants or student loans, to be able to attend. As a result of less aid being available, it is increasingly
difficult for these students to be able to afford a college education. To address this concern, Virginia State
University has held tuition and fees increases to a minimum. For the 2014-15 academic year Virginia State
University will have one of the lowest tuition and mandatory E&G fees for both full-time, in-state and out-of-
state undergraduate students at four-year institutions in Virginia.
Public financial support has allowed the University to make great achievements. However, with the
uncertainty associated with public support, the University has been forced to be proactive in searching for
additional private financial support to help VSU take the next step toward success. This additional financial
assistance will help provide the competitive edge that assists in attracting quality faculty, recruiting the brightest
students and in developing mutually beneficial relationships with business and industry. Since the needs of the
university change frequently, the University will actively seek unrestricted gifts which provide the greatest
flexibility in channeling resources to the areas of greatest need.
As evident in the accompanying financial statements, the University’s finances remain strong. However,
the impact of changes in federal regulations regarding Satisfactory Academic Performance (SAP) and the Parent
Plus Loan program, have created significant challenges throughout higher education, particularly among those
institutions whose mission is to provide educational opportunities to students of lower socio-economic means.

11 | P a g e
To address
these issues, the University is taking proactive steps to improve in a number of areas including: student retention,
first-year experience, advising, teaching pedagogy and technology among others.
VSU’s successful economic outlook is tied to various factors that include: the ability to recruit students,
the university’s status as a public institution within the higher education system and the ability to raise revenue
through other sources. As knowledge and skills become the source of this nation’s competitive strength, education
is becoming one of our more important national resources. The strong correlation between the level of education
and lifetime income emphasizes that higher education is one of the best strategies to “Building a Better World,”
our motto.
VSU will continue to make significant investments in launching new initiatives to enhance the
competitiveness of its academic programs. With the peaks and valleys of Virginia’s economic cycle, it is clear
that VSU must be aggressive and innovative in pursuing financial resources so that the University can
accommodate the expected additional enrollment. Certainly, a quality education will remain our cornerstone
principle, as the University addresses issues of preparation, affordability and accessibility.

Virginia State University

12 | P a g e
As of June 30, 2014 with comparative financial information as of June 30, 2013
ASSETS
Virginia State
University
Component
Units
Virginia State
University
Component
Units
Current assets:
Cash and cash equivalents (Note 2) 17,251,516$ 4,231,420$ 15,404,372$ 3,956,406$
Cash and cash equivalents - Securities Lending 1,454,739 - 1,284,210 -
Short-term investments (Note 2) 47,100 - 69,242 -
Accounts and loans receivable, net of allowance (Note 3) 5,158,095 325,710 5,395,608 80,533
Pledges receivable, net of allowance (Note 3) - 206,880 - 248,717
Due from the Commonwealth (Note 3) 6,532,529 - 1,803,967 37,533
Due from affiliates (Note 3) 86,742 - 39,613 -
Prepaid expenses 2,988,391 4,919 2,183,802 4,796
Notes receivable, net of allowance (Note 3) 39,673 - 41,458 -
Total current assets 33,558,785 4,768,929 26,222,272 4,327,985
Noncurrent assets:
Restricted cash and cash equivalents (Note 2) 12,857,122 2,452,945 20,500,941 2,260,939
Restricted investments (Note 2) 2,748,308 26,100 1,406,881 56,200
Endowment investments (Note 2) 26,008,982 12,547,236 23,894,913 10,553,828
State appropriation available 404,189 - 894,349 -
Pledges receivable, net of allowance - - - 195,369
Notes receivable, net of allowance (Note 3) 1,624,550 - 1,642,649 -
Other long-term investments (Note 2) 3,580,702 - 2,356,352 -
Other noncurrent - 91,205 - 93,914
Non depreciable capital assets (Note 4) 37,522,711 542,828 36,266,887 542,828
Depreciable capital assets, net (Note 4) 212,604,569 8,703,891 206,831,587 9,293,788
Total noncurrent assets 297,351,133 24,364,205 293,794,559 22,996,866
Deferred outflows of resources (Note 1) 3,207,574 - 3,525,444 -
Total assets and deferred outflows of resources 334,117,492 29,133,134 323,542,275 27,324,851
LIABILITIES
Current liabilities:
Accounts payable and accrued liabilities (Note 5) 9,720,727 90,049 7,717,015 121,350
Due to affiliates - 86,742 37,533 39,613
Unearned revenue 2,601,666 70,225 3,398,442 24,518
Retainage payable 296,852 - 1,129,926 -
Obligations under securities lending 1,501,839 - 1,353,452 -
Deposits held in curtody of others 1,368,905 74,095 1,290,886 88,734
Long-term liabilities-current portion (Notes 6 and 7) 7,460,764 700,000 8,122,320 590,000
Other current liabilities 178,435 62,373 44,912 63,741
Total current liabilities 23,129,188 1,083,484 23,094,486 927,956
Noncurrent liabilities:
Long-term liabilities - noncurrent (Notes 6 and 7) 115,969,528 20,757,679 121,747,554 23,175,045
Deferred inflows of resources 22,535 - 26,978 -
Total liabilities and deferred inflows of resources 139,121,251$ 21,841,163$ 144,869,018$ 24,103,001$
2014 2013

13 | P a g e
As of June 30, 2014 with comparative financial information as of June 30, 2013 (continued)
NET POSITION
Virginia State
University
Component
Units
Virginia State
University
Component
UnitsNet investment in capital assets 144,222,711$ (8,912,076)$ 135,493,028$ (8,909,470)$ Restricted for:
Nonexpendable:Scholarships and fellowships 4,662,903 9,761,674 4,556,835 9,177,822 Instruction 3,242,011 - 3,228,604 - Other 558,836 - 555,420 -
Expendable:Scholarships and fellowships 19,135,805 4,518,960 16,293,516 2,997,350 Instruction 1,028,645 - 579,392 - Loans 891,335 - 890,996 - Capital projects 2,744,190 - 1,336,583 - Other 1,327,018 - 1,340,263 -
Unrestricted 17,182,787 1,923,413 14,398,620 (43,852) Total net position 194,996,241$ 7,291,971$ 178,673,257$ 3,221,850$
2014 2013
Certain 2013 amounts have been restated to confirm to GASB 65 reclassifications. The accompanying notes to the financial statements are an integral part of this statement.

14 | P a g e
As of June 30, 2014 with comparative financial information as of June 30, 2013
Virginia State
University
Component
Units
Virginia State
University
Component
UnitsOperating revenues:
Student tuition and fees (net of scholarship allowance of $11,982,820) 30,133,099$ -$ 30,903,430$ -$
Federal grants and contracts 17,482,936 - 17,012,745 - State and local grants and contracts 678,386 - 640,114 - Auxiliary enterprises (net of scholarship
allowance of $14,364,630) 28,849,210 - 29,011,197 - Other operating revenues 450,969 3,503,467 621,138 3,529,260
Total operating revenues 77,594,600 3,503,467 78,188,624 3,529,260 Operating expenses: (Note 9)
Education and general:Instruction 38,029,693 - 40,996,898 - Research 6,657,507 - 7,654,684 - Public service 7,127,168 - 6,715,936 - Academic support 6,710,123 - 5,734,486 - Student services 5,355,114 - 4,923,043 - Institutional support 15,674,454 2,381,775 15,154,621 2,320,760 Operation and maintenance of plant 11,341,166 - 14,314,006 - Scholarships and fellowships 3,270,558 275,133 3,704,836 192,115 Depreciation 9,993,530 615,486 11,172,058 620,195 Auxiliary enterprises 29,798,511 - 28,011,412 - Other 43,701 - 389,560 -
Total operating expenses 134,001,525 3,272,394 138,771,540 3,133,070 Operating income/(loss) (56,406,925) 231,073 (60,582,916) 396,190
Nonoperating revenues/(expenses):State appropriations (Note 8) 39,947,404 - 43,895,543 - Gifts 748,506 1,357,445 467,202 1,727,657 Investment income 4,369,345 3,724,735 2,843,010 865,434 Interest on indebtedness (3,648,782) (954,739) (4,235,544) (971,798) Loss on disposal of assets (30,586) - (24,860) - Federal student financial aid 15,455,682 - 16,143,069 - Other nonoperating revenues 773,582 73,676 574,690 176,267 Other nonoperating expenses (556,869) (362,069) (978,549) (287,055)
Net nonoperating revenues/(expenses) 57,058,282 3,839,048 58,684,561 1,510,505 Income/(loss) before other revenues 651,357 4,070,121 (1,898,355) 1,906,695
Other revenues:Capital grants and gifts 467,585 - 1,159,215 - Additions to permanent endowments 398,250 - 499,074 - VCBA 21st Century bond reimbursement program 14,805,792 - 10,126,777 -
Total other revenues 15,671,627 - 11,785,066 - Increase/(decrease) in net position 16,322,984 4,070,121 9,886,711 1,906,695 Net position, beginning of year as restated (Note 1.O) 178,673,257 3,221,850 168,786,546 1,315,155
Net position, end of year 194,996,241$ 7,291,971$ 178,673,257$ 3,221,850$
2014 2013
Certain 2013 amounts have been restated to confirm to GASB 65 reclassifications. The accompanying notes to the financial statements are an integral part of this statement.

15 | P a g e
As of June 30, 2014 with comparative financial information as of June 30, 2013
2014 2013
Cash flows from operating activities:
Tuition and fees 30,065,541$ 30,642,198$
Grants and contracts 17,915,003 18,732,368
Auxiliary enterprises 28,841,927 28,929,660
Departmental sales and services, and other revenues 249,852 794,094
Payments of employees (68,638,153) (68,512,581)
Payments to suppliers (40,211,938) (49,285,965)
Payments for utilities (7,478,062) (7,233,338)
Payments for scholarships and fellowships (6,492,729) (6,722,640)
Loans issued to students (194,910) (171,874)
Collection of loans from students 214,794 250,587
Other payments 190,319 55,777
Net cash provided/(used) by operating activities (45,538,356) (52,521,714)
Cash flows from noncapital financing activities:
State appropriations 39,991,912 43,862,296
Gifts 1,146,757 966,276
Federal student financial aid 15,455,683 16,143,069
Other nonoperating revenue 216,712 127,605
Funds held in custody of others - receipts 5,759,097 6,183,522
Funds held in custody of others - disbursements (5,680,657) (6,273,311)
Federal direct lending program disbursements (421) (248,875)
Net cash provided/(used) by noncapital financing activities 56,889,083 60,760,582
Cash flows from capital financing activities:
Capital appropriations 445,652 (648,151)
Capital gifts and grants 1,201,420 179,202
VCBA 21st Century bond reimbursement program 9,259,282 11,613,256
Interest paid on caital debt, leases, and installments (3,674,306) (4,257,150)
Principal paid on capital debt, leasses, and installments (6,638,056) (29,802,551)
Principal received on capital debt, leases, and installments 455,103 25,663,364
Purchase of capital assets (17,885,996) (27,299,088)
Net cash provided/(used) by capital financing activities (16,836,901) (24,551,118)
Cash flows from investing activities:
Investment income 4,369,345 2,843,010
Proceeds from sales and maturities of investments (3,738,168) (2,200,307)
Purchase of investments (941,678) (1,387,554)
Net cash provided/(used) by investing activities (310,501) (744,851)
Net increase/(decrease) in cash (5,796,675) (17,057,101)
Cash and cash equivalents - beginning of the year 35,905,313 52,962,414
Cash and cash equivalents - end of year 30,108,638$ 35,905,313$

16 | P a g e
As of June 30, 2014 with comparative financial information as of June 30, 2013 (continued)
2014 2013Reconciliation of Net Operating Loss to Net cash used by Operating
Activities:
Operating income/(loss) (56,406,925)$ (60,582,916)$
Adjustments to reconcile net cash used by operating activities:
Depreciation expense 9,993,530 11,172,058
Changes in assets and liabitities:
Receivables 274,498 820,277
Prepaid items (804,589) (140,219)
Other assets - (25,306)
Accounts payable 1,966,179 (4,036,429)
Less: Interest payable 25,524 21,606
Unearned revenue (796,776) 89,420
Other liabilities 190,319 81,083
Net loans 19,884 78,712
Net cash provided/(used) by operating activities (45,538,356)$ (52,521,714)$
Certain 2013 amounts have been restated to confirm to GASB 65 reclassifications. The accompanying notes to the financial statements are an integral part of this statement.

17 | P a g e
Virginia State University
N O T E S T O T H E F I N A N C I A L S TA T E M E N T S June 30, 2014
1. SUMMARY OF SIGNIFICANT ACCOUNTING POLICIES
A. Reporting Entity
The University is a component unit of the Commonwealth of Virginia and is included in the
Comprehensive Annual Financial Report (CAFR) of the Commonwealth. These basic financial
statements have been prepared in accordance with accounting principles generally accepted in the
United States of America as prescribed by the Governmental Accounting Standards Board (GASB)
applicable to colleges and universities. They are prepared for and at the direction of the
Commonwealth of Virginia for inclusion in the Commonwealth’s CAFR, which includes all agencies,
boards, commissions, and authorities associated with the Commonwealth and over which the
Commonwealth exercises or has the ability to exercise oversight authority.
The Virginia State University Foundation (VSUF) is a legally separate component unit of the
University and was organized as a tax-exempt charitable and educational organization in 1968. The
purpose of this foundation is to accept contributions from individual donors and to safeguard, invest,
and distribute the funds as designated by the donors or the Foundation’s Board of Trustees for the
benefit of the University, its students, alumni, and educational community in support of the University’s
mission.
The Virginia State University Real Estate Foundation (VSUREF) is a legally separate
component unit of the University and was organized as a tax-exempt charitable and educational
organization in 2002. Operations began in August 2003. The purpose of the Real Estate Foundation is
to construct and manage the University Apartments at Ettrick (UAE), a 504-bedroom dormitory facility
for the University, in support of the University’s mission.
Although the University does not control the timing or amount of receipts from either the VSUF
or the VSUREF, the majority of the resources or income thereof that both foundations hold and invest
is restricted to the activities of the University by the donors. Because these restricted resources held by
the foundations can only be used by, or for the benefit of the University, the VSUF and the VSUREF
are considered component units of the University and are discretely presented in the University’s
financial statements.
During the year ended June 30, 2014, the VSUF distributed $683,459 to the University for both
restricted and unrestricted purposes. Separate financial statements for the VSUF can be obtained by
writing Virginia State University Foundation c/o Vice President of Development, Storum Hall, P.O.
box 9027, Petersburg, VA 23806. Separate financial statements for the VSUREF can be obtained by
writing Virginia State University Real Estate Foundation c/o Vice President of Development, Storum
Hall, P.O. Box 9027, Petersburg, VA 23806.
B. Basis of Presentation
The University’s accounting policies conform to generally accepted accounting principles as
prescribed by the Governmental Accounting Standards Board (GASB).

18 | P a g e
GASB issued Statement 65, Items Previously Reported as Assets and Liabilities, in March of
2012, and it is effective for the University’s fiscal year ending June 30, 2014. This statement establishes
accounting and financial reporting standards that reclassify certain items that were previously reported
as assets and liabilities to deferred outflows of resources and deferred inflows of resources respectively.
Deferred outflows of resources are defined as the consumption of net assets applicable to a future
period, and have a positive effect on net position. Conversely, deferred inflows of resources are
described as the acquisition of net assets related to a future reporting cycle, with a negative effect on
net position.
For the University, GASB 65 changed the rules for reporting advance refunding gains and
losses associated with the debt for bonds and notes payable used to finance capital projects. Prior to
FY14, these gains and losses were included as part of the debt, and shown accordingly on the financial
statements. The rules now state the gains and losses are reported separately as deferred inflows and
deferred outflows of resources. The reclassifications on the University’s fiscal year 2014 financial
statements, regarding the reporting of these gains and losses, due to the implementation of GASB 65,
are highlighted below.
Advance Refunding Gains:
2014
Balance
Before Changes Changes
2014
Ending
Balance
After Changes
Current liabilities $23,129,188 $ - $23,129,188
Noncurrent liabilities 115,992,063 (22,535) 115,969,528
Total liabilities 139,121,251 (22,535) 139,098,716
Deferred inflows of resources - 22,535 22,535
Total liabilities and deferred inflows of
resources $139,121,251 - $139,121,251
Advance Refunding Losses:
2014
Balance
Before Changes Changes
2014
Ending
Balance
After Changes
Current assets $33,558,785 $ - $33,558,785
Noncurrent assets 300,558,707 (3,207,574) 297,351,133
Total assets 334,117,492 (3,207,574) 330,909,918
Deferred outflows of resources - 3,207,574 3,207,574
Total assets & deferred outflows of resources $334,117,492 - $334,117,492
Effective for fiscal year 2013, GASB Statement 63, Financial Reporting of Deferred Outflows
of Resources, Deferred Inflows of Resources, and Net Position amends the financial statement
presentation of Net Assets to Net Position. This standard supersedes the Net Assets designation in
GASB Statement 34, Basic Financial Statements – and Management’s Discussion and Analysis – for
State and Local Governments, by modifying the terminology used in the applicable titles and line items
of the financial statements to Net Position. GASB Statement 35, Basic Financial Statements and
Management’s Discussion and Analysis of Public Colleges and Universities also establish financial
reporting standards for public colleges and universities within, and/or in addition (where not
superseded) to the financial reporting guidelines mentioned above in GASB Statements 34 and 63.
Financial reporting and disclosure requirements in GASBS 37 and 38 make changes to certain sections
of GASB 35, which are relevant to University’s financial statements.

19 | P a g e
C. Basis of Accounting
The University’s financial statements have been prepared using the economic resources
measurement focus and the accrual basis of accounting. Under the accrual basis, revenues are
recognized when earned and expenses are recorded when a liability has been incurred, regardless of
the timing of related cash flows. All significant intra-agency transactions have been eliminated, as
well.
D. Cash Equivalents
The University considers all highly liquid investments with an original maturity of ninety days
or less to be cash equivalents. Funds invested through the State Non-Arbitrage Program (SNAP) and
portions of the funds invested in the State Securities Lending Program are considered cash equivalents.
E. Investments
In accordance with GASB Statement 31, Accounting and Financial Reporting for Certain
Investments and for External Investment Pools, investments are recorded at fair market value at June
30, 2014. All investment income, including changes in the fair value of investments (unrealized gains
and losses), is reported as nonoperating revenue in the Statement of Revenues, Expenses, and Changes
in Net Position.
F. Prepaid Expenses
Prepaid expenses represent university library books, memberships, subscriptions, postage,
system maintenance agreements, service agreements and licenses that were paid in advance as of June
30, 2014.
G. Capital Assets
Capital assets consisting of land, buildings, equipment, infrastructure assets, improvements
other than buildings, inexhaustible works of art, intangible assets, and construction-in-progress are
stated at appraised historical cost or actual cost, where determinable. Purchased or constructed capital
assets are reported at actual cost or estimated historical cost. Donated capital assets are reported at fair
value on the date of acquisition. Library materials are valued using purchase price for library
acquisitions. Equipment is capitalized when the acquisition cost is $5,000 or greater and the estimated
useful life is two years or more. Expenses for construction-in-progress are capitalized as they are
incurred. Intangible assets are capitalized when the acquisition cost is $100,000 or greater. Interest
expenses relating to construction are capitalized, net of interest income earned on resources set aside
for this purpose. For the year ended June 30, 2014, interest expenses exceeded interest earned by
$194,048 and was capitalized. Infrastructure assets are recorded at cost.
Depreciation is calculated using the straight-line method over the estimated useful life as
follows:
Buildings 30-60 years
Infrastructure assets 15-20 years
Equipment 2-10 years
Intangible assets – computer software 5-10 years
Library books 5 years
Other improvements 20 years

20 | P a g e
H. Restricted and Unrestricted Net Position
Resources restricted by outside sources are distinguished from unrestricted resources allocated
for specific purposes by action of the Board of Visitors. Externally restricted resources may be utilized
only in accordance with the purposes established by the source of such resources and are in contrast
with unrestricted resources, of which the governing board retains full control to use in achieving the
institutional purpose.
Restricted net assets can be expendable or nonexpendable. Nonexpendable restricted net assets
are endowments and similar type funds where the donor(s) or some other outside source has stipulated,
as a condition of the gift instrument, that the principal is to be maintained inviolate and in perpetuity,
and invested for the purpose of producing present and future income, which may either be expended or
added to principal. Expendable restricted net assets are resources which the University is legally or
contractually obligated to spend in accordance with the restrictions imposed by external parties.
Unrestricted net assets are resources derived primarily from state appropriations, sales and
services of educational departments, student tuition and fees, auxiliary enterprises fees and revenues,
and gifts. Auxiliary enterprises are self-supporting activities that provide services for students, faculty,
and staff. These unrestricted resources are used for transactions relating to the educational and general
operations of the University and at the discretion of the governing board to meet current expenses.
When an expense has been incurred that can be paid using either restricted or unrestricted
resources, the University’s policy is first to apply the expense toward restricted resources and then
toward unrestricted. Restricted funds remain classified as such until restrictions have been satisfied.
I. Unearned Revenue
Unearned revenue represents revenues collected, but not earned as of June 30, 2014. This
consists primarily of student tuition and fees received in advance of the academic term and advance
payments from grant and contract sponsors.
J. Accrued Compensated Absences
The amount of leave earned, but not taken by 12-month faculty and salaried employees is
recorded as a liability on the Statement of Net Position. The amount reflects all unused vacation leave,
overtime leave, compensatory leave, and the amount payable upon termination under the
Commonwealth of Virginia's sick leave payout policy as of June 30, 2014. The applicable share of
employer-related taxes payable on eventual termination payments is also included.
K. Revenue and Expense Classifications
Operating revenues include activities that have the characteristics of exchange transactions,
such as: (1) student tuition and fees, net of scholarship allowance; (2) federal, state, and
nongovernmental grants and contracts; and (3) sales and services of auxiliary enterprises, net of
scholarship allowance.
Nonoperating revenues include activities that have the characteristics of nonexchange
transactions such as gifts and other revenue sources that are defined as nonoperating revenues by GASB
Statement 9, Reporting Cash Flows of Proprietary and Nonexpendable Trust Funds and Governmental
Entities That Use Proprietary Fund Accounting, and GASB Statement 34, Basic Financial Statements
– and Management’s Discussion and Analysis, such as state appropriations, investment income, and
federal student financial aid.

21 | P a g e
Nonoperating expenses include interest on debt related to the purchase of capital assets and
investment expenses. All other expenses are classified as operating expenses.
L. Discounts, Premiums, and Bond Issuance Costs
Bonds payable on the Statement of Net Position are reported net of related premiums and
discounts, which are amortized as revenue or expense over the life of the bond. Bond issuance costs
are expensed as incurred, due to the implementation of GASB Statement 65, Items Previously
Reported as Assets and Liabilities, in FY14. While in the past the amounts were expensed over the
life of the bonds. The effect of the change in accounting methods, in FY 2014, results in a
restatement of Beginning Net Position, and is discussed in Note 1.O.
M. Scholarship Allowances
Student tuition and fee revenues, and certain other revenues from students, are reported net of
scholarship allowance in the Statement of Revenues, Expenses, and Changes in Net Position.
Scholarship allowance is the difference between the stated charge for goods and services provided by
the University and the amount paid by students and/or third parties making payments on the students’
behalf. The scholarship allowance is reported using the alternative method as recommended by the
National Association of College and University Business Officers (NACUBO). The alternative method
is a simple proportionality algorithm that computes scholarship allowance on a University-wide basis
by allocating the amounts applied to student accounts and the cash payment to students, excluding
payments for services, on the ratio of total aid to the aid not considered third-party aid.
N. Title IV Federal Financial Assistance Programs
The University participates in the following federally funded programs: Federal Pell Grant
(PELL) and Teacher Education Assistance for College and Higher Education (TEACH) Grant; Federal
Supplemental Educational Opportunity Grant (SEOG); Federal Direct Subsidized and Unsubsidized;
Federal Parent Loan for Undergraduate and Graduate Students (PLUS), Federal Perkins Loan and
Federal College Work Study (CWS). Federal programs are audited in accordance with the Single Audit
Act Amendments of 1996, the Office of Management and Budget Revised Circular A-133, Audit of
States, Local Governments and Non-Profit Organizations, and the Compliance Supplement.
O. Restatement of Beginning Net Position
Effective for FY14, GASB 65 - Items Previously Reported as Assets and Liabilities amends
the University’s reporting for unamortized issuance costs related to debt for bonds and notes payable
associated with capital projects. In the past, unamortized issuance cost was classified as an asset and
amortized over the life of the bond or note. The new requirements call for a restatement of the FY14
beginning fund balance, and the complete expense write off of the asset. The effect of this reporting
change to net position is as follow:
Net Position as reported at June 30, 2013 $179,204,721
Less: Decrease due to GASB 65 implementation
regarding unamortized issuance costs (531,464)
Net Position at July 1, 2013, as restated $178,673,257
P. Comparative Data

22 | P a g e
The University presents its financial information on a comparative basis. The basic financial
statement include certain prior year summarized comparative information in total, but not at
the level of detail required for a presentation in conformity with generally accepted accounting
principles. Accordingly, the prior year information should be read in conjunction with the
University’s financial statements for the year ended June 30, 2013, from which the summarized
information was derived.
2. CASH AND CASH EQUIVALENTS AND INVESTMENTS
A. Cash and Cash Equivalents
Pursuant to Section 2.2-1800, et seq., Code of Virginia, all State funds of the University are
held by the Treasurer of Virginia, who is responsible for the collection, disbursement, custody, and
investment of State funds. Cash deposits held by the University are maintained in accounts that are
covered by federal depository insurance or collateralized in accordance with the Virginia Security for
Public Deposits Act, Section 2.2-4400 of the Code of Virginia. In accordance with the GASB Statement
9 Reporting Cash Flows of Proprietary and Nonexpendable Trust Funds, definition of cash and cash
equivalents, cash represents cash with the Treasurer of Virginia, cash on hand, and cash deposits
including certificates of deposit and temporary investments with original maturities of three months or
less. At June 30, 2014, the carrying amount of cash and cash equivalents was $31,563,377.
B. Investments - Credit Risk, Custodial Credit Risk, and Interest Rate Risk
The University evaluates common deposit and investment risks related to credit risk,
concentration of credit risk, interest rate risk, and foreign currency risk. The following disclosures are
made in accordance with GASB Statement 40, Deposit and Investment Risk Disclosures. As an element
of interest rate risk, this statement requires certain disclosures of investments with fair values that are
highly sensitive to changes in interest rates. Deposit and investment policies related to the risks
identified in this statement must be disclosed. GASB Statement 40 also modifies disclosures required
by GASB Statement 3, Deposits with Financial Institutions, Investments (including Repurchase
Agreements), and Reverse Repurchase Agreements.
As of June 30, 2014, the University had the following investments:
Spider Management Group $
32,337,992
Treasurer of Virginia 47,100
Total investments $32,385,092
Investments held by the Treasurer of Virginia include the University’s allocated share of
securities totaling $47,100 received for securities lending transactions and held in the General Account
of the Commonwealth. The Commonwealth’s policy is to record unrealized gains and losses in the
General Fund in the Commonwealth’s basic financial statements. When gains or losses are realized,
the actual gains and losses are recorded by the affected agencies. Information related to the credit risk
of these investments and securities lending transactions held in the General Account is available on a
statewide level in the Commonwealth of Virginia’s CAFR.

23 | P a g e
C. Interest Rate Risk
The following information is provided with respect to the credit risk associated with the
University’s cash and cash equivalents and investments at June 30, 2014. Interest rate risk is the risk
that changes in interest rates will adversely affect the fair market value of an investment. The
University’s policy for investment of endowment fund assets requires that the investments be allocated
as follows as of June 30, 2014:
This asset allocation helps limit the University’s exposure to interest rate risk.
Asset Class Desired Range Allocation
Domestic Equity 5 - 25% 23.4 %
International Equity 5 - 25% 17.0 %
Global Equity 5 - 25% 11.5 %
Opportunistic (P/E, Venture) 10 - 25% 15.9 %
Multi Strategy 5 - 20% 9.5 %
Credit 0 - 15% 8.2 %
Real Estate 0 - 10% 2.6 %
Real Assets 0 - 10% 7.5 %
Cash 0 - 10% 4.4 %
D. Credit Risk
Credit risk is the risk that an issuer or other counterparty to an investment will not fulfill its
obligation. Statutes authorize the investment of local funds held by the University in obligations of the
Commonwealth; federal government; other states or political subdivisions thereof; Virginia political
subdivisions; the International Bank for Reconstruction and Development; the Asian Development
Bank; and the African Development Bank. In addition, the University may invest in prime quality
commercial paper rated Prime 1 by Moody’s Investment Service or A-1 by Standard and Poor’s,
Incorporated. The University may also invest in overnight term or open repurchase agreements and
money market funds.
E. Custodial Credit Risk
Custodial credit risk for investments is the risk that in the event of the failure of the
counterparty, the endowment funds will not be able to recover the value of the investments that are in
possession of an outside party. The University does not have a formal investment policy for custodial
arrangements. At June 30, 2014, the University endowment funds were held at the custodial banks and
the Spider Management Group.
F. Concentration of Credit Risk
Concentration of credit risk is the risk of loss attributed to the magnitude of a government or
university in a single issuer. The University does not have a formal policy to reduce concentration of
credit risk; however, all of the University’s investments were held in various instruments and stocks
and were not exposed to this risk.
G. VSUF – Cash and Investments

24 | P a g e
The investments of the VSUF consist primarily of equity securities and mutual funds. All
investments are stated at fair value as reported by investment managers and reflect readily determinable
market prices. All investments are considered available for sale. Realized gains are calculated based on
the difference between the costs and selling price of the security. The amount of cash and investments
held by the VSUF at June 30, 2014, was $14,694,206.
H. VSUREF - Cash and Investments
The investments of the VSUREF consist primarily of U.S. government money market funds.
All investments are stated at fair value as reported by investment managers and reflect readily
determinable market prices. All investments are considered available for sale. Realized gains are
calculated based on the difference between the costs and selling price of the security. Cost is
determined based on the initial purchase price of each individual investment. The amount of cash and
investments held by the VSUREF at December 31, 2013 was $4,563,495.
3. ACCOUNTS AND NOTES RECEIVABLE
A. Accounts Receivable
Accounts receivable is shown net of allowance for doubtful accounts in the accompanying
Statement of Net Position.
Accounts Receivable at June 30, 2014:
Student tuition and fees $ 1,627,326
Federal, state and private grants and contracts 4,343,672
Auxiliary enterprises 199,582
Third party receivables - students 104,130
Other receivables 73,100
Gross accounts receivable 6,347,810
Less: Allowance for doubtful accounts (1,189,715)
Net accounts receivable $ 5,158,095
B. Due from Affiliates
C. Due from the Commonwealth
Due from VSUF $ 86,742

25 | P a g e
Receivables due from the Commonwealth represent reimbursements due for equipment
purchases made by the University under the Equipment Trust Fund and bond reimbursement programs.
On a reimbursement basis, the Equipment Trust Fund program provides State-supported institutions of
higher education with bond proceeds for financing the acquisition and replacement of instructional and
research equipment.
D. Notes Receivable
Notes receivable are shown net of an allowance for doubtful accounts in the accompanying
Statement of Net Position.
At June 30, 2014, notes receivable consisted of the following:
Due from the Commonwealth at June 30, 2014:
Equipment Trust Fund Reimbursement $ 348,070
21st Century Bond Reimbursement – Multipurpose Center Project 5,830,586
21st Century Bond Reimbursement – Maintenance Reserve 159,898
21st Century Bond Reimbursement – Hunter McDaniel 66,440
21st Century Bond Reimbursement – Erosion & Sediment Control 51,524
21st Century Bond Reimbursement – Lockett Hall 42,650
21st Century Bond Reimbursement – Water Storage Tank and Campus Water 18,568
21st Century Bond Reimbursement – Renovate Heating Plant 14,793
Total due from the Commonwealth $ 6,532,529

26 | P a g e
Current notes receivable:
Federal student loans 42,240$
State student loans 326
Local student loans 1,467
Less: Allowance for doubtful accounts (4,360)
Net current notes receivable 39,673
Noncurrent notes receivables:
Federal student loans 1,875,953
Local student loans 1,785
Less: Allowance for doubtful accounts (253,188)
Net noncurrent notes receivables 1,624,550
Total notes receivable 1,664,223$

27 | P a g e
4. CAPITAL ASSETS
A summary of changes in the various capital asset categories for the year ending June 30, 2014, is
presented as follows:
Beginning
Balance Increase Decrease
Ending
Balance
Nondepreciable capital assets:
Land $ 19,117,761 $ 738,472 $ - $ 19,856,233
Inexhaustible works of art and
historical treasures 119,000 - - 119,000
Construction in progress 16,434,679 15,157,130 (14,044,331) 17,547,478
Equipment in progress 595,447 - (595,447) -
Total nondepreciable capital assets 36,266,887 15,895,602 (14,639,778) 37,522,711
Depreciable capital assets:
Buildings 297,388,778 12,935,108 - 310,323,886
Equipment 36,244,366 1,531,582 (1,444,400) 36,331,548
Intangible assets - computer software 3,878,256 - - 3,878,256
Infrastructure (includes improvements
other than buildings) 16,203,642 1,135,348 - 17,338,990
Library books 20,485,473 195,061 (89,578) 20,590,956
Total depreciable capital assets 374,200,515 15,797,099 (1,533,978) 388,463,636
Less accumulated depreciation for:
Buildings 104,605,944 6,842,853 - 111,448,797
Equipment 27,791,734 1,946,155 (1,413,814) 28,324,075
Intangible assets - computer software 3,559,506 106,250 - 3,665,756
Infrastructure (includes improvements
other than buildings) 12,103,478 439,599 - 12,543,077
Library books 19,308,266 658,674 (89,578) 19,877,362
Total accumulated depreciation 167,368,928 9,993,531 (1,503,392) 175,859,067
Net depreciable capital assets 206,831,587 5,803,568 (30,586) 212,604,569
Total $ 243,098,474 $ 21,699,170 $ (14,670,364) $ 250,127,280
Net capital assets of the VSUREF consist of $542,828 for Land and $8,703,891, (net of accumulated
depreciation of $6,680,564) for buildings, land improvements, and equipment as of December 31, 2013.

28 | P a g e
5. ACCOUNTS PAYABLE AND ACCRUED LIABILITIES
Accounts payable and accrued liabilities consist of the following at June 30, 2014:
6. LONG-TERM LIABILITIES
The University’s noncurrent liabilities consist of long-term debt (further described in Note 7) and other
noncurrent liabilities. A summary of changes in noncurrent liabilities for the year ending June 30, 2014 is
presented as follows:
Beginning
Balance Additions Reductions Ending Balance Current Noncurrent
Long-term debt:
General obligation revenue
bonds $ 109,310,477 $ 3,118,360 $ (5,659,099) $ 106,769,738 $ 5,092,296 $ 101,677,442
Notes payable 8,202,117 364,148 (628,679) 7,937,586 636,126 7,301,460
Installment purchases 2,790,037 180,169 (372,813) 2,597,393 410,488 2,186,905
Total long-term debt 120,302,631 3,662,677 (6,660,591) 117,304,717 6,138,910 111,165,807
Other noncurrent liabilities:
Accrued compensated
absences 4,286,706 2,438,485 (2,316,071) 4,409,120 1,215,604 3,193,516
Federal Perkins Loan contributions
1,463,321
66,183
(25,549)
1,503,955
-
1,503,955
Software license
agreements 318,750 (106,250) 212,500 106,250 106,250
Total long-term liabilities $ 126,371,408 $ 6,167,345 $ (9,108,461) $ 123,430,292 $ 7,460,764 $ 115,969,528
7. LONG-TERM INDEBTEDNESS
A. Bonds Payable
The University’s bonds are issued pursuant to Section 9 of Article X of the Constitution of
Virginia. All of the bonds at the University are Section 9(c) bonds. These bonds are backed by the full
faith, credit and taxing power of the Commonwealth, and are issued to finance capital projects which,
when completed, will generate revenue to repay the debt.
Employee salaries, wages, and fringe benefits payable 3,950,459$
Matured interest payable 455,337
Vendor and supplier accounts payable 5,314,931
Total 9,720,727$

29 | P a g e
A summary of future principal and interest requirement of bonds payable for fiscal year as of
June 30, 2014, are as follows:
Interest Rate Maturity Total
General obligation revenue bonds:
Construct Dining Hall, Series 2006B 5.0% 2016 $ 410,000
Construct Residence Halls, Series 2006B 5.0% 2016 1,590,000
Jones Hall 96 - 2002 Ref Portion, Series 2012A 4.1% - 4.8% 2016 384,013
98 Ref of Jones Dining Hall- 2004B Ref Portion, Series 2014B 4.7% - 5.0% 2018 255,039
Construct Residence Halls, Series 2007A 4.0% - 4.7% 2018 370,000
VSU Const Residence Hall 2006B Refunded Portion, Series 2009D 5.0% 2022 4,965,000
VSU Construct Dining Hall Refunded Portion 2006B, Series 2009D 5.0% 2022 1,280,000
Constr Two Res Halls - 2007B Ref Portion, Series 2013B 4.0% - 4.4% 2025 11,231,552
Constr Dining Hall - 2006B Ref Portion, Series 2013B 4.0% - 4.2% 2026 1,431,242
Constr Residence Halls - 2006B Ref Portion, Series 2013B 4.0% - 4.2% 2026 5,541,181
Constr Res Halls - 2007A Ref Portion, Series 2013B 4.0% - 4.3% 2027 1,132,216
Construct Two Residence Halls, Series 2007B 4.4% - 4.6% 2027 9,265,000
Construct Gateway Residence Hall Phase, Series 2011A 4.2% - 4.9% 2031 31,460,000
Construct Quad Phase II, Series 2011A 4.2% - 4.9% 2031 27,470,000
Add unamortized premium 9,984,495
Total bonds payable $ 106,769,738
Aggregate annual maturities of bonds payable for fiscal years after 2014 are:
Maturity Principal Interest Total
2015 $ 5,092,296 $ 4,249,663 $ 9,341,959
2016 5,323,180 4,030,209 9,353,389
2017 5,295,990 3,800,045 9,096,035
2018 5,511,141 3,543,145 9,054,286
2019 5,549,127 3,294,840 8,843,967
2020 - 2024 31,464,553 12,566,939 44,031,492
2025 - 2029 29,333,956 5,440,028 34,773,984
2030 - 2031 9,215,000 677,000 9,892,000
Add unamortized premium (net of discount) 9,984,495 - 9,984,495
Total $ 106,769,738 $ 37,601,869 $ 144,371,607
B. New Refunded Debt
On April 16, 2014 the Treasury Board completed the sale of $64,830,000 in General Obligation
Refunding Bonds, Series 2014B. The sale of these bonds enabled the University to advance refund
$280,592 of Series 2004B VSU Jones Dining Hall 9(c) bonds.
The net proceeds of $281,591 (after payment of underwriter’s fees and other issuance costs)
were deposited into an irrevocable escrow account and will be used to pay interest, redemption premium
and maturity value of the refunded bonds to their call date. This defeasance reduced total combined debt

30 | P a g e
service payments over the next four years by $32,101 resulting in an economic gain of $31,384
discounted at the rate of 2.45 percent.
C. Notes Payable
The University entered into a loan agreement with the Department of Housing and Urban
Development (HUD) in 1989 and closed the agreement in 1992 to borrow funds to repair seven
dormitories. The loan is to be repaid over 30 years at three percent interest and is secured by a lien on
the net revenues from the ownership, operation, and use of the seven dormitories under repair. In prior
years, the University participated in the Virginia College Building Authority (VCBA) Pooled Bond
Program to fund the renovation of Rogers Stadium and the Student Village Housing Renovation Project.
At June 30, 2014, the outstanding principal balances were $1,226,586 for the HUD loan and $6,145,000
for the VCBA notes payable.
A summary of future principal and interest requirements of the VCBA notes and HUD loan
payable as of June 30, 2014, are as follows:
Interest
Rate Maturity Total
Virginia College Building Authority and HUD Notes Payable:
VSU Pooled Bonds-2002A Rogers Stadium Ref Portion, Series 2007D 2.0 - 3.9% 9/1/2019 $ 2,140,000
VSU 2002A Rogers Stadium Ref Portion, Series 2010B 2.5 - 5.0% 9/1/2022 1,320,000
VSU Roger's Stadium Project-2005 A Ref Portion, Series 2013A 1.5 - 4.7% 9/1/2024 1,215,000
VSU Student Village Housing-2005 A Ref Portion, Series 2012A 1.5 - 4.7% 9/1/2024 630,000
VSU Pooled Bonds-Roger's Stadium, Series 2005A 2.2 - 4.4% 9/1/2025 555,000
VSU Pooled Bonds-Student Village Housing, Series 2005A 2.2 - 4.4% 9/1/2025 285,000
Department of Housing and Urban Development 3.0% 2022 1,226,586
Add unamortized premium (net of discount) 566,000
Total notes payable $ 7,937,586
Aggregate annual maturities of notes payable for fiscal years after 2014 are:
Maturity Principal Interest Total
2015 $ 636,126 $ 307,991 $ 944,117
2016 660,392 281,331 941,723
2017 689,786 253,131 942,917
2018 709,314 223,891 933,205
2019 733,978 193,277 927,255
2020 - 2024 3,371,990 457,579 3,829,569
2025 - 2029 570,000 23,484 593,484
Add unamortized premium (net of discount) 566,000 - 566,000
Total $ 7,937,586 $ 1,740,684 $ 9,678,270

31 | P a g e
D. Installment Purchases
Installment purchase obligations in FY2014 consisted of the Energy Performance Leasing
Program with $1,659,722 in principal remaining, and six vehicles through the Commonwealth’s Master
Equipment Leasing Program (MELP) with $182,816 in principal remaining. In addition, the University
incurred an additional $180,169 through MELP for Phase III of the Voiceover Internet Protocol (VoIP)
telephone system bringing the grand total in principal to $754,855.
Principal and interest payment commitments as of June 30, 2014, are as follows:
Installment purchase obligations:
Interest
Rate
Maturity
Date Total
Master Equipment Leasing Program - Bus Fleet 2.0% 2017 $ 182,816
Master Equipment Leasing Program - VoIP Phone System Phase I 1.21% 2018 86,018
Master Equipment Leasing Program - VoIP Phone System Phase II 1.21% 2019 488,668
Master Equipment Leasing Program - VoIP Phone System Phase III 2.08% 2019 180,169
Energy Performance Leasing Program 1.08% 2022 1,659,722
Total installment purchase obligations $ 2,597,393
The aggregate maturity of installment purchase obligations for fiscal years after 2014 is:
Maturity Principal Interest Total
2015 $ 410,488 $ 31,418 $ 441,906
2016 416,207 25,474 441,681
2017 421,185 20,497 441,682
2018 364,050 15,614 379,664
2019 346,368 11,138 357,506
2020 - 2022 639,095 13,793 652,888
$ 2,597,393 $ 117,934 $ 2,715,327
E. Foundation Debt
The VSUREF refinanced and paid off the Series 2006 bonds and obtained $20,330,000 in
Series 2008 bonds of which $18,250,000 in principal remains at December 31, 2013. The Series 2008
bonds are collateralized by the rental property and equipment. Also, the VSUREF is required to maintain
a debt service reserve. The contractual interest rates are variable.
32 | P a g e
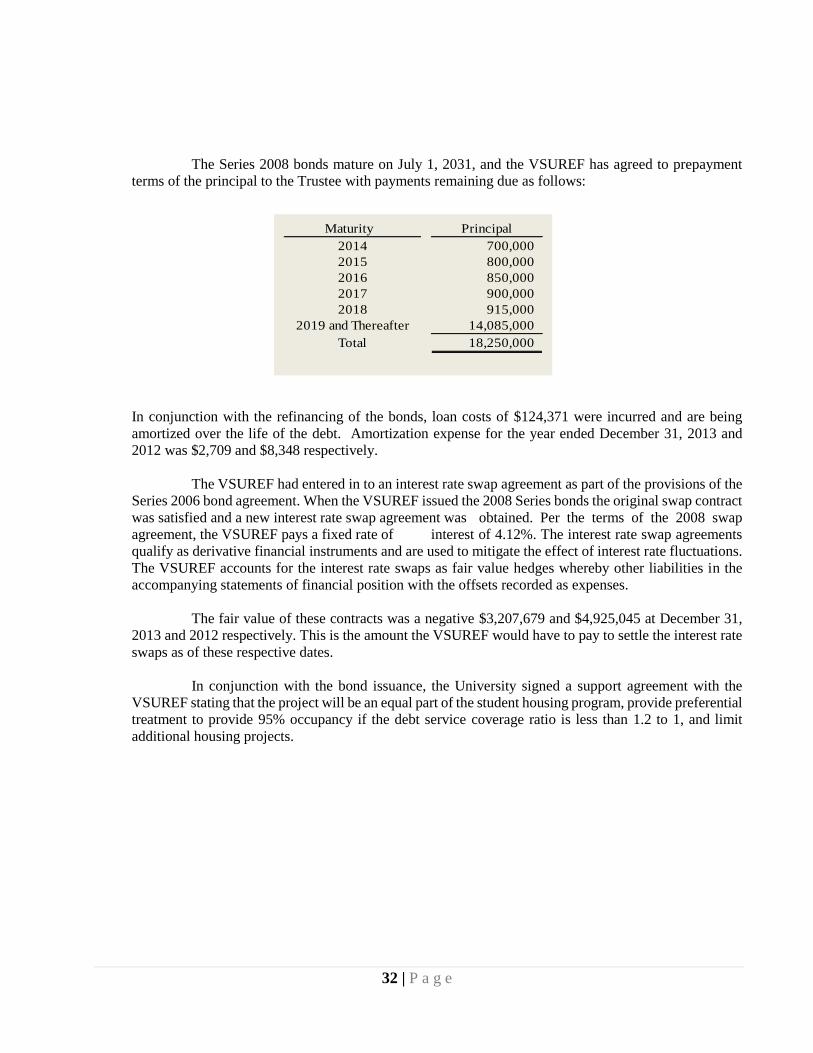
The Series 2008 bonds mature on July 1, 2031, and the VSUREF has agreed to prepayment
terms of the principal to the Trustee with payments remaining due as follows:
In conjunction with the refinancing of the bonds, loan costs of $124,371 were incurred and are being
amortized over the life of the debt. Amortization expense for the year ended December 31, 2013 and
2012 was $2,709 and $8,348 respectively.
The VSUREF had entered in to an interest rate swap agreement as part of the provisions of the
Series 2006 bond agreement. When the VSUREF issued the 2008 Series bonds the original swap contract
was satisfied and a new interest rate swap agreement was obtained. Per the terms of the 2008 swap
agreement, the VSUREF pays a fixed rate of interest of 4.12%. The interest rate swap agreements
qualify as derivative financial instruments and are used to mitigate the effect of interest rate fluctuations.
The VSUREF accounts for the interest rate swaps as fair value hedges whereby other liabilities in the
accompanying statements of financial position with the offsets recorded as expenses.
The fair value of these contracts was a negative $3,207,679 and $4,925,045 at December 31,
2013 and 2012 respectively. This is the amount the VSUREF would have to pay to settle the interest rate
swaps as of these respective dates.
In conjunction with the bond issuance, the University signed a support agreement with the
VSUREF stating that the project will be an equal part of the student housing program, provide preferential
treatment to provide 95% occupancy if the debt service coverage ratio is less than 1.2 to 1, and limit
additional housing projects.
Maturity Principal
2014 700,000
2015 800,000
2016 850,000
2017 900,000
2018 915,000
2019 and Thereafter 14,085,000
Total 18,250,000

33 | P a g e
8. STATE APPROPRIATIONS
The University receives state appropriations from the General Fund of the Commonwealth.
The Appropriations Act specifies that such unexpended appropriations shall revert, as specifically
provided by the General Assembly, at the end of a biennium.
The following is a summary of state appropriations received by the University for the
year ended June 30, 2014:
Virginia State University:
Original legislative appropriation:
Education and general programs $ 30,167,239
Higher education student financial assistance 6,263,234
Supplemental adjustments:
State grants and scholarships 140,449
VIVA interlibrary loan allocation 4,188
SPCC rebate and interest earnings 26,008
FY13 reappropriation/cash transfer-in 1,524,667
Out-of-state student debt service (845,856)
VCBA debt service appropriations (108,886)
Year-end cash reversion (2,294,962)
FY14 transfer out (464,000)
34,412,081
Cooperative Extension and Agricultural Research Services:
Original legislative appropriation:
Education and general programs 5,313,900
Supplemental adjustments:
Specialty Crop Funding 50,000
FY13 reappropriation/cash transfer-in 237,763
Year-end cash reversion (66,340)
5,535,323
Total state appropriations $ 39,947,404

34 | P a g e
9. EXPENSES BY NATURAL CLASSIFICATION
The following table shows a classification of expenses both by function, as listed in the
Statement of Revenues, Expenses, and Changes in Net Position and by natural classification, which is the
basis for amounts shown in the Statement of Cash Flows.
Salaries
and Wages
Fringe
Benefits
Services and
Supplies
Scholarships and
Fellowships Utilities Depreciation Total
Instruction
$22,479,32
4
$6,844,394
$8,345,064
$194,844
$166,067
$38,029,693
Research
3,345,912
903,358
2,136,508
141,508
130,221
6,657,507
Public Service
3,533,039
968,231
2,317,523
170,456
137,919
7,127,168
Academic Support
3,740,187
1,091,924
1,736,638
97,693
43,681
6,710,123
Student Services
2,933,964
1,013,647
1,349,481
8,840
49,182
5,355,114
Institutional Support
10,230,516
3,857,168
1,135,203
16,610
434,957
15,674,454
Operation and Maintenance of Plant
786,829
409,311
6,299,144
3,845,882
11,341,166
Scholarships and
Fellowships
3,270,558
3,270,558
Depreciation
9,993,530
9,993,530
Auxiliary Enterprises
5,041,564
1,605,786
17,888,788
2,592,221
2,670,152
29,798,511
Other
43,701
43,701
Total
$52,091,33
5
$16,693,819
$41,252,050
$6,492,730
$7,478,061
$9,993,530
$134,001,525
10. COMMITMENTS
A. Construction Commitments
As of June 30, 2014, the University was a party to construction contracts totaling $120,496,357
of which $55,336,240 was still outstanding, at June 30, 2014.
B. Operating Leases
In FY12, Virginia State University entered into two operating lease agreements. The
University is leasing office space from the Cameron Building, LLC for administrative operations. The
initial terms of this lease is ten years beginning August 15, 2012 through August 14, 2022. Rent payments
for this lease were $274,547 in FY2014.

35 | P a g e
The second lease is with Midway Avenue, LLC which is being used for storage. Rent payments
for FY2014 were $52,788. In FY2014 this lease was renewed for an additional three years ending July
31, 2017 at a renegotiated monthly rent of $2,250, down from $4,399 per month in prior years.
The schedule of combined future rental payments is as follows:
2015 $ 287,065
2016 292,266
2017 297,572
2018 275,983
2019 281,503
2020-2022 878,742
Total $ 2,313,131
11. RETIREMENT PLANS
A. Virginia Retirement System
Employees of the University are employees of the Commonwealth of Virginia. Substantially
all full-time classified salaried employees of the University participate in a defined benefit retirement
plan administered by the Virginia Retirement System (VRS). VRS is an agent multiple-employer Public
Employee Retirement System (PERS) that acts as a common investment and administrative agency for
the Commonwealth of Virginia and its political subdivisions.
The VRS does not measure assets and pension benefit obligations separately for individual
State institutions. Therefore, all information relating to this plan is available at the statewide level in the
Commonwealth’s Comprehensive Annual Financial Report. The Commonwealth, not the University, has
the overall responsibility for contributions to this plan. The CAFR discloses the unfunded pension benefit
obligation at June 30, 2014, as well as the ten-year historical trend information showing VRS’s progress
in accumulating sufficient assets to pay benefits when due.
As of June 25, 2011, employees are required to make a 5 percent contribution that was
previously part of the employer’s retirement contributions. The University's total VRS contributions were
$3,327,327 for the year ended June 30, 2014, which does not include the 5 percent employee contribution.
The employer contributions represent 8.6 percent of eligible payroll total of $38,710,563 for the year
ended June 30, 2014. The University's total payroll costs for the year ended was $52,091,335.
B. Optional Retirement Plans
Full-time faculty and certain administrative staff may participate in one of two other retirement
plans: 1) Fidelity Investments Institutional Services and 2) Teacher Insurance and Annuity
Association/College Retirement Equity Fund. These are fixed-contribution programs where the
retirement benefits received are based upon the net of employer and employee contributions, plus interest
and dividends. Individual contracts issued under these plans provide full and immediate vesting of both
the University and the participants’ contributions.
For employees who became members of the respective plans prior to July 1, 2010, there is an
employer required contribution of 10.4 percent. Annual pension costs under these plans totaled $738,866
36 | P a g e
for the year ended June 30, 2014. Contributions to these retirement programs were calculated using the
base salary amount of $7,104,481.
For employees who became members of the respective plans on or after July 1, 2010, there is
an employer required contribution of 8.5 percent and an employee required contribution of 5 percent.
Annual pension costs under these plans totaled $157,217 for the year ended June 30, 2014. Contributions
to these retirement programs were calculated using the base salary amount of $1,849,612.
C. Deferred Compensation
University employees may also voluntarily participate in the Commonwealth’s Deferred
Compensation Plan. Participating employees can contribute to the plan each pay period with the
Commonwealth matching up to $20 per pay period. The matched dollar amount can change depending
on the funding available in the Commonwealth’s budget. The Deferred Compensation Plan is a
qualified defined contribution plan under section 401(a) of the Internal Revenue Code. The University
expense for contributions under the Deferred Compensation Plan, which is an amount assessed by the
Commonwealth, was $188,994 for FY2014.
12. POST-EMPLOYMENT BENEFITS
The Commonwealth participates in the VRS administered statewide group life insurance
programs, which provides post-employment life insurance benefits to eligible retired and terminated
employees. The Commonwealth also provides health care credits against the monthly health insurance
premiums for its retirees who have at least 15 years of state service and participate in the State’s health
plan. Information relating to these plans is available at the statewide level in the Commonwealth of
Virginia’s CAFR.
The University in compliance with GASB Statement No. 47 – Accounting for Termination
Benefits did not have any voluntary termination benefits and/or involuntary termination benefit
liabilities outstanding as of June 30, 2014 that was recognized in accordance with this statement.
13. CONTINGENCIES
On July 29, 2014 the University received a proposed penalty notice from the Internal Revenue
Service (IRS) in the amount of $317,760 for the late filing of 5,394 information returns for the 2011
calendar year. The University has received several notices from the IRS stating that our appeal for the
late filing of the 2011 information returns is under review. However to date, the University has not
received a final decision on this proposed penalty.
14. RISK MANAGEMENT
The University is exposed to various risks of loss related to torts; theft, or damage to and
destruction of assets; errors, and omissions; non-performance of duty, injuries to employees; and
natural disasters. The University participates in insurance plans maintained by the Commonwealth of
Virginia. The State employee health care and worker’s compensation plans are administered by the
Department of Human Resource Management and the risk management insurance plans are
administered by the Department of Treasury, Division of Risk Management. Risk management
insurance includes property, general liability, medical malpractice, faithful performance of duty bond,
automobile, and air and watercraft plans. The University pays premiums to each of these departments
for its insurance coverage. Information relating to the Commonwealth’s insurance plans is available at
the statewide level in the CAFR.

37 | P a g e
15. SUBSEQUENT EVENTS
Land Transferred to and Accounts Receivable from the VSU Trojan Development
Company, LLC:
Pursuant to a Board of Visitors (BOV) resolution signed and dated April 29, 2014, the Virginia
State University Foundation (VSUF) and the Virginia State University Real Estate Foundation
(VSUREF) collectively had previously created a joint venture entity known as the VSU Trojan
Development Company, LLC, also known as the “Trojan Development Company”. The purpose of this
entity is to develop mixed use retail, commercial and residential development along Chesterfield
Avenue adjacent to the University. In pursuit of this development and in concert with the Ettrick
economic development plan of Chesterfield County, this BOV resolution deemed it to be in the best
interest of the University to authorize the conveyance of 11 parcels comprising the Chesterfield Avenue
Property to the Trojan Development Company in consideration of the sum of $328,000 representing
the 2014 appraised value of said property. Pursuant to the land conveyance, the properties were
recorded in the name of the Trojan LLC on January 30, 2015.
These properties were conveyed and “sold” for the land value of each parcel. However, the
University’s acquisition cost of the properties was based on the parcels with existing houses and other
structures and included closing, demolition, maintenance and other miscellaneous costs exceeding $1.6
million. This will result in a write down of land on the University’s books of approximately $1.3 million
in FY 2015. Also, a receivable will be recorded for $328,000 in FY15. The receivable is to be paid by
the Trojan Development Company to the University upon their settlement of financing for the purpose
of development and construction of the property. If the Trojan Development Company fails to settle
the financing for the project and make the receivable payment in full by October 31, 2016, all right,
title and interest in the property, including any improvements, will immediately terminate and
automatically revert back to the University.
University Interim President Appointed in January, 2015:
Dr. Pamela V. Hammond became Virginia State University's interim president in January,
2015. Since that time, she has made it a top priority to establish VSU as a catalyst for innovation in
higher education. “Virginia State University has a remarkable history and a compelling story,” said Dr.
Hammond in her introduction. “We must communicate our message with clarity and consistency. We
will communicate with our constituencies at each step. We cannot expect buy-in of our plan from our
community if we do not offer input into that plan.”
Prior to VSU, Dr. Hammond served as Provost, as well as the dean of the School of Nursing at
Hampton University. In her role as Provost, Dr. Hammond played an integral role in the transformation
of academic affairs including the creation of a new faculty mentorship program and the establishment
of a new online educational enterprise, Hampton U Online. As dean, Dr. Hammond increased student
enrollment by 60% and assumed major responsibilities for the research, development, and
grantsmanship activities that directly impacted faculty productivity. She is an astute fundraiser and was
involved in securing over $12 million for the School of Nursing. Hampton University implemented the
first PhD program in nursing at a historically black college or university as the result of Dr. Hammond’s
efforts.

38 | P a g e
Virginia State University Research Foundation:
During fiscal year 2015, the Virginia State University Research Foundation (VSURF)
commenced operations, and thus will be included as a component unit in the University’s financial
statements. The Foundation, like the University, operates on a June 30th year end, and the same twelve
months of financial information will be reported by both entities each fiscal year. The purpose of the
VSURF is to support the University’s objectives for research, public service, economic and
technological development. As a representative of the University, VSURF exemplifies the same spirit
of entrepreneurship and focuses on the applications of engineering, science and technology to develop
new ideas, methods and opportunities. In its capacity, the Foundation will provide several services
related to Intellectual Property management, Technology Transfer and Commercialization, and the
Office of Sponsored Research & Programs.
Reginald F. Lewis College of Business Foundation:
The Reginald F. Lewis College of Business Foundation (RFLCBF) began operations, during
the University’s 2015 fiscal year. Therefore, the Foundation’s financial data will be included as a
component unit in the University’s financial statements. Although the Foundation functions on a
calendar year end, the financial data will be reported with the University’s data at June 30th of each
year. Similar in the mission of most foundations, the RFLCBF is committed to the objective of
benefiting and supporting the Virginia State University’s Reginald F. Lewis College of Business. It is
organized exclusively for charitable, education and scientific purposes, to be precise. In addition, the
RFLCBF is established to further stimulate voluntary financial support for the Reginald F. Lewis
College of Business at the University.

39 | P a g e
This page intentionally left blank

40 | P a g e

41 | P a g e

42 | P a g e

43 | P a g e
Rector
Vice Rector
Secretary

44 | P a g e
President
Vice President for Academic Affairs
Vice President for Administration and Finance
Vice President of Student Affairs
