vinyl chloride production-powerpoint
TRANSCRIPT

Vinyl Chloride ProductionSenior Design Presentation
Group 10Jeremy Dry Israel OsisanyaBryce Lawson Deepa PatelPhuong Le Anecia Shelton

Project Purpose
To design an environmentally safe vinyl chloride production plant.
Questions:What is Vinyl Chloride?How its being produced?How much does it cost to be environmentally friendly?

Vinyl Chloride
99% of VCM is used to manufacture polyvinyl chloride (PVC).
PVC consumption is second to low density polyethylene.
VCM production results in a number of unwanted by-products.

Dow-TX9Formosa-TX6Oxyvinyls-L-TX3
Dow-LA8Westlake Monomers-KY5Oxyvinyls-D-TX2
Borden-LA7Georgia Gulf-LA4Formosa-LA1
VCM Plant Emissions in the United States
0
0.0001
0.0002
0.0003
0.0004
0.0005
0.0006
0.0007
0.0008
1 2 3 4 5 6 7 8 9
lb/lb
VC
M p
rodu
ct

Manufacturing Methods
Vinyl Chloride from AcetyleneVinyl Chloride from Ethane Vinyl Chloride from Ethylene (Direct Route)Vinyl Chloride from Ethylene (EDC)

Direct chlorination CH2CH2 + Cl2 → ClCH2CH2Cl (EDC)
Oxychlorination CH2CH2 + 2 HCl + ½ O2 → EDC+ H2O
EDC pyrolysis 2 EDC → 2 CH2CHCl (VCM) + 2 HCl
Overall reaction 2 CH2CH2 + Cl2 + ½ O2 → 2 CH2CHCl + H2O
Balanced Process for Vinyl Chloride Production
•No generation of HCl
•95% of the world’s VCM is produced utilizing the balanced process

Heavy ends
Oxy-chlorination
Directchlorination
EDC purification
EDCpyrolysis
VCMpurification
HCl recycle
Air or O2
Ethylene
Cl2
Light ends
EDC recycle
VCM
Balanced Process for Vinyl Chloride Production

Direct Chlorination and Oxychlorination P&ID
DC REACTOROXY REACTOR
CAUSTIC SCRUBBERS

Vinyl Chloride Plant Reactor Design
•Theoretical reactor design equations
•Literature kinetic data used to calculated rate constants
•Numerical Integration used to calculated specified parameters

Reactor Design
4
2t
kk dw
dzdF π
=
Fk = molar flow ratez = tube length
dt = tube diameterwk = νiri
ri = kf[Ck]-kr[Ck]

Oxychlorination Chemistry
CuO + 2HCl → CuCl2 + H2O CuCl2regenerationR-5
2CuCl + 0.5O2→ CuO-CuCl2→ CuO + CuCl2CuCl
oxidationR-4
C2H4 + 3O2→ 2CO2 + 2H2OC2H4
combustionR-3
C2H4 + 3CuCl2→ C2H4Cl3 + 3CuCl +0.5H2TCE
formationR-2
C2H4 + 2CuCl2→ C2H4Cl2 + 2CuClDCE formationR-1
StoichiometryReactionSet
•Plus nine other main by product formation reactions•Excel Reactor Model of Oxychlorination

Oxy Reactor Effluent Flow Rates (lb-mol/hr)
0.10Dichloromethane0.13Acetylene0.09Vinyl Acetylene0.015HCl0.10Chloroprene2.76Oxygen0.11Chloroethane5.5Ethylene0.11Chloroform140CO2
0.12Methyl Chloride1.26TEC1.25CCl41341Water
0.25Chloral1341EDC
Oxychlorination Reactor Results

Oxychlorination Reactor Parameters
0.05Residence Time (hr)1320Tube Length (ft)
2Tube Diameter (in)461Reactor Volume (ft3)58Reactor Pressure (psig)
305Reactor Temperature (oC)

DC Reactor Modeling Results
99.4%99.8%Selectivity to EDC
99.94%99.93%Conversion of ethylene
Literature Values
Modeling Results
0.018Residence Time (hr)115Tube Length (ft)2Tube Diameter (in)90Reactor Volume (ft3)15Reactor Pressure (psig)
120Reactor Temperature (oC)
DC Reactor ParametersDC Reactor Kinetic Results

EDC Purification P&ID
WATER WASHLIGHTS COLUMNHEAVIES COLUMN
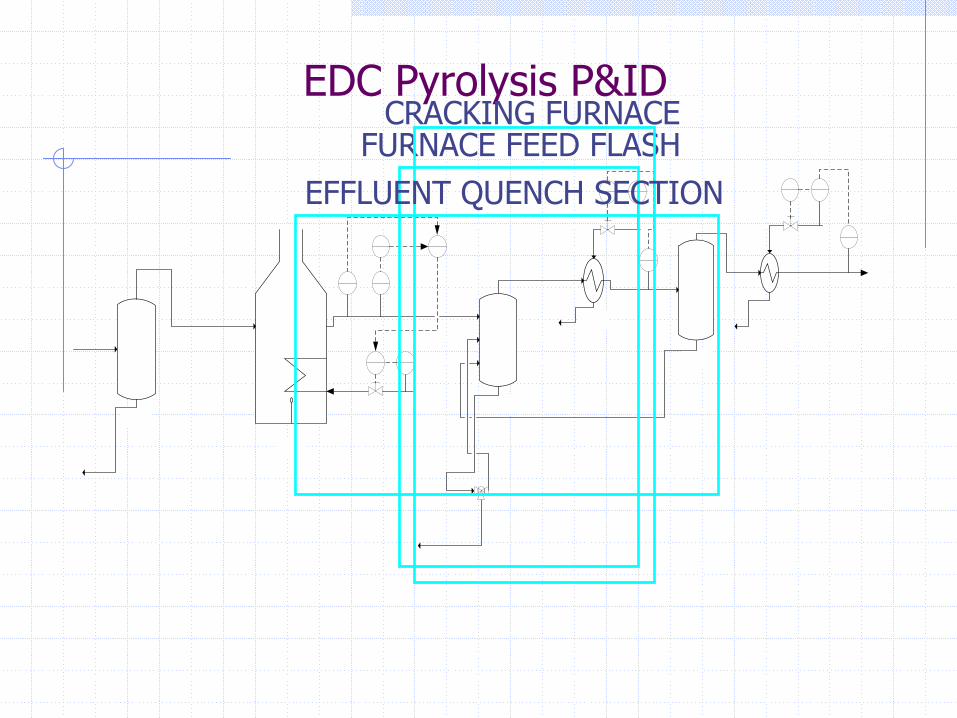
EDC Pyrolysis P&IDFURNACE FEED FLASH
CRACKING FURNACE
EFFLUENT QUENCH SECTION

EDC Pyrolysis Reactor Modeling Results
•Conversion of EDC per pass is maintained at 50-55%
•Increasing cracking severity beyond this level results in insignificant increase in conversion and a decrease in selectivity to VCM.
•Conversion can be increased by the addition of CCl4
•Modeling results produced conversion equal to 60%
•Major by products of EDC pyrolysis: Acetylene, benzene, 1-3 butadiene, vinyl acetylene, chloroprene.

VCM Purification P&ID
FEED FLASH
HCl COLUMNVCM COLUMN

LiquidLiquid
SC1
SC2
E1F2
M5F3
M6
2
3
4
5
6
7
8
9
10
11
12
13
14
15
16
1
17T1
M7
234567891011121314151617181920212223242526272829
1
30T2
E2 F4
M8 F5
E3
F6
E4 F7
234567891011121314151617181920212223242526272829303132333435363738394041
1
42T3
2
3
4
5
6
7
8
9
10
11
12
13
14
15
16
17
18
19
1
20T4
SP3
R1
M1
F1
OP1
S11
S12
S22
S23
S24
S25
S26
S27
S28
S29
S30
S31
S33
S34
S35
S36
S38
S39
S40
S41
S42
S43
S44
S45
S48
S49
S50
S51
S52
S53
S54 S55
S56
S57
S58
S59
S60
S61
S62
S63
S64
S1
S2
S3
S4
S5
S6
Pro II Simulation PFD

Heat Integration
Pinch Design MethodOptimization method that reduces energy costUtilizes process to process heat transferOptimal pinch temperature→ 316oF

Grand Composite Curve
0
100
200
300
400
500
600
700
800
900
1000
0 50 100 150 200 250 300 350Duty (MMBtu/hr)
Tem
pera
ture
(F)
Pocket of Heat Recovery
Heat Integration
QHmin
QCmin

Hot Utility 401→ 308 MM Btu/hrCold Utility 251→ 158 MM Btu/hr
Energy Reduction Results in a savings of $2.4 Million/year!
Heat Integration Results

Waste Stream Treatment

Location of Waste Streams
EDC Purification/Pyrolysis
Oxychlorination Reaction Section
Direct Chloriantion Caustic Scrubber
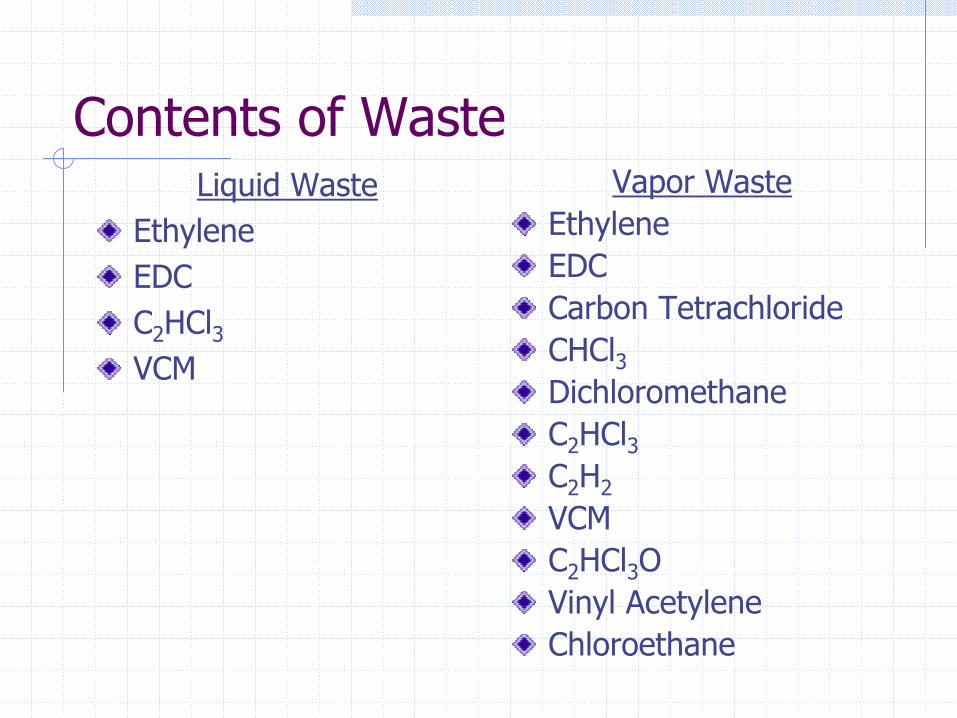
Contents of WasteLiquid Waste
EthyleneEDCC2HCl3VCM
Vapor WasteEthyleneEDCCarbon TetrachlorideCHCl3DichloromethaneC2HCl3C2H2
VCMC2HCl3OVinyl AcetyleneChloroethane
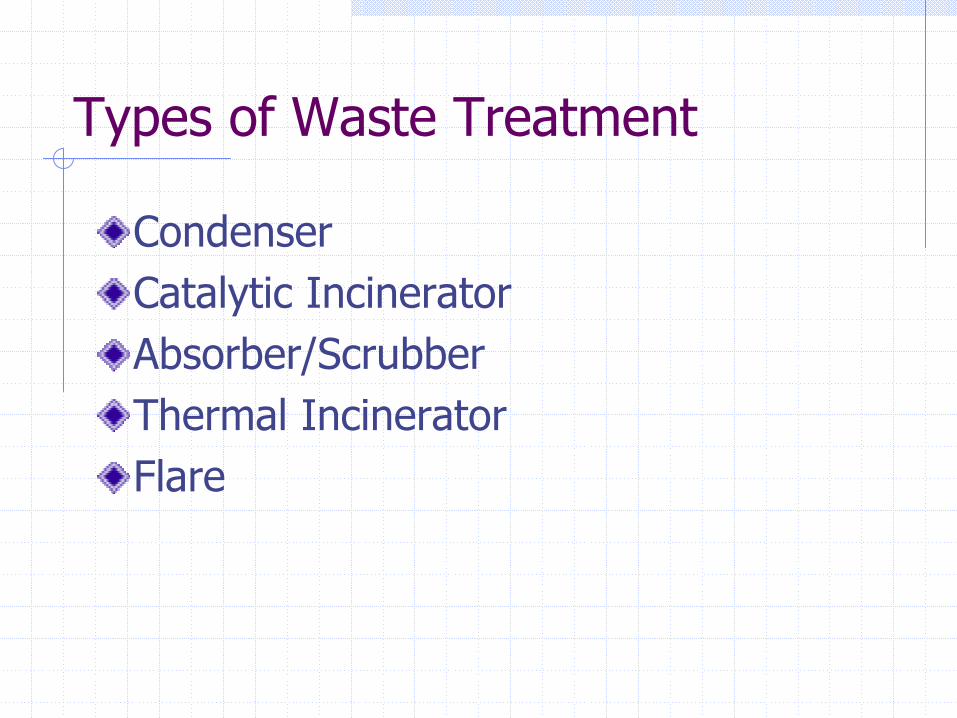
Types of Waste Treatment
CondenserCatalytic IncineratorAbsorber/ScrubberThermal IncineratorFlare

Waste Treatment Selected
Multiple Treatment Process Selected
Consists of thermal incineration, absorption column, and caustic scrubbing unit

Treatment PFD
Incinerator
Abs
orpt
ion
Cau
stic
Sc
rubb
ing
Liquid Waste
Vapor Waste
Water + HCl Water + NaCl + NaOCl
Water NaOH
CO2, NOx
CO2, NOx
Cl2, H2O, HCl
Cl2
CO2, NOx

Products of Waste Treatment
Water and HCl (solution)Water, NaCl, and Sodium Hypochlorite(solution)Carbon Dioxide and Nitrous Oxides

Incineration Unit DesignAuxiliary Fuel Flowrate Needed (Qf)
Qf = Qw (X/Y) where,X = 1.1Cpo(Tc – Tr) – Cpi(Ti – Tr) – hw
Y = hf – 1.1Cpo(Tc-Tr)
Qf = 331 lb/hr

Absorption Column DesignAmount of Solvent (Water)
L = G*(Yi – Yo)/(Xo – Xi)
L = 154,000 lbs/hrColumn Diameter (Dt)
Dt = 5.7 ft
vdf
vT AAfU
VMDρπ )/1(
4−
=

Absorption Column Design Cont’dNumber of Theoretical Stages (NOG)
NOG = 20
Overall Height of a Transfer Unit (HOG)HOG = G/KyaS
HOG = .75
AAAKXYKXYAAN iOii
OG /)1()}/1()]/()][(/)1ln{[(
−+−−−
=

Absorption Column Design Cont’d
Packing HeightHpack = NOG*(HOG)
Hpack = 15 ft

Caustic Scrubbing Design
DesignL = 45,000 lbs/hrDT = 4.5 ftNOG = 12HOG = .83Hpack = 10 ft

Waste Water Treatment

Waste Water Streams
180-CCl4170-TCE
680-EDC26-Chloral200-HCl
048NaCl41,000280Water
Water Wash Drum (L/hr)
DC Caustic Scrubber(L/hr)

Limits and Treatment Options
-Incineration -GAC.005TCE
-GAC –Fluidized Bed Incineration.005CCl4
-GAC –Boiling .005EDC
–Incinerator w/Afterburner –GAC1Chloral–GAC 5HCl
Treatment OptionsEPA Limit (mg/L)

Granular Activated CarbonEPA Recommended Control TechnologyAbility to remove > 99% of contaminantsSimple design and operationNo hazardous waste byproductsAbility to operate at low temperatures and pressures

GAC OperationMakeup Carbon In
Effluent
Water Flow
Carbon Movement
Influent
Carbon Column

Column Specifications
19 daysEquilibrium Saturation
27 minContact Time
7 ft/minVelocity
36 ft2Adsorber Area
170 ft3Adsorber Volume
21000 lbCarbon Mass

Carbon RegenerationCarbon In Gas Out
200-300oF
300-450oF
400-1000oF
1000-1600oF
1600-1800oF
1600-1800oF
Rabble Arm
Rabble Teeth
Carbon Out

HAZOP Studies- Safety Concern
Purpose: Reduce risk at workplaceIdentify risks, prevent and reduce impactSubdivide into small sectionsDeviations, Causes, Consequences, Safe Guard and Actions

PFTR Reactor

Corpus Christi, TX
Taft, LA
Location Factors
Raw MaterialsDistanceAbundance
Total TaxCorporate Income TaxSales TaxProperty Tax
WagesUtilitiesLand Cost
Plant Location

Factor Rating Maximization
$640/acre$2.5/MMBtu
1.0340%
217 miles
TX
$1270/acre$2.7/MMBtu
0.9532%
43 miles
LA
5Land Cost8Utilities12Wages20Total Tax25 Abundance30Distance
Raw MaterialWeight %Factor
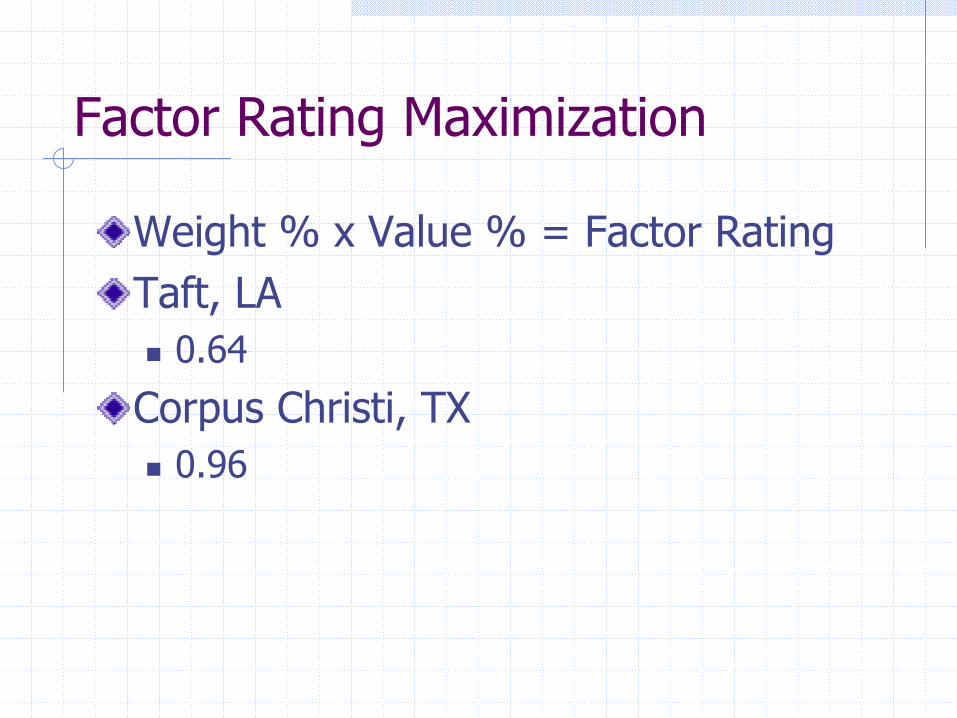
Factor Rating Maximization
Weight % x Value % = Factor RatingTaft, LA
0.64
Corpus Christi, TX0.96

Plant Capacity
Forecasting
Economic Analysis4.09 billion lb/yr
Risk & Probability Analysis
Economic Analysis6.44 billion lb/yr
Economic Analysis10.5 billion lb/yr
Decision

Forecasting
Prices of Chlorine vs. Year
y = 2.112x - 4017.7R2 = 0.9548
140
160
180
200
220
1975 1980 1985 1990 1995 2000 2005Year
Pric
es o
f Chl
orin
e ($
/ton)
Find Mean Value & Std. DevApply to Monte Carlo Simulation

ForecastingYear Ethylene Chlorine Oxygen VCM
($/ton) ($/ton) ($/ft3) ($/ton)2004 492.5 212.2 0.001445 499.22005 499.4 214.1 0.001436 506.22006 506.2 216.1 0.001427 513.22007 513.1 218.0 0.001418 520.22008 519.9 219.9 0.001409 527.22009 526.7 221.8 0.001400 529.22010 533.6 223.8 0.001391 535.22011 540.4 225.7 0.001382 543.21
Std. Dev. 24.17 10.56 0.000102 26.15

NPW & ROI
( ) ( )TCI
iIVCF
iCF
NPW nWSn
n
kk
k −+
+++
+= ∑
−
= 11
1
1
WhereTCI= total capital investmentCF = cash flowi = interest rate = 0.05Vs = savage valueIw = working capital
1(1 ) ( )(1 )
nk n
k s wk
TCI CF r V I r− −
=
= + + + +∑

Economic Analysis
0.200.250.24ROI
$161,759,000$284,828,000$133,739,000NPW
$77,154,000$68,886,000$47,110,000TCI
10.5 billion lb/yr
6.44 billion lb/yr
4.09 billion lb/yr
Plant Capacity

Risk Analysis
Monte-Carlo simulation• Mean and Standard Deviation• Random Number Generation• NPW• Risk Measurement• Probability
Decision: Plant CapacityDetailed Economic Analysis

Monte Carlo
Assume normal distribution
Perform random walks Norminv(Rand(), Mean, Std. Dev.)
Stop the iterations when the data converges
Approximately 1000 trials
Reduce error compared to analytical approach

Procedure
Random NumberGeneration
Raw material Cost
Total ProductCost
Income from selling VCM Gross Income
Net ProfitNet Present Worth
Risk &Probability
Cash Flow

0
0.1
0.2
0.3
0.4
0.5
0.6
0.7
0.8
0.9
1
-6000 -4000 -2000 0 2000 4000 6000
Net Present Worth ($106)
Cum
mul
ativ
ePr
obab
ility
6.44 billion lb/yr 4.09 billion lb/yr 10.5 billion lb/yr
Project Risk Curves

Comments
Capacity of 4.09 billion lb/yr: 41.7% chance of negative NPW
Capacity of 6.44 billion lb/yr: 31.5% chance of negative NPW
Capacity of 10.5 billion lb/yr: 36.8% chance of negative NPW

0
0.05
0.1
0.15
0.2
0.25
0.3
0.35
-4500 -3000 -1500 0 1500 3000
NPW ($106)
Prob
abili
ty
6.44 billion lb/yr 4.09 billion lb/yr 10.5 billion lb/yr
Probability vs. Net Present Worth
Highest Probability of positive NPW
Decision
Plant Capacity of 6.44 billion lb/yr:
• Highest NPW
• Highest ROI
• Lowest risk: 31.5 % of losing money
• High probability of making money

Detailed Economic Analysis
Plant Capacity: 6.44 billion lb/yr
Plant Equipment:Four Heat ExchangersFour Distillation TowersSeven Flash TanksThree ReactorsAdsorption SystemIncineration Unit
Total Equipment Cost: $15.3M

Total Equipment Cost $15,284,100Variables Description Cost ($)
Equipment Installed 47% of TEC (P&T) 7,183,527Incineration Unit (install) Flow Rate Correlation 10,500
Instrumentation & Control 18% of TEC (P&T) 2,751,138Piping (installed) 50% of TEC (P&T) 7,642,050
Electrical (installed) 11% of TEC (P&T) 1,681,251Total 19,268,466
Building CostOffice $45/ft2 (Brick Building) in 3000 ft2 135,000
Process Building (5-Unit) $15/ ft2 (Steel Building)in 4600 ft2/Unit 375,000Service Building $45/ ft2 (Brick Building) in 2000 ft2 90,000Storage Building $15/ ft2 (Steel Building)in 4000 ft2/Unit 62,500
Maintenance Unit/Shop $45/ ft2 (Brick Building) in 1500 ft2 67,500Administration/Accounting $45/ ft2 (Brick Building) in 2500 ft2 112,500
Environment/Research $45/ ft2 (Brick Building) in 3000 ft2 135,000Total 977,500
Yard ImprovementSite Cleaning $4400/acre (total of 50 acres) 220,000
Grading $465/acre (total of 10 acres) 4,650Fencing $9/ft (total of 9000 ft) 81,000
Walkways $4.50/ ft2 (total of 5000 ft2) 22,500Total 328,150
Land Cost $1270/acre (total of 50 acres) 63,500Total Direct Plant Cost 35,921,716
Engineering & Supervision 32% of TEC (P&T) 4,890,912Construction Expenses 41% of TEC (P&T) 6,266,481
Contractor's Fee 21% of TEC (P&T) 3,209,661Contingency 42% of TEC (P&T) 6,419,322
Total Indirect Cost 20,786,376Fixed Capital Investment Direct+Indirect 56,708,092
Working Capital 86% of TEC (P&T) 13,144,326Total Capital Investment Direct+Indirect+Working Capital 69,852,418
Total Capital Investment

Employee # of Employee $/yr TotalPlant Chairman 1 $105,000 $105,000ManagersPlant Manager 1 $80,000 $80,000Unit Managers 5 $73,000 $365,000Operational EngineersComputer Programmer 1 $62,890 $62,890Computer Engineer 2 $74,310 $148,620Chemical Engineers 5 $72,780 $363,900Process Engineers 5 $73,000 $365,000Electrical Engineers 3 $68,630 $205,890Environment Engineers 3 $62,000 $186,000Industrial Engineers 3 $61,900 $185,700Mechinical Engineers 2 $63,500 $127,000Maintainance Engineers 2 $30,000 $60,000Operator 30 $68,000 $2,040,000Supervisor 5 $70,000 $350,000AdministrationFinancial Manager 1 $60,000 $60,000Production Manager 1 $68,000 $68,000Sales Manager 1 $60,000 $60,000AccountingBudget Analysts 2 $53,000 $106,000Finantial Analysts 1 $62,000 $62,000Tax Preparers 2 $33,000 $66,000Auditor 2 $35,000 $70,000Total $5,137,000

Economic Summary
Total Product Cost-$1.59 billion
Net Profit- $26.2 million
NPW- $265 million
ROI-23.7%

Environmental Impact vs. Profit

Waste Reduction Algorithm
Evaluate effects of design changes on environmentReactors can not be varied
Exothermic reactions allow heat integration
Variable design parametersOxygen usageFurnace temperature

Impact Calculations
Impact/hrIi = ΣMj x ΣxkjΨk
Mj = mass flow rate of stream jxkj = mass fraction of chemical k in stream j-Ψk = characteristic potential impact of chemical k

165000
170000
175000
180000
185000
190000
-30 -20 -10 0 10 20 30
Profit (Million $)
EI (
lb /
Hr)
Original Furnace Temperature Lower Furnace Temperature Higher Furnace Temperature
Environmental Impact vs. Profit
All AirOxygen incineratorOxygen
furnace
Oxygen furnace, incineratorOxygen hot utility,
furnaceAll Oxygen
Oxygen hot utility, incinerator

Sequestering CO2 Emissions
Enhanced oil recovery Brine aquifers injectionLocated beneath shale layer3100 ftFCI is a function of CO2 flow rate
27.753 $/(kg/hr) = $11.4 million
OC is a function of CO2 flow rate and depth0.0000912 $/(kg/hr)(ft) = $183,000/yr

0.0000
0.0001
0.0002
0.0003
0.0004
0.0005
0.0006
0.0007
0.0008
1 2 3 4 5 6 7 8 9 10
lb/lb
VC
M p
rodu
ct
Dow-TX10Formosa-TX7Oxyvinyls-L-TX4
Dow-LA9Westlake Monomers-KY6Oxyvinyls-D-TX3
Borden-LA8Georgia Gulf-LA5Formosa-LA2
VCM Plant Emissions in the United States
Capital Investment to achieve this emission reduction = $2.5 MillionDecreased Net Profit = $1.3 Million/year

Conclusion
Balanced ProcessIncineration and Carbon Adsorption6.4 billion lbs/yearTaft, LASequestration of CO2