vinton feasibility study - cityofvinton.org
TRANSCRIPT
Vinton Municipal Electric Utility
Fiber-to-the-Premise (FTTP) Feasibility
Study
Tom Richtsmeier, GM
Vinton Municipal Electric Utility
110 West 3rd street
Vinton, IA 52349
David Fridley, Partner
FARR Technologies
(605) 999-1176
Dean Uher, Director Regulatory Affairs
FARR Technologies
(605) 630-3577
Presented to:
Presented by:
Page 2 of 59
Table of Contents 1) INTRODUCTION ............................................................................................................................... 3
2) EXECUTIVE SUMMARY .................................................................................................................... 3
3) MARKET / COMPETITION ................................................................................................................ 5
a) Overview...................................................................................................................................... 5
b) Market Approach ........................................................................................................................ 6
c) Keys to Success .......................................................................................................................... 7
4) SERVICE OFFERINGS ...................................................................................................................... 7
a) Broadband .................................................................................................................................. 7
b) Voice Service ............................................................................................................................... 7
c) Video Services............................................................................................................................. 9
5) PROPOSED NETWORK DESIGN ................................................................................................... 11
a) Overview................................................................................................................................... 11
b) FTTH Technical Description ..................................................................................................... 12
c) Alternative Design Options: ...................................................................................................... 15
d) Fiber Connectivity .................................................................................................................... 17
e) FTTH Electronics Design .......................................................................................................... 18
f) Smart Meter / Smart Grid ........................................................................................................ 20
6) FINANCIAL PRO FORMA ............................................................................................................... 21
a) Overview................................................................................................................................... 21
b) Capital Investment / Assets ..................................................................................................... 23
c) Project Funding ........................................................................................................................ 23
d) Financing Alternatives.............................................................................................................. 24
e) Revenues ................................................................................................................................. 26
f) Expenses .................................................................................................................................. 30
g) Operational Strategy ................................................................................................................ 32
i) Contract Service Providers ....................................................................................................... 32
7) ORGANIZATIONAL STRUCTURE .................................................................................................... 33
a) Communications Subsidiary .................................................................................................... 33
8) RECOMMENDATIONS ................................................................................................................... 33
APPENDICES ........................................................................................................................................ 34
APPENDIX A – Fiber Access Impact on Home Values .......................................................................... 35
APPENDIX B – Maps & Diagrams ........................................................................................................ 36
APPENDIX C – Pro Forma Financials ................................................................................................... 39
APPENDIX D – Sample Channel Lineup .............................................................................................. 57
APPENDIX E – Acronyms / Terms ........................................................................................................ 58
APPENDIX F – Potential Service Providers / Partners ......................................................................... 59

Page 3 of 59
1) INTRODUCTION Late December of 2016, Viton Municipal Electric Utility (VMEU) engaged FARR Technologies
(FARR) to develop a feasibility study that would investigate how to bring a Fiber-to-the-Premise
(FTTP) network to the City of Vinton.
Various options are available that provide their own unique challenges and solutions for a city
the size of Vinton. The early sections of the study cover why a fiber system is important, existing
market conditions, various service offerings, while later sections address network designs,
organizational structures, cost estimates and a financial analysis. The recommended project
design is estimated at approximately $8.9 M with financial details provided in Appendix C.
A FTTP project will be able to bring faster internet speeds, a higher level of system reliability and
local customer service and support to the citizens who live and/or work in Vinton. The reality of
developing a successful fiber network project will require collaboration and commitment from the
City, Vinton Municipal Electric Utility (VMEU) and community to work together for the long-term
benefit for the City of Vinton.
2) EXECUTIVE SUMMARY Broadband access is arguably one of the more important aspects of any thriving community
today. With broadband access our educational system, our economic development efforts, our
healthcare, and our business climate are all enhanced. This broadband feasibility study
examines the availability of broadband access in Vinton, Iowa, including the technical aspects
and challenges of extending broadband access to residents of the City, and the feasibility of
offering voice, video and data services over a FTTP (Fiber-to-the-Premise) network.
From a technical perspective (See Appendix B), the fiber cable network design proposes a 100%
buried network and includes redundant connections to the internet backbone as well as a
redundant local access network ring within the city to prevent a single cable or electronics failure
from disabling the network. The proposed fiber electronics design utilizes a Gigabit Passive
Optical Network (GPON) with shared 2.4 Gbps downstream and 1.2 Gbps upstream bandwidth
which meets the requirements to be a Gigabit Community. Future advances in electronics can be seamlessly integrated on the existing fiber network without any need to change the cable.
The cable and electronics design capital costs were estimated to total $8.9 million. The
estimates are based on a custom layout for the cables and drops on a real-world coordinate map
of Vinton to produce actual footages of each cable size, number of handholes, Multi Service
Terminals (MST’s), pedestals, and Optical Network Terminal’s (ONT’s) from the map. These units
are then priced out based on 2016/17 bids for each type of cable/equipment from similar
projects FARR Technologies is working on in Iowa.
Page 4 of 59
Financially, the Vinton Broadband five (5) year proforma uses the following fundamental
assumptions to create the Income Statement, Balance Sheet and Cash Flow statements shown
in Appendix C.
1. Capital cost of cable, electronics, work equipment, buildings $8.9M
2. 100% of capital cost is financed at a rate of 4.5% with a 20-year amortization.
3. 2,100 business and residential locations passed.
4. Voice service take rate of 35% in year 1 decreasing to 30% in year 5 for residential
customers and 40% in year 1 – 5 for business customers.
5. Video service take rate of 35% in year 1 decreasing to 30% in year 5 for residential
customers and 10% in year 1 – 5 for business customers
6. High speed data service take rate of 40% in year 1 growing to 62% in year 5 for
residential and 40% in year 1 growing to 62% in year 5 for business customers.
7. Operations expenses provided by Vinton Broadband, primarily network, customer service
and management, are based on a personnel and equipment model that will support the network’s operation throughout the life of the network including the first 5 years in this
study.
The financial results using these assumptions project the project to have positive net income in
year 5, cash flow in year 4, Times Interest Earned Ratio (TIER) of 1.11 and Debt Service
Coverage (DSC) 1.2 in year 3 increasing to 1.44 in year 5. At these levels of ratios, the
penetration rates included in the study are equivalent to “breakeven” rates.
While the financials as presented are breakeven, there are several recommended next steps well
worth pursuing based on this study.
1. Review and approve feasibility study
2. Seek additional marketing research / surveys to validate feasibility assumptions
3. Begin discussions with a capital investment advisor for financing
4. Send Request for Proposals (RFP’s) for potential service providers for outsourced
operations
5. Staking outside plant cable
6. Request for Quote (RFQ) / RFP for outside plant cable construction and electronics
7. Update pro forma with newly acquired information
Page 5 of 59
3) MARKET / COMPETITION a) Overview
Is broadband important to a small community in rural Iowa, to Vinton, Iowa? The answer is
emphatically YES and that answer is supported by countless surveys and studies today which
will tell you that a community cannot survive without robust broadband. These studies show
that economies thrive, housing values increase, access to quality healthcare improves, business income increases, and educational experiences flourish with access to broadband.
Although broadband is not the only answer for economic development and prosperity it is an
extremely important factor.
The City of Vinton has multiple broadband providers today so why isn’t the current broadband
service good enough? One answer is streaming video. According to iGR Research the
average monthly broadband usage is 190 gigabytes per month and 95% of that traffic is
video related. Generally, every member of a household has their own device, whether it’s a
laptop, tablet, smart phone, smart TV, or 1 of many other devices, and all of them are
accessing the internet. In this kind of environment DSL service or cable modem service
cannot keep up with the foreseeable growth in demand for broadband.
Historically, the high cost and the lower long-term returns of delivering leading-edge
communications technologies to sparsely populated areas has led many large
communications companies like CenturyLink and Mediacom to invest their capital in urban
and suburban areas, where more people means more profits. Many small communities
ranging from 1,500 – 10,000 households are in danger of being left behind when it comes
to technology. Both CenturyLink and Mediacom, who currently already provide broadband
service in Vinton, have shown little or no interest in investing in new infrastructure in the City
of Vinton.
While incumbent carriers have made incremental improvements to their operations to
improve broadband internet speeds, they have not invested significantly in their physical
plant infrastructure. Although potential internet speeds have marginally improved, reliability
is still suspect due to frequent maintenance issues associated with aging, copper based and
coax based infrastructure. Furthermore, no competitive carriers, wireline or wireless, have
indicated any desire to complete a community wide broadband network. These factors point
and lead to the conclusion that the City needs to take control of its future and build a FTTP
network itself.
While this situation has clearly limited business and home-based business opportunities, K-
12 educational, and public safety opportunities, there is an opportunity for the City to
leverage its experience in the electric utility to create a separate communications utility, i.e.
Vinton Broadband to do the job that incumbent carriers refuse to do. The new
communications network will provide one of the basic needs for economic development in
the City for the next 40 to 50 years. The City's experience with its electric utility will provide
access to attractive financing options to fund construction of a state of the art fiber network.
While this investment will not, in and of itself, guarantee economic activity, without
Page 6 of 59
investment the City may be eliminated from consideration by new businesses, existing
businesses looking to expand, new residents, existing residents and visitors alike. An
additional incentive for the City and its citizens to build a new FTTP network is the potential
for stable or increased home values. As shown in Appendix A, a survey by the Fiber To The
Home Council in 2015 showed that high speed broadband networks showed a range of 3%
to 7% in increased resale value of homes. Additional value added benefits to the community
include; 1) increases in community GDP due to new economic opportunities for local
businesses, 2) increased economic development opportunities to attract new businesses
and industries, and 3) identification as a Gigabit Community. The availability of high speed
broadband to homes and businesses makes communities an attractive option for all entities,
whether a basic subscriber, subscribers with children, work-from-home employees, or main
street businesses. All consumers are potential users of a FTTP network.
While some municipalities have offered wholesale services and built fiber backbone
networks only (also known as Open Access Networks), these solutions do not address the
public’s need for services like voice, video and high-speed data that have been identified by
the citizens of Vinton over the years. For that reason alone, it is the intention of this
feasibility study to analyze building a true FTTP network. The electronics that will be placed
into service will easily handle all current services and future bandwidth intense
services. This will allow customers to have unrestricted access to the internet as well as
allow them to use even more services as the demand for bandwidth continues to grow. It
allows the Vinton Broadband to offer “more than needed” broadband initially, which provides
a competitive advantage and a key differentiator over the existing providers’ offerings. Plus,
the equipment being provided for this network can easily monitor actual usage by all
customers and regulate how much true demand it puts on the network connection to the
worldwide network. Vinton Broadband wants to put the most bandwidth possible in the
hands of the potential patrons of this network.
b) Market Approach Communications is a capital-intensive industry and is generally best suited where economies
of scale exist whereby the capital invested can be spread among more users of the system.
Those economies of scale do not exist in small towns scattered throughout Iowa. Because
the economies of scale are working against a new communications provider, it will be difficult
if not impossible to compete with the competition on price alone. Vinton Broadband will
need to consistently provide the most reliable, fastest broadband service as well as first-
class customer service, and not try to match the lowest bundled price that competitors are
offering. SELL THE DIFFERENCE! The new FTTP network will be capable of providing internet
speeds 10 times as fast as currently available so it is important to “SELL THAT DIFFERENCE”
and not try to match the same low speed tier the competitors are selling. Some suggestions
on “SELLING THE DIFFERENCE” might include;
• Emphasize the “DIFFERENCE”; Vinton Broadband’s FTTP network will include a reliable state of the art network, with gigabit capability, bi-directional internet speeds,
local control, local service and support, and local community benefits.
Page 7 of 59
• During the initial roll out of service create an “Appreciation Days” type atmosphere where potential customers are invited to learn about Vinton Broadband services, a
sign-up blitz. Such an event might include demonstrations of slow (10 Mbps) versus
extremely fast (1 Gbps) internet download speeds, sign up for gift drawings and hand
out other free promotional items.
• Explain to customers that signing up for service during the initial construction phase will result in no cost for the fiber connection to their house or business location. After
the initial construction, customers could be charged $250 or more to have fiber
brought to their residence or $1,000 or more to have fiber brought to their business
(economies of scale). Vinton Broadband can’t invest if the customer is not going to
buy.
• Vinton Broadband may consider providing initial customers signing up for service with 1 Gbps service for the same price as 100 Mbps service free for the 1st month.
c) Keys to Success i) Deliver the fastest and most reliable broadband available in Vinton
ii) Provide 1st class customer service
iii) Installing a state of the art network with unlimited capacity – “Sell the Difference”
iv) Create community excitement and enthusiasm before launching service
4) SERVICE OFFERINGS
a) Broadband
Broadband service delivered via an all fiber network infrastructure is the primary reason for
the Vinton Broadband project. High speed broadband is in demand across the nation
especially in areas that have been neglected by the large incumbent providers. A Fiber-to-
the-Home (FTTH) network has virtually unlimited bandwidth and is only limited by the fiber
electronics used to deploy service to customers.
b) Voice Service
Wireline voice services continue to be an important service offering for a competitive service provider. Vinton Broadband will have greater success attracting customers by offering a
triple play (broadband, voice, & video) that includes voice service rather than offering
broadband only. Many customers that currently have voice service with one of the
incumbent providers will want to continue purchasing all their communications services on a
single bill from a single provider. It is a fact, however, that wireline voice service is declining.
With that in mind, carefully considering the cost to implement voice service is vitally
important.
IP based voice services are comparable to those being offered by Mediacom today in Vinton.
Residential voice service will have the same features available currently. All business-related
Page 8 of 59
services such as PBX services, both customer owned and hosted services provided by the
Vinton Broadband will be available within this network. Session Initiation Protocol (SIP)
(internet connections for businesses and subscribers) based services will also be available.
Applications which utilize SIP trunking would include Voice over Internet Protocol (VoIP) and
streaming media service based on SIP in which Internet telephone service providers (ITSP’s)
deliver telephone services and unified communications to customers equipped with SIP-
based branch exchange (IP-PBX) and Unified Communication Facilities.
FARR Technologies evaluated several options for providing voice service. The options
considered are; 1) Purchasing and operating a voice switch; 2) Hosted switching
arrangements; 3) Wholesale lease of facilities to voice service provider.
Purchasing and operating a voice switch requires significant capital investment, additional
technical experience, and administrative burdens. The capital investment to purchase and
install a voice switch would range from $250,000 - $350,000. Additionally, a competent technician would be necessary to monitor voice switched traffic, perform translations
changes, and perform local number porting changes.
Hosted switching arrangements are becoming more common as voice service continues the
transition from analog to IP. Companies that have invested in voice switches are leveraging
their investment by offering hosted switching arrangements. Current voice switches often
have the capacity to service many more voice connections than are typically served. A
hosted switching arrangement would allow Vinton Broadband to off load much of the day to
day technical operations to a contracted service provider.
Under both the previous two options, Vinton Broadband would need to file all regulatory
applications, and satisfy all ongoing regulatory requirements which include, applying for
numbering resources, registering with national databases, E911 requirements, local number
portability, negotiate interconnection agreements with incumbent providers, etc. These
requirements can be onerous and time consuming and may increase startup costs.
Another option similar to hosted switching is to contract with a voice service provider under a
wholesale lease arrangement. With this model voice service provider leases a “voice path”
on the newly constructed FTTH facility for each voice service purchased by residential or
business customers. The voice service provider performs all regulatory filings and would be
certified competitive local exchange carrier (CLEC) in Vinton. This option requires no
significant capital investment but does require Vinton Communications Utility to perform all
customer service and billing. It is important to note that under this model, Vinton Broadband
maintains the customer relationship for sales, customer service, billing, maintenance, etc.
The voice service provider provides voice switching, access to E911, Communications
Assistance for Law Enforcement Act (CALEA), local number portability, and other technical
functions.
The pro forma utilizes the wholesale lease option because it reduces capital investment, and
reduces operational and administrative burdens to allow Vinton Broadband to focus on
Page 9 of 59
customer service, however, Vinton Broadband should analyze available options for providing
voice service during the final design / RFP phase of the project.
c) Video Services
Video services in rural markets are extremely competitive with profit margins that are extremely narrow if they exist at all1. Rural video providers lack meaningful market power
when negotiating for video programming. Video providers are often at the mercy of video
programmers which tie or bundle undesired content with other desired channels to extract
higher programming fees from video providers. In addition to the high cost of programming
fees, the capital investment necessary to become a traditional video service provider is
extremely cost prohibitive in rural markets with low subscriber counts.
Various national studies indicate that subscription based video services are on the decline.
One study suggests that 10% of customers in urban and suburban markets have cut the
video cord opting for Over the Top (OTT) video options. OTT video options are delivered over
the internet as well as other video streaming content. OTT video has become extremely
popular among 18-30-year-old adults and includes streaming services such as Netflix, Hulu,
and YouTube. Another study conducted in 2016 of video services found that 82% of
customers in rural markets continue to use subscription based video services.
Despite the challenges associated with becoming a video service provider, there are
significant reasons for Vinton Broadband to develop and offer video services. It is important
that Vinton Broadband offer not only an alternative, but a replacement of the incumbent
providers that refuse to upgrade their services in Vinton. By offering a triple play (broadband,
voice, and video) the project is further supported in achieving its customer subscription
targets.
FARR Technologies evaluated three methods in which video services could be provided to
residents and businesses in Vinton by the newly established communications utility. They
are: 1) Build a standalone video headend; 2) Invest in an existing video headend through a
sharing arrangement or partnership; or 3) Utilizing a hybrid video content delivery model
through a “hosted” video headend.
A standalone video headend affords a video provider the most control over the technical
aspects of video content delivery. A provider building a video headend would need to
purchase land to install multiple satellite dishes used to receive video content, develop the
technical expertise to manage the system, purchase middleware used to manage the content
delivery to the customer, and perform all administrative functions in particular programming
content negotiations. This option bears the highest capital investment and requires the most
ongoing operational and administrative cost. With today’s high cost of video programming
1 NTCA – The Rural Broadband Association, Comments filed in MB Docket No. 15-158 footnote 12; “RLECs
operating as MVPDs routinely do so at or near break-even levels, if that. In these instances, video services are
provided in order to meet community needs and consumer demands, in addition to countering competition
from other service providers, despite the lack of a compelling business case.”
Page 10 of 59
fees and over the top (OTT) alternatives for video content, there is rarely a business case for
building a standalone video headend in a rural market.
Another option available to Vinton Broadband is to invest in an existing video headend
through a partnership or sharing arrangement. Video headend operators are willing to
provide video content to additional service providers in an effort to spread the high capital and high operational costs of operating a video headend across more users. With this
option, Vinton Broadband would be responsible for becoming a member of National Cable
Television Cooperative (NCTC), an organization that administers programming content
agreements on behalf of its members with the various content providers such as Fox, ESPN,
HBO, USA Networks, Turner Networks, etc.)
Another option is to utilize a “hybrid” video content solution through a hosted video headend
provider. This option allows for the least capital investment and ensures a “moderate” gross
profit margin. However, this model is relatively new and is based on SkitterTV. There have
been some roll-out issues, but these are being addressed and should be more defined within
the next 12-18 months. Using a managed service for video services significantly reduces
startup costs as well as labor costs. SkitterTV provides content contract management,
headend management and middleware management. With these time-consuming tasks
being handled by SkitterTV, the operator can focus on customer service which is key to the
success of the proposed fiber buildout.
Working with an existing video headend provider or utilizing a hosted service such as
SkitterTV are both viable options for providing video services. The pro forma currently
includes Option 3 – Hosted Video Headend as the video content delivery solution.
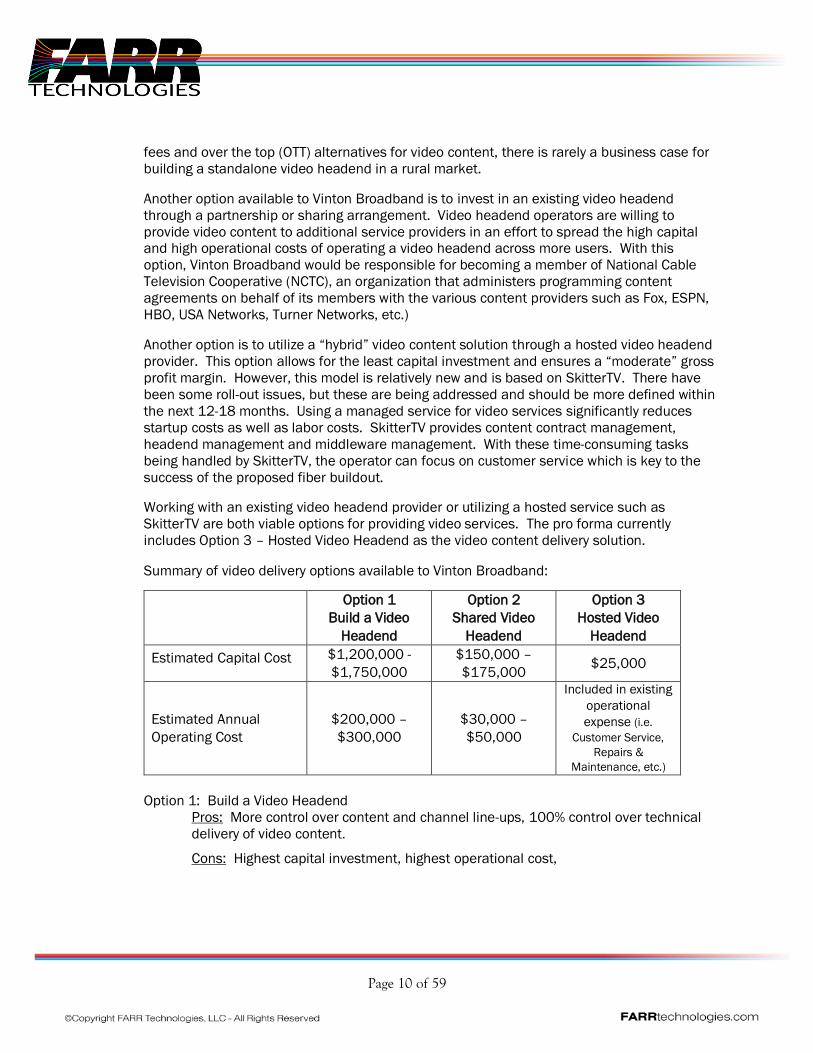
Summary of video delivery options available to Vinton Broadband:
Option 1
Build a Video
Headend
Option 2
Shared Video
Headend
Option 3
Hosted Video
Headend
Estimated Capital Cost $1,200,000 -
$1,750,000
$150,000 –
$175,000 $25,000
Estimated Annual
Operating Cost
$200,000 –
$300,000
$30,000 –
$50,000
Included in existing
operational
expense (i.e.
Customer Service,
Repairs &
Maintenance, etc.)
Option 1: Build a Video Headend
Pros: More control over content and channel line-ups, 100% control over technical
delivery of video content.
Cons: Highest capital investment, highest operational cost,
Page 11 of 59
Option 2: Shared Video Headend
Pros: More control over content and channel line-ups, advantage of working with
local companies vested in serving rural markets.
Cons: Additional capital investment required, additional operational costs (compared
to option 3).
Option 3: Hosted Video Headend
Pros: No substantial capital investment required, business model based on profit
sharing, no administrative costs for programming negotiations.
Cons: No control over content, channel line-ups, or customer pricing, relatively new
company.
The Video market is rapidly evolving as more non-traditional video options are becoming
available. If a decision is made to move forward, it would be the expectation that Vinton
Broadband evaluate all options available to determine the most cost effective, yet feature
rich offering available during the design / RFP phase of the project.
5) PROPOSED NETWORK DESIGN
a) Overview
While some municipalities have offered wholesale services and built fiber backbone
networks only (also known as Open Access Networks), these solutions do not address the
public’s need for services like voice, video and high-speed data that have been identified by
the citizens of Vinton over the years. For that reason alone, it is the intention of this
feasibility study to analyze building a true FTTP network. The electronics that will be placed
into service will easily handle all current services and future bandwidth intense
services. This will allow customers to have unrestricted access to the internet as well as
allow them to use even more services as the demand for bandwidth continues to grow. It
allows the Vinton Broadband to offer “more than needed” broadband initially, which provides
a competitive advantage and a key differentiator over the existing providers’ offerings. Plus,
the equipment being provided for this network can easily monitor actual usage by all
customers and regulate how much true demand it puts on the network connection to the
worldwide network. Vinton Broadband wants to put the most bandwidth possible in the
hands of the potential patrons of this network.
From a technical perspective (See Appendix B), the fiber cable network design proposes a
100% buried network and includes redundant connections to the internet backbone as well
as a redundant local access network ring within the city to prevent a single cable or
electronics failure from disabling the network. The local access network will have a 144-fiber
strand cable installed in ducts connecting the five (5) splitter cabinets in the field and a
single central office. From these locations, homes and businesses will connect to Multi
Service Terminals (MST) using connectorized fiber cables also installed in ducts. The drops
Page 12 of 59
from the MST to the home or business will be direct buried with rugged connectors on each
end. The connectorized ends reduce ongoing maintenance costs. The redundant fiber
access to the internet uses a leased route for one connection to the internet and proposes a
new buried route to complete the ring.
The proposed fiber electronics design utilizes a Gigabit Passive Optical Network (GPON) with shared 2.4 Gbps downstream and 1.2 Gbps upstream bandwidth which meets the
requirements to be a Gigabit Community. Future advances in electronics can be seamlessly
integrated on the existing fiber network without any need to change the cable. The NGPON2
is the next iteration of GPON electronics with download speeds of up to 10 Gbps. While it is
available today, the product carries premium pricing and was not included in this study. Its
availability is a testament to the ever-increasing speeds of each new generation of GPON
electronics.
The cable and electronics design capital costs were estimated by developing a custom layout
for the cables and drops on a real-world coordinate map of Vinton, then pulling actual
footages of each cable size, number of handholes, MSTs, pedestals, and ONTs from the map
and then pricing out these quantities based on 2016/17 bids for each type of
cable/equipment from similar projects FARR is working on in Iowa.
b) FTTH Technical Description
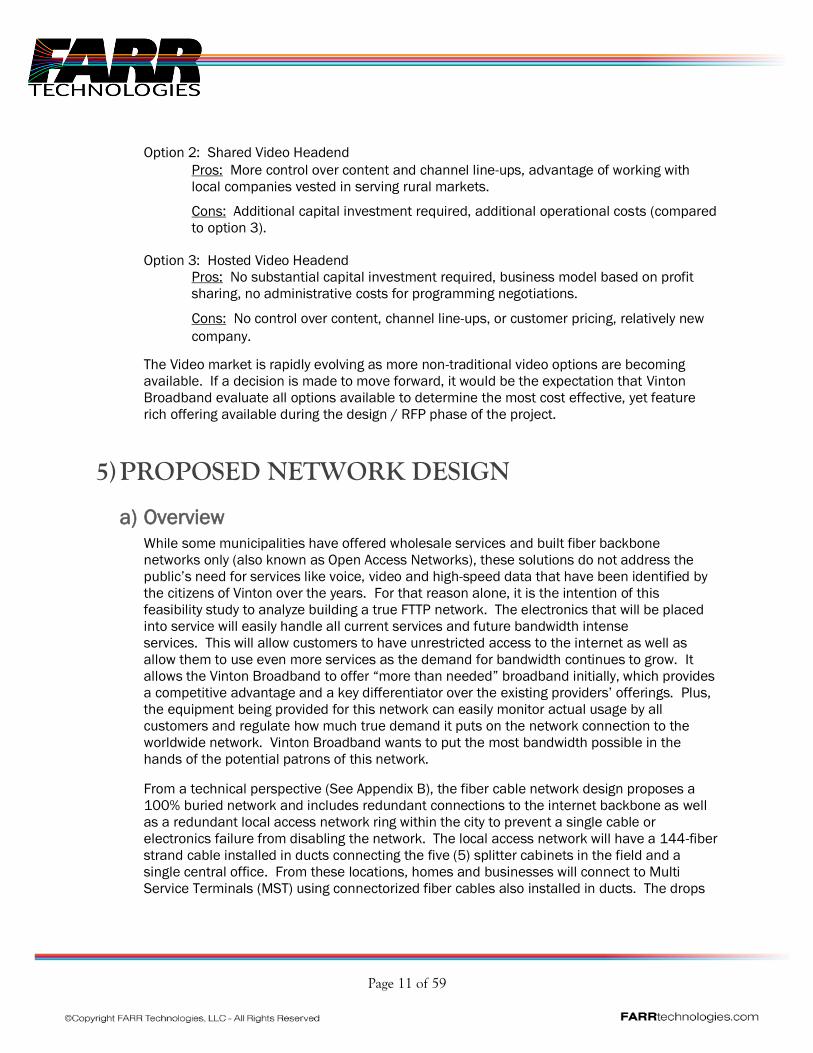
The FTTH outside plant (OSP) and electronics design proposed provides Vinton Broadband a
strong basis to ensure delivery of all services required by business and residents today. The
proposed design utilizes a central office location and five (5) fiber splitter cabinet (FSC)
nodes that allow for growth into the future by addition of field electronics to support higher
data services if needed above the current capacity of the field splitter design. The central
office location will have redundant fiber backbone connection routes to provide additional
protection in case of a fiber cut and the five (5) FSC nodes are connected by a 144-fiber ring
to allow for expansion to field electronics that can be protected in case of fiber cut as well.

Page 13 of 59
i) Feeder Fiber
The feeder fiber cable system is designed in a ring configuration that originates at the
Central Office (CO) location. The feeder fiber than routes to five (5) FSC Nodes in field
and returns to CO. This design configuration is the most cost effective scenario when
considering initial deployment but limits flexibility for the use of passive, active or
combination from day one of system deployment due to creating a shortage of dedicate
fibers from your CO (electronics location) to each FSC location. This shortage can
eventually limit the capacity of bandwidth to each subscriber out of the nodes. The
solution to this issue would be an upgrade to the existing fiber facilities from the CO to
the FSC Node or the placement of FTTx electronics at the FSC Node locations. This
concern has become less and less over the years as the PON electronic bandwidth
continues to grow but at this point it is still a concern. There are other fiber designs that
could be utilized to remove the bandwidth capacity issue, such as a centralized feeder solution that were also evaluated as part of this study (see b), i) in this section for
details).
Front Back
Fiber Splitter Cabinet (FSC)
The feeder fiber cable layout utilizes standard loose tube cable sizes from 432 to 24
fiber strand counts. The 144-fiber feeder ring cable has dedicated fiber strands to feed
each splitter at each FSC Node. The number of 1x16 splitters required are based on the
number of subscribers being fed from that FSC Node. There are also some spare fibers
for dedicated strands to customer all the way back to CO and/or spare fiber for future
electronic cabinets (if required). There are 18 spare fiber strands for this currently in the
proposed 144 strand ring fiber cable.
The Feeder cable out of the FSC Nodes has a dedicated fiber strand for each Multiport
service terminal (MST) cable deployed, which provides a dedicated strand for each
Page 14 of 59
subscriber and spare for growth and maintenance. The FSC Nodes are sized to
accommodate all feeder splitter fibers in and subscriber feeder fibers out. The FSC Node
is equipped with 40% of the splitters year one and is capable of having additional
splitters added as need. The Feeder cable out of each Node on average is around a 70%
fill.
The network design has all feeder fiber being installed in duct, which provides additional
protection from certain types of damage and if damaged occurs, it allows quicker repair
of the feeder facilities over direct buried facilities. The design also includes a spare duct
to be placed from the Central Office along with the Feeder routes to the North, West and
South. This spare duct allows additional expansion solution for new developments and
future alternate fiber connectivity solutions.
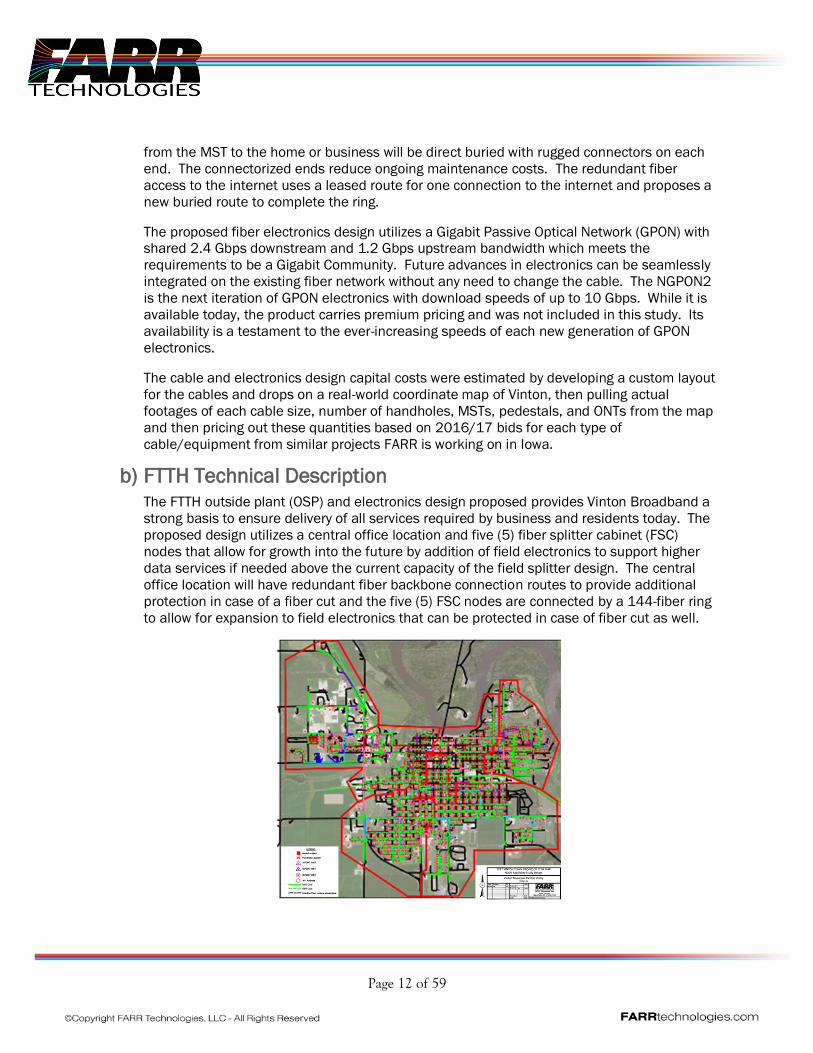
ii) Distribution Fiber
The distribution fiber design utilizes an 8 port, 6 port, and 4 port
Multiport Service Terminals (MST) for cable and connectorized access for
subscriber termination. The MST units have fiber pigtails in standard
lengths that shall route back to the feeder fiber cables and are than
spliced back to the FSC Node. These MST’s are sized for the number of
subscribers along with future lots, spare ports for maintenance and
additional spares based on design limitations of the standard MST
configurations. The MST’s design is around 85% to 90% fill based on
subscriber breakout for route and future growth.
The network design has all distribution fiber being installed in duct,
which provides additional protection from certain types of damage and if
damage occurs, it allows quicker repair of the distribution facilities over
direct buried facilities.
Non- Metallic Netspan Pro8 Pedestal with 6 Port
Multi Service housing (MST)
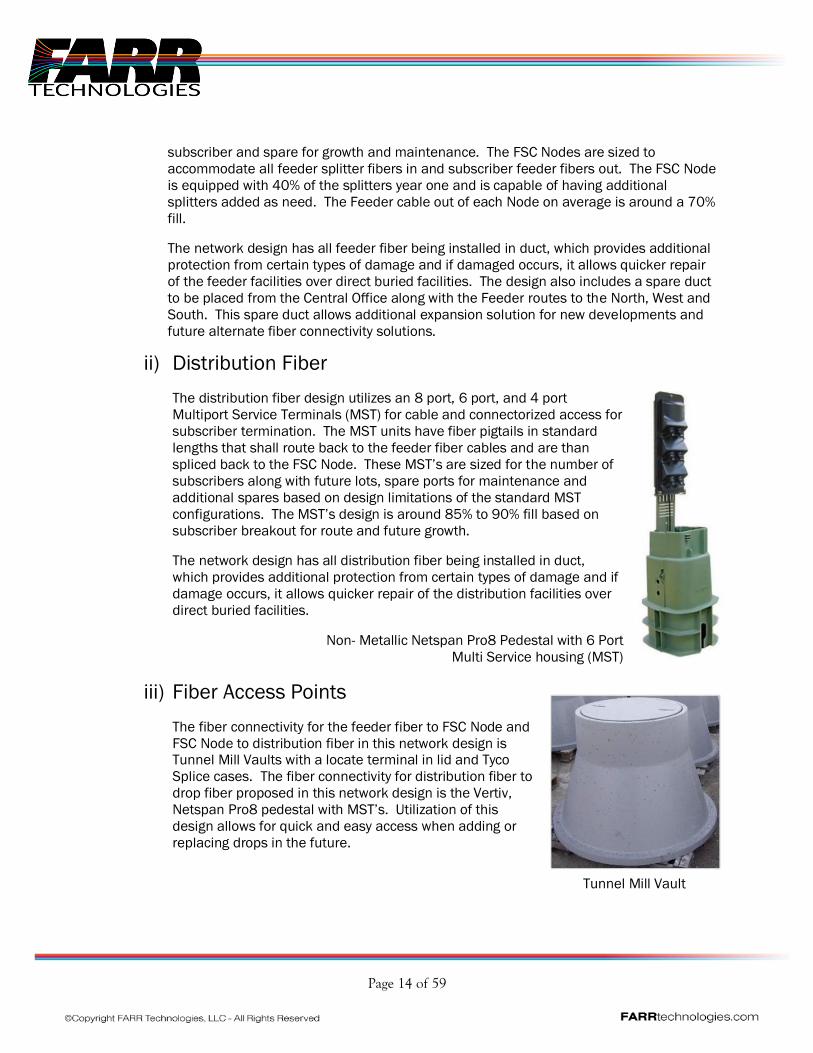
iii) Fiber Access Points
The fiber connectivity for the feeder fiber to FSC Node and
FSC Node to distribution fiber in this network design is Tunnel Mill Vaults with a locate terminal in lid and Tyco
Splice cases. The fiber connectivity for distribution fiber to
drop fiber proposed in this network design is the Vertiv,
Netspan Pro8 pedestal with MST’s. Utilization of this
design allows for quick and easy access when adding or
replacing drops in the future.
Tunnel Mill Vault
Page 15 of 59
The fiber connectivity for the OSP facilities from the CO to distribution fiber cable are
designed to be a fusion splice with a protection sleeve. The distribution fiber to
subscriber drop to subscriber ONT demarcation housing connectivity shall utilize
ruggedized connectors.
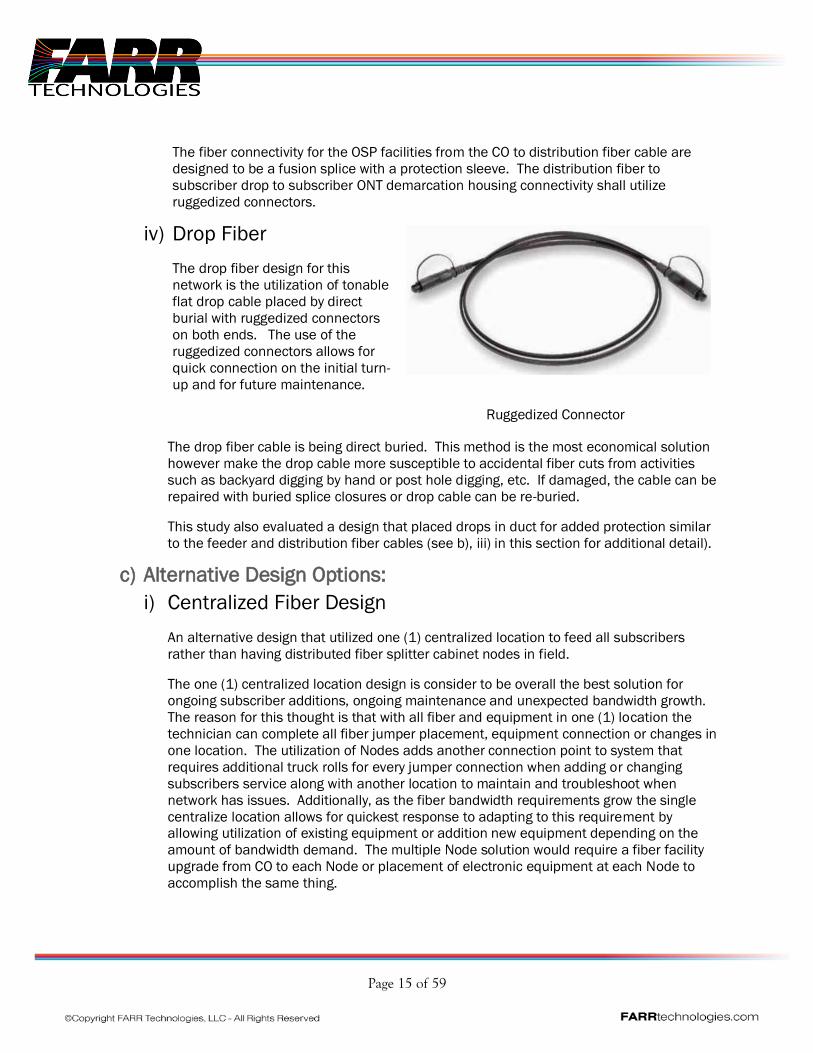
iv) Drop Fiber
The drop fiber design for this
network is the utilization of tonable
flat drop cable placed by direct
burial with ruggedized connectors
on both ends. The use of the
ruggedized connectors allows for
quick connection on the initial turn-
up and for future maintenance.
Ruggedized Connector
The drop fiber cable is being direct buried. This method is the most economical solution
however make the drop cable more susceptible to accidental fiber cuts from activities
such as backyard digging by hand or post hole digging, etc. If damaged, the cable can be
repaired with buried splice closures or drop cable can be re-buried.
This study also evaluated a design that placed drops in duct for added protection similar
to the feeder and distribution fiber cables (see b), iii) in this section for additional detail).
c) Alternative Design Options: i) Centralized Fiber Design
An alternative design that utilized one (1) centralized location to feed all subscribers
rather than having distributed fiber splitter cabinet nodes in field.
The one (1) centralized location design is consider to be overall the best solution for
ongoing subscriber additions, ongoing maintenance and unexpected bandwidth growth.
The reason for this thought is that with all fiber and equipment in one (1) location the
technician can complete all fiber jumper placement, equipment connection or changes in
one location. The utilization of Nodes adds another connection point to system that
requires additional truck rolls for every jumper connection when adding or changing
subscribers service along with another location to maintain and troubleshoot when
network has issues. Additionally, as the fiber bandwidth requirements grow the single
centralize location allows for quickest response to adapting to this requirement by allowing utilization of existing equipment or addition new equipment depending on the
amount of bandwidth demand. The multiple Node solution would require a fiber facility
upgrade from CO to each Node or placement of electronic equipment at each Node to
accomplish the same thing.
Page 16 of 59
The design analysis of this alternative indicates an approximate outside plant project
cost increase of approximately $125,000.00 to this part of build for a Centralized
location. FARR recommends that strong consideration be given for the centralized fiber
design evaluated during the final design/RFP phase of the project.
ii) Aerial vs. Buried
An alternative design that considered utilizing aerial infrastructure for certain portions of
build instead of buried was also evaluated. The design looked at the distribution routes
being installed on aerial infrastructure while the feeder and drop routes remained buried.
This design scenario still provides protection of buried facilities for the main feeder
routes and drops but allows reduction of outside plant costs by placing aerial distribution
facilities. The distribution routes being aerial potential minimize outages to just that
route. Also, based on field review of existing aerial plant, these routes would have
minimal make ready costs.
The impact to the outside plant construction cost based on this hybrid buried & aerial
fiber design indicated a potential cost reduction to this part of project of approximately
$425,000.00. The option to utilize aerial construction should be included as an
alternate during the Request for Proposal (RFP) bid process.
Other factors to consider if aerial cable construction is selected:
• Increased staking costs.
• Requires bucket truck(s) for service, maintenance and repair which may eliminate potential 3rd party service providers.
• Technicians required to must be certified to work on poles near electric power at an increased labor cost as opposed to buried infrastructure.
iii) Conduits for Drops
An alternative design that considered utilizing conduit for all drop facility placement was
evaluated. The reason for placement of conduit and then pulling fiber cable into the
conduit is for additional protection from accidental damage in the subscriber’s yard shall
allow the quickest restoration by repairing conduit and pulling new drop fiber.
The additional material cost for drops placed in conduit would increase the overall
project cost by about $140,000 for the initial 40% penetration or addition of around
$155.00 per subscriber. It is important to note that placing drops in conduit is most
beneficial if the overall network design places mainline, feeder, and distribution fiber in
conduit. FARR recommends that alternate’s for placing fiber in conduit be evaluated
during the final design / RFP phase of the project.
Page 17 of 59
d) Fiber Connectivity
Broadband, voice, and video services will require Vinton Broadband to connect to other
providers to gain access to the internet backbone, to the public switched telephone network
(PSTN), and certain video headend providers. This fiber link to the outside world makes it
possible to bring fiber based services to residences and business in Vinton. There are
several entities within the region near Vinton that have facilities close to or within the City of
Vinton. These entities would all be possible sources of connections to the nationwide
network.
Engineering standards also dictate that the fiber connections be designed to be survivable
and / or redundant in order to survive potential service outages due to fiber cuts, or acts of
God. The fiber connection is typically purchased as fiber transport or “lit” services based on
bandwidth capacity. The fiber can also be purchased by leasing dark fiber which may require
the customer to provide the fiber transport electronics on both ends of the circuit. Dark fiber
is less common but does have long term pricing advantages.
With these principles in mind, FARR Technologies identified the following options for fiber
connectivity:
i) Transport from Incumbent Providers
Vinton Broadband could purchase fiber transport from CenturyLink or Mediacom to
obtain access to the internet backbone and other downstream providers. Although this
option is possible, it is not recommended due to the fact that both companies will be the
primary competitors to the Vinton Broadband project.
ii) Fiber Transport
Vinton Broadband may be required to build fiber optic cable to these fiber transport
providers that are near Vinton in order to interconnect with long haul fiber networks. The
following options for interconnection were considered:
(1) Option 1 - The redundant fiber connection for this option creates a protected ring
configuration by have connection at Aureon fiber splice points south of Vinton and
west of Vinton. The fiber connectivity build shall consist of approximately 15 miles of
direct buried 48 fiber with reel ends approximately every 5 miles. The pro forma
currently includes $264,500 in the capital investment in Year 0 to accomplish this
interconnection.
(2) Option 2 - The redundant fiber connection for this option creates a protected ring
configuration by having connectivity at Garrison, Iowa and at a fiber splice point on
the north side of Urbana. The fiber connectivity build shall consist of approximately
20 miles of direct buried 48 fiber with reel ends approximately every 5 miles. This
option requires additional construction cost and state permits fees in order to
Page 18 of 59
construct fiber optic cable across the river. The estimated cost of this option is
$471,500.
The pro forma budget for fiber connectivity is $264,500. Following are alternative and
viable fiber connection options which should be considered during the design / RFP
phase of the project.
iii) Other Fiber Connection Options
(1) Cedar Falls Utilities (CFU) – CFU offers reasonable fiber transport rates, however, CFU
does not have fiber facilities near Vinton to accommodate fiber interconnection. In
order to interconnect with CFU, Vinton Broadband would need to build fiber to
Hiawatha, IA and / or Cedar Falls, IA. This fiber build is cost prohibitive. Vinton
Broadband may have the ability to interconnect with other providers that have
connections to CFU which enables Vinton Broadband to consider CFU for video signal
and broadband backbone services.
(2) USA Communications – USA Communications is currently a communications provider
in Vinton with fiber facilities. The company has not expressed a strong interest in
building a FTTH network in Vinton, but does provide broadband service to a handful
of business and governmental customers. Conversations with USA Communications
indicate a willingness to explore not only fiber transport services but other network
support services in the future.
(3) Unite Private Networks (UPN) – In conversations with representatives with UPN, the
nearest location to interconnect with the UPN network would be just to the east of
Urbana. This option would require a fiber build to Urbana.
(4) BroadNet Connect – BroadNet Connect is part of the HealthNet Connect / UnityPoint
Health network. The company currently has fiber facilities in Vinton and may provide
an opportunity for interconnection. Conversations with company representatives
could not establish with any certainty estimated costs for interconnection, however,
this option is worth strong consideration.
e) FTTH Electronics Design
The electronics portion of the capital investment is based on using Gigabit Passive Optical
Network (GPON) technology. This technology will allow for one gigabit service offerings today
if so desired. If future service offerings over 1 gigabit up to 10 gigabits are necessary, the
existing electronics can be overlaid with any of the new 10GPON technologies currently available.
The study was done with the assumption that all Optical Line Termination (OLT) units would
located in the Central Office (CO). This pricing was based off some very aggressive
competitive pricing between the two vendors seen most in this marketspace, ADTRAN INC.
and Calix Networks.
Page 19 of 59
Gigabit Passive Optical Network (GPON) is the FTTH standard that was used for the design.
This design allows for the delivery of gigabit services to the customer and fits the criteria to
be a certified gigabit community. The standard allows for a shared 2.4 Gbps download and
1.2 Gbps upload speeds. With multiplexing this allows for all subscribers sharing the GPON
network to obtain gigabit speeds.
NGPON2 technologies were discussed but not included in this study as they are cost
prohibitive to purchase at this time. These technologies provide for the ability to deliver more
than 1 Gbps to a subscriber with the upper limit of downstream bandwidth being 10 Gbps.
Regarding providing protection to subscribers connected at remote splitters there are two
options in cases where the feeder fiber may become damaged:
(1) Having dedicated spare fibers pre-spliced with a method of procedure in place for fast
restoral by reconnecting at each end of the circuit. The major drawback of this method is
that it requires manual intervention and a truck roll.
(2) Place electronics at the remote splitter locations. These electronics would have their
path the to the central office protected by using the fiber ring architecture. The
drawbacks of this method are:
(a) Time spent negotiating land to place the cabinet.
(b) Having to install local power.
(c) Monthly recurring charges for power.
(d) Higher cost for more electronics at both the remote and central office locations.
(e) Additional complexity if the owner wishes to migrate to NGPON2 technologies in the
future.
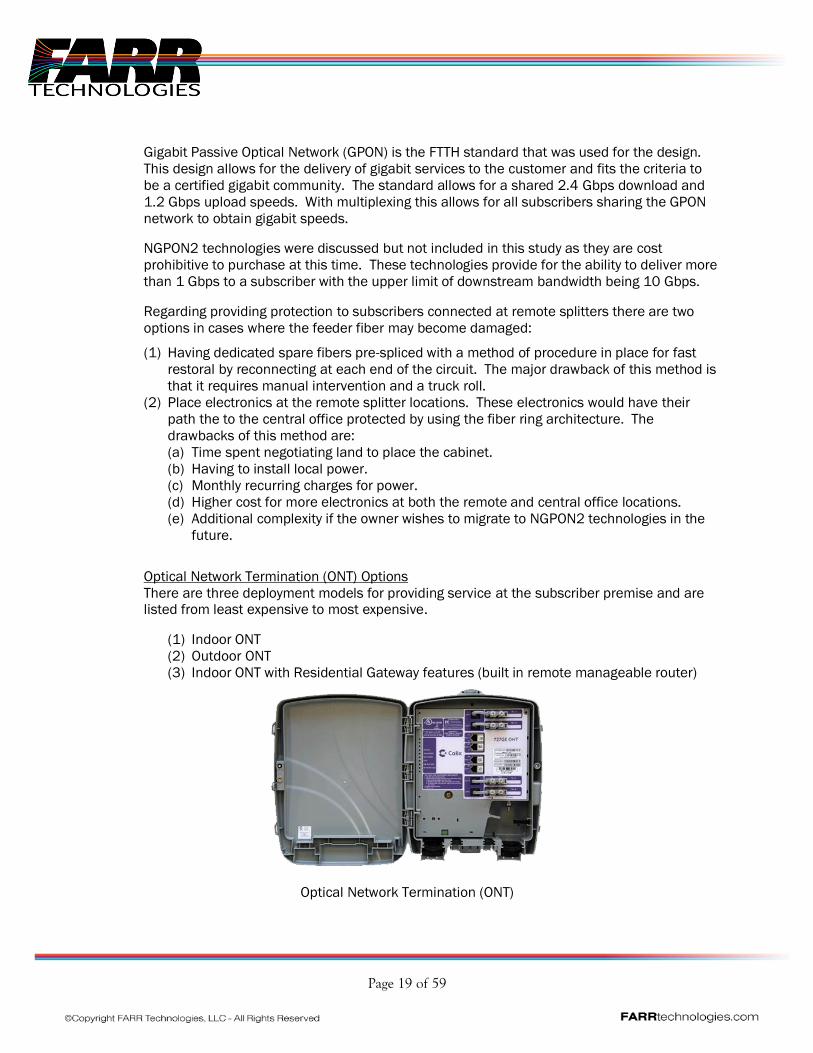
Optical Network Termination (ONT) Options
There are three deployment models for providing service at the subscriber premise and are listed from least expensive to most expensive.
(1) Indoor ONT
(2) Outdoor ONT
(3) Indoor ONT with Residential Gateway features (built in remote manageable router)
Optical Network Termination (ONT)
Page 20 of 59
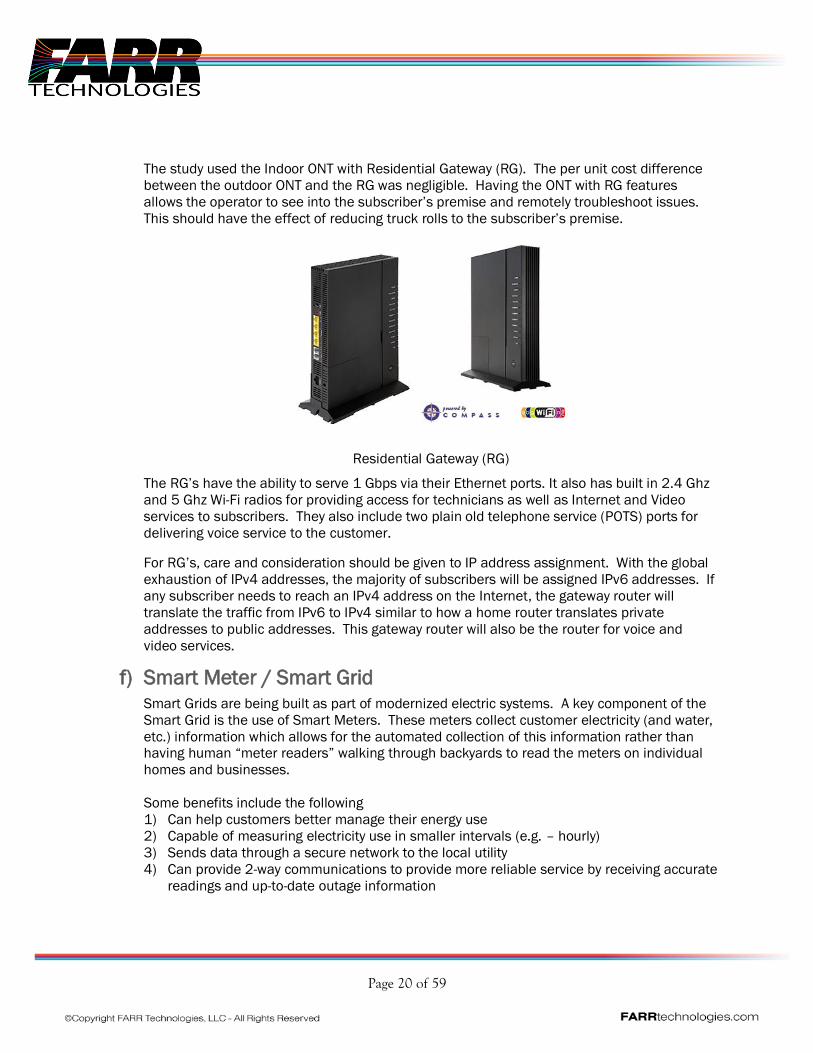
The study used the Indoor ONT with Residential Gateway (RG). The per unit cost difference
between the outdoor ONT and the RG was negligible. Having the ONT with RG features
allows the operator to see into the subscriber’s premise and remotely troubleshoot issues.
This should have the effect of reducing truck rolls to the subscriber’s premise.
Residential Gateway (RG)
The RG’s have the ability to serve 1 Gbps via their Ethernet ports. It also has built in 2.4 Ghz
and 5 Ghz Wi-Fi radios for providing access for technicians as well as Internet and Video
services to subscribers. They also include two plain old telephone service (POTS) ports for
delivering voice service to the customer.
For RG’s, care and consideration should be given to IP address assignment. With the global
exhaustion of IPv4 addresses, the majority of subscribers will be assigned IPv6 addresses. If
any subscriber needs to reach an IPv4 address on the Internet, the gateway router will
translate the traffic from IPv6 to IPv4 similar to how a home router translates private
addresses to public addresses. This gateway router will also be the router for voice and
video services.
f) Smart Meter / Smart Grid Smart Grids are being built as part of modernized electric systems. A key component of the
Smart Grid is the use of Smart Meters. These meters collect customer electricity (and water,
etc.) information which allows for the automated collection of this information rather than having human “meter readers” walking through backyards to read the meters on individual
homes and businesses.
Some benefits include the following
1) Can help customers better manage their energy use
2) Capable of measuring electricity use in smaller intervals (e.g. – hourly)
3) Sends data through a secure network to the local utility
4) Can provide 2-way communications to provide more reliable service by receiving accurate
readings and up-to-date outage information
Page 21 of 59
5) Modernizes the metering infrastructure by replacing mechanical analog meters with
digital meters
6) Provides customers with more detailed information about their individual electricity
usage which helps customers to be better informed.
7) Allows electric utilities to be more creative with pricing programs as subscribers utilize
more of the smart meter capabilities within their homes.
8) Can be used not only for use by the utilities that make use of the meters but
homeowners can see benefits as more “smart appliances” are coming into play.
a) Example: smart refrigerators can “send you” a list of items needed for grocery
shopping from the list you have on the monitor on the refrigerator. You do not
need to remember to take the list with you to the store.
6) FINANCIAL PRO FORMA
a) Overview The financial pro forma or business plan has been developed to determine the feasibility of
providing customers in the City of Vinton with reliable high-speed broadband access via a
fiber-to-the-premise (FTTP) network. The assumptions that formulate the business plan are
derived from a variety of sources such as vendor estimates, industry metrics, historical
trends, as well as data gathered through conversations and interviews with interested
parties. Specifically, the five (5) year proforma uses the following fundamental assumptions
to create the Profit and Loss, Balance Sheet and Cash Flow statements shown in Appendix C. 1. Capital cost of cable, electronics, work equipment, buildings $8.9M
2. 100% of capital cost is financed at a rate of 4.5% with a 20-year amortization.
3. 2,100 business and residential locations passed.
4. Voice service take rate of 35% in year 1 decreasing to 30% in year 5 for residential customers and 40% in year 1 – 5 for business customers.
5. Video service take rate of 35% in year 1 decreasing to 30% in year 5 for residential
customers and 10% in year 1 – 5 for business customers
6. High speed data service take rate of 40% in year 1 growing to 62% in year 5 for residential and 40% in year 1 growing to 62% in year 5 for business customers.
7. Net Revenue available for operating and financing expenses are dominantly driven by
the residential and business data service subscription and service rates. Voice and
video services provide a very small contribution for operating and financing expenses.
8. Operations expenses provided by Vinton Broadband (network, customer service and
management) are based on a personnel and equipment model that will support the
network’s operation throughout the life of the network including the first 5 years in
this study. One recommendation we make is to solicit bids from regional providers to
perform some or all the operations during the first five years and bring on staff and
equipment as the growth of the network occurs. The financial model responses to
Page 22 of 59
any savings in operational expenses are very positive especially in the early years of
the project.
The financial results using these assumptions project the project to have positive net
income in year 5, cash flow in year 4, Times Interest Earned Ratio (TIER) of 1.11 and
Debt Service Coverage (DSC) 1.2 in year 3 increasing to 1.44 in year 5. At these levels of
ratios, the penetration rates included in the study are equivalent to “breakeven” rates.
Some of the key factors in the pro forma financials of the study include:
1. Vinton’s geographic and population size require the financials to support a
proportionally larger amount of the mainline backbone (feeder and distribution) cable
capital costs compared to other small Iowa municipalities 2 to 3 times Vinton’s size.
The backbone must be sized to serve the entire population even though the Vinton
Broadband would only build drops to actual subscribers.
2. The backbone cable needs to be built completely as opposed to being built in
phases.
3. The operations expenses are based on a fully staffed model for personnel and
equipment. FARR’s experience with other new fiber networks is to outsource most if
not all the early year operations to a third party to gain economies of scale that those
providers may be able to provide to the City. Several neighboring broadband
providers have recently built FTTP networks in their service territories and upon
completion of the fiber networks, their maintenance and repair calls will likely decrease substantially, thereby freeing up resources to be used elsewhere.
4. Based on FARR’s experience with other fiber networks, the best time to acquire
customers is during the construction phase of the project through a “pre-commitment
campaign”. This approach will provide important information regarding expected
customer subscription rates which are critical to the overall financial success of the
project.
5. It is important to begin providing service to customers as soon as the core network is
operational to build operational revenue as quickly as possible.
Additional information regarding key assumptions and other financial highlights are
discussed following. The financial pro forma and additional supporting information can be
found in Appendix C.
Page 23 of 59
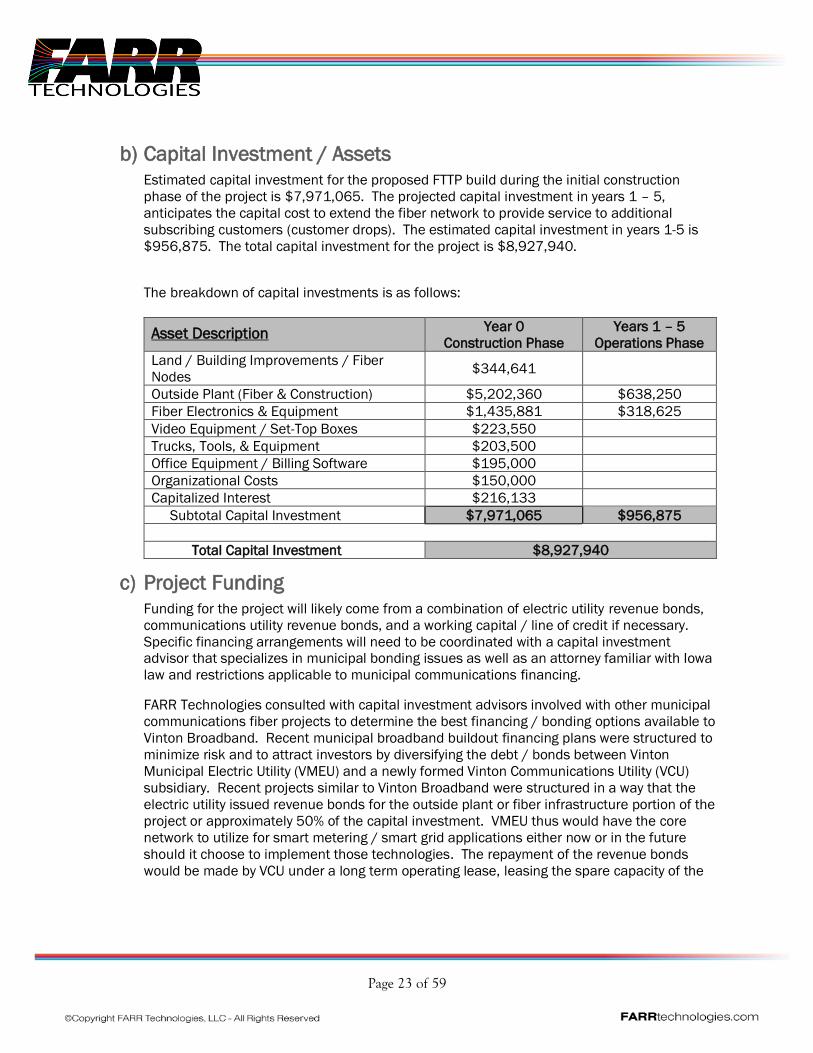
b) Capital Investment / Assets
Estimated capital investment for the proposed FTTP build during the initial construction
phase of the project is $7,971,065. The projected capital investment in years 1 – 5,
anticipates the capital cost to extend the fiber network to provide service to additional
subscribing customers (customer drops). The estimated capital investment in years 1-5 is
$956,875. The total capital investment for the project is $8,927,940.
The breakdown of capital investments is as follows:
Asset Description Year 0
Construction Phase
Years 1 – 5
Operations Phase
Land / Building Improvements / Fiber
Nodes $344,641
Outside Plant (Fiber & Construction) $5,202,360 $638,250
Fiber Electronics & Equipment $1,435,881 $318,625
Video Equipment / Set-Top Boxes $223,550
Trucks, Tools, & Equipment $203,500
Office Equipment / Billing Software $195,000
Organizational Costs $150,000
Capitalized Interest $216,133
Subtotal Capital Investment $7,971,065 $956,875
Total Capital Investment $8,927,940
c) Project Funding
Funding for the project will likely come from a combination of electric utility revenue bonds,
communications utility revenue bonds, and a working capital / line of credit if necessary.
Specific financing arrangements will need to be coordinated with a capital investment advisor that specializes in municipal bonding issues as well as an attorney familiar with Iowa
law and restrictions applicable to municipal communications financing.
FARR Technologies consulted with capital investment advisors involved with other municipal
communications fiber projects to determine the best financing / bonding options available to
Vinton Broadband. Recent municipal broadband buildout financing plans were structured to
minimize risk and to attract investors by diversifying the debt / bonds between Vinton
Municipal Electric Utility (VMEU) and a newly formed Vinton Communications Utility (VCU)
subsidiary. Recent projects similar to Vinton Broadband were structured in a way that the
electric utility issued revenue bonds for the outside plant or fiber infrastructure portion of the
project or approximately 50% of the capital investment. VMEU thus would have the core
network to utilize for smart metering / smart grid applications either now or in the future
should it choose to implement those technologies. The repayment of the revenue bonds
would be made by VCU under a long term operating lease, leasing the spare capacity of the
Page 24 of 59
network for its use. Under this scenario, the remaining capital investment would be financed
by revenue bonds issued by VCU and guaranteed by its operating revenues.
Working capital is extremely important in any start-up business and is also critical to the
success of the Vinton broadband expansion project. Other municipal broadband projects
have included working capital financing arrangements which are loaned from electric utility or city cash reserves if available. Working capital loans are necessary to pay operating
expenses and debt service payments while customer penetration is ramping up in the early
years of the project. Loans can range from 10 – 30% of the overall capital investment and
are typically set up under line-of-credit arrangements with advances only when necessary for
cash flow needs. These intergovernmental loans typically carry a lower interest and is
governed by Iowa law. As the proposed fiber project moves forward, we encourage Vinton
Broadband to make provisions for a working capital line of credit, however, the current pro
forma does not reflect a working capital loan as cash flow is sufficient without the additional
funding with current assumptions.
For the purposes of this feasibility study, the project is financed utilizing a single loan
amortization schedule with terms and average interest rates consistent with a bond issue
similar to that described above. Additionally, organizational costs of $150,000 are included
in the capital investment total to fund bond issue costs.
The pro forma financial statements contain the following assumptions to finance capital
investments for the Vinton Broadband expansion project:
Financing Terms - The pro forma contains financing for 100% of the capital investment
required through year 5 of the financial projection or $8,927,940. Other financing terms
assumed in the pro forma are: (1) Repayment Term of 20 years; (2) 4.5% annual interest
rate; (3) Loan advances during construction phase as needed for construction; (4)
Construction phase (Year 0) accrued interest capitalized and included in financing amount;
(5) Quarterly principal and interest payments begin in Year 1.
d) Financing Alternatives
FARR Technologies also considered the following loan/grant programs to fund the Vinton
Broadband buildout project.
• USDA COMMUNITY CONNECT GRANTS
Purpose: To fund broadband deployment through grants into rural communities where it
is not economically viable for private sector providers to deliver service.
Funding: Up to $3,000,000 Grant, requires 15% matching funds.
Uses of Funds: Construction, acquisition or leasing of facilities, spectrum, land or
buildings used to deploy broadband service for:
• All residential & business customers located in the proposed funded service area
Page 25 of 59
• All participating critical community facilities (such as public schools, fire stations, and public libraries)
o Cost of providing broadband service free of charge to the critical
community facilities for 2 years
Eligibility: Rural areas that lack any existing broadband speed of 4 Mbps downstream
and 1 Mbps upstream are eligible.
COMMENTS: Vinton Broadband is not eligible for funding under this program due to the
fact that both Mediacom and CenturyLink offer broadband service of at least 4 Mbps
downstream and 1 Mbps upstream.
• USDA RURAL BROADBAND ACCESS LOAN AND LOAN GUARANTEE PROGRAM
Purpose: To furnishes loans and loan guarantees to provide funds for the costs of
construction, improvement, or acquisition of facilities and equipment needed to provide
service at the broadband lending speed in eligible rural areas.
Funding: Up to $10,000,000 cost of money loan, requires 10% equity match
(requirement may be satisfied by issuing general obligation bonds).
Uses of Funds: Construction and / or acquisition or leasing of facilities used to deploy
broadband service of at least 25 Mbps downstream and 3 Mbps upstream.
Eligibility:
• Rural areas where at least 15% of the proposed funded service area are considered unserved (lack access to broadband at speeds of 10 Mbps
downstream and 1 Mbps upstream are eligible.
• No part of the proposed funded service area has three or more “incumbent service providers.”
COMMENTS: Vinton Broadband is not eligible for funding under this program due to the
fact that both Mediacom and CenturyLink offer broadband service of at least 10 Mbps
downstream and 1 Mbps upstream.
• USDA Rural Utilities Service – Electric Program: Leveraging Smart Grid
Investments for Rural Broadband Deployment
Purpose: To promote smart grid deployment among electric utilities serving rural
customers. Provides loans to fund: 1) smart grid initiatives; 2) communications facilities
for energy management; 3) fiber to the meter for increased energy efficiency initiatives;
4) to aid in the support and deployment of broadband through the use of those facilities
implemented for smart grid purposes.

Page 26 of 59
Funding: Part of the RUS Electric program annual loan budget of $5.5 billion.
Uses of Funds: Construction of facilities used for fully integrated “smart grid” purposes,
including fiber connections directly to the meters of electric service. However, the RUS
electric program cannot be used to solely to finance the delivery of broadband services to
consumers. Expenditures for smart grid must be funded separately from broadband infrastructure funding. Necessitates utilizing both the electric program and the
telecommunications program.
Eligibility:
• Must segregate and/or allocate smart grid expenditures separately from consumer broadband capital expenditures.
• Consumer broadband infrastructure allocation would need to be funded separately through the RUS Broadband program, equity, or other financing
source.
COMMENTS: Although Vinton Broadband may on the surface be eligible for funding
through this program, the application process is extremely complex and time
consuming. In addition, this program would only provide a portion of the necessary
funding for the project.
e) Revenues Recurring revenue is directly associated with anticipated customer subscription estimates for
voice, video, and broadband services. The results of the City’s 2015 special election to
approve a municipal telecommunications utility for Vinton indicated that quality broadband,
services are in high demand. Although customers may also indicate high demand for video
and voice services, nationally, the trends for traditional subscription cable TV and wireline
voice services are declining. Residential subscription / customer penetration rates are
applied to the total estimated residential locations of 2,000 and the business subscription /
customer penetration rates are applied to the total estimated business locations of 220.
Detailed forecasted subscription / customer penetration rates utilized in the pro forma
financial projections are provided in Appendix C:
Broadband – Broadband revenue is the primary revenue source in the Vinton Broadband
feasibility study. The initial broadband subscription rate of 40% in Year 1 was estimated as
an achievable level of customer penetration taking into consideration Residents
overwhelming approval of the communication utility, and a substantial marketing “blitz” to
roll out the new FTTH service. The customer penetration rate applies equally to residential
and business locations. Customer penetration rates are vitally important to the pro forma
because of the size of the community. The capital investment necessary for Vinton’s core
network could support a much larger community. Communications is an extremely capital
intensive business and in order to create a successful business plan a minimum level of customer penetration. Based on the current assumptions contained in the pro forma, a 62%
penetration of broadband service is the level that creates both positive cash flow and
profitability and is the “breakeven” level for the proposed FTTP buildout.
Page 27 of 59
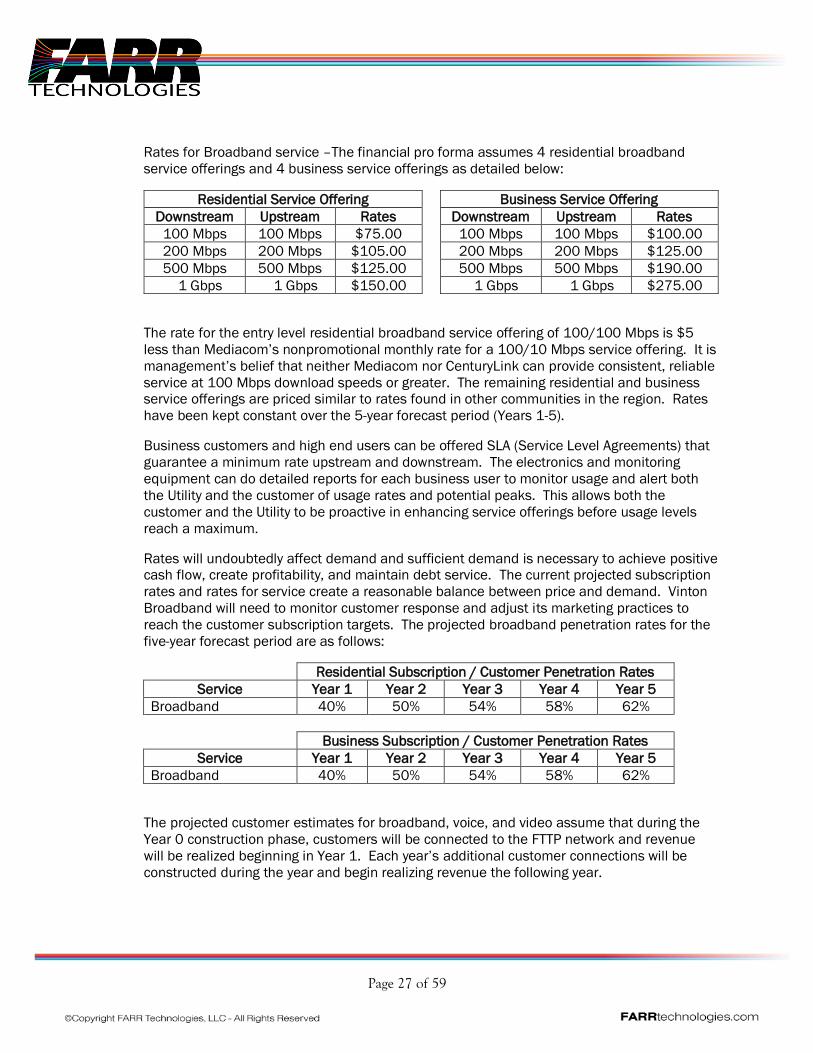
Rates for Broadband service –The financial pro forma assumes 4 residential broadband
service offerings and 4 business service offerings as detailed below:
Residential Service Offering Business Service Offering
Downstream Upstream Rates Downstream Upstream Rates
100 Mbps 100 Mbps $75.00 100 Mbps 100 Mbps $100.00
200 Mbps 200 Mbps $105.00 200 Mbps 200 Mbps $125.00
500 Mbps 500 Mbps $125.00 500 Mbps 500 Mbps $190.00
1 Gbps 1 Gbps $150.00 1 Gbps 1 Gbps $275.00
The rate for the entry level residential broadband service offering of 100/100 Mbps is $5
less than Mediacom’s nonpromotional monthly rate for a 100/10 Mbps service offering. It is
management’s belief that neither Mediacom nor CenturyLink can provide consistent, reliable
service at 100 Mbps download speeds or greater. The remaining residential and business service offerings are priced similar to rates found in other communities in the region. Rates
have been kept constant over the 5-year forecast period (Years 1-5).
Business customers and high end users can be offered SLA (Service Level Agreements) that
guarantee a minimum rate upstream and downstream. The electronics and monitoring
equipment can do detailed reports for each business user to monitor usage and alert both
the Utility and the customer of usage rates and potential peaks. This allows both the
customer and the Utility to be proactive in enhancing service offerings before usage levels
reach a maximum.
Rates will undoubtedly affect demand and sufficient demand is necessary to achieve positive cash flow, create profitability, and maintain debt service. The current projected subscription
rates and rates for service create a reasonable balance between price and demand. Vinton
Broadband will need to monitor customer response and adjust its marketing practices to
reach the customer subscription targets. The projected broadband penetration rates for the
five-year forecast period are as follows:
Residential Subscription / Customer Penetration Rates
Service Year 1 Year 2 Year 3 Year 4 Year 5
Broadband 40% 50% 54% 58% 62%
Business Subscription / Customer Penetration Rates
Service Year 1 Year 2 Year 3 Year 4 Year 5
Broadband 40% 50% 54% 58% 62%
The projected customer estimates for broadband, voice, and video assume that during the
Year 0 construction phase, customers will be connected to the FTTP network and revenue
will be realized beginning in Year 1. Each year’s additional customer connections will be
constructed during the year and begin realizing revenue the following year.

Page 28 of 59
Video – Nationwide trends for small cable television and video service providers shows
operators struggling to make a profit or even to break even. Young adults are no longer
subscribing to traditional cable TV services. Young adults opt instead for low cost or no cost
over the top (OTT) video services such as Netflix and YouTube. These services are streamed
over the internet and have exponentially increased the demand for high speed broadband.
However, among middle aged and older adults, subscription based cable TV services still
maintain strong demand. With these trends in mind, conservative subscription rates have
been projected for video services. Projected customer subscription rates are as follows:
Residential Subscription / Customer Penetration Rates
Service Year 1 Year 2 Year 3 Year 4 Year 5
Video 35% 35% 32% 32% 30%
Business Subscription / Customer Penetration Rates
Service Year 1 Year 2 Year 3 Year 4 Year 5
Video 10% 10% 10% 10% 10%
Higher subscription rates would have relatively insignificant impacts on the financials as
video services are a break-even proposition at best. In analyzing a potential 15% increase in
residential subscription, Gross profit increases by an average of approximately $40,000 per
year. The current proposed video solution projects an approximate 4% gross profit which
leaves little to cover general and administrative expenses. This scenario is common to the
rural video market. Video content costs rise annually making it necessary for video providers
to pass on the increases to customers with no perceived increase in value.
It is important to note however, that our recommendation is that Vinton Broadband offer
video services despite the lack of significant profit potential due to important marketing
implications. By offering video services, Vinton Broadband offers each customer an
opportunity to choose a new provider and thereby disassociates that customer from their
current communications provider.
Video service offering, discussed previously in the technology section, includes the following
packages and rates:
Service Offering Description Proposed Rate
(Year 1)
Basic Local Channels / Religious / Shopping / Etc.
(approx. 25 channels) $35.00
Expanded Basic +
56 SD/HD Channels $86.00
Premium Basic + Expanded +
40 SD/HD Channels $96.00
Based on historical data and industry trends video service rates are projected to increase 6%
annually. Programming costs are also expected to increase 10% per year for Basic and 6%

Page 29 of 59
annually for Expanded and Premium packages. Additional information on the proposed
video services are included in Appendix C.
Voice –Competitive local exchange carriers (CLEC) historically could rely on multiple revenue
sources from wireline voice services as a new entrant into the market. CLEC’s earned local
service revenue from basic dial tone service, long distance revenue, access revenue from long distance carriers, and in some cases per line subsidies from high cost universal service
support. These historical revenue sources, particularly, universal support and access
revenue, have been significantly decreased if not eliminated due to regulatory reforms.
Competition from IP long distance providers has also reduced potential revenue from per
minute long distance charges.
Nationally, wireline voice services have been steadily declining for many years due in large
part to wireless substitution. The Federal Communications Commission (FCC) reports that
cellphones have overtaken the number traditional wireline phones. That disparity continues
to grow year after year, however, surveys indicate that rural wireline voice subscription is
stronger in rural markets. Considering these national and regional trends, wireline voice
service subscription rates are expected to decrease over the forecast period. Business
subscription will be higher due to the need for multiline service requirements. Businesses will
tend to maintain wireline services because business phone numbers are published in yellow
page and other directories. The projected customer subscription rates for residential
customers and business customers are as follows:
Residential Subscription / Customer Penetration Rates
Service Year 1 Year 2 Year 3 Year 4 Year 5
Voice 35% 35% 32% 32% 32%
Business Subscription / Customer Penetration Rates
Service Year 1 Year 2 Year 3 Year 4 Year 5
Voice 40% 40% 40% 40% 40%
The proposed voice offering is based on a hybrid “wholesale” model where the fiber optic
connection to the customer is leased by an authorized CLEC certified by the Iowa Utilities
Board (IUB) to provide voice services in Vinton. In general, the CLEC leases residential lines
from Vinton Broadband for $10 per residential voice line per month and $15 per business
voice line per month. The arrangement provides additional revenue for a 2nd residential line
and multiline business services, however, those revenues have not been projected in the pro
forma due to a lack of data on which to base a projection. Additional information on the
proposed voice services are included in Appendix C.
Miscellaneous Revenue – During the construction phase customers will be given the option
to subscribe to Vinton Broadband services. Fiber optic cable will not be placed to residence
and business locations which decline service during the construction phase in an effort to
hold down capital costs. If a customer subsequently subscribes to service during Year 1-5,
customers will be charged a portion of the cost to construct the fiber facilities to their
Page 30 of 59
location. The pro forma projects 48 new residential customers and 6 new business
customers annually in Years 1-5 during the forecast period. Residential customers will pay
$250 and businesses will pay $1,000 as a nonrecurring contribution toward the cost to
construct the customer fiber facility to their location.
The pro forma also has a provision for uncollectible revenue estimated at 1% of gross revenue.
f) Expenses
Expenses were projected based on historical trends experienced by other communications
providers and specific estimates associated with the proposed project. Significant
assumptions are highlighted below:
Personnel / Staffing - Wages, salaries and benefits have been estimated to adequately staff
a standalone communications utility. The pro forma projections include 4 full time (FT) staff
and 2 part-time (PT) staff. Wages, salaries, and benefits are projected to increase 3%
annually through-out the forecast period.
Specific staffing projections include the following positions: 1) General manager, PT; 2)
Accounting staff, PT; 3) FTTH technician lead / manager, FT; 4) FTTH technician, FT; 5)
Customer service supervisor, FT; 6) Customer service staff, FT. The personnel / staffing
expenses are allocated to Plant Specific Operations, Plant Nonspecific Operations, Customer
Operations, and Corporate Operations expense categories consistent with the anticipated job
function.
The communications utility may choose instead to operate the utility through contracted
service providers depending upon the management and organizational structure selected.
Although the expenditures represent an estimate of costs to operate the business with hired employees, the expenditures would offset any services purchased through contract service
providers.
Plant Specific Operations Expense
• Video Expense – Includes Video programming expense, transport fees, and circuit expense. Accounts for between 70% - 73% of total “Plant Specific Operations Expense”.
• FTTH Technician Lead – 50% of wages and benefits for this position are allocated to “Plant Specific Operations Expense”.
• Circuit Lease Expense – Projected cost to connect to internet backbone, underlying voice CLEC provider, and video programming backhaul from video headend provider. Circuit
lease expense is between 10% - 13% of total “Plant Specific Operations Expense”.
• Building Lease Expense – Estimated expense for customer service location, and communications equipment space. Rate is projected to be $7 per square foot / per
month with an estimated 1,080 square foot space required.
• Other expenses – Other expense include; building maintenance, vehicle expense, tools and equipment expense, office equipment expense, computer expense, etc.
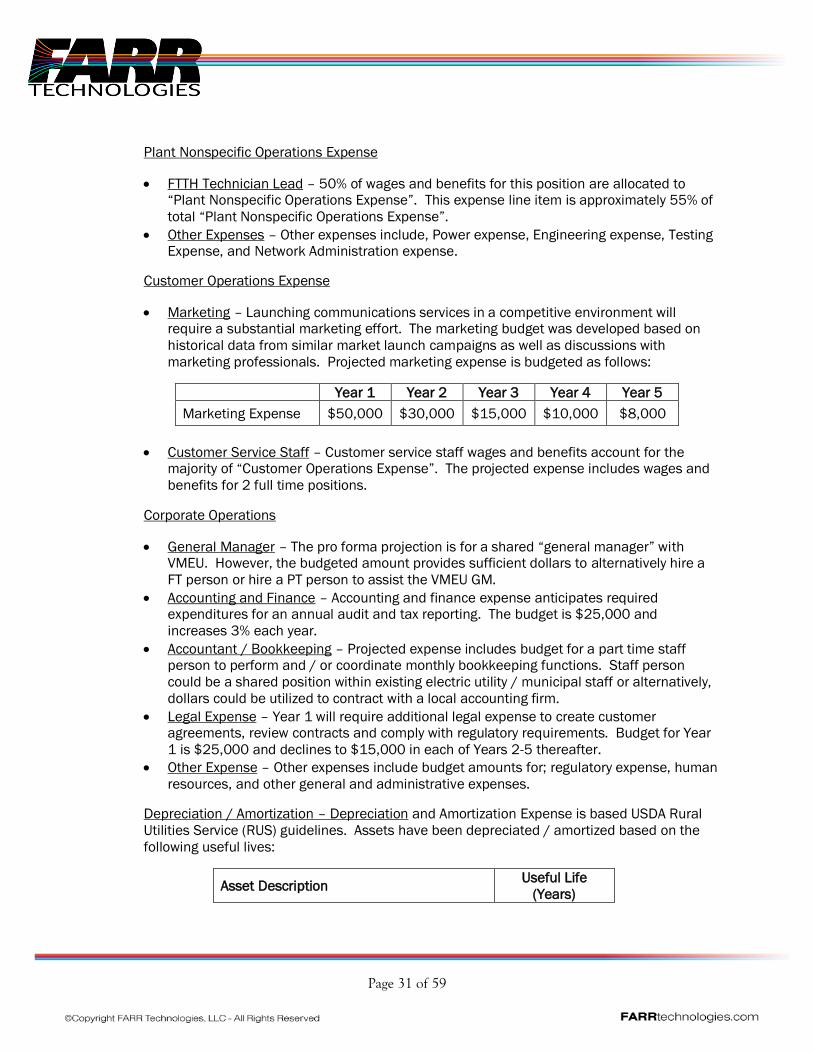
Page 31 of 59
Plant Nonspecific Operations Expense
• FTTH Technician Lead – 50% of wages and benefits for this position are allocated to “Plant Nonspecific Operations Expense”. This expense line item is approximately 55% of
total “Plant Nonspecific Operations Expense”.
• Other Expenses – Other expenses include, Power expense, Engineering expense, Testing Expense, and Network Administration expense.
Customer Operations Expense
• Marketing – Launching communications services in a competitive environment will require a substantial marketing effort. The marketing budget was developed based on
historical data from similar market launch campaigns as well as discussions with
marketing professionals. Projected marketing expense is budgeted as follows:
Year 1 Year 2 Year 3 Year 4 Year 5
Marketing Expense $50,000 $30,000 $15,000 $10,000 $8,000
• Customer Service Staff – Customer service staff wages and benefits account for the majority of “Customer Operations Expense”. The projected expense includes wages and
benefits for 2 full time positions.
Corporate Operations
• General Manager – The pro forma projection is for a shared “general manager” with VMEU. However, the budgeted amount provides sufficient dollars to alternatively hire a
FT person or hire a PT person to assist the VMEU GM.
• Accounting and Finance – Accounting and finance expense anticipates required expenditures for an annual audit and tax reporting. The budget is $25,000 and
increases 3% each year.
• Accountant / Bookkeeping – Projected expense includes budget for a part time staff person to perform and / or coordinate monthly bookkeeping functions. Staff person
could be a shared position within existing electric utility / municipal staff or alternatively,
dollars could be utilized to contract with a local accounting firm.
• Legal Expense – Year 1 will require additional legal expense to create customer agreements, review contracts and comply with regulatory requirements. Budget for Year
1 is $25,000 and declines to $15,000 in each of Years 2-5 thereafter.
• Other Expense – Other expenses include budget amounts for; regulatory expense, human
resources, and other general and administrative expenses.
Depreciation / Amortization – Depreciation and Amortization Expense is based USDA Rural
Utilities Service (RUS) guidelines. Assets have been depreciated / amortized based on the
following useful lives:
Asset Description Useful Life
(Years)
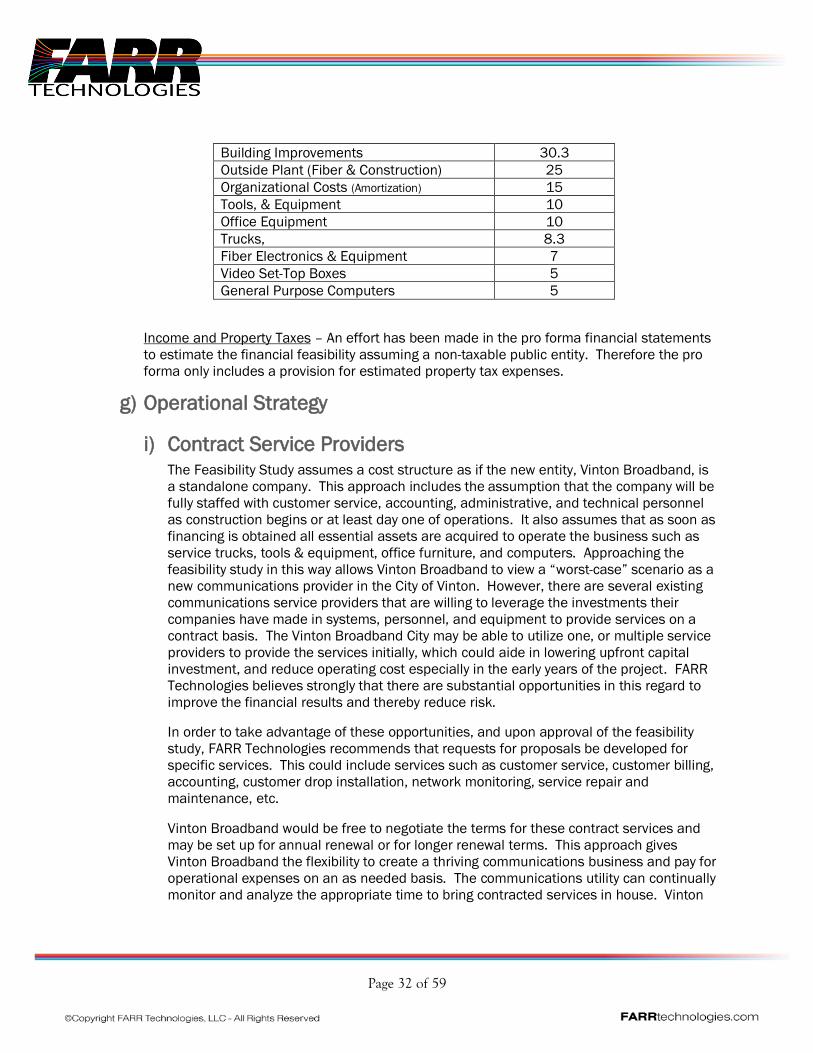
Page 32 of 59
Building Improvements 30.3
Outside Plant (Fiber & Construction) 25
Organizational Costs (Amortization) 15
Tools, & Equipment 10
Office Equipment 10
Trucks, 8.3
Fiber Electronics & Equipment 7
Video Set-Top Boxes 5
General Purpose Computers 5
Income and Property Taxes – An effort has been made in the pro forma financial statements
to estimate the financial feasibility assuming a non-taxable public entity. Therefore the pro
forma only includes a provision for estimated property tax expenses.
g) Operational Strategy
i) Contract Service Providers The Feasibility Study assumes a cost structure as if the new entity, Vinton Broadband, is
a standalone company. This approach includes the assumption that the company will be
fully staffed with customer service, accounting, administrative, and technical personnel
as construction begins or at least day one of operations. It also assumes that as soon as
financing is obtained all essential assets are acquired to operate the business such as
service trucks, tools & equipment, office furniture, and computers. Approaching the
feasibility study in this way allows Vinton Broadband to view a “worst-case” scenario as a
new communications provider in the City of Vinton. However, there are several existing
communications service providers that are willing to leverage the investments their
companies have made in systems, personnel, and equipment to provide services on a
contract basis. The Vinton Broadband City may be able to utilize one, or multiple service
providers to provide the services initially, which could aide in lowering upfront capital
investment, and reduce operating cost especially in the early years of the project. FARR
Technologies believes strongly that there are substantial opportunities in this regard to
improve the financial results and thereby reduce risk.
In order to take advantage of these opportunities, and upon approval of the feasibility
study, FARR Technologies recommends that requests for proposals be developed for
specific services. This could include services such as customer service, customer billing,
accounting, customer drop installation, network monitoring, service repair and
maintenance, etc.
Vinton Broadband would be free to negotiate the terms for these contract services and
may be set up for annual renewal or for longer renewal terms. This approach gives
Vinton Broadband the flexibility to create a thriving communications business and pay for
operational expenses on an as needed basis. The communications utility can continually
monitor and analyze the appropriate time to bring contracted services in house. Vinton
Page 33 of 59
Broadband can determine the optimal time to hire personnel, purchase equipment, and
provide its own back-office support based on cash-flow and the experience it has gained
over the first few years of operation. Conversely, Vinton Broadband may decide to stay
with a “Contracted Services” model into the future.
7) ORGANIZATIONAL STRUCTURE a) Communications Subsidiary
As the Vinton Broadband FTTH project advances beyond the feasibility stage into financing
and construction activities, it is important to give careful consideration to organizational
structure to facilitate effective day to day operations and decision making. FARR
Technologies provides the following recommendations.
i) Vinton’s Communications Utility will need to be established with the assistance of legal
counsel under the laws and regulations of the State of Iowa.
ii) Governing Body –It is important to have unity and consistency between Vinton Municipal
Electric Utility and a newly created Communications Utility. The governing board of the
Communications Utility should be the same board as VMEU.
iii) Administration – Day to day operations, including supervision of staff and coordination
with contract service providers, should be placed under the direction of VMEU’s general
manager or a full-time manager if one is hired. Normally, this is a transitional action that
evolves as the utility matures and revenues and expenses become less fluid. It allows for
the gradual increase in personnel (and associated expenses), if needed, on a timetable
driven by actual revenues and expenses.
8) RECOMMENDATIONS
The results of this broadband feasibility study are based on the best information currently
available.
1. Review and approve feasibility study 2. RFP’s for potential service providers for outsourced operations
3. Seek additional marketing research / surveys to validate package pricing and take rates
4. Begin discussing with capital investment advisor for financing
5. Staking outside plant cable
6. RFQ / RFP for outside plant cable construction and electronics
7. Update pro forma with newly acquired information
Page 34 of 59
APPENDICES
A. Home Values with Broadband Impact - Article
B. Network Design / OSP Layout Diagram
C. Pro Forma Financials
D. SkitterTV Channel Line Up
E. Acronyms / Terms
F. Service Providers / Potential Partners
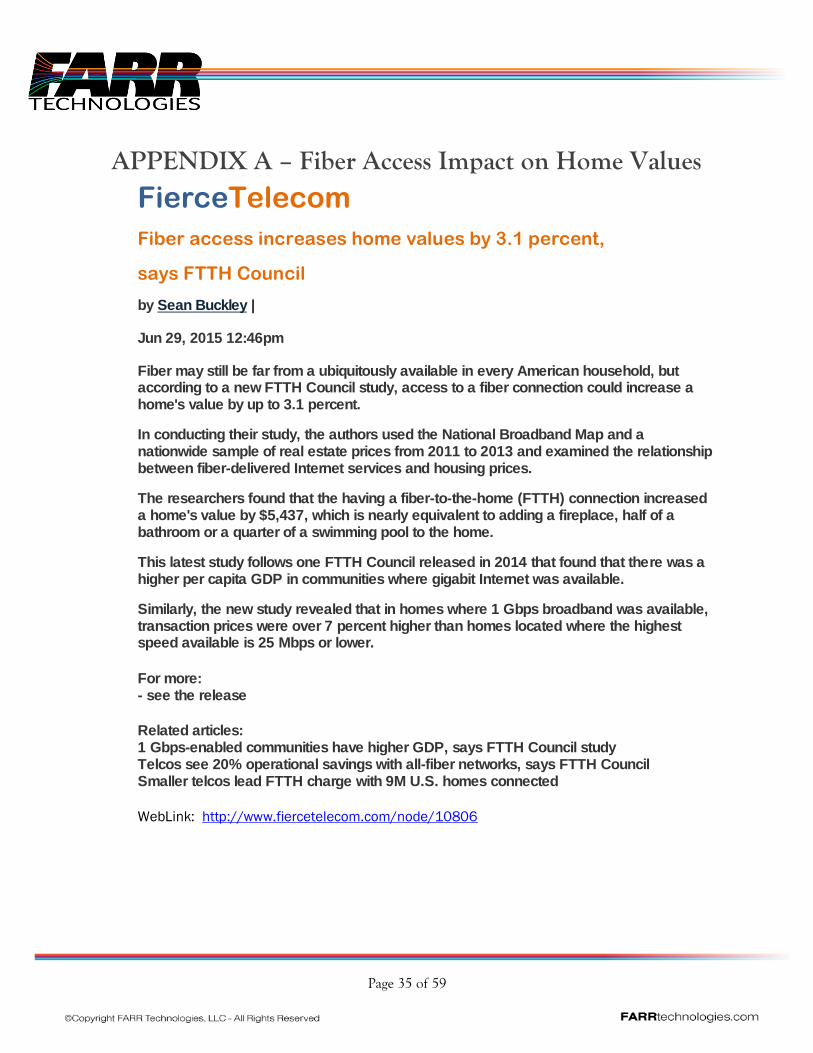
Page 35 of 59
APPENDIX A – Fiber Access Impact on Home Values FierceTelecom
Fiber access increases home values by 3.1 percent,
says FTTH Council
by Sean Buckley |
Jun 29, 2015 12:46pm
Fiber may still be far from a ubiquitously available in every American household, but according to a new FTTH Council study, access to a fiber connection could increase a home's value by up to 3.1 percent.
In conducting their study, the authors used the National Broadband Map and a nationwide sample of real estate prices from 2011 to 2013 and examined the relationship between fiber-delivered Internet services and housing prices.
The researchers found that the having a fiber-to-the-home (FTTH) connection increased a home's value by $5,437, which is nearly equivalent to adding a fireplace, half of a bathroom or a quarter of a swimming pool to the home.
This latest study follows one FTTH Council released in 2014 that found that there was a higher per capita GDP in communities where gigabit Internet was available.
Similarly, the new study revealed that in homes where 1 Gbps broadband was available, transaction prices were over 7 percent higher than homes located where the highest speed available is 25 Mbps or lower.
For more: - see the release
Related articles: 1 Gbps-enabled communities have higher GDP, says FTTH Council study Telcos see 20% operational savings with all-fiber networks, says FTTH Council Smaller telcos lead FTTH charge with 9M U.S. homes connected
WebLink: http://www.fiercetelecom.com/node/10806
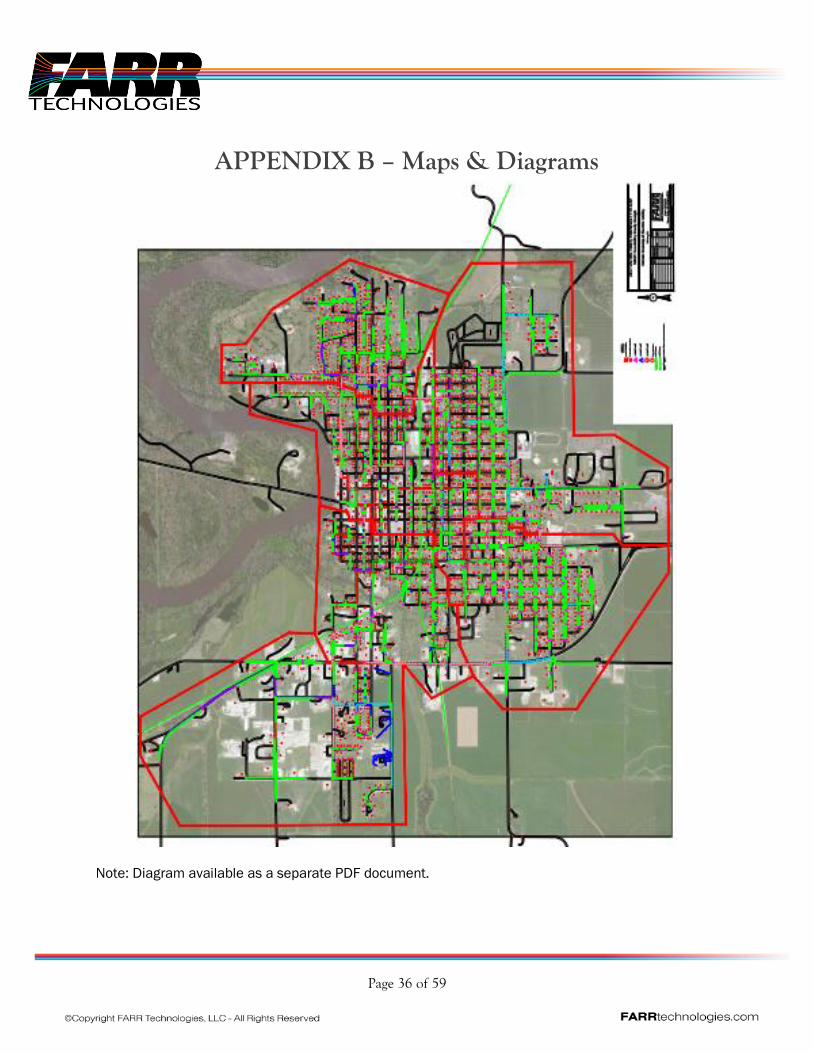
Page 36 of 59
APPENDIX B – Maps & Diagrams
Note: Diagram available as a separate PDF document.
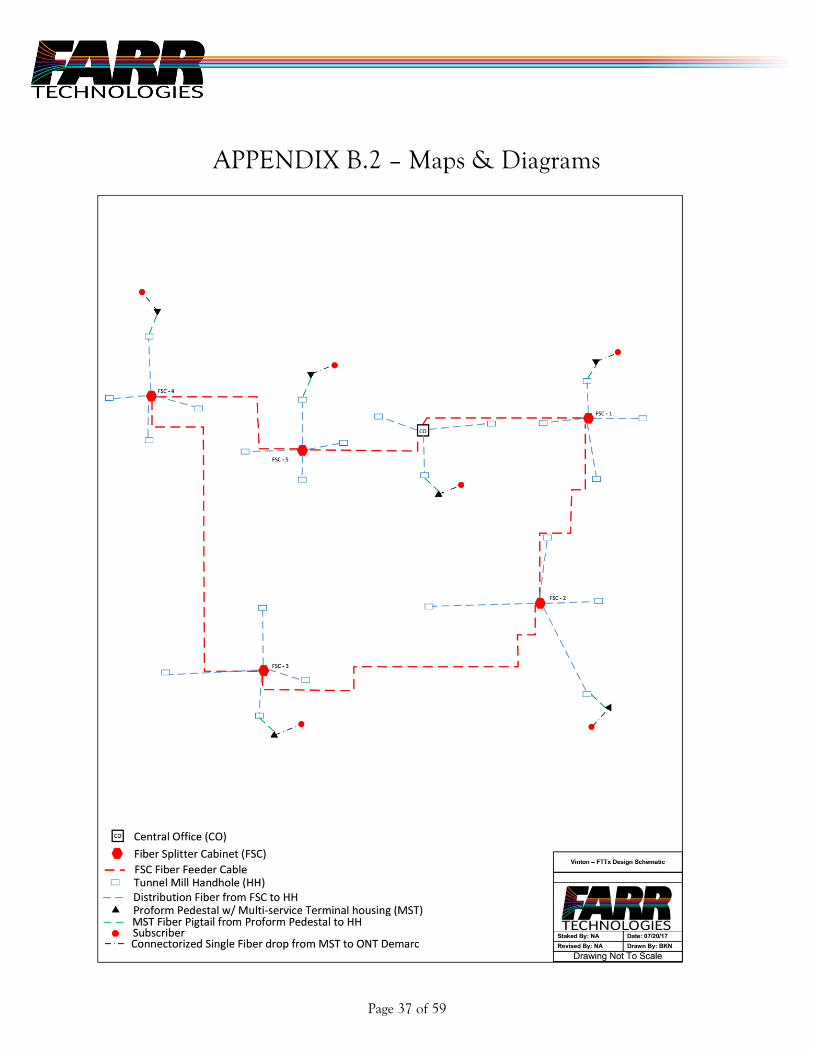
Page 37 of 59
APPENDIX B.2 – Maps & Diagrams
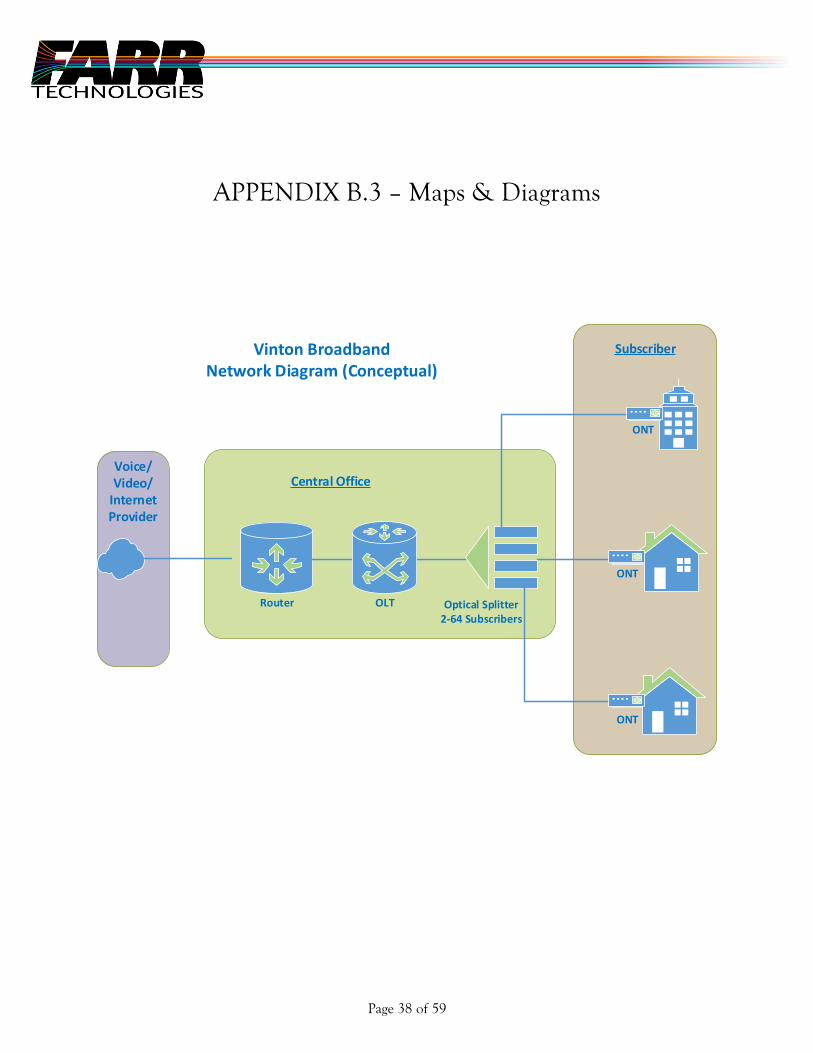
Page 38 of 59
APPENDIX B.3 – Maps & Diagrams
Central OfficeVoice/Video/
Internet Provider
Subscriber
Router OLT Optical Splitter2-64 Subscribers
ONT
ONT
ONT
Vinton BroadbandNetwork Diagram (Conceptual)

Page 39 of 59
APPENDIX C – Pro Forma Financials
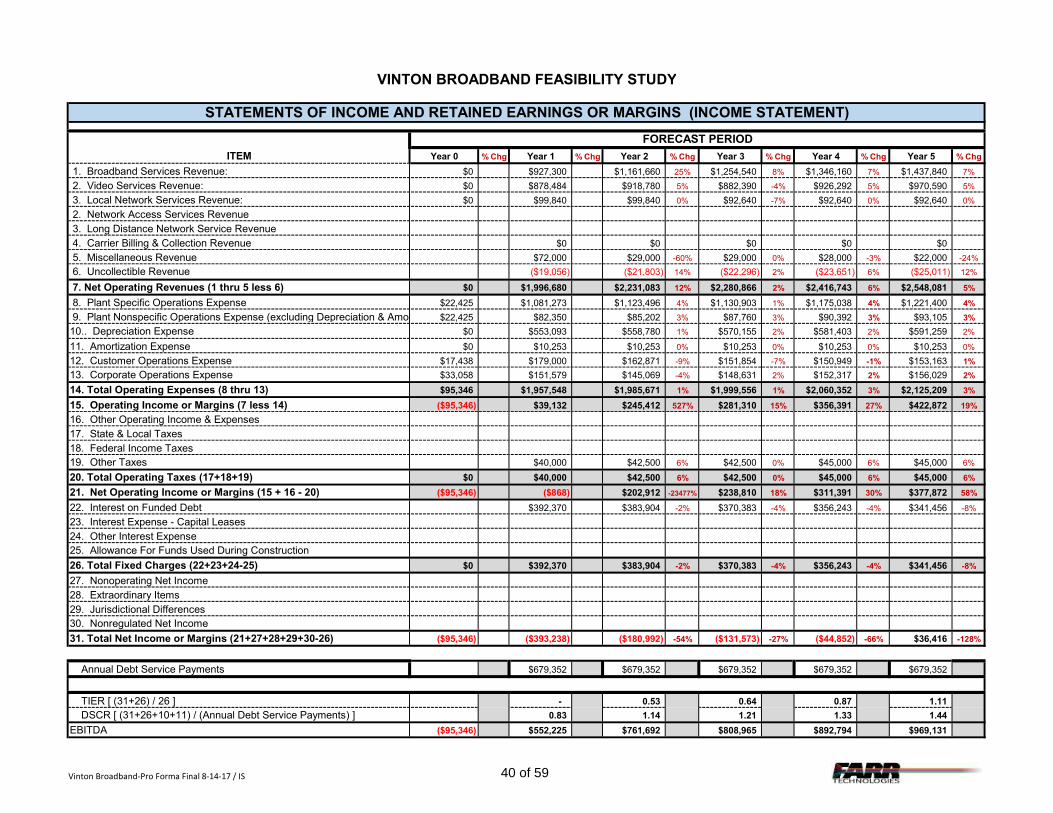
VINTON BROADBAND FEASIBILITY STUDY
ITEM Year 0 % Chg Year 1 % Chg Year 2 % Chg Year 3 % Chg Year 4 % Chg Year 5 % Chg
1. Broadband Services Revenue: $0 $927,300 $1,161,660 25% $1,254,540 8% $1,346,160 7% $1,437,840 7%
2. Video Services Revenue: $0 $878,484 $918,780 5% $882,390 -4% $926,292 5% $970,590 5%
3. Local Network Services Revenue: $0 $99,840 $99,840 0% $92,640 -7% $92,640 0% $92,640 0%
2. Network Access Services Revenue 3. Long Distance Network Service Revenue 4. Carrier Billing & Collection Revenue $0 $0 $0 $0 $0
5. Miscellaneous Revenue $72,000 $29,000 -60% $29,000 0% $28,000 -3% $22,000 -24%
6. Uncollectible Revenue ($19,056) ($21,803) 14% ($22,296) 2% ($23,651) 6% ($25,011) 12%
7. Net Operating Revenues (1 thru 5 less 6) $0 $1,996,680 $2,231,083 12% $2,280,866 2% $2,416,743 6% $2,548,081 5%
8. Plant Specific Operations Expense $22,425 $1,081,273 $1,123,496 4% $1,130,903 1% $1,175,038 4% $1,221,400 4%
9. Plant Nonspecific Operations Expense (excluding Depreciation & Amortization)$22,425 $82,350 $85,202 3% $87,760 3% $90,392 3% $93,105 3%
10.. Depreciation Expense $0 $553,093 $558,780 1% $570,155 2% $581,403 2% $591,259 2%
11. Amortization Expense $0 $10,253 $10,253 0% $10,253 0% $10,253 0% $10,253 0%
12. Customer Operations Expense $17,438 $179,000 $162,871 -9% $151,854 -7% $150,949 -1% $153,163 1%
13. Corporate Operations Expense $33,058 $151,579 $145,069 -4% $148,631 2% $152,317 2% $156,029 2%
14. Total Operating Expenses (8 thru 13) $95,346 $1,957,548 $1,985,671 1% $1,999,556 1% $2,060,352 3% $2,125,209 3%
15. Operating Income or Margins (7 less 14) ($95,346) $39,132 $245,412 527% $281,310 15% $356,391 27% $422,872 19%
16. Other Operating Income & Expenses17. State & Local Taxes18. Federal Income Taxes19. Other Taxes $40,000 $42,500 6% $42,500 0% $45,000 6% $45,000 6%
20. Total Operating Taxes (17+18+19) $0 $40,000 $42,500 6% $42,500 0% $45,000 6% $45,000 6%
21. Net Operating Income or Margins (15 + 16 - 20) ($95,346) ($868) $202,912 -23477% $238,810 18% $311,391 30% $377,872 58%
22. Interest on Funded Debt $392,370 $383,904 -2% $370,383 -4% $356,243 -4% $341,456 -8%
23. Interest Expense - Capital Leases24. Other Interest Expense25. Allowance For Funds Used During Construction
26. Total Fixed Charges (22+23+24-25) $0 $392,370 $383,904 -2% $370,383 -4% $356,243 -4% $341,456 -8%
27. Nonoperating Net Income28. Extraordinary Items29. Jurisdictional Differences30. Nonregulated Net Income
31. Total Net Income or Margins (21+27+28+29+30-26) ($95,346) ($393,238) ($180,992) -54% ($131,573) -27% ($44,852) -66% $36,416 -128%
Annual Debt Service Payments $679,352 $679,352 $679,352 $679,352 $679,352
TIER [ (31+26) / 26 ] - 0.53 0.64 0.87 1.11
DSCR [ (31+26+10+11) / (Annual Debt Service Payments) ] 0.83 1.14 1.21 1.33 1.44
EBITDA ($95,346) $552,225 $761,692 $808,965 $892,794 $969,131
STATEMENTS OF INCOME AND RETAINED EARNINGS OR MARGINS (INCOME STATEMENT)
FORECAST PERIOD
Vinton Broadband-Pro Forma Final 8-14-17 / IS 40 of 59
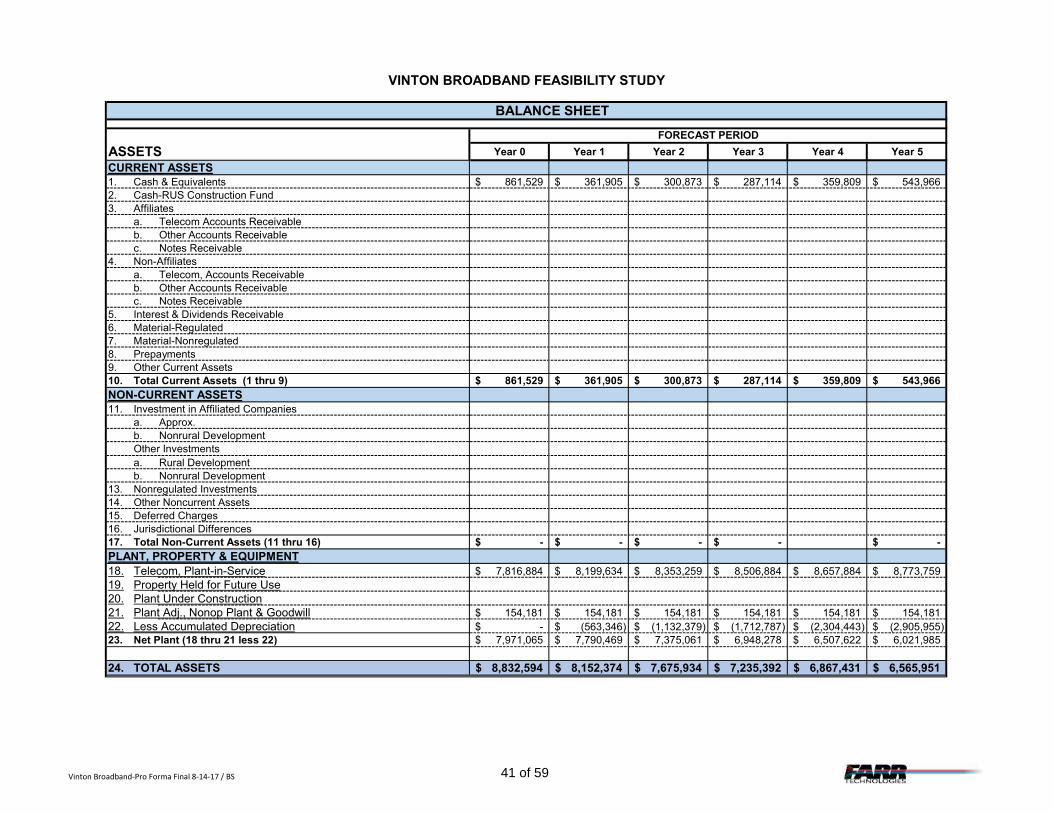
VINTON BROADBAND FEASIBILITY STUDY
ASSETS Year 0 Year 1 Year 2 Year 3 Year 4 Year 5
CURRENT ASSETS1. Cash & Equivalents 861,529$ 361,905$ 300,873$ 287,114$ 359,809$ 543,966$ 2. Cash-RUS Construction Fund3. Affiliates
a. Telecom Accounts Receivableb. Other Accounts Receivablec. Notes Receivable
4. Non-Affiliatesa. Telecom, Accounts Receivableb. Other Accounts Receivablec. Notes Receivable
5. Interest & Dividends Receivable6. Material-Regulated7. Material-Nonregulated8. Prepayments9. Other Current Assets10. Total Current Assets (1 thru 9) 861,529$ 361,905$ 300,873$ 287,114$ 359,809$ 543,966$ NON-CURRENT ASSETS11. Investment in Affiliated Companies
a. Approx.b. Nonrural DevelopmentOther Investmentsa. Rural Developmentb. Nonrural Development
13. Nonregulated Investments14. Other Noncurrent Assets15. Deferred Charges16. Jurisdictional Differences17. Total Non-Current Assets (11 thru 16) -$ -$ -$ -$ -$ PLANT, PROPERTY & EQUIPMENT18. Telecom, Plant-in-Service 7,816,884$ 8,199,634$ 8,353,259$ 8,506,884$ 8,657,884$ 8,773,759$ 19. Property Held for Future Use20. Plant Under Construction21. Plant Adj., Nonop Plant & Goodwill 154,181$ 154,181$ 154,181$ 154,181$ 154,181$ 154,181$ 22. Less Accumulated Depreciation -$ (563,346)$ (1,132,379)$ (1,712,787)$ (2,304,443)$ (2,905,955)$ 23. Net Plant (18 thru 21 less 22) 7,971,065$ 7,790,469$ 7,375,061$ 6,948,278$ 6,507,622$ 6,021,985$
24. TOTAL ASSETS 8,832,594$ 8,152,374$ 7,675,934$ 7,235,392$ 6,867,431$ 6,565,951$
BALANCE SHEET
FORECAST PERIOD
Vinton Broadband-Pro Forma Final 8-14-17 / BS 41 of 59
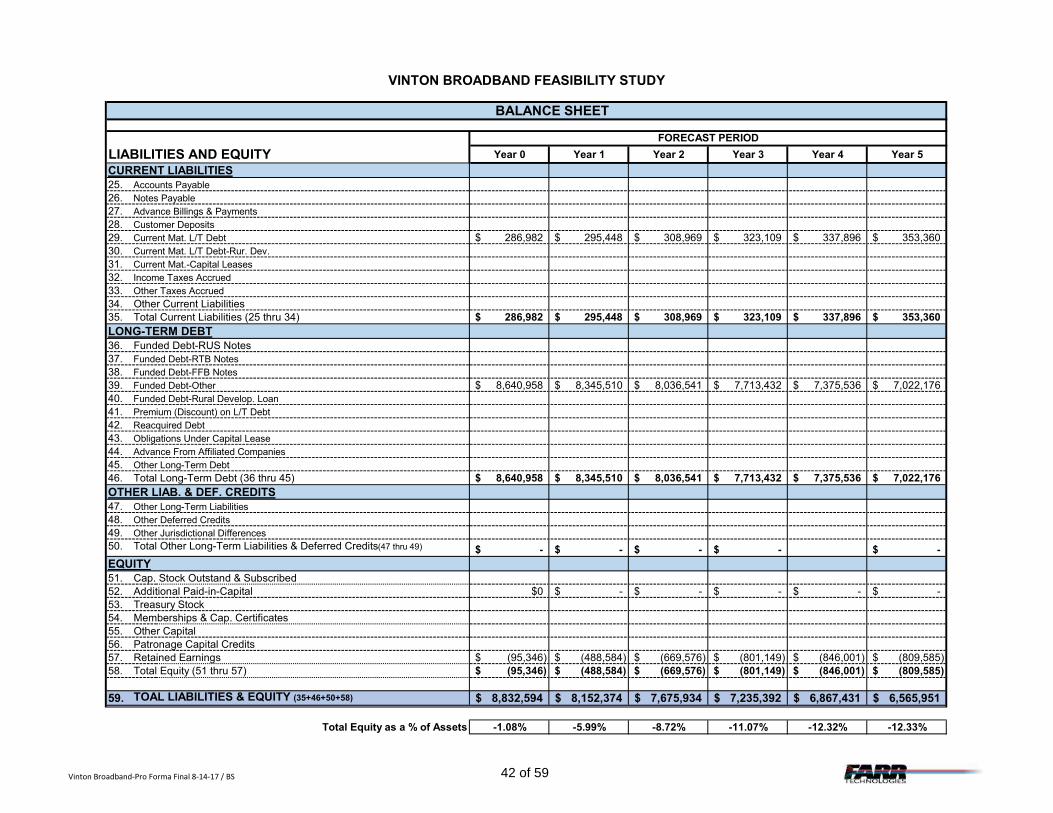
VINTON BROADBAND FEASIBILITY STUDY
BALANCE SHEET
LIABILITIES AND EQUITY Year 0 Year 1 Year 2 Year 3 Year 4 Year 5
CURRENT LIABILITIES25. Accounts Payable26. Notes Payable27. Advance Billings & Payments28. Customer Deposits29. Current Mat. L/T Debt 286,982$ 295,448$ 308,969$ 323,109$ 337,896$ 353,360$ 30. Current Mat. L/T Debt-Rur. Dev.31. Current Mat.-Capital Leases32. Income Taxes Accrued33. Other Taxes Accrued34. Other Current Liabilities35. Total Current Liabilities (25 thru 34) 286,982$ 295,448$ 308,969$ 323,109$ 337,896$ 353,360$ LONG-TERM DEBT36. Funded Debt-RUS Notes37. Funded Debt-RTB Notes38. Funded Debt-FFB Notes39. Funded Debt-Other 8,640,958$ 8,345,510$ 8,036,541$ 7,713,432$ 7,375,536$ 7,022,176$ 40. Funded Debt-Rural Develop. Loan41. Premium (Discount) on L/T Debt 42. Reacquired Debt43. Obligations Under Capital Lease44. Advance From Affiliated Companies45. Other Long-Term Debt46. Total Long-Term Debt (36 thru 45) 8,640,958$ 8,345,510$ 8,036,541$ 7,713,432$ 7,375,536$ 7,022,176$ OTHER LIAB. & DEF. CREDITS47. Other Long-Term Liabilities48. Other Deferred Credits49. Other Jurisdictional Differences50. -$ -$ -$ -$ -$ EQUITY51. Cap. Stock Outstand & Subscribed52. Additional Paid-in-Capital $0 -$ -$ -$ -$ -$ 53. Treasury Stock54. Memberships & Cap. Certificates55. Other Capital56. Patronage Capital Credits57. Retained Earnings (95,346)$ (488,584)$ (669,576)$ (801,149)$ (846,001)$ (809,585)$ 58. Total Equity (51 thru 57) (95,346)$ (488,584)$ (669,576)$ (801,149)$ (846,001)$ (809,585)$
59. TOAL LIABILITIES & EQUITY (35+46+50+58) 8,832,594$ 8,152,374$ 7,675,934$ 7,235,392$ 6,867,431$ 6,565,951$
Total Equity as a % of Assets -1.08% -5.99% -8.72% -11.07% -12.32% -12.33%
Total Other Long-Term Liabilities & Deferred Credits(47 thru 49)
FORECAST PERIOD
Vinton Broadband-Pro Forma Final 8-14-17 / BS 42 of 59
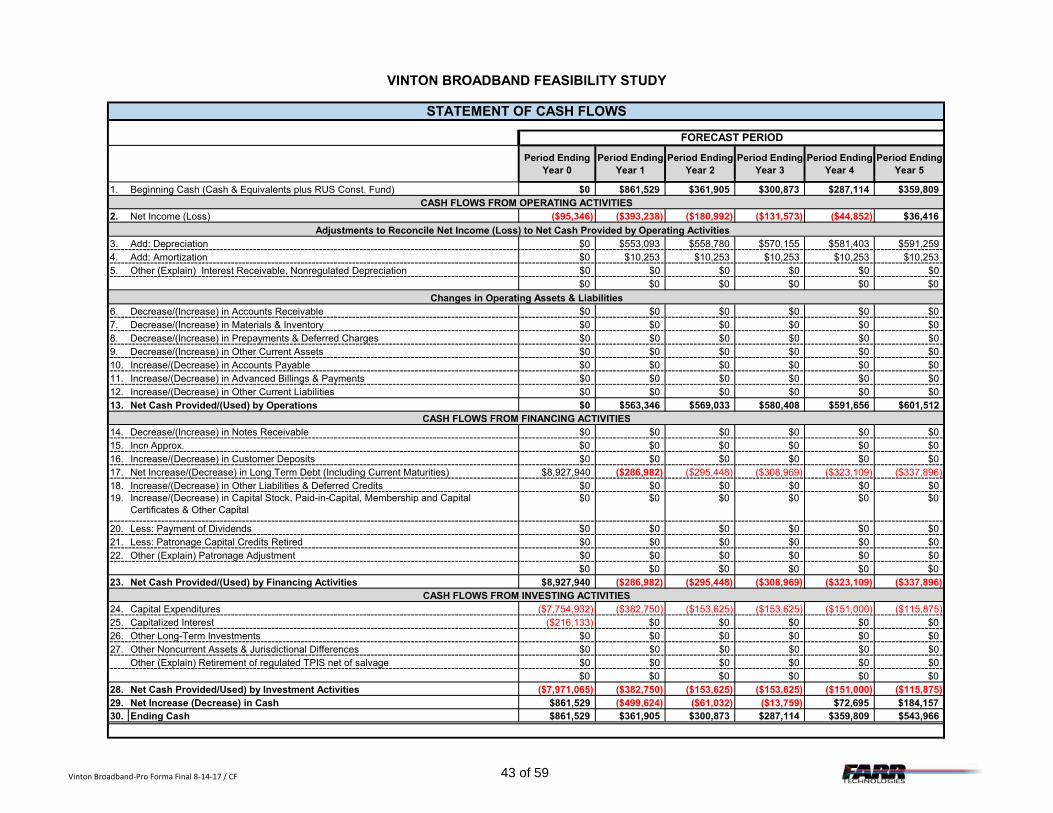
VINTON BROADBAND FEASIBILITY STUDY
Period Ending Year 0
Period Ending Year 1
Period Ending Year 2
Period Ending Year 3
Period Ending Year 4
Period Ending Year 5
1. Beginning Cash (Cash & Equivalents plus RUS Const. Fund) $0 $861,529 $361,905 $300,873 $287,114 $359,809CASH FLOWS FROM OPERATING ACTIVITIES
2. Net Income (Loss) ($95,346) ($393,238) ($180,992) ($131,573) ($44,852) $36,416
Adjustments to Reconcile Net Income (Loss) to Net Cash Provided by Operating Activities 3. Add: Depreciation $0 $553,093 $558,780 $570,155 $581,403 $591,2594. Add: Amortization $0 $10,253 $10,253 $10,253 $10,253 $10,2535. Other (Explain) Interest Receivable, Nonregulated Depreciation $0 $0 $0 $0 $0 $0
$0 $0 $0 $0 $0 $0
Changes in Operating Assets & Liabilities6. Decrease/(Increase) in Accounts Receivable $0 $0 $0 $0 $0 $07. Decrease/(Increase) in Materials & Inventory $0 $0 $0 $0 $0 $08. Decrease/(Increase) in Prepayments & Deferred Charges $0 $0 $0 $0 $0 $09. Decrease/(Increase) in Other Current Assets $0 $0 $0 $0 $0 $010. Increase/(Decrease) in Accounts Payable $0 $0 $0 $0 $0 $011. Increase/(Decrease) in Advanced Billings & Payments $0 $0 $0 $0 $0 $012. Increase/(Decrease) in Other Current Liabilities $0 $0 $0 $0 $0 $013. Net Cash Provided/(Used) by Operations $0 $563,346 $569,033 $580,408 $591,656 $601,512
CASH FLOWS FROM FINANCING ACTIVITIES14. Decrease/(Increase) in Notes Receivable $0 $0 $0 $0 $0 $015. Increase/(Decrease) in Notes PayableApprox. $0 $0 $0 $0 $0 $016. Increase/(Decrease) in Customer Deposits $0 $0 $0 $0 $0 $017. Net Increase/(Decrease) in Long Term Debt (Including Current Maturities) $8,927,940 ($286,982) ($295,448) ($308,969) ($323,109) ($337,896)18. Increase/(Decrease) in Other Liabilities & Deferred Credits $0 $0 $0 $0 $0 $019. $0 $0 $0 $0 $0 $0
20. Less: Payment of Dividends $0 $0 $0 $0 $0 $021. Less: Patronage Capital Credits Retired $0 $0 $0 $0 $0 $022. Other (Explain) Patronage Adjustment $0 $0 $0 $0 $0 $0
$0 $0 $0 $0 $0 $023. Net Cash Provided/(Used) by Financing Activities $8,927,940 ($286,982) ($295,448) ($308,969) ($323,109) ($337,896)
CASH FLOWS FROM INVESTING ACTIVITIES24. Capital Expenditures ($7,754,932) ($382,750) ($153,625) ($153,625) ($151,000) ($115,875)25. Capitalized Interest ($216,133) $0 $0 $0 $0 $026. Other Long-Term Investments $0 $0 $0 $0 $0 $027. Other Noncurrent Assets & Jurisdictional Differences $0 $0 $0 $0 $0 $0
Other (Explain) Retirement of regulated TPIS net of salvage $0 $0 $0 $0 $0 $0$0 $0 $0 $0 $0 $0
28. Net Cash Provided/Used) by Investment Activities ($7,971,065) ($382,750) ($153,625) ($153,625) ($151,000) ($115,875)29. Net Increase (Decrease) in Cash $861,529 ($499,624) ($61,032) ($13,759) $72,695 $184,15730. Ending Cash $861,529 $361,905 $300,873 $287,114 $359,809 $543,966
Increase/(Decrease) in Capital Stock, Paid-in-Capital, Membership and Capital Certificates & Other Capital
STATEMENT OF CASH FLOWS
FORECAST PERIOD
Vinton Broadband-Pro Forma Final 8-14-17 / CF 43 of 59
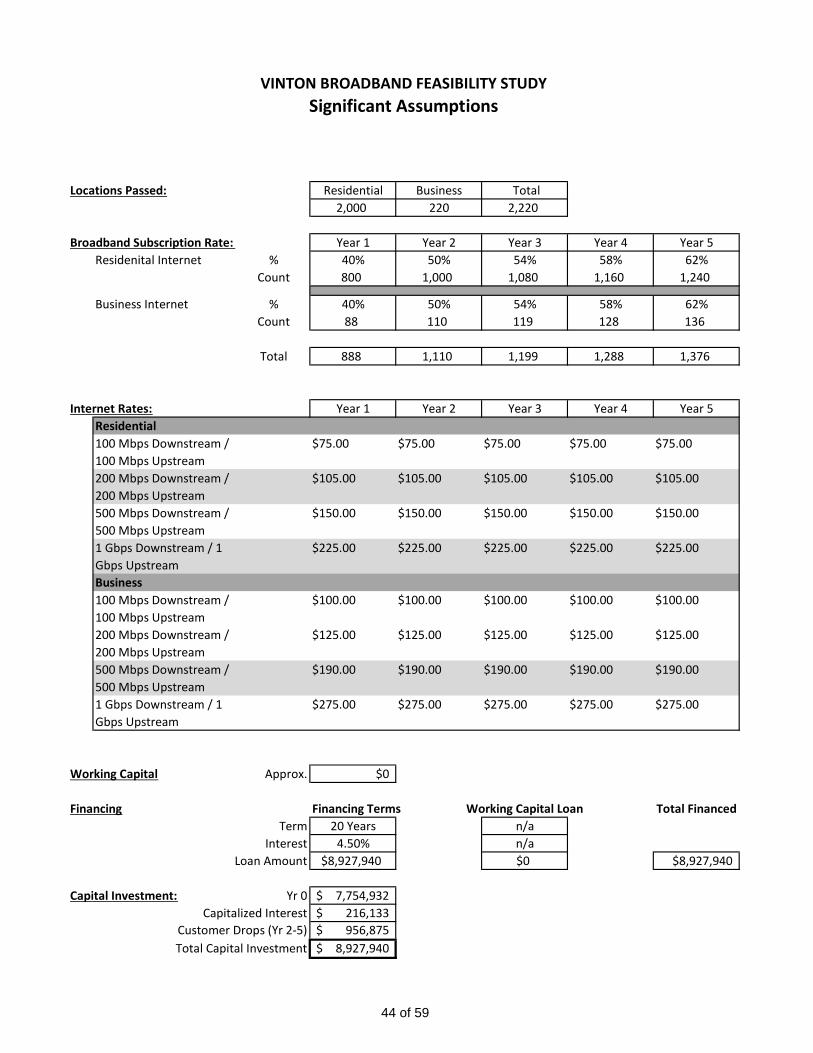
VINTON BROADBAND FEASIBILITY STUDYSignificant Assumptions
0
Locations Passed: Residential Business Total2,000 220 2,220
Broadband Subscription Rate: Year 1 Year 2 Year 3 Year 4 Year 5Residenital Internet % 40% 50% 54% 58% 62%
Count 800 1,000 1,080 1,160 1,240
Business Internet % 40% 50% 54% 58% 62%Count 88 110 119 128 136
Total 888 1,110 1,199 1,288 1,376
Internet Rates: Year 1 Year 2 Year 3 Year 4 Year 5Residential 100 Mbps Downstream / 100 Mbps Upstream
$75.00 $75.00 $75.00 $75.00 $75.00
200 Mbps Downstream / 200 Mbps Upstream
$105.00 $105.00 $105.00 $105.00 $105.00
500 Mbps Downstream / 500 Mbps Upstream
$150.00 $150.00 $150.00 $150.00 $150.00
1 Gbps Downstream / 1 Gbps Upstream
$225.00 $225.00 $225.00 $225.00 $225.00
Business100 Mbps Downstream / 100 Mbps Upstream
$100.00 $100.00 $100.00 $100.00 $100.00
200 Mbps Downstream / 200 Mbps Upstream
$125.00 $125.00 $125.00 $125.00 $125.00
500 Mbps Downstream / 500 Mbps Upstream
$190.00 $190.00 $190.00 $190.00 $190.00
1 Gbps Downstream / 1 Gbps Upstream
$275.00 $275.00 $275.00 $275.00 $275.00
Working Capital Approx. $0
Financing Financing Terms Working Capital Loan Total FinancedTerm 20 Years n/a
Interest 4.50% n/aLoan Amount $8,927,940 $0 $8,927,940
Capital Investment: Yr 0 7,754,932$ Capitalized Interest 216,133$
Customer Drops (Yr 2-5) 956,875$ Total Capital Investment 8,927,940$
44 of 59
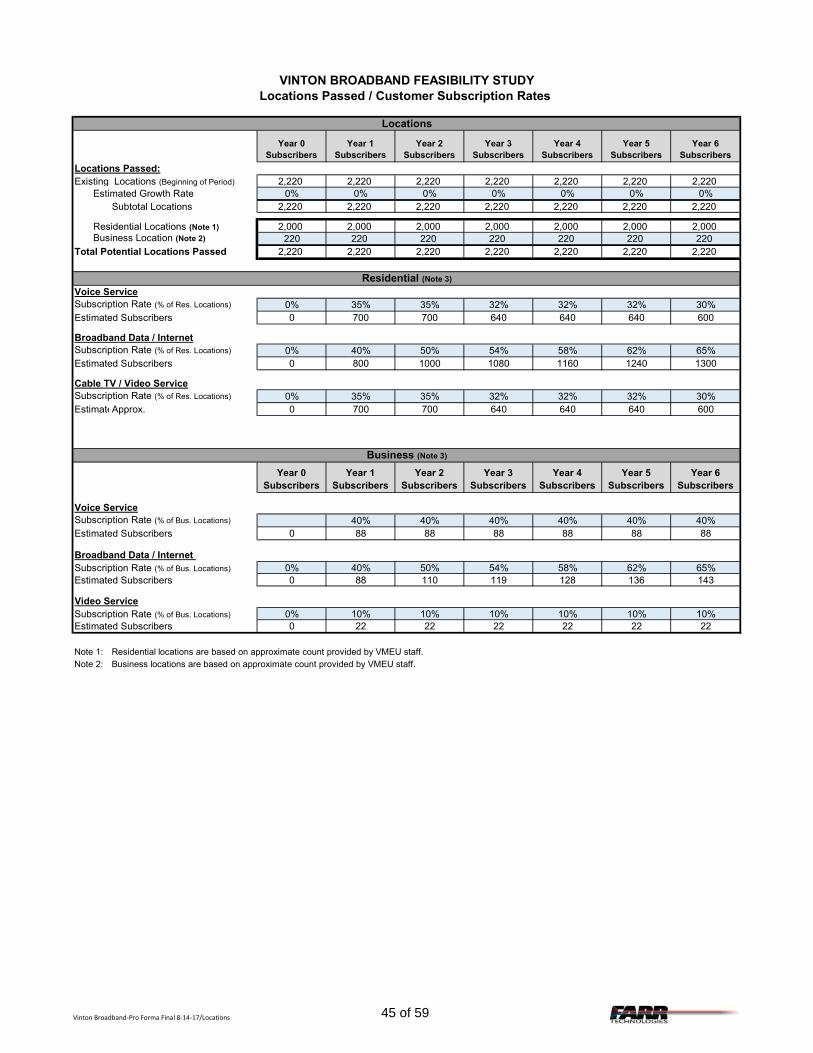
VINTON BROADBAND FEASIBILITY STUDYLocations Passed / Customer Subscription Rates
Locations
Year 0Subscribers
Year 1 Subscribers
Year 2 Subscribers
Year 3 Subscribers
Year 4 Subscribers
Year 5 Subscribers
Year 6 Subscribers
Locations Passed:Existing Locations (Beginning of Period) 2,220 2,220 2,220 2,220 2,220 2,220 2,220
Estimated Growth Rate 0% 0% 0% 0% 0% 0% 0%Subtotal Locations 2,220 2,220 2,220 2,220 2,220 2,220 2,220
Residential Locations (Note 1) 2,000 2,000 2,000 2,000 2,000 2,000 2,000Business Location (Note 2) 220 220 220 220 220 220 220
Total Potential Locations Passed 2,220 2,220 2,220 2,220 2,220 2,220 2,220
Residential (Note 3)
Voice ServiceSubscription Rate (% of Res. Locations) 0% 35% 35% 32% 32% 32% 30%Estimated Subscribers 0 700 700 640 640 640 600
Broadband Data / InternetSubscription Rate (% of Res. Locations) 0% 40% 50% 54% 58% 62% 65%Estimated Subscribers 0 800 1000 1080 1160 1240 1300
Cable TV / Video ServiceSubscription Rate (% of Res. Locations) 0% 35% 35% 32% 32% 32% 30%Estimated SubscribersApprox. 0 700 700 640 640 640 600
Business (Note 3)
Year 0 Subscribers
Year 1 Subscribers
Year 2 Subscribers
Year 3 Subscribers
Year 4 Subscribers
Year 5 Subscribers
Year 6 Subscribers
Voice ServiceSubscription Rate (% of Bus. Locations) 40% 40% 40% 40% 40% 40%Estimated Subscribers 0 88 88 88 88 88 88
Broadband Data / Internet Subscription Rate (% of Bus. Locations) 0% 40% 50% 54% 58% 62% 65%Estimated Subscribers 0 88 110 119 128 136 143
Video ServiceSubscription Rate (% of Bus. Locations) 0% 10% 10% 10% 10% 10% 10%Estimated Subscribers 0 22 22 22 22 22 22
Note 1: Residential locations are based on approximate count provided by VMEU staff.Note 2: Business locations are based on approximate count provided by VMEU staff.
Vinton Broadband-Pro Forma Final 8-14-17/Locations 45 of 59
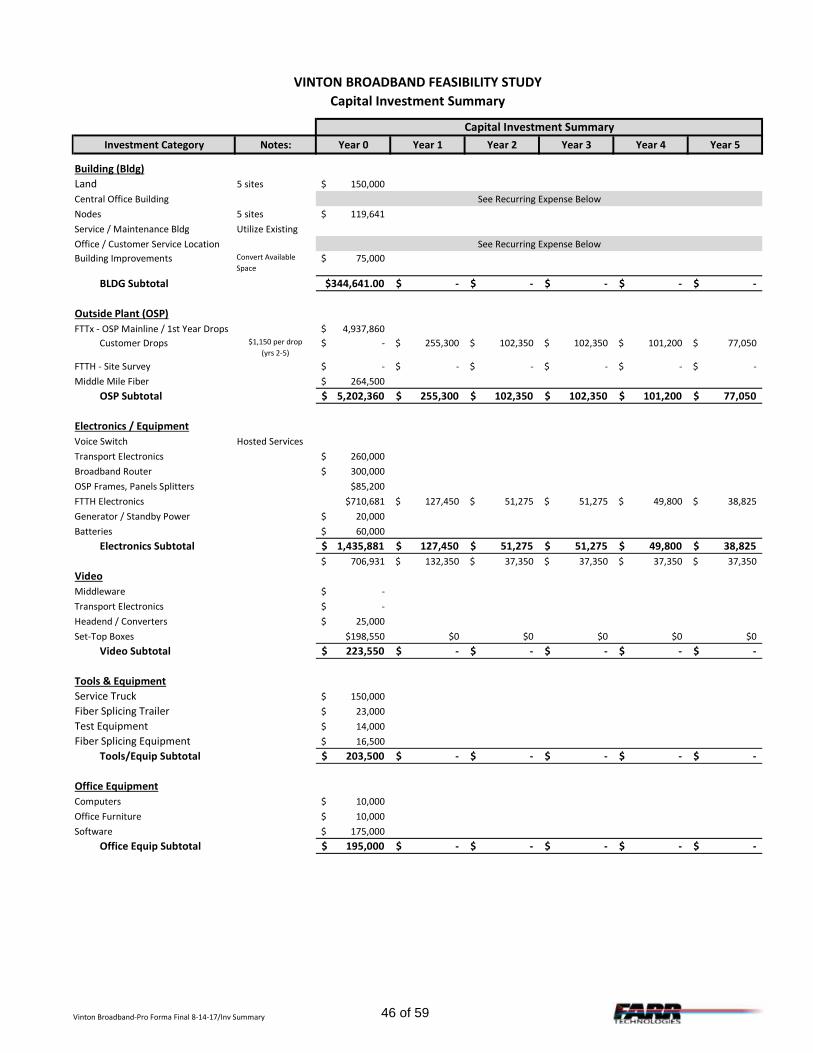
VINTON BROADBAND FEASIBILITY STUDYCapital Investment Summary
Capital Investment SummaryInvestment Category Notes: Year 0 Year 1 Year 2 Year 3 Year 4 Year 5
Building (Bldg)Land 5 sites 150,000$ Central Office Building See Recurring Expense BelowNodes 5 sites 119,641$ Service / Maintenance Bldg Utilize ExistingOffice / Customer Service Location See Recurring Expense BelowBuilding Improvements Convert Available
Space75,000$
BLDG Subtotal $344,641.00 -$ -$ -$ -$ -$
Outside Plant (OSP) 888 222 89 89 88 67 FTTx - OSP Mainline / 1st Year Drops 4,937,860$
Customer Drops $1,150 per drop(yrs 2-5)
-$ 255,300$ 102,350$ 102,350$ 101,200$ 77,050$
FTTH - Site Survey -$ -$ -$ -$ -$ -$ Middle Mile Fiber 264,500$
OSP Subtotal 5,202,360$ 255,300$ 102,350$ 102,350$ 101,200$ 77,050$
Electronics / EquipmentVoice Switch Hosted ServicesTransport Electronics 260,000$ Broadband Router 300,000$ OSP Frames, Panels Splitters $85,200FTTH Electronics $710,681 127,450$ 51,275$ 51,275$ 49,800$ 38,825$ Generator / Standby Power 20,000$ Batteries 60,000$
Electronics Subtotal 1,435,881$ 127,450$ 51,275$ 51,275$ 49,800$ 38,825$ 706,931$ 132,350$ 37,350$ 37,350$ 37,350$ 37,350$
VideoMiddleware -$ Transport Electronics -$ Headend / Converters 25,000$ Set-Top Boxes $198,550 $0 $0 $0 $0 $0
Video Subtotal 223,550$ -$ -$ -$ -$ -$
Tools & EquipmentService Truck 150,000$ Fiber Splicing Trailer 23,000$ Test Equipment 14,000$ Fiber Splicing Equipment 16,500$
Tools/Equip Subtotal 203,500$ -$ -$ -$ -$ -$
Office EquipmentComputers 10,000$ Office Furniture 10,000$ Software 175,000$
Office Equip Subtotal 195,000$ -$ -$ -$ -$ -$
Vinton Broadband-Pro Forma Final 8-14-17/Inv Summary 46 of 59
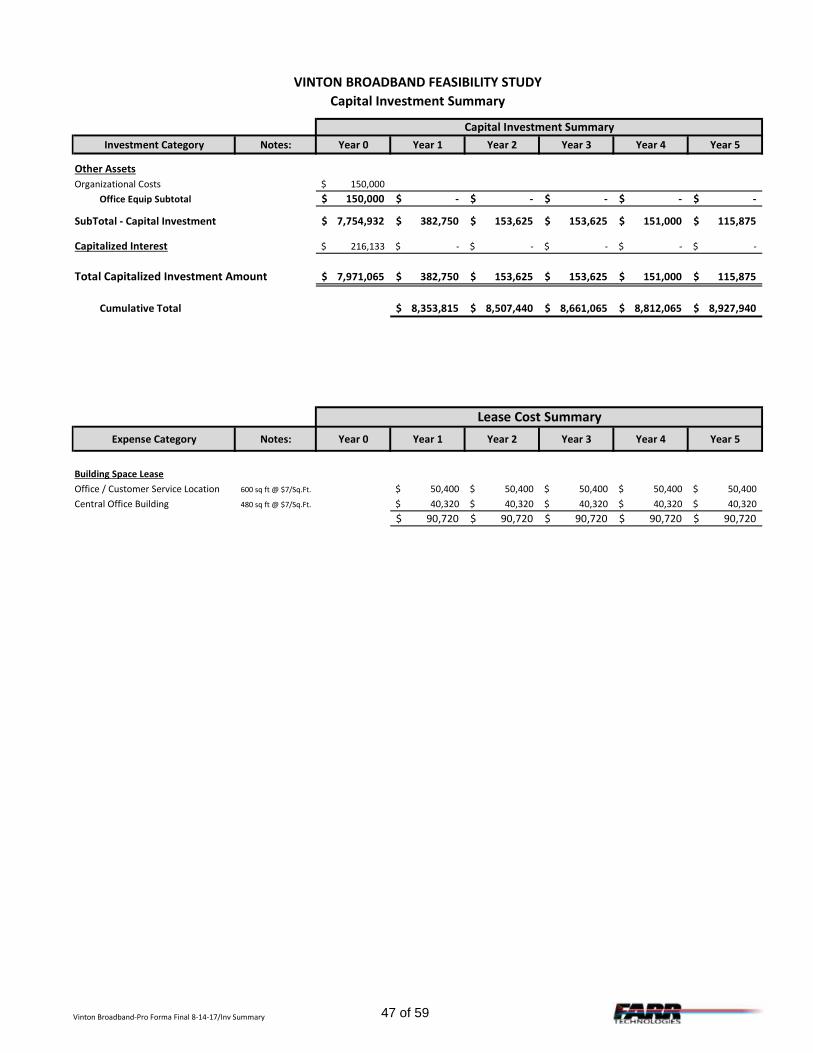
VINTON BROADBAND FEASIBILITY STUDYCapital Investment Summary
Capital Investment SummaryInvestment Category Notes: Year 0 Year 1 Year 2 Year 3 Year 4 Year 5
Other AssetsOrganizational Costs 150,000$
Office Equip Subtotal 150,000$ -$ -$ -$ -$ -$
SubTotal - Capital Investment 7,754,932$ 382,750$ 153,625$ 153,625$ 151,000$ 115,875$
Capitalized Interest 216,133$ -$ -$ -$ -$ -$
Total Capitalized Investment Amount 7,971,065$ 382,750$ 153,625$ 153,625$ 151,000$ 115,875$
Cumulative Total 8,353,815$ 8,507,440$ 8,661,065$ 8,812,065$ 8,927,940$
Lease Cost SummaryExpense Category Notes: Year 0 Year 1 Year 2 Year 3 Year 4 Year 5
Building Space LeaseOffice / Customer Service Location 600 sq ft @ $7/Sq.Ft. 50,400$ 50,400$ 50,400$ 50,400$ 50,400$ Central Office Building 480 sq ft @ $7/Sq.Ft. 40,320$ 40,320$ 40,320$ 40,320$ 40,320$
90,720$ 90,720$ 90,720$ 90,720$ 90,720$
Vinton Broadband-Pro Forma Final 8-14-17/Inv Summary 47 of 59
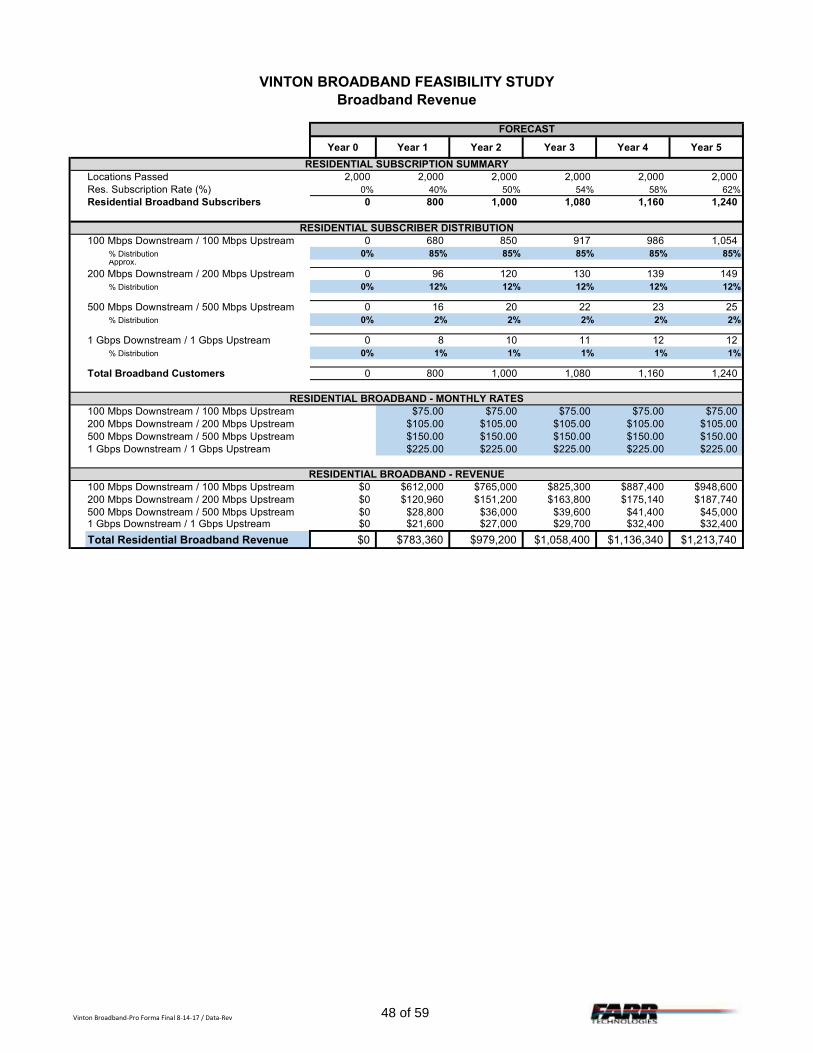
VINTON BROADBAND FEASIBILITY STUDYBroadband Revenue
FORECAST
Year 0 Year 1 Year 2 Year 3 Year 4 Year 5
RESIDENTIAL SUBSCRIPTION SUMMARYLocations Passed 2,000 2,000 2,000 2,000 2,000 2,000Res. Subscription Rate (%) 0% 40% 50% 54% 58% 62%Residential Broadband Subscribers 0 800 1,000 1,080 1,160 1,240
RESIDENTIAL SUBSCRIBER DISTRIBUTION100 Mbps Downstream / 100 Mbps Upstream 0 680 850 917 986 1,054
% Distribution 0% 85% 85% 85% 85% 85%Approx.
200 Mbps Downstream / 200 Mbps Upstream 0 96 120 130 139 149% Distribution 0% 12% 12% 12% 12% 12%
500 Mbps Downstream / 500 Mbps Upstream 0 16 20 22 23 25% Distribution 0% 2% 2% 2% 2% 2%
1 Gbps Downstream / 1 Gbps Upstream 0 8 10 11 12 12% Distribution 0% 1% 1% 1% 1% 1%
Total Broadband Customers 0 800 1,000 1,080 1,160 1,240
RESIDENTIAL BROADBAND - MONTHLY RATES100 Mbps Downstream / 100 Mbps Upstream $75.00 $75.00 $75.00 $75.00 $75.00200 Mbps Downstream / 200 Mbps Upstream $105.00 $105.00 $105.00 $105.00 $105.00500 Mbps Downstream / 500 Mbps Upstream $150.00 $150.00 $150.00 $150.00 $150.001 Gbps Downstream / 1 Gbps Upstream $225.00 $225.00 $225.00 $225.00 $225.00
RESIDENTIAL BROADBAND - REVENUE100 Mbps Downstream / 100 Mbps Upstream $0 $612,000 $765,000 $825,300 $887,400 $948,600200 Mbps Downstream / 200 Mbps Upstream $0 $120,960 $151,200 $163,800 $175,140 $187,740500 Mbps Downstream / 500 Mbps Upstream $0 $28,800 $36,000 $39,600 $41,400 $45,0001 Gbps Downstream / 1 Gbps Upstream $0 $21,600 $27,000 $29,700 $32,400 $32,400
Total Residential Broadband Revenue $0 $783,360 $979,200 $1,058,400 $1,136,340 $1,213,740
Vinton Broadband-Pro Forma Final 8-14-17 / Data-Rev 48 of 59

VINTON BROADBAND FEASIBILITY STUDYBroadband Revenue
FORECAST
Year 0 Year 1 Year 2 Year 3 Year 4 Year 5
BUSINESS LOCATION / SUBSCRIPTION SUMMARYLocations Passed 220 220 220 220 220 220Business Subscription Rate (%) 0% 40% 50% 54% 58% 62%
Business Broadband Subscribers 0 88 110 119 128 136
BUSINESS SUBSCRIBER DISTRIBUTION100 Mbps Downstream / 100 Mbps Upstream 18 22 24 26 27
% Distribution 20% 20% 20% 20% 20%
200 Mbps Downstream / 200 Mbps Upstream 53 65 71 77 82% Distribution 60% 60% 60% 60% 60%
500 Mbps Downstream / 500 Mbps Upstream 13 17 18 19 20% Distribution 15% 15% 15% 15% 15%
1 Gbps Downstream / 1 Gbps Upstream 4 6 6 6 7% Distribution 5% 5% 5% 5% 5%
Total Business Broadband Customers 88 110 119 128 136
BUSINESS BROADBAND - MONTHLY RATES100 Mbps Downstream / 100 Mbps Upstream $100.00 $100.00 $100.00 $100.00 $100.00200 Mbps Downstream / 200 Mbps Upstream $125.00 $125.00 $125.00 $125.00 $125.00
500 Mbps Downstream / 500 Mbps Upstream $190.00 $190.00 $190.00 $190.00 $190.00
1 Gbps Downstream / 1 Gbps Upstream $275.00 $275.00 $275.00 $275.00 $275.00
BUSINESS BROADBAND REVENUES100 Mbps Downstream / 100 Mbps Upstream $21,600 $26,400 $28,800 $31,200 $32,400200 Mbps Downstream / 200 Mbps Upstream $79,500 $97,500 $106,500 $115,500 $123,000500 Mbps Downstream / 500 Mbps Upstream $29,640 $38,760 $41,040 $43,320 $45,6001 Gbps Downstream / 1 Gbps Upstream $13,200 $19,800 $19,800 $19,800 $23,100
Total Business Broadband Revenue $143,940 $182,460 $196,140 $209,820 $224,100
Total Broadband Revenue $927,300 $1,161,660 $1,254,540 $1,346,160 $1,437,840
Vinton Broadband-Pro Forma Final 8-14-17 / Data-Rev 49 of 59

VINTON BROADBAND FEASIBILITY STUDYVideo Services Revenue / Expense
FORECAST
Assumptions: Year 0 Year 1 Year 2 Year 3 Year 4 Year 5
LOCATIONS PASSED SUMMARYLocations Passed 2,220 2,220 2,220 2,220 2,220 2,220
Res. Subscription % 0% 35% 35% 32% 32% 32%Basic Subscribers 0 700 700 640 640 640Business Subscribers 0 22 22 22 22 22
Subtotal - Video Subscribers 0 722 722 662 662 662
VIDEO SERVICE - SUBSCRIPTION RATES (% OF TOTAL VIDEO SUBSCRIBERS)
Basic Subscription % 0% 15% 15% 15% 15% 15%Basic Subscribers 0 108 108 99 99 99
Expanded Subscription % 0% 75% 75% 75% 75% 75%Expanded Subscribers 0 542 542 497 497 497
Premium Subscription % 0% 10% 10% 10% 10% 10%Premium Subscribers 0 72 72 66 66 66
Movie Channels - Subscription % 0% 25% 25% 25% 25% 25%Movie Channels - Subscribers 0 181 181 166 166 166
Caller ID Subscription % 0% 50% 50% 50% 50% 50%Caller ID Subscribers 0 361 361 331 331 331
Set Top BoxVideo Subscribers 722 722 662 662 662Average # of Set Top Boxes per Household 2.5 2.5 2.5 2.5 2.5
Total Set Top Box Devices 1,805 1,805 1,655 1,655 1,655
Set Top Box - Free 40% 721 721 661 661 661Set Top Box - Additional Charge 30% 542 542 497 497 497Set Top Box - DVR 30% 542 542 497 497 497
100% 1,805 1,805 1,655 1,655 1,655
VIDEO SERVICES - MONTHLY RATES
Annual Growth
Basic 6% $35.00 $37.00 $39.00 $41.50 $44.00Expanded 6% $86.00 $91.00 $96.50 $102.50 $108.50Premium 6% $96.00 $102.00 $108.00 $114.50 $121.50
Movie Channels 0% $15.00 $15.00 $15.00 $15.00 $15.00Caller ID 0% $2.00 $2.00 $2.00 $2.00 $2.00Set Top Box 0% $8.00 $8.00 $8.00 $8.00 $8.00DVR Rental 0% $15.00 $15.00 $15.00 $15.00 $15.00
VIDEO SERVICES - ANNUAL REVENUEBasic - Residential (OTA + 10 SD / HD) $0.00 $45,360 $47,952 $46,332 $49,302 $52,272Expanded (Basic + 56 SD / HD) $0.00 $559,344 $591,864 $575,526 $611,310 $647,094Premium (Basic + Expanded +40 SD/HD) $0.00 $82,944 $88,128 $85,536 $90,684 $96,228
Movie Channels $0.00 $32,580 $32,580 $29,880 $29,880 $29,880Caller ID $0.00 $8,664 $8,664 $7,944 $7,944 $7,944Set Top Box $0.00 $52,032 $52,032 $47,712 $47,712 $47,712DVR Rental $0.00 $97,560 $97,560 $89,460 $89,460 $89,460
Total Video Service Revenue: $0.00 $878,484 $918,780 $882,390 $926,292 $970,590
Vinton Broadband-Pro Forma Final 8-14-17 / [Tab]50 of 59
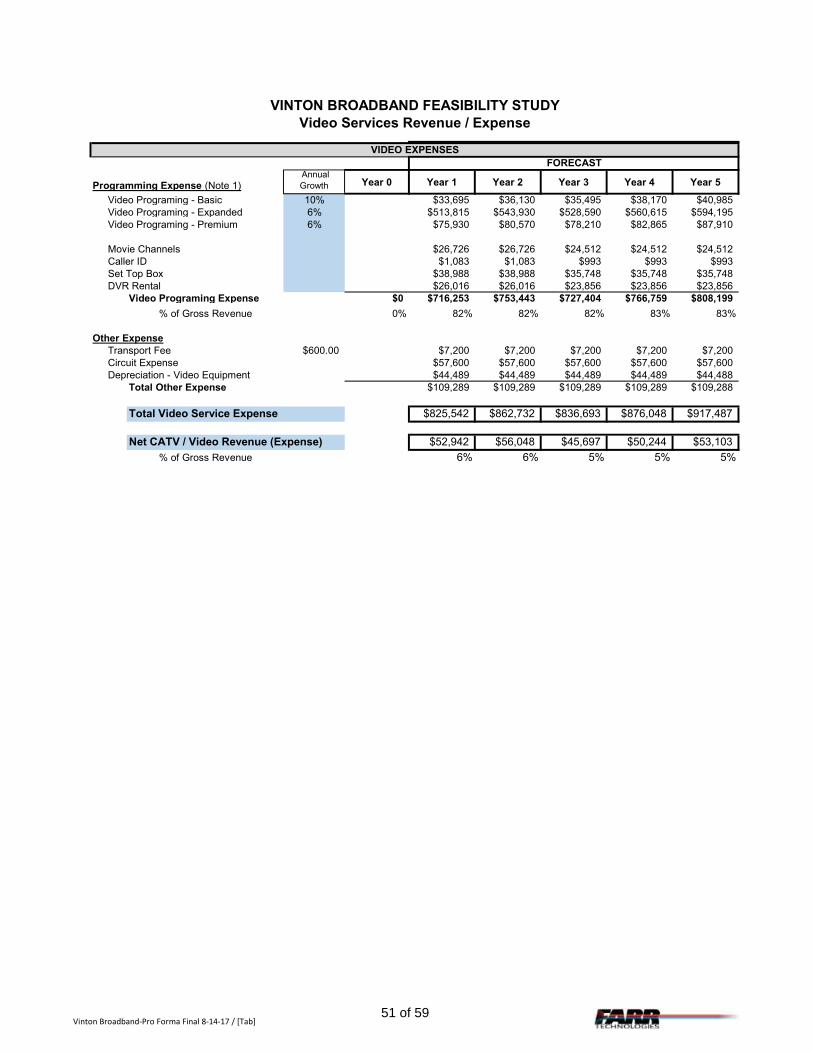
VINTON BROADBAND FEASIBILITY STUDYVideo Services Revenue / Expense
VIDEO EXPENSESFORECAST
Programming Expense (Note 1) Annual Growth Year 0 Year 1 Year 2 Year 3 Year 4 Year 5
Video Programing - Basic 10% $33,695 $36,130 $35,495 $38,170 $40,985Video Programing - Expanded 6% $513,815 $543,930 $528,590 $560,615 $594,195Video Programing - Premium 6% $75,930 $80,570 $78,210 $82,865 $87,910
Movie Channels $26,726 $26,726 $24,512 $24,512 $24,512Caller ID $1,083 $1,083 $993 $993 $993Set Top Box $38,988 $38,988 $35,748 $35,748 $35,748DVR Rental $26,016 $26,016 $23,856 $23,856 $23,856
Video Programing Expense $0 $716,253 $753,443 $727,404 $766,759 $808,199
% of Gross Revenue 0% 82% 82% 82% 83% 83%
Other ExpenseTransport Fee $600.00 $7,200 $7,200 $7,200 $7,200 $7,200Circuit Expense $57,600 $57,600 $57,600 $57,600 $57,600Depreciation - Video Equipment $44,489 $44,489 $44,489 $44,489 $44,488
Total Other Expense $109,289 $109,289 $109,289 $109,289 $109,288
Total Video Service Expense $825,542 $862,732 $836,693 $876,048 $917,487
Net CATV / Video Revenue (Expense) $52,942 $56,048 $45,697 $50,244 $53,103
% of Gross Revenue 6% 6% 5% 5% 5%
Vinton Broadband-Pro Forma Final 8-14-17 / [Tab]51 of 59
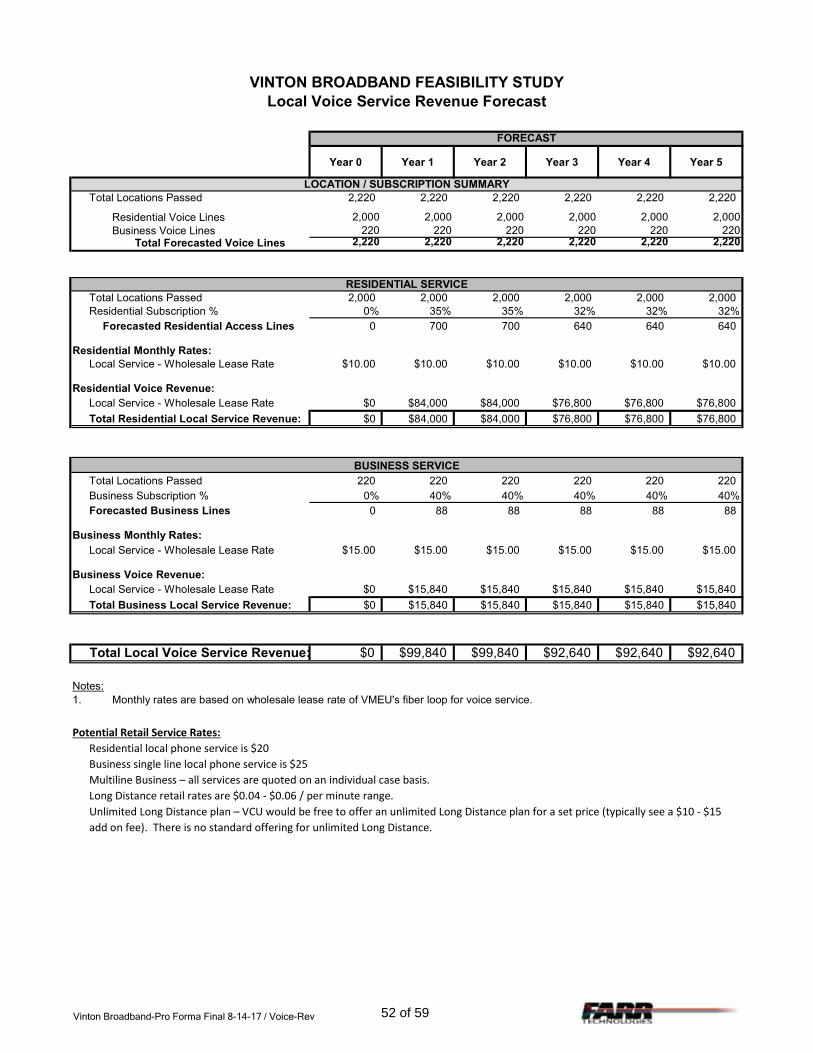
VINTON BROADBAND FEASIBILITY STUDYLocal Voice Service Revenue Forecast
FORECAST
Year 0 Year 1 Year 2 Year 3 Year 4 Year 5
LOCATION / SUBSCRIPTION SUMMARYTotal Locations Passed 2,220 2,220 2,220 2,220 2,220 2,220
Residential Voice Lines 2,000 2,000 2,000 2,000 2,000 2,000 Business Voice Lines 220 220 220 220 220 220
Total Forecasted Voice Lines 2,220 2,220 2,220 2,220 2,220 2,220
RESIDENTIAL SERVICETotal Locations Passed 2,000 2,000 2,000 2,000 2,000 2,000Residential Subscription % 0% 35% 35% 32% 32% 32%
0 700 700 640 640 640
Residential Monthly Rates:Local Service - Wholesale Lease Rate $10.00 $10.00 $10.00 $10.00 $10.00 $10.00
Residential Voice Revenue:Local Service - Wholesale Lease Rate $0 $84,000 $84,000 $76,800 $76,800 $76,800
Total Residential Local Service Revenue: $0 $84,000 $84,000 $76,800 $76,800 $76,800
BUSINESS SERVICETotal Locations Passed 220 220 220 220 220 220Business Subscription % 0% 40% 40% 40% 40% 40%Forecasted Business Lines 0 88 88 88 88 88
Business Monthly Rates:Local Service - Wholesale Lease Rate $15.00 $15.00 $15.00 $15.00 $15.00 $15.00
Business Voice Revenue:Local Service - Wholesale Lease Rate $0 $15,840 $15,840 $15,840 $15,840 $15,840
Total Business Local Service Revenue: $0 $15,840 $15,840 $15,840 $15,840 $15,840
Total Local Voice Service Revenue: $0 $99,840 $99,840 $92,640 $92,640 $92,640
Notes:1.
Potential Retail Service Rates:Residential local phone service is $20Business single line local phone service is $25Multiline Business – all services are quoted on an individual case basis.Long Distance retail rates are $0.04 - $0.06 / per minute range. Unlimited Long Distance plan – VCU would be free to offer an unlimited Long Distance plan for a set price (typically see a $10 - $15 add on fee). There is no standard offering for unlimited Long Distance.
Monthly rates are based on wholesale lease rate of VMEU's fiber loop for voice service.
Forecasted Residential Access Lines
Vinton Broadband-Pro Forma Final 8-14-17 / Voice-Rev 52 of 59
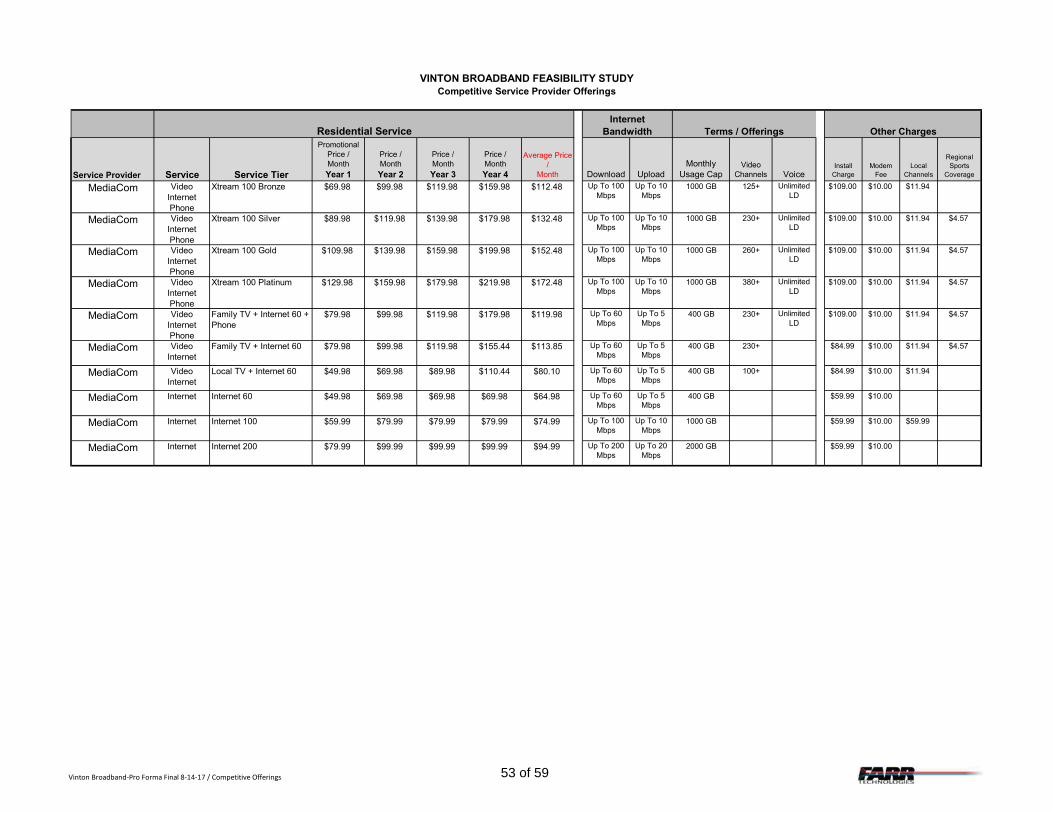
VINTON BROADBAND FEASIBILITY STUDYCompetitive Service Provider Offerings
Residential Service Other Charges
Service Provider Service Service Tier
PromotionalPrice /MonthYear 1
Price /MonthYear 2
Price /MonthYear 3
Price /MonthYear 4
Average Price /
Month Download UploadMonthly
Usage CapVideo
Channels VoiceInstall
ChargeModem
FeeLocal
Channels
RegionalSports
Coverage
MediaCom VideoInternetPhone
Xtream 100 Bronze $69.98 $99.98 $119.98 $159.98 $112.48 Up To 100 Mbps
Up To 10 Mbps
1000 GB 125+ UnlimitedLD
$109.00 $10.00 $11.94
MediaCom VideoInternetPhone
Xtream 100 Silver $89.98 $119.98 $139.98 $179.98 $132.48 Up To 100 Mbps
Up To 10 Mbps
1000 GB 230+ UnlimitedLD
$109.00 $10.00 $11.94 $4.57
MediaCom VideoInternetPhone
Xtream 100 Gold $109.98 $139.98 $159.98 $199.98 $152.48 Up To 100 Mbps
Up To 10 Mbps
1000 GB 260+ UnlimitedLD
$109.00 $10.00 $11.94 $4.57
MediaCom VideoInternetPhone
Xtream 100 Platinum $129.98 $159.98 $179.98 $219.98 $172.48 Up To 100 Mbps
Up To 10 Mbps
1000 GB 380+ UnlimitedLD
$109.00 $10.00 $11.94 $4.57
MediaCom VideoInternetPhone
Family TV + Internet 60 + Phone
$79.98 $99.98 $119.98 $179.98 $119.98 Up To 60 Mbps
Up To 5 Mbps
400 GB 230+ UnlimitedLD
$109.00 $10.00 $11.94 $4.57
MediaCom VideoInternet
Family TV + Internet 60 $79.98 $99.98 $119.98 $155.44 $113.85 Up To 60 Mbps
Up To 5 Mbps
400 GB 230+ $84.99 $10.00 $11.94 $4.57
MediaCom VideoInternet
Local TV + Internet 60 $49.98 $69.98 $89.98 $110.44 $80.10 Up To 60 Mbps
Up To 5 Mbps
400 GB 100+ $84.99 $10.00 $11.94
MediaCom Internet Internet 60 $49.98 $69.98 $69.98 $69.98 $64.98 Up To 60 Mbps
Up To 5 Mbps
400 GB $59.99 $10.00
MediaCom Internet Internet 100 $59.99 $79.99 $79.99 $79.99 $74.99 Up To 100 Mbps
Up To 10 Mbps
1000 GB $59.99 $10.00 $59.99
MediaCom Internet Internet 200 $79.99 $99.99 $99.99 $99.99 $94.99 Up To 200 Mbps
Up To 20 Mbps
2000 GB $59.99 $10.00
InternetBandwidth Terms / Offerings
Vinton Broadband-Pro Forma Final 8-14-17 / Competitive Offerings 53 of 59
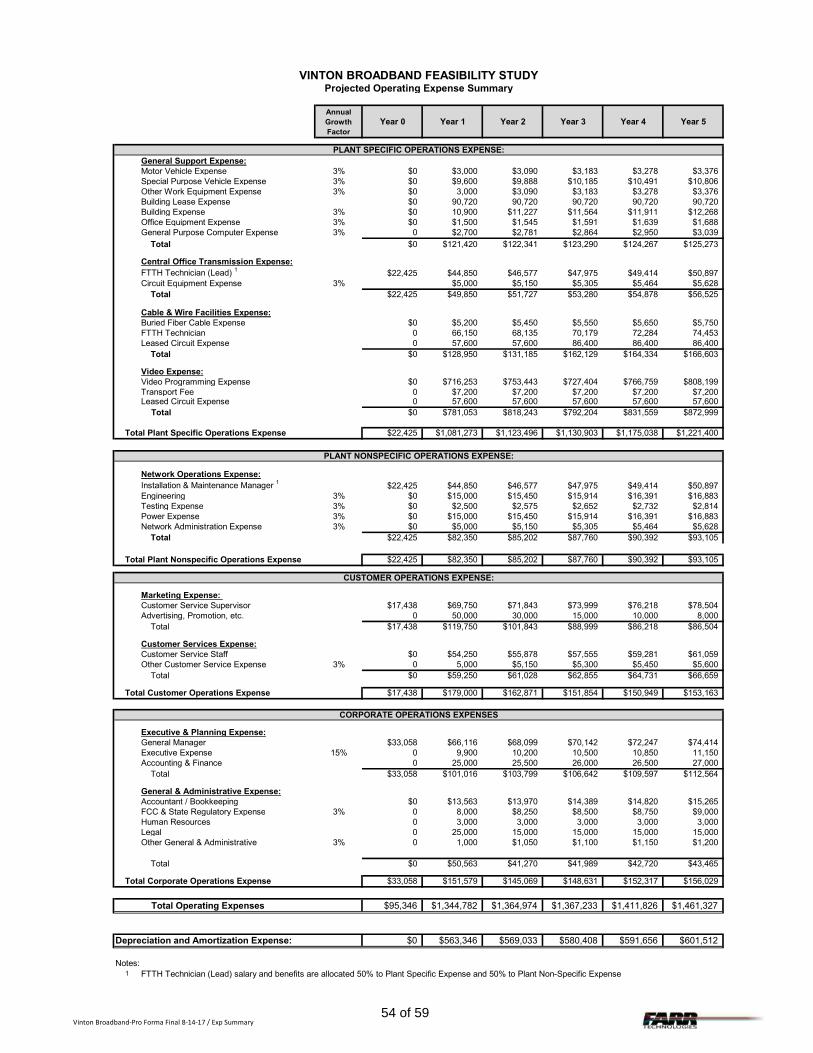
VINTON BROADBAND FEASIBILITY STUDYProjected Operating Expense Summary
AnnualGrowthFactor
Year 0 Year 1 Year 2 Year 3 Year 4 Year 5
PLANT SPECIFIC OPERATIONS EXPENSE:General Support Expense:
6112 Motor Vehicle Expense 3% $0 $3,000 $3,090 $3,183 $3,278 $3,3766114 Special Purpose Vehicle Expense 3% $0 $9,600 $9,888 $10,185 $10,491 $10,8066116 Other Work Equipment Expense 3% $0 3,000 $3,090 $3,183 $3,278 $3,376
Building Lease Expense $0 90,720 90,720 90,720 90,720 90,7206121 Building Expense 3% $0 10,900 $11,227 $11,564 $11,911 $12,2686123 Office Equipment Expense 3% $0 $1,500 $1,545 $1,591 $1,639 $1,6886124 General Purpose Computer Expense 3% 0 $2,700 $2,781 $2,864 $2,950 $3,039
Total $0 $121,420 $122,341 $123,290 $124,267 $125,273
Central Office Transmission Expense:FTTH Technician (Lead) 1 $22,425 $44,850 $46,577 $47,975 $49,414 $50,897
6232 Circuit Equipment Expense 3% $5,000 $5,150 $5,305 $5,464 $5,628 Total $22,425 $49,850 $51,727 $53,280 $54,878 $56,525
Cable & Wire Facilities Expense:6423 Buried Fiber Cable Expense $0 $5,200 $5,450 $5,550 $5,650 $5,750
FTTH Technician 0 66,150 68,135 70,179 72,284 74,453Leased Circuit Expense 0 57,600 57,600 86,400 86,400 86,400 Total $0 $128,950 $131,185 $162,129 $164,334 $166,603
Video Expense:Video Programming Expense $0 $716,253 $753,443 $727,404 $766,759 $808,199Transport Fee 0 $7,200 $7,200 $7,200 $7,200 $7,200Leased Circuit Expense 0 57,600 57,600 57,600 57,600 57,600
Total $0 $781,053 $818,243 $792,204 $831,559 $872,999
Total Plant Specific Operations Expense $22,425 $1,081,273 $1,123,496 $1,130,903 $1,175,038 $1,221,400
PLANT NONSPECIFIC OPERATIONS EXPENSE:
Network Operations Expense:Installation & Maintenance Manager 1 $22,425 $44,850 $46,577 $47,975 $49,414 $50,897
6535 Engineering 3% $0 $15,000 $15,450 $15,914 $16,391 $16,8836533 Testing Expense 3% $0 $2,500 $2,575 $2,652 $2,732 $2,8146531 Power Expense 3% $0 $15,000 $15,450 $15,914 $16,391 $16,8836532 Network Administration Expense 3% $0 $5,000 $5,150 $5,305 $5,464 $5,628
Total $22,425 $82,350 $85,202 $87,760 $90,392 $93,105
Total Plant Nonspecific Operations Expense $22,425 $82,350 $85,202 $87,760 $90,392 $93,105
CUSTOMER OPERATIONS EXPENSE:
Marketing Expense: Customer Service Supervisor $17,438 $69,750 $71,843 $73,999 $76,218 $78,504Advertising, Promotion, etc. 0 50,000 30,000 15,000 10,000 8,000 Total $17,438 $119,750 $101,843 $88,999 $86,218 $86,504
Customer Services Expense:Customer Service Staff $0 $54,250 $55,878 $57,555 $59,281 $61,059Other Customer Service Expense 3% 0 5,000 $5,150 $5,300 $5,450 $5,600 Total $0 $59,250 $61,028 $62,855 $64,731 $66,659
Total Customer Operations Expense $17,438 $179,000 $162,871 $151,854 $150,949 $153,163
CORPORATE OPERATIONS EXPENSES
Executive & Planning Expense:General Manager $33,058 $66,116 $68,099 $70,142 $72,247 $74,414Executive Expense 15% 0 9,900 10,200 10,500 10,850 11,150Accounting & Finance 0 25,000 25,500 26,000 26,500 27,000 Total $33,058 $101,016 $103,799 $106,642 $109,597 $112,564
General & Administrative Expense:Accountant / Bookkeeping $0 $13,563 $13,970 $14,389 $14,820 $15,265FCC & State Regulatory Expense 3% 0 8,000 $8,250 $8,500 $8,750 $9,000Human Resources 0 3,000 3,000 3,000 3,000 3,000Legal 0 25,000 15,000 15,000 15,000 15,000Other General & Administrative 3% 0 1,000 $1,050 $1,100 $1,150 $1,200
Total $0 $50,563 $41,270 $41,989 $42,720 $43,465
Total Corporate Operations Expense $33,058 $151,579 $145,069 $148,631 $152,317 $156,029
Total Operating Expenses $95,346 $1,344,782 $1,364,974 $1,367,233 $1,411,826 $1,461,327
Depreciation and Amortization Expense: $0 $563,346 $569,033 $580,408 $591,656 $601,512
Notes:1 FTTH Technician (Lead) salary and benefits are allocated 50% to Plant Specific Expense and 50% to Plant Non-Specific Expense
Vinton Broadband-Pro Forma Final 8-14-17 / Exp Summary54 of 59
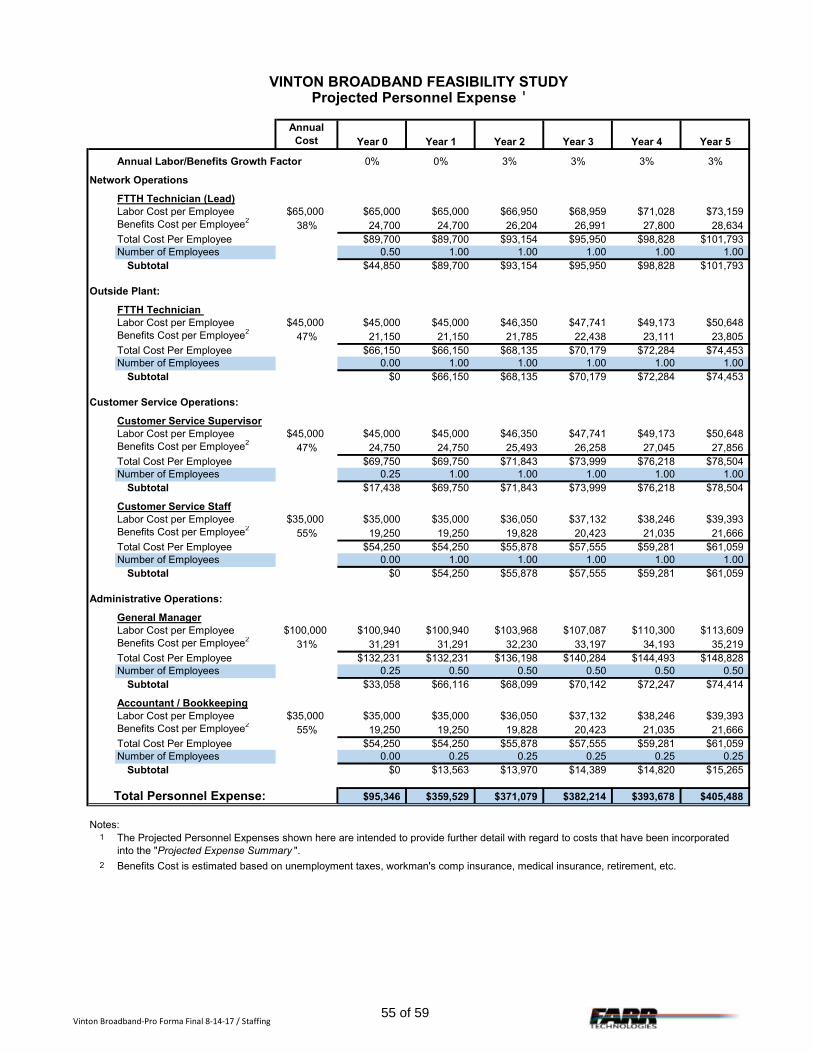
VINTON BROADBAND FEASIBILITY STUDYProjected Personnel Expense 1
Annual Cost Year 0 Year 1 Year 2 Year 3 Year 4 Year 5
Annual Labor/Benefits Growth Factor 0% 0% 3% 3% 3% 3%
Network Operations
FTTH Technician (Lead)Labor Cost per Employee $65,000 $65,000 $65,000 $66,950 $68,959 $71,028 $73,159Benefits Cost per Employee2
38% 24,700 24,700 26,204 26,991 27,800 28,634Total Cost Per Employee $89,700 $89,700 $93,154 $95,950 $98,828 $101,793Number of Employees 0.50 1.00 1.00 1.00 1.00 1.00
Subtotal $44,850 $89,700 $93,154 $95,950 $98,828 $101,793
Outside Plant:
FTTH Technician Labor Cost per Employee $45,000 $45,000 $45,000 $46,350 $47,741 $49,173 $50,648Benefits Cost per Employee2
47% 21,150 21,150 21,785 22,438 23,111 23,805Total Cost Per Employee $66,150 $66,150 $68,135 $70,179 $72,284 $74,453Number of Employees 0.00 1.00 1.00 1.00 1.00 1.00
Subtotal $0 $66,150 $68,135 $70,179 $72,284 $74,453
Customer Service Operations:
Customer Service SupervisorLabor Cost per Employee $45,000 $45,000 $45,000 $46,350 $47,741 $49,173 $50,648Benefits Cost per Employee2
47% 24,750 24,750 25,493 26,258 27,045 27,856Total Cost Per Employee $69,750 $69,750 $71,843 $73,999 $76,218 $78,504Number of Employees 0.25 1.00 1.00 1.00 1.00 1.00
Subtotal $17,438 $69,750 $71,843 $73,999 $76,218 $78,504
Customer Service StaffLabor Cost per Employee $35,000 $35,000 $35,000 $36,050 $37,132 $38,246 $39,393Benefits Cost per Employee2
55% 19,250 19,250 19,828 20,423 21,035 21,666Total Cost Per Employee $54,250 $54,250 $55,878 $57,555 $59,281 $61,059Number of Employees 0.00 1.00 1.00 1.00 1.00 1.00
Subtotal $0 $54,250 $55,878 $57,555 $59,281 $61,059
Administrative Operations:
General ManagerLabor Cost per Employee $100,000 $100,940 $100,940 $103,968 $107,087 $110,300 $113,609Benefits Cost per Employee2
31% 31,291 31,291 32,230 33,197 34,193 35,219Total Cost Per Employee $132,231 $132,231 $136,198 $140,284 $144,493 $148,828Number of Employees 0.25 0.50 0.50 0.50 0.50 0.50
Subtotal $33,058 $66,116 $68,099 $70,142 $72,247 $74,414
Accountant / BookkeepingLabor Cost per Employee $35,000 $35,000 $35,000 $36,050 $37,132 $38,246 $39,393Benefits Cost per Employee2
55% 19,250 19,250 19,828 20,423 21,035 21,666Total Cost Per Employee $54,250 $54,250 $55,878 $57,555 $59,281 $61,059Number of Employees 0.00 0.25 0.25 0.25 0.25 0.25
Subtotal $0 $13,563 $13,970 $14,389 $14,820 $15,265
Total Personnel Expense: $95,346 $359,529 $371,079 $382,214 $393,678 $405,488
Notes:1
2
The Projected Personnel Expenses shown here are intended to provide further detail with regard to costs that have been incorporated into the "Projected Expense Summary ".
Benefits Cost is estimated based on unemployment taxes, workman's comp insurance, medical insurance, retirement, etc.
Vinton Broadband-Pro Forma Final 8-14-17 / Staffing55 of 59
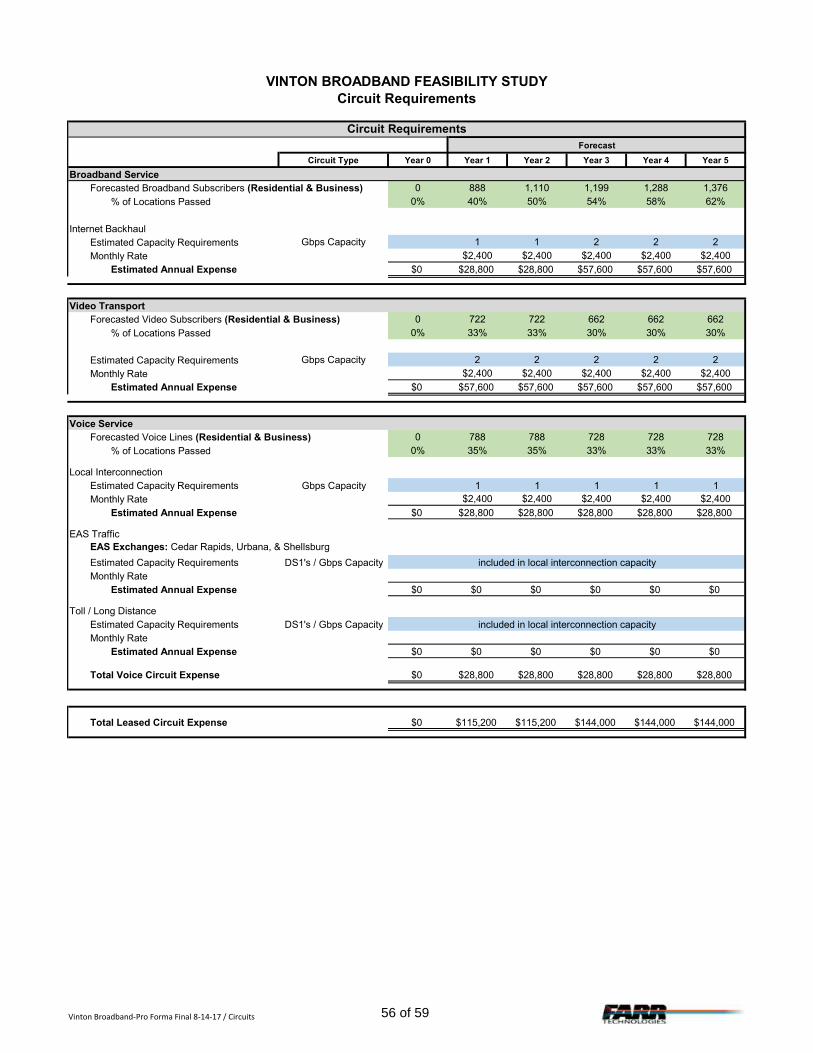
VINTON BROADBAND FEASIBILITY STUDYCircuit Requirements
Circuit RequirementsForecast
Circuit Type Year 0 Year 1 Year 2 Year 3 Year 4 Year 5
Broadband ServiceForecasted Broadband Subscribers (Residential & Business) 0 888 1,110 1,199 1,288 1,376
% of Locations Passed 0% 40% 50% 54% 58% 62%
Internet BackhaulEstimated Capacity Requirements Gbps Capacity 1 1 2 2 2
Monthly Rate $2,400 $2,400 $2,400 $2,400 $2,400
Estimated Annual Expense $0 $28,800 $28,800 $57,600 $57,600 $57,600
Video TransportForecasted Video Subscribers (Residential & Business) 0 722 722 662 662 662
% of Locations Passed 0% 33% 33% 30% 30% 30%
Estimated Capacity Requirements Gbps Capacity 2 2 2 2 2
Monthly Rate $2,400 $2,400 $2,400 $2,400 $2,400
Estimated Annual Expense $0 $57,600 $57,600 $57,600 $57,600 $57,600
Voice ServiceForecasted Voice Lines (Residential & Business) 0 788 788 728 728 728
% of Locations Passed 0% 35% 35% 33% 33% 33%
Local InterconnectionEstimated Capacity Requirements Gbps Capacity 1 1 1 1 1Monthly Rate $2,400 $2,400 $2,400 $2,400 $2,400
Estimated Annual Expense $0 $28,800 $28,800 $28,800 $28,800 $28,800
EAS Traffic
Estimated Capacity Requirements DS1's / Gbps Capacity included in local interconnection capacityMonthly Rate
Estimated Annual Expense $0 $0 $0 $0 $0 $0
Toll / Long DistanceEstimated Capacity Requirements DS1's / Gbps Capacity included in local interconnection capacityMonthly Rate
Estimated Annual Expense $0 $0 $0 $0 $0 $0
Total Voice Circuit Expense $0 $28,800 $28,800 $28,800 $28,800 $28,800
Total Leased Circuit Expense $0 $115,200 $115,200 $144,000 $144,000 $144,000
EAS Exchanges: Cedar Rapids, Urbana, & Shellsburg
Vinton Broadband-Pro Forma Final 8-14-17 / Circuits 56 of 59
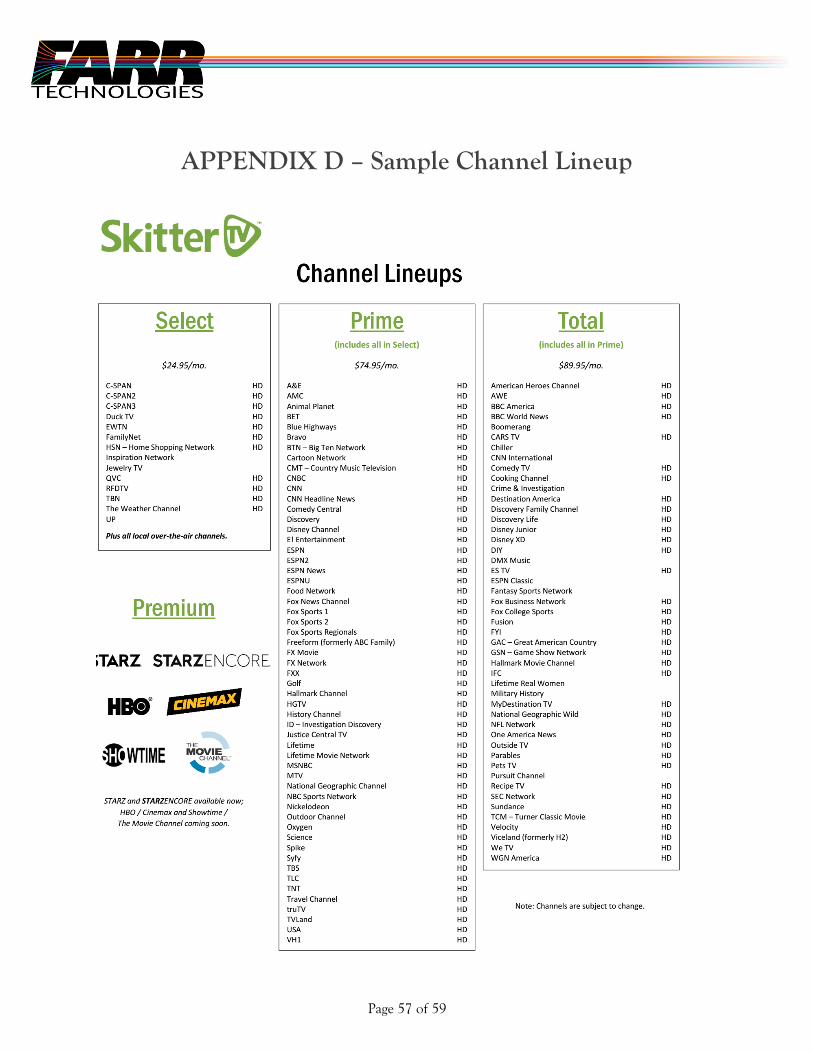
Page 57 of 59
APPENDIX D – Sample Channel Lineup
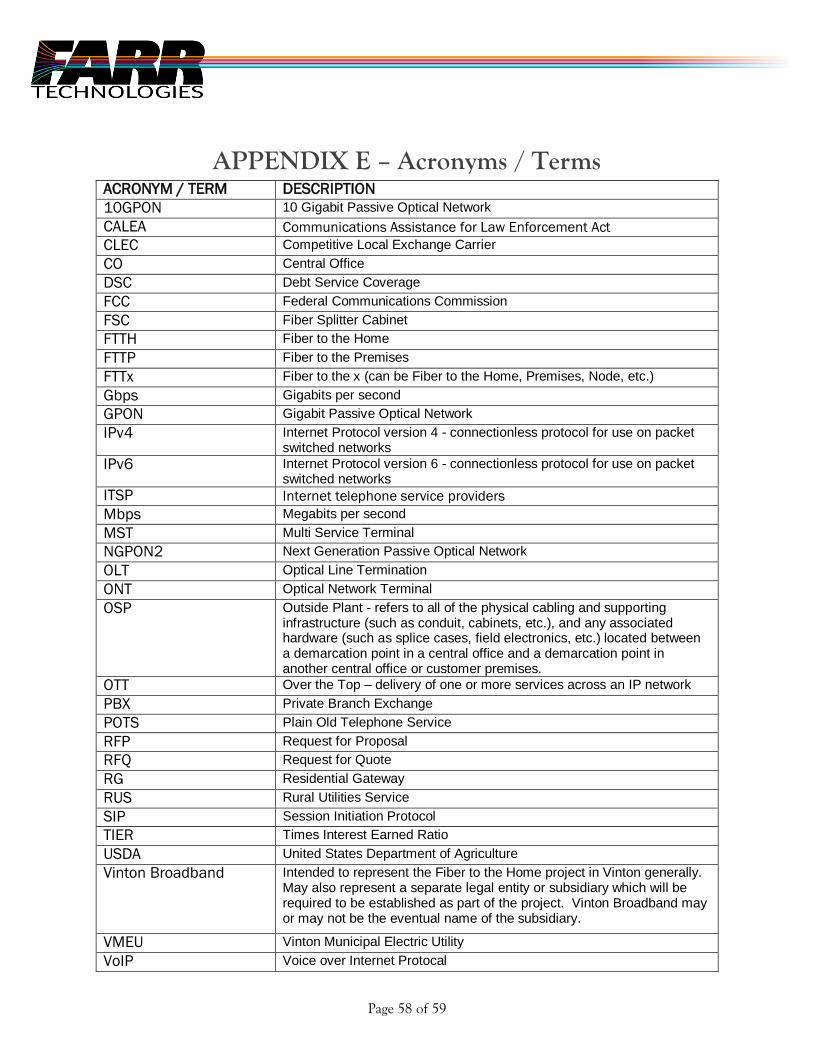
Page 58 of 59
APPENDIX E – Acronyms / Terms ACRONYM / TERM DESCRIPTION
10GPON 10 Gigabit Passive Optical Network
CALEA Communications Assistance for Law Enforcement Act
CLEC Competitive Local Exchange Carrier
CO Central Office
DSC Debt Service Coverage
FCC Federal Communications Commission
FSC Fiber Splitter Cabinet
FTTH Fiber to the Home
FTTP Fiber to the Premises
FTTx Fiber to the x (can be Fiber to the Home, Premises, Node, etc.)
Gbps Gigabits per second
GPON Gigabit Passive Optical Network
IPv4 Internet Protocol version 4 - connectionless protocol for use on packet switched networks
IPv6 Internet Protocol version 6 - connectionless protocol for use on packet switched networks
ITSP Internet telephone service providers
Mbps Megabits per second
MST Multi Service Terminal
NGPON2 Next Generation Passive Optical Network
OLT Optical Line Termination
ONT Optical Network Terminal
OSP Outside Plant - refers to all of the physical cabling and supporting infrastructure (such as conduit, cabinets, etc.), and any associated hardware (such as splice cases, field electronics, etc.) located between a demarcation point in a central office and a demarcation point in another central office or customer premises.
OTT Over the Top – delivery of one or more services across an IP network
PBX Private Branch Exchange
POTS Plain Old Telephone Service
RFP Request for Proposal
RFQ Request for Quote
RG Residential Gateway
RUS Rural Utilities Service
SIP Session Initiation Protocol
TIER Times Interest Earned Ratio
USDA United States Department of Agriculture
Vinton Broadband Intended to represent the Fiber to the Home project in Vinton generally. May also represent a separate legal entity or subsidiary which will be required to be established as part of the project. Vinton Broadband may or may not be the eventual name of the subsidiary.
VMEU Vinton Municipal Electric Utility
VoIP Voice over Internet Protocal
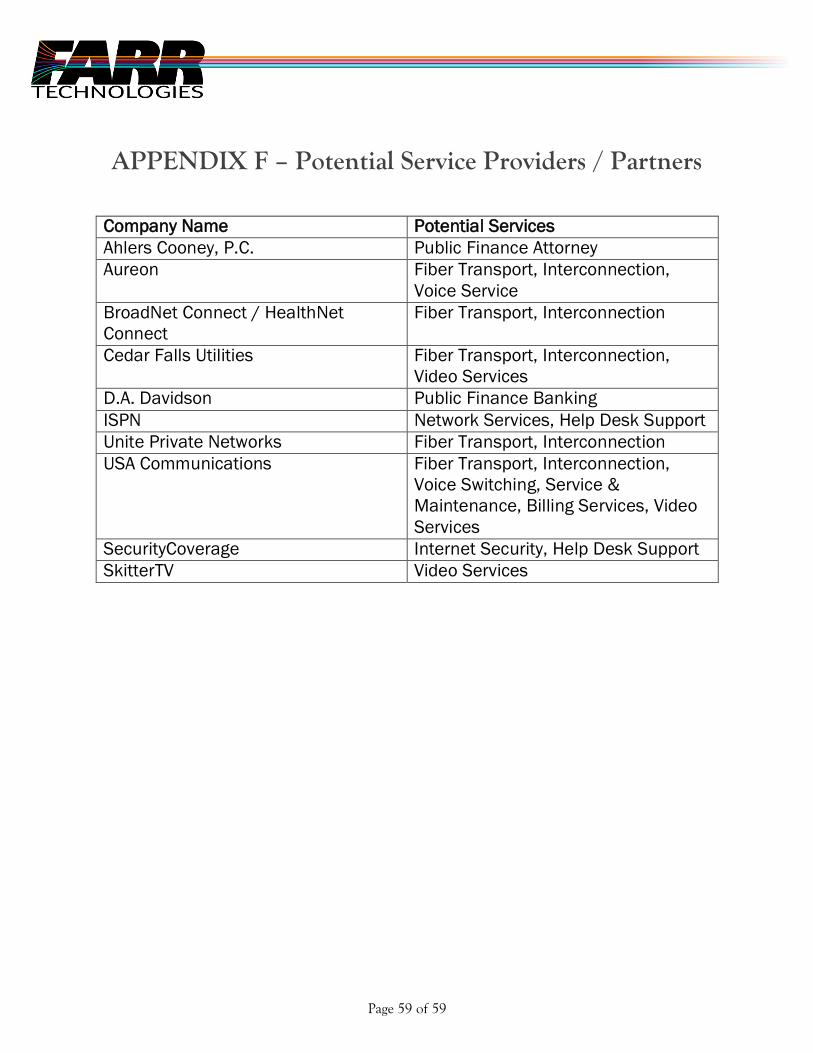
Page 59 of 59
APPENDIX F – Potential Service Providers / Partners
Company Name Potential Services
Ahlers Cooney, P.C. Public Finance Attorney
Aureon Fiber Transport, Interconnection,
Voice Service
BroadNet Connect / HealthNet
Connect
Fiber Transport, Interconnection
Cedar Falls Utilities Fiber Transport, Interconnection,
Video Services
D.A. Davidson Public Finance Banking
ISPN Network Services, Help Desk Support
Unite Private Networks Fiber Transport, Interconnection
USA Communications Fiber Transport, Interconnection,
Voice Switching, Service &
Maintenance, Billing Services, Video
Services
SecurityCoverage Internet Security, Help Desk Support
SkitterTV Video Services