vilela fo; amaral jÚnior at; gonÇalves lsa; barbÉ … · the traditional method (yates &...
TRANSCRIPT
84 Hortic. bras., v. 29, n. 1, jan.- mar. 2011
Snap bean i s a p lan t whose performance is highly influenced
by variations in the environment. Thereby, the genotype by environment interaction (GxE) represents one of the most important challenges in breeding programs, once it restricts the selection progress. Very properly, it has been calling special attention among breeders (Oliveira et al., 2001; Silva et al., 2004; Oliveira et al., 2008; Vilela et al., 2009). Tai (1977) mentioned two strategies to circumvent GxE influence: a) the subdivision of heterogeneous areas into homogeneous subareas, each one containing its specific cultivars
VILELA FO; AMARAL JÚNIOR AT; GONÇALVES LSA; BARBÉ TC; GRAVINA GA. 2011. Stability of F7:8 snap bean progenies in the Northern and Northwestern regions of Rio de Janeiro State. Horticultura Brasileira 29: 84-90.
Stability of F7:8 snap bean progenies in the Northern and Northwestern regions of Rio de Janeiro StateFelipe O Vilela; Antonio T Amaral Júnior; Leandro SA Gonçalves; Tatiane C Barbé; Geraldo A GravinaUENF-LMGV, Av. Alberto Lamego, 2000, Pq. Califórnia, 28013-602 Campos dos Goytacazes-RJ; [email protected]
ABSTRACTThe objective of this experiment was to assess the genotypes by
environment interaction for eight morphoagronomic traits in thirty F7:8 snap bean superior lines and evaluate the pod yield stability. The experiments were carried out in the cities of Bom Jesus do Itabapoana, Campos dos Goytacazes and Itaocara, located in the Northern and Northwestern regions of Rio de Janeiro State, Brazil. Experiments were designed in randomized blocks with two replications, using the traditional method (Yates & Cochran, 1938) and the methods proposed by Plaisted & Peterson (1959), Wricke (1965), Kang & Phan (1991) and Lin & Binns (1988), as well. Only the average fiber content in pods revealed no significant genotype x environment interaction, whereas most of the traits showed simple interaction, including pod yield. The results obtained using the methods of Plaisted & Peterson (1959) and Wricke (1965) agreed to a far extent and had a moderate estimate (0.6131) in relation to the traditional method. Both methods highlighted genotypes with pod yield close to the general average, i.e., around 7,546.46 kg ha-1. Kang & Phan’s (1991) algorithm was more efficient in optimizing the stability estimates obtained using the methods of Plaisted & Peterson (1959) and Wricke (1965) than the traditional method. Lin & Binns’ (1988) procedure revealed the most stable, responsive and productive progenies. Progenies 04, 03 and 10 stood out in all environments.
Keywords: Phaseolus vulgaris, phenotypic stability, genotype by environment interaction.
RESUMOEstabilidade de progênies F7:8 de feijão-de-vagem avaliadas
no Norte e Noroeste do estado do Rio de Janeiro
Objetivou-se quantificar a interação genótipos por ambientes (GxA) para oito características morfoagronômicas em 30 progênies endogâmicas F7:8 de feijão-de-vagem e avaliar a estabilidade para produção média de vagens. Os experimentos foram conduzidos nos municípios de Bom Jesus do Itabapoana, Campos dos Goytacazes e Itaocara, localizados nas regiões Norte e Noroeste do Estado do Rio de Janeiro. O delineamento experimental utilizado foi blocos ao acaso com duas repetições. Foram utilizados os métodos Tradicional (Yates & Cochran, 1938), Plaisted & Peterson (1959), Wricke (1965), Kang & Phan (1991) e Lin & Binns (1988). Apenas teor médio de fibra na vagem não revelou interação GxA significativa. A maioria das características apresentou interação do tipo simples, incluindo produção média de vagens em kg ha-1. Os resultados oriundos de Plaisted & Peterson (1959) e Wricke (1965) foram concordantes e ambos com estimativa moderada de 0,6131 em relação ao método tradicional. Esses métodos destacaram genótipos com produção de vagens próximas à média geral, de magnitude 7.546,46 kg ha-1. O algoritmo de Kang & Phan (1991) foi mais eficiente na otimização das estimativas de estabilidade de Plaisted & Peterson (1959) e de Wricke (1965), em relação ao método Tradicional. O método de Lin & Binns (1988) revelou as progênies mais estáveis, responsivas e produtivas. As progênies 04, 03 e 10 foram as que se sobressaíram em todos ambientes.
Palavras chave: Phaseolus vulgaris, estabilidade fenotípica, inte-ração genótipo x ambiente.
(Recebido para publicação em 23 de abril de 2009; aceito em 4 de fevereiro de 2010)(Received on April 23, 2009; accepted on February 4, 2010)
and; b) the use of cultivars with high yield stability in a varied environment. However, he considered the first one less efficient mainly for its inability to reduce the genotype x year interaction by simply limiting the cropping area.
Selection and recommendation of high yielding genotypes are basic objectives of all genetic breeding programs of cultivated species. Hence, the great majority of researchers suggests the use of cultivars with high performance stability in a large number of environments as the most rational way to control GxE effects (Cruz & Carneiro, 2003). There are several statistic
procedures which allow adaptability and stability assessments by means of identifying the cultivars with the most stable behavior and the most predictable response to environmental variations (Cargnelutti Filho et al., 2007). The definition of which procedure to be used depends essentially on the number of environments. For evaluations using fewer than five environments, methods based on regression or multivariate analyses are not recommended. It is preferable to apply methods based on the GxE variance, as proposed by Yates & Cochran (1938), Plaisted & Peterson (1959), Wricke (1965); as well as non
85Hortic. bras., v. 29, n. 1, jan.- mar. 2011
parametric methods, such as those of Lin & Binns (1988) and Kang & Phan (1991).
The very few investigations on the use of algorithms that improve the estimate efficiency of the traditional method, i.e, Plaisted & Peterson’s (1959), as well as Wricke’s method (1965), in addition to the lack of snap bean genotypes adapted to other regions but the mountain area at Rio de Janeiro State, makes it urgent that genotype screening is carried out using techniques that allow a reliable identification of those materials which are more suitable to the edaphoclimatic conditions of the Northern and Northwestern regions of Rio de Janeiro State. Particularly to these areas, where sugar cane plantations dominate the landscape and there are no restrictions to grow snap beans, the identification of adapted snap bean cultivars will result in more opportunities of polycrops and profitability per unit of area.
Thereby, the objective of this work was to evaluate GxE and to estimate the stability parameters for pod yield in 30 F7:8 snap bean progenies in three areas in the Northern and Northwest regions of Rio de Janeiro State, in order to recommend superior genotypes, as well as assessing the efficiency of different methods to estimate reliable stability parameters.
MATERIAL AND METHODS
The experiments were carried out in the agricultural year of 2007, from May 28 to August 6, at the Experimental Stations of Agricultural Research Corporation of the State of Rio de Janeiro (Pesagro-Rio) in Campos dos Goytacazes and in Itaocara; and at the Agricultural Technical College Ildefonso Bastos Borges (CTAIBB-UFF), in Bom Jesus do Itabapoana.
We evaluated 30 progenies at the F7:8 generation of the cross between the progenitors UENF 1442 x UENF 1429, UENF 1448 x UENF 1429, UENF 1448 x UENF 1442 and UENF 1448 x UENF 1445. Cultivars from the Top Seed Blue Line and Feltrin, as well as the genotype UENF 1445 were used as controls. We used the spacing 1.0 x 0.5
m between lines and plants respectively, with 20-plant plots. F7:8 progenies were planted in randomized blocks, with two replications. Harvests were carried out in the three environments during a month, twice a week, totalling eight harvests, in all environments. Throughout the experiment, cropping practices and pest and disease control were done as recommended by Filgueira (2003).
We evaluated: average plant height (HEI), in m; average pod length (LEN), in cm, and diameter (DIA), in mm; weight of five pods (WEI5), in g; average number of loci per pod (NLOC) unit; average number of seeds per pod (SEED) unit; pod yield (YIE), in t ha-1 and; average fiber content in pods (FIB), from 10 g of pods in natura. Fibers were obtained by crushing pods for 3 minutes in a blender and then transferring them to 30 mesh sieves for rinsing in flowing water. Following, samples were rinsed in acetone 100% and dried in stove at 105oC for one hour. Finally, the material was weighed and the fiber content was given as percentage of the initial weight (Frank et al., 1961).
As the characteristics we evaluated did not present ratios of the residual quadratic mean equal or superior to 7:1, we carried out a group analyses of variance, according to the following statistic model: Yijk = µ + Gi + Aj + GAij + B/Ajk + εijk, in which µ stands for the mean, Gi stands for the effect of the ith genotype; Aj stands for the effect of the jth environment; GAij is the effect of the genotype by environment interaction (GxE); B/Ajk is the effect of the kth block in the jth environment; and εijk stands for the experimental error. The sources of variation were considered to have random effects, except for genotypes.
The decomposition of the complex part of the interaction was estimated according to Cruz & Castoldi (1991). The complex part was obtained by the
expression: 213)1( QQrC −= , in
which Q1 and Q2 stand for the square means of genotypes in environments 1 and 2, respectively, and r, for the correlation between genotype means in both environments.
The estimates of phenotypic stability used for the analyses of pod yield
were:1) Yates & Cochran (1938),
referred as the Traditional method:
,a
)Y(Y
)1a(rMQ
j
2.i2
ji)iG/A(
−
−= ∑
in which Yij stands for the genotype mean i (i = 1, 2, ...., g) in the environment j (j = 1, 2, ...., e) and r stands for the number of replications associated to the genotype;
2) Plaisted & Peterson (1959): in
which: stands for GxE,
estimated by ANOVA from the group analyses of all environments for a given genotype pair;
3) Wricke (1965):
in which: jiY represents the i th genotype mean in jth environment, .
_
iY is the ith genotype mean,
_
. jY is the jth
environment mean, and _
..Y is the general mean and;
4) Lin & Binns (1988):
∑=
−=
a
1j
2jji
i a2)Mx(
P , in which Pi is
the index of superiority of the ith cultivar, xij stands for the ith cultivar yield in jth environment, M is the maximum response observed among all cultivars in the jth environment and n is the number of environments.
Kang & Phan’s (1991) method was also used. It consisted of ranking the progenies based on the estimates of Yates & Cochran (1938), Plaisted & Peterson (1959) and Wricke (1965). In order to hierarchize progenies, genotypes were ranked in crescent order based on the stability estimates. Then the genotypes were ranked in decrescent order based on the estimates of the average pod yield. The ranking values of each genotype were then
Stability of F7:8 snap bean progenies in the Northern and Northwestern regions of Rio de Janeiro State
86 Hortic. bras., v. 29, n. 1, jan.- mar. 2011
added to obtain the classification sum, which consisted of the estimate of Kang & Phan (1991). Thereby, the progenies with lower values in the ranking sum were described as the most stable and productive. All the analyses, except for the Kang & Phan’s (1991) ranking and including the estimates of correlation of Pearson among the several methods, were carried out applying the program Genes (Cruz, 2006).
RESULTS AND DISCUSSION
There were significant differences (p<0.01) in all traits we evaluated.
Concerning the environments, there were significant differences (p<0.05) for plant height (HEI), number of loci per pod (NLOC), number of seeds per pod (SEED), pod length (LEn) and fiber content in pods (FIB), whereas for pod diameter (DIA) and weight of five pods (WEI5) no significant differences were identified. Considering the genotype by environment interaction (GxE), DIA, HEI, NLOC and SEED were affected by significant differences at p<0.01, while for yield (YIE), LEN and WEI5, significant differences occurred at p<0.05. On the other hand, GxE was not significant for FIB,
which strengthens the possibility of oligogeny as hypothesized by Silva (2003). The occurrence of significant GxE indicates a genotypic differential response to changes in the environment; and according to Ramalho et al. (1993), when GxE is significant, one should seek for the cultivars with the broadest adaptation or, at least, those less affected by the environmental variation.
We observed the following types of interaction: i) when unfolding GxE between Bom Jesus do Itabapoana and Campos dos Goytacazes and between Bom Jesus do Itabapoana and Itaocara, only DIA and HEI revealed
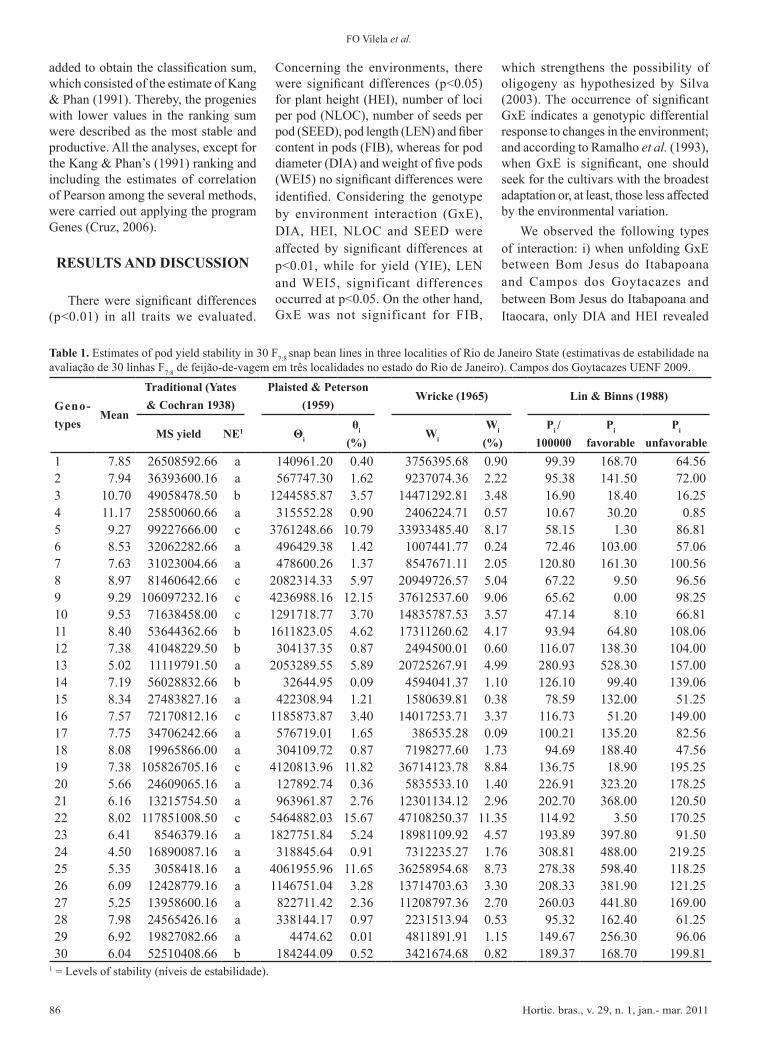
Table 1. Estimates of pod yield stability in 30 F7:8 snap bean lines in three localities of Rio de Janeiro State (estimativas de estabilidade na avaliação de 30 linhas F7:8 de feijão-de-vagem em três localidades no estado do Rio de Janeiro). Campos dos Goytacazes UENF 2009.
Geno-types
Mean
Traditional (Yates & Cochran 1938)
Plaisted & Peterson (1959)
Wricke (1965) Lin & Binns (1988)
MS yield NE1 Θi
θi (%)
Wi
Wi
(%)Pi /
100000Pi
favorablePi
unfavorable1 7.85 26508592.66 a 140961.20 0.40 3756395.68 0.90 99.39 168.70 64.562 7.94 36393600.16 a 567747.30 1.62 9237074.36 2.22 95.38 141.50 72.003 10.70 49058478.50 b 1244585.87 3.57 14471292.81 3.48 16.90 18.40 16.254 11.17 25850060.66 a 315552.28 0.90 2406224.71 0.57 10.67 30.20 0.855 9.27 99227666.00 c 3761248.66 10.79 33933485.40 8.17 58.15 1.30 86.816 8.53 32062282.66 a 496429.38 1.42 1007441.77 0.24 72.46 103.00 57.067 7.63 31023004.66 a 478600.26 1.37 8547671.11 2.05 120.80 161.30 100.568 8.97 81460642.66 c 2082314.33 5.97 20949726.57 5.04 67.22 9.50 96.569 9.29 106097232.16 c 4236988.16 12.15 37612537.60 9.06 65.62 0.00 98.2510 9.53 71638458.00 c 1291718.77 3.70 14835787.53 3.57 47.14 8.10 66.8111 8.40 53644362.66 b 1611823.05 4.62 17311260.62 4.17 93.94 64.80 108.0612 7.38 41048229.50 b 304137.35 0.87 2494500.01 0.60 116.07 138.30 104.0013 5.02 11119791.50 a 2053289.55 5.89 20725267.91 4.99 280.93 528.30 157.0014 7.19 56028832.66 b 32644.95 0.09 4594041.37 1.10 126.10 99.40 139.0615 8.34 27483827.16 a 422308.94 1.21 1580639.81 0.38 78.59 132.00 51.2516 7.57 72170812.16 c 1185873.87 3.40 14017253.71 3.37 116.73 51.20 149.0017 7.75 34706242.66 a 576719.01 1.65 386535.28 0.09 100.21 135.20 82.5618 8.08 19965866.00 a 304109.72 0.87 7198277.60 1.73 94.69 188.40 47.5619 7.38 105826705.16 c 4120813.96 11.82 36714123.78 8.84 136.75 18.90 195.2520 5.66 24609065.16 a 127892.74 0.36 5835533.10 1.40 226.91 323.20 178.2521 6.16 13215754.50 a 963961.87 2.76 12301134.12 2.96 202.70 368.00 120.5022 8.02 117851008.50 c 5464882.03 15.67 47108250.37 11.35 114.92 3.50 170.2523 6.41 8546379.16 a 1827751.84 5.24 18981109.92 4.57 193.89 397.80 91.5024 4.50 16890087.16 a 318845.64 0.91 7312235.27 1.76 308.81 488.00 219.2525 5.35 3058418.16 a 4061955.96 11.65 36258954.68 8.73 278.38 598.40 118.2526 6.09 12428779.16 a 1146751.04 3.28 13714703.63 3.30 208.33 381.90 121.2527 5.25 13958600.16 a 822711.42 2.36 11208797.36 2.70 260.03 441.80 169.0028 7.98 24565426.16 a 338144.17 0.97 2231513.94 0.53 95.32 162.40 61.2529 6.92 19827082.66 a 4474.62 0.01 4811891.91 1.15 149.67 256.30 96.0630 6.04 52510408.66 b 184244.09 0.52 3421674.68 0.82 189.37 168.70 199.81
1 = Levels of stability (níveis de estabilidade).
FO Vilela et al.
87Hortic. bras., v. 29, n. 1, jan.- mar. 2011
interaction of the complex type. In all other cases, including GxE between Campos dos Goytacazes and Itaocara, we found simple interactions. Therefore, there is a strong point for the joint recommendation of elite genotypes for the localities evaluated.
According to the Traditional method (Yates & Cochran, 1938), the most stable progenies in terms of pod yield
were those identified as 25, 23, 13, 26, 21 and 27 (Table 1). Based on the average pod yield of these progenies over environments, there was a variation from 5.02, for progeny 13, to 6.4 t ha-1, for progeny 23. Nevertheless, the progenies with the highest averages for pod yield in the three localities were progenies 4 and 3, with respective estimates of 11.17 and 10.70 t ha-1. These
figures indicate that we should analyze carefully the results obtained by the Traditional method (Yates & Cochran, 1938), once it highlights genotypes with high stability (Cruz & Carneiro, 2003), but not necessarily that impressive in terms of yield. The procedures of Plaisted & Peterson (1959) and Wricke (1965) agreed in the identification of the most stable progenies, namely progenies
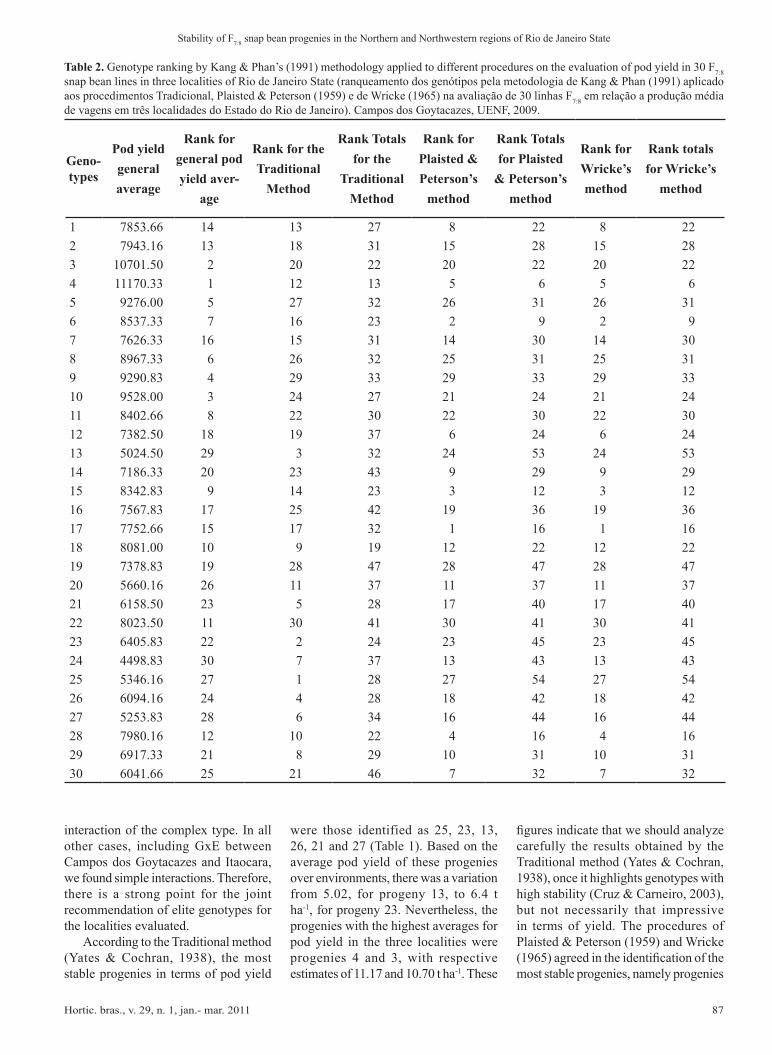
Table 2. Genotype ranking by Kang & Phan’s (1991) methodology applied to different procedures on the evaluation of pod yield in 30 F7:8 snap bean lines in three localities of Rio de Janeiro State (ranqueamento dos genótipos pela metodologia de Kang & Phan (1991) aplicado aos procedimentos Tradicional, Plaisted & Peterson (1959) e de Wricke (1965) na avaliação de 30 linhas F7:8 em relação a produção média de vagens em três localidades do Estado do Rio de Janeiro). Campos dos Goytacazes, UENF, 2009.
Geno-types
Pod yield general average
Rank for general pod yield aver-
age
Rank for the Traditional
Method
Rank Totals for the
Traditional Method
Rank for Plaisted & Peterson’s
method
Rank Totals for Plaisted
& Peterson’s method
Rank for Wricke’s method
Rank totals for Wricke’s
method
1 7853.66 14 13 27 8 22 8 222 7943.16 13 18 31 15 28 15 283 10701.50 2 20 22 20 22 20 224 11170.33 1 12 13 5 6 5 65 9276.00 5 27 32 26 31 26 316 8537.33 7 16 23 2 9 2 97 7626.33 16 15 31 14 30 14 308 8967.33 6 26 32 25 31 25 319 9290.83 4 29 33 29 33 29 3310 9528.00 3 24 27 21 24 21 2411 8402.66 8 22 30 22 30 22 3012 7382.50 18 19 37 6 24 6 2413 5024.50 29 3 32 24 53 24 5314 7186.33 20 23 43 9 29 9 2915 8342.83 9 14 23 3 12 3 1216 7567.83 17 25 42 19 36 19 3617 7752.66 15 17 32 1 16 1 1618 8081.00 10 9 19 12 22 12 2219 7378.83 19 28 47 28 47 28 4720 5660.16 26 11 37 11 37 11 3721 6158.50 23 5 28 17 40 17 4022 8023.50 11 30 41 30 41 30 4123 6405.83 22 2 24 23 45 23 4524 4498.83 30 7 37 13 43 13 4325 5346.16 27 1 28 27 54 27 5426 6094.16 24 4 28 18 42 18 4227 5253.83 28 6 34 16 44 16 4428 7980.16 12 10 22 4 16 4 1629 6917.33 21 8 29 10 31 10 3130 6041.66 25 21 46 7 32 7 32
Stability of F7:8 snap bean progenies in the Northern and Northwestern regions of Rio de Janeiro State

88 Hortic. bras., v. 29, n. 1, jan.- mar. 2011
17, 06, 15, 28, 04 and 12 (Table 2). These progenies yielded respectively 7.75, 8.53, 8.34, 7.98, 11.17 and 7.38 t of pods per hectare, assuming the 15th, 7th, 9th, 12th, 1st and 18th ranks in the set of thirty progenies we used in this study. These results confirm the inconveniences of such methodologies and place into perspective the low accuracy of the estimate of stability parameters they provide.
Kang & Phan’s (1991) methodology, when applied to the three methods of estimating stability parameters used in this study, that is the Traditional method (Yates & Cochran, 1938) and the methods of Plaisted & Peterson (1959) and Wricke (1965), drew attention to progenies 04, 03 e 10, which had the lowest ranking totals (Table 2). Particularly to the traditional method, the application of Kang & Phan’s (1991) procedure revealed the superiority
of progenies 04, 18 and 03. These progenies scored the lowest rank totals, progenies 04 and 03 were the top yielding, reaching 11.17 and 10.70 t ha-1, and progeny 18 (8.08 t ha-1) ranked 10th in pod yield (Table 1). If we take the results of the Traditional method when Kang & Phan’s (1991) correction is not applied, we observe that these progenies presented high instability, whilst progenies 25, 23 and 13 were the most stable. However, if Kang & Phan´s (1991) rank is applied to the Traditional method, progenies 25, 23 and 13 score high in rank totals, specifically at the 11th, 7th and 19th places, respectively (Table 1). Thereby, as far as the plant material evaluated in this study is concerned, stability implies in low yield by the Traditional method, which is not unusual for this methodology. Kang & Phan’s (1991) rank, when applied to the methods of Plaisted & Peterson
(1959) and Wricke (1965), pointed up the same progenies, i.e., those with the lowest rank totals, namely progenies 04, 06 and 15 (Table 2). Pod yield for these progenies were 11.17, 8.53 and 8.34 t ha-1, respectively, all above the general experimental average, 7.54 t ha-1.
Among the three methodologies in which Kang & Phan’s (1991) algorithm was applied, the procedures of Plaisted & Peterson (1959) and Wricke (1962) revealed the lowest distortion in results (Tables 1 and 2). This is backed by the fact that two progenies (06 and 15) selected as stable when using both procedures without the Kang & Phan’s (1991) rank, were also detected as stable and top yielding when we applied the Kang & Phan’s (1991) rank. On the other hand, when Kang & Phan’s (1991) algorithm was used for estimates resulting from the Traditional method, there was not any agreement.
Table 3. Pearson’s correlations among methods of estimating stability of pod yield for 30 F7:8 lines of snap beans in three localities of Rio de Janeiro State (estimativas de correlações de Pearson entre métodos de estabilidade para análise da eficiência de diferentes algoritmos na identificação de linhas F7:8 de feijão-de-vagem avaliadas quanto ao peso médio de vagens em três localidades do Estado do Rio de Janeiro). Campos dos Goytacazes, UENF, 2009.
Methodologies
Methodologies
Plaisted & Peterson
(1959)
Wricke (1962)
Pi (Lin & Binns,
1988)
Pi Unfavorable
Pi Favorable
Traditional method al-
tered by Kang & Phan
Plaisted & Pe-terson altered
by Kang & Phan
Wricke altered byKang &
Phan
Traditional (Yates & Co-chran, 1938)
0.6131** 0.6131** -0.4927** 0.1485ns -0.7621** 0.4850** 0.0001ns 0.0001ns
Plaisted & Peter-son (1959) 1.0000** 0.0655ns 0.2824ns -0.0853ns 0.2972ns 0.5974** 0.5974**
Wricke (1962) 0.0655ns 0.2824ns -0.0853ns 0.2972ns 0.5974** 0.5974**
Pi (Lin & Binns, 1988) 0.7330** 0.9074* 0.3463* 0.7750** 0.7750**
Pi Unfavorable 0.3793* 0.8469** 0.7372** 0.7372**
Pi Favorable -0.0520ns 0.5987** 0.5987**
Traditional altered by Kang & Phan
0.5108** 0.5108**
Plaisted & Pe-terson altered by Kang & Phan
1.0000**
nS = not significant; * = Significant by the t test (P < 0.01); ** = Significant by t test (P < 0.05).
FO Vilela et al.
89Hortic. bras., v. 29, n. 1, jan.- mar. 2011
The Traditional method when applied without using the Kang & Phan’s (1991) rank indeed identified stable progenies, but with low pod yield values.
When we applied Kang & Phan’s (1991) algorithm to three procedures to estimate the phenotypic stability, progeny 04 stood out as the most stable and most productive in terms of pod yield. Therefore, progeny 04 is a genotype we should improve our knowledge about in repeated crops, in distinct years, to check how accurate were the results obtained in the environments used in the current work.
The estimates of Lin & Binns’ (1988) Pi parameter revealed the superiority of progenies 04, 03 and 10, which presented the lowest general Pi values and reduced proportions for GxE, namely 1.33, 1.41 and 2.84%, respectively (Table 1). These were also the progenies with the highest pod yields, respectively 11.17; 10.70 and 9.53 t ha-1. Such results point to the high potentiality of the parameter Pi, once it associates stability and genotype capacity to present the lowest deviation in relation to the maximum, in all the environments studied. The advantage of this method confirms the results of Daros et al. (2000), Scapim et al. (2000), Carbonell et al. (2001), Ferreira et al. (2004), Lédo et al. (2005) and Cargnelutti Filho et al. (2007).
The environmental index, based on Lin & Binns’ (1988) methodology, used to sort the environments as favorable or unfavorable for pod yield, classified Itaocara as favorable, once it showed the highest mean estimates in relation to the other environments, whereas Bom Jesus do Itabapoana was unfavorable. Taking only the favorable environment into consideration, progeny 09 came to the spot with the lowest Pi and average pod yield of 17.7 t ha-1. On the other hand, taking only the unfavorable environment into consideration, the same progeny ranked in a medium position, since it produced merely 4.97 t ha-1, proving that some progenies should be indicated for specific environments. In the unfavorable environment, progenies 04 and 03 showed up for keeping the Pi values low. Besides having more stability as a whole, these progenies also developed well under unfavorable
conditions. Therefore, progenies 03 and 04 present a behavior adequate for smallholders, who usually employ low technology in their crops.
The correlation among the methods we used to estimate the genotypic stability for pod yield, 61.11%, was significant (p<0.01), showing a general consensus among procedures (Table 3). Pearson’s correlation was estimated for the methods based on the analysis of variance (Plaisted & Peterson, 1959; Wricke, 1965) and revealed full agreement (r= 1,00) for the stability parameters between the two methods. According to Cruz & Carneiro (2003), the correspondence comes from the use of similar principles in these methods: while Plaisted & Peterson’s (1965) is based on the decomposition of GxE between pairs of environments, Wricke’s (1965) considers the decomposition of GxE sum of squares. Therefore, convergence of results is more the rule, than the exception, and even full agreement may happen, as it was the case of Silva & Duarte (2006) and Cargnelutti Filho et al. (2007) upon studying phenotypic adaptability and stability for soybeans and corn, respectively.
Considering the Traditional method (Yates & Cochran, 1938) and those of Plaisted & Peterson (1959) and Wricke (1965), only the first had a negative significant correlation (r = -0.49, p<0.01) with Lin & Binns' method (Table 3). Hence we can say that the Traditional method presented the least favorable results for identification of stable top yielding genotypes, considering the progenies we evaluated. When we applied the weighting of Kang & Phan’s (1991) Traditional method (Yates & Cochran, 1938), as well as the methods of Plaisted & Peterson (1959) and Wricke (1965), the last two presented the highest correlations with general Pi (Lin & Binns' method). Among the above mentioned methods weighted by Kang & Phan (1991), the highest correlation estimate (0.76, significant at p<0.01) occurred between the general Pi and Plaisted & Peterson’s (1959) method, and the general Pi and Wricke’s (1962), as well. Thereby, Kang & Phan (1991) strengthened the stability estimates of the procedures of Plaisted & Peterson
(1959) and Wricke (1965).Despite its significance (p<0.01), the
magnitude of the association between the Traditional method modified by Kang & Phan (1991) and the general Pi was nearly half (0.34) of the associations between the Traditional method and the methods of Plaisted & Peterson (1959) and Wricke (1965), also modified by Kang & Phan (1991) (Table 3). This evidences the weakness of the results obtained by the Traditional method. Mekbib (2002), studying the common beans yield stability in Africa, recommended the use of methods of Lin & Bins (1988) and Wricke (1962) modified by the ranking and disencouraged the use of the Traditional method (Yates & Cochran, 1938), in agreement with Aremu et al. (2007) who worked with cowpea (Vigna unguiculata L.) also in Africa.
Pi correlation estimate between the favorable and unfavorable environments, 0.38 (p<0.01), stress that progenies behave differently when the environment changed. However, it must be said that a deviation will always happen in relation to the top genotype in each environment, despite the environment separation proposed by Carneiro (1998).
We concluded that Kang & Phan’s (1991) procedure was efficient in circumventing the inconveniences of the methods of Plaisted & Peterson (1959) and Wricke (1965), but poorly effective when applied to the Traditional method. Taking into account the set of environments we used, Lin & Binns’ (1988) methodology performed better in discriminating the more stable, responsive and productive progenies, namely progenies 04, 03 and 10.
ACKNOWLEDGEMENTS
Authors would like to thank the State University of the North of Rio de Janeiro (UENF) and Agricultural Research Corporation of the State of Rio de Janeiro (Pesagro-Rio) for the opportunity to accomplish this research. We also thank the Board of Directors of Technical Agricultural College Ildefonso Bastos Borges (CTAIBB-UFF) for allowing the setting up of this
Stability of F7:8 snap bean progenies in the Northern and Northwestern regions of Rio de Janeiro State
90 Hortic. bras., v. 29, n. 1, jan.- mar. 2011
experiment.
REFERENCES
AREMU CO; ARIYO OJ; ADEWALE BD. 2007. Assessment of selection techniques in genotype x environment interaction in cowpea (Vigna unguiculata L. walp). African Journal of Agricultural Research 2: 352-355.
CARBONELL SAM; AZEVEDO FILHO A; DIAS AS; GONÇALVES C; ANTÔNIO CB. 2001. Adaptabilidade e estabilidade de produção de cultivares e linhagens de feijoeiro no Estado de São Paulo. Bragantia 60: 69-77.
CARGNELUTTI FILHO A; PERECIN D; MALHEIROS EB; GUADAGNIN JP. 2007. Comparação de métodos de adaptabilidade e estabilidade relacionados à produtividade de grãos de cultivares de milho. Bragantia 66: 571-578.
CARNEIRO PCS. 1998. Novas metodologias de análise da adaptabilidade e estabilidade de comportamento. Viçosa: UFV. 168p. (Tese doutorado).
CRUZ CD. 2006. Programa Genes: biometria. Viçosa: Editora UFV. 382p.
CRUZ CD; CASTOLDI FL. 1991. Decomposição da interação genótipo x ambiente em partes simples e complexas. Revista Ceres 38: 422-430.
CRUZ CD; CARNEIRO PCS. 2003. Modelos biométricos aplicados ao melhoramento genético. Viçosa: Editora UFV. 585 p.
DAROS M; AMARAL JÚNIOR AT. 2000. Adaptabilidade e estabilidade de produção de Ipomoea batatas. Acta Scientiarum Agronomy 22: 911-917.
FERREIRA RDEP; BOTREL MDEA; PEREIRA ACRAV; COELHO ADF; LEDO FJS; CRUZ
CD. 2004. Adaptabilidade e estabilidade de cultivares de alfafa em relação a diferentes épocas de corte. Ciência Rural 34: 265-269.
FILGUEIRA FAR. 2003. Novo manual de olericultura: agrotecnologia moderna na produção e comercialização de hortaliças. Viçosa: Editora UFV. 402p.
FRANK T; ANHDER GI; CARTER WB. 1961. Testing snap beans for fiber content. Keystone Seeds, St. Louis, 8p.
LÉDO FJDAS; BOTREL MA; EVANGELISTA AR; VIANA MCM; PEREIRA AV; SOBRINHO FS; SILVA OJ; xAVIER DF; HEINEMANN AB. 2005. Adaptabilidade e estabilidade de cultivares de alfafa avaliadas em Minas Gerais. Ciência e Agrotecnologia 29: 409-414.
LIN CS; BINNS MR. 1988. A method for analyzing cultivar x location x years experiments: a new stability parameter. Theoretical and Applied Genetics 76: 425-430.
KANG MS; PHAN HN. 1991. Simultaneous selection for high yielding and stable crop genotypes. Agronomy Journal 83: 161-165.
MEKBIB F. 2002. Simultaneous selection for high yield and stability in common bean (Phaseolus vulgaris) genotypes. Journal of Agricultural Science 138: 249-253.
OLIVEIRA AP; ANDRADE AC; SOBRINHO JT; PEIxOTO N. 2001. Avaliação de linhagens e cultivares de feijão-de-vagem de crescimento indeterminado, no município de Areia-PB. Horticultura Brasileira 19: 159-162.
OLIVEIRA CD; BRAZ LT; BANZATTO DA. 2008. Adaptabilidade e estabilidade fenotípica de cultivares de cenoura. Horticultura Brasileira 26: 88-92.
PLAISTED RL; PETERSON LC. 1959. A technique for evaluating the ability of selections to yield consistently in different
locations and seasons. American Potato Journal 36: 381-385.
RAMALHO MAP; SANTOS JB; ZIMMERMANN MJO. 1993. Genética quantitativa em plantas autógamas: aplicações ao melhoramento do feijoeiro. Goiânia: Editora da UFG. 271p.
SCAPIM CA; OLIVEIRA VR; BRACCINI AL; CRUZ CD; ANDRADE CAB; VIDIGAL MCG. 2000. Yield stability in maize (Zea mays) and correlations among the parameters of the Eberhart and Russell, Lin and Binns and Huehn models. Genetics and Molecular Biology 23: 387-393.
SILVA MP. 2003. Identificação de genitores superiores e herança de características morfoagronômicas em feijão-de-vagem. Campos dos Goytacazes: UENF. 80p. (Dissertação mestrado).
SILVA MP; AMARAL JÚNIOR AT; RODRIGUES R; PEREIRA MG; VIANA AP. 2004. Genetic control on morphoagronomic characteristics in snap bean. Brazilian Archives of Biology and Technology 47: 855-862.
SILVA WCJ; DUARTE JB. 2006. Métodos estatísticos para o estudo de adaptabilidade e estabilidade fenotípica em soja. Pesquisa Agropecuária Brasileira 41: 23-30.
TAI GCC. 1977. Genotypic stability analysis and its application to potato regional trials. Crop Science 17: 182-183.
VILELA FO; AMARAL JÚNIOR AT; FREITAS JÚNIOR SP; VIANA AP; PEREIRA MG; SILVA MGM. 2009. Selection of snap bean recombined inbred lines by using EGT and SSD. Euphytica 165: 21-26.
WRICKE G. 1965. Zur Berechnung der Ökovalenz bei Sommerweizen und Hafer. Pflanzenzüchtung 52: 127-138.
YATES F; COCHRAN WG. 1938. The analysis of group experiments. Journal of Agricultural Science 28: 556–580.
FO Vilela et al.