· web viewx-ray diffraction (xrd) patterns have been used to calculate the strain and crystallite...
TRANSCRIPT

Erbium doping influences morphological, structural and optical behavior of magnetite nanopowders
Richa Jaina and Shubha Gokhalea
aSchool of Sciences, Indira Gandhi National Open University, Maidan Garhi, New Delhi-110068, India
Abstract
In the present investigation, magnetite nanoparticles having formula Fe3-xErxO4 (where x = 0 to 0.05) have
been synthesized using a convenient low temperature co-precipitation route. The change in structural,
phase and optical properties has been studied as a function of doping level. The samples have been
characterized using TEM, EDX SEM, XRD and UV-Vis spectroscopy. TEM images show the formation
of rod like structures with erbium doping. X-Ray diffraction (XRD) patterns have been used to calculate
the strain. crystallite size is found to increase with erbium doping till a doping concentration of x=0.01.
UV-Vis spectroscopy study shows the more absorbance peaks appear in the region of 600-850 nm with
erbium doping which have been attributed to the f-f transitions in Erbium. Band-gaps are calculated
using UV-Vis spectroscopy by Tauc plots. An increase in band-gap is found with erbium doping. Band-
gap for undoped particle is 2.43 eV which decreases to 2.36 with erbium doping of x=0.01. Hence this
technique can be used in band-gap tailoring.
Key Words: Magnetite, Erbium, Doping, UV-Visible study, Nanorods.
1. Introduction
Magnetite (Fe3O4) nanoparticles are widely used functional materials due to excellent physical and
chemical properties directed towards many applications. These have physical properties such as large
surface area, good suspension stability and strong adsorption ability, thereby imparting specific magnetic,
electrical and optical properties well suited for chemical, mechanical, electronic communications,
biomedical, environmental protection and military applications. [1-2] The unique f-electron configuration
of rare elements offers the shielding of 4f electrons by 5d and 6s electrons from environmental impact. It
has been observed that rare earth doping in ferrites, enhances the structural, magnetic and optical
properties. [3-5] Fe3O4 possesses inverse spinel structure and the substitution of other element ion in place
of Fe3+/Fe2+ ion can result into modified magnetic behavior. Erbium doping in cobalt and Ni-Zn ferrites
improves the magnetic and transport properties. [6-8]

In the present investigation, the Fe3-xErxO4 (where x = 0 to 0.05) nanoparticles have been synthesized
using the co-precipitation route. The change in structural, phase and optical properties has been studied as
a function of doping level. The samples have been characterized using TEM, EDX SEM, XRD, and UV-
Vis spectroscopy. TEM images show the formation of rod like structures with erbium doping whereas
undoped particles are round shaped. X-Ray diffraction (XRD) patterns have been used to calculate the
strain and crystallite size. Band-gaps are calculated using UV-Vis spectroscopy by Tauc plots. An
increase in band-gap is found with erbium doping. Band-gap for undoped particle is 2.43 eV which
decreases to 2.36 for erbium doping of x=0.01. Hence this technique can be used in band-gap tailoring.
2. Experimental details2.1. Synthesis
Fe3-xRExO4 (where x stands for 0 to 0.10 in steps of 0.01) particles were synthesized using an inexpensive
co-precipitation method. Stoichiometric amounts of FeCl3 and ErCl3 were dissolved in de-ionized water to
form 0.2 M solution. NaOH solution was added in this mixture to maintain the pH value of 10. This
solution [solution- 1] was magnetically stirred at 80oC for 2.5 hours. Stoichiometric amount of 0.2 M
FeSO4 and NaOH [solution-2] were ultrasonicated at room temperature for 5 min. Solution-2 was added
to solution-1 at room temperature and ultrasonicated for 35 min. The product in the form of black
precipitate was washed thoroughly in deionized water and finally with ethanol. Then the sample was
vacuum dried to obtain the nanoparticles in the form of black powder.
2.2. Characterization
The TEM was used for studying the morphology of the nanoparticles. Samples for TEM were prepared by
depositing a layer of ultra-dilute dispersion of nanoparticles in ethanol on the polymer coated copper grid
and drying in air. TEM analysis was carried out using the JEOL 2100F operated at 200 keV electron
energy. Field emission scanning microscopy / energy dispersive X-ray analysis (FESEM/EDX) was
performed using Zeiss EVO40 Scanning Electron Microscope (SEM).
X-ray diffraction was carried out from 25o to 80o at room temperature using PANalytical X'pert PRO
diffractometer with copper K ( =1.54Ǻ) radiation.
The optical properties were determined at room temperature between a wavelength of 280 nm to 800 nm
by using Systronics make UV-Vis spectrometer.
3. Results and discussions
3.1. Morphological studies
The transmission electron micrographs of Fe3-xErxO4 (for x=0.0, 0.01 and 0.03) are shown in Fig. 1(a, b,
c). The micrographs obtained for doped samples show formation of rod-like structure. Undoped magnetite
nanoparticles are the spherical particles. The TEM micrographs are shown in Fig.1.

(a)
(b) (c)
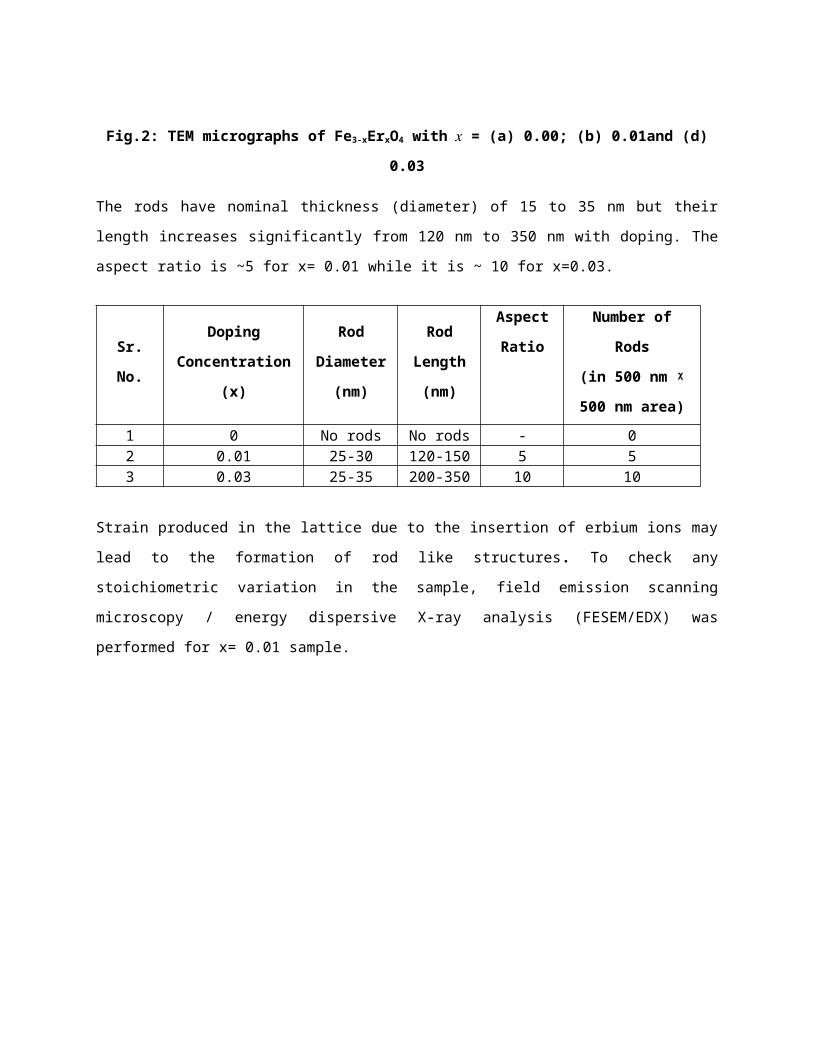
Fig.2: TEM micrographs of Fe3-xErxO4 with 𝑥 = (a) 0.00; (b) 0.01and (d) 0.03
The rods have nominal thickness (diameter) of 15 to 35 nm but their length increases significantly from
120 nm to 350 nm with doping. The aspect ratio is ~5 for x= 0.01 while it is ~ 10 for x=0.03.
Sr. No.Doping
Concentration (x)
Rod
Diameter
(nm)
Rod
Length
(nm)
Aspect
Ratio
Number of Rods
(in 500 nm ᵡ 500
nm area)
1 0 No rods No rods - 02 0.01 25-30 120-150 5 53 0.03 25-35 200-350 10 10
Strain produced in the lattice due to the insertion of erbium ions may lead to the formation of rod like
structures. To check any stoichiometric variation in the sample, field emission scanning microscopy /
energy dispersive X-ray analysis (FESEM/EDX) was performed for x= 0.01 sample.
10 nm
100 nm
20 nm

2 4 6 8 10 12 14 16 18 20keV
0
10
20
30
40
50
60
cps/eV
Si Au Au Au
Fe Fe O
Er Er Er
Fig.2: EDX spectrum of Fe3-xErxO4 with 𝑥 = 0.01.
Table. 2 Elemental composition of EDX spectrum.
Element Series unn. C norm. C Atom. C ErrorSilicon K-Series 41.62 30.94 51.17 1.8Gold M-Series 24.56 18.26 4.31 0.9Iron K-Series 61.66 45.84 38.12 1.8
Erbium L-Series 4.11 3.05 0.85 0.1Oxygen K-Series 2.57 1.91 5.55 0.3
Total 134.51 100 100 0.3
Table .2 shows the elemental composition of samples. Hence EDX shows the presence of erbium in the
prepared samples. SEM samples were prepared on silicon wafer and gold coating was done to prevent
charging of the specimen.
3.2. XRD
X-ray diffraction (XRD) is a powerful nondestructive technique for characterizing crystalline materials.
It provides information on crystal structure, phase, preferred crystal orientation (texture), and other
structural parameters, such as average grain size, crystallinity,
XRD of magnetic nanoparticles of Fe3-xErxO4 (with x=0.00, 0.01, 0.02, 0.03 and 0.05) revealed that that
prepared nanoparticles have good crystallinity and have face centred cubic spinel structure. This agrees
with the XRD pattern of Fe3O4 (JCPDS card number 85-1436). XRD is shown in Fig.3. It is observed that
with doping peaks attributed to the formation of ErFeO3 (ASTM card number 74-1480).
Fig 3: XRD of Fe3-xErxO4 (with x=0.00, 0.01, 0.03 and 0.05).
ErFeO3 peaks become intense with increase in doping concentration. It has been reported that the dopant
ions get incorporated by substitution of Fe3+ by Er3+ at octahedral site in the spinel structure of Fe3O4 to a
limited extent. Larger amount of dopant results erbium ferrite phase. [3,5]
Crystallite size was calculated from the XRD data by using Scherrer formula for (311) peak at 35.57o:
Crystallite size =
0 . 9λβcosθ
where β is the full width at half maximum, θ is the angle of diffraction and λ is the wavelength of X-ray
( =1.54Ǻ).

Variation of crystallite size with doping is plotted in Fig. 4. The calculated crystallite size gradually
increases from 13.9 nm for no doping to 24.1 nm for x=0.01 and then it reduces till 19.8 nm for x=0.05.
Fig 4: Plot of crystallite size verses doping of Fe3-xErxO4
The radius of erbium ions (0.088 nm) is about 1.4 times the radius of Fe3+ ion (ionic radius 0.064 nm)
therefore during co-precipitation process some of the dopant ions would accumulate on the grain
boundaries to form ultra-thin layer around the grains which may results in the formation of secondary
phase after the doping. It has been observed that the diffraction pattern of erbium doped samples show a
slight left shift in 2θ values relative to undoped samples These shifts in peak position give indication of
incorporation of erbium in the spinel lattice. This could produce a mechanical stress in the crystal lattice
due to incorporation of large radii erbium ions in magnetite nanopowders. [9]
The diffraction pattern showing the comparison of (311) peak which is main peak of the magnetite at
about 35.7o for various Er3+ doping levels are presented in Fig.5. The strain in the structure has been found
using the relation:
ε s=−Δθ(311 )cotθ(311 )

Fig.5: X-ray diffraction peak observed for (311) peak of Fe3-xErxO4 (with x=0.00, 0.01, 0.03 and 0.05)
Table. 3 Strain calculation of Fe3-xErxO4 nanoparticles
Sample(x) 2θ (deg) ∆θ (deg) Cotθεs(radians)
× 10-4
0 35.558 - - -
0.01 35.555 0.002 3.118 1.087
0.02 35.551 0.004 3.119 2.176
0.03 35.498 0.03 3.124 16.349
0.05 35.479 0.040 3.126 21.813
The calculated values of strain are given in Table.3. Strain increases with erbium doping.
3.3. UV-Visible spectroscopy
Undoped sample has a peak near 3800 angstrom which is characteristic of magnetite [10] It is found to be
slightly shifted towards the higher wavelength with erbium doping. With doping more absorbance peaks

appear in the region of 6000-8500 angstrom, which have been attributed to the f-f transitions in Erbium
[11]. A slight red shift in these peaks is observed with Er3+doping as shown in Fig. 6.
Fig.6: UV-Visible spectra of Fe3-xErxO4 (with x=0.00, 0.01, 0.03 and 0.05)
Band gap, which is also called energy gap, is the energy range between the conductionband and the valence band. The band gap is called "direct" if the momentum of electrons and holes is the same in both the conduction band and the valence band; an electron can directly emit a photon. The direct band gap of the nanoparticles is related to the optical gap (Eg) and photon energy (hν) according to the equation [12]
[α hν]2 = C(hν− Eg) (1)
Where C is a constant, n = 2 for direct allowed transitions and α is the linear absorption coefficient.
The linear absorption coefficients, as a function of the photon energy were calculated
as α(hν) = a(hν) ln(10)/L, where a(hν) is the absorbance measured by using the UV-vis
spectrophotometry, and L is the thickness of the sample cell. According to Eq. (1) The [αhν]n were plotted
with hν. The band-gap can be determined by extrapolating the linear region of the curve represented to
αhν =0. These plots are called Tauc plots. Tauc plots for the undoped sample are shown in Fig. 7.

0.0 0.5 1.0 1.5 2.0 2.5 3.0 3.5 4.0 4.5 5.00
200
400
h(eV)
(h)2(cm
2 eV2 )
0.0 0.5 1.0 1.5 2.0 2.5 3.0 3.5 4.0 4.5 5.00
20
40
(h)2(cm
2 eV2 )
h(eV)
(a) (b)
Fig: 7 Tauc plots for direct band-gap for (a) undoped (b) Er (0.01) doped samples.
The direct band-gap for undoped samples is 2.42 eV. Band-gaps vary with doping as shown Fig. 8 . The
direct band-gap for Er doped (0.01) samples is 2.36 eV.
Fig.8: Variation of band gap of Fe3-xErxO4 (with x=0.00, 0.01, 0.03 and 0.05)

These bands - gaps are similar as the band-gap of semiconductors thus shows the semiconducting nature
of our samples. The optical bandgap for visible light is 1-3 e V. The bandgap of synthesized nanoparticles
falls in this range. The samples can be explored in photo sensing applications.
Conclusion
It has been observed that there is an improvement in the structural and optical properties of erbium doped magnetite. XRD results showed a strain is produced in the lattice with erbium doping. TEM micrographs showed the formation of rod like structure with erbium doping and density of rods increases with doping. UV-Visible study showed a slight red shift in these peaks with Er3+doping.The direct band-gap for samples decreases with erbium doping.
Acknowledgment:
The TEM, XRD and EDX characterization was carried out at the Advanced Instrumentation Research Facility, Jawaharlal Nehru University, New Delhi. The UV-Vis characterization was carried out at IGNOU, New Delhi.
References:
1. Tahereh B. Gorji and A.A. Ranjbar, A numerical and experimental investigation on the performance of a low-flux direct absorption solar collector (DASC) using graphite, magnetite and silver nanofluids, Solar Energy 135: 493-505, 2016.2. N. Pramanik, T. RATH, R. Basu, J. de and P. P. Kundu, Fabrication of magnetite nanoparticles doped reduced graphene oxide grafted polyhydroxyalkanoate nanocomposite for tissue engineering application, RSC Adv 6.52: 46116-46133, 2016.3. R. Jain, V. Luthra and S. Gokhale, Dysprosium doping induced shape and magnetic anisotropy of Fe3−xDyxO4 (x=0.01–0.1) nanoparticles, J. Magn. Magn. Mater. 414 :111–115, 2016.4. H. Zhang, V. Malik, S. Mallapragada and M. Akinc, Synthesis and characterization of Gd-doped magnetite nanoparticles, J. Magn. Magn. Mater. 423: 386-394, 2017.5. S. Prathapani, T. V. Jayaraman, E. K. Varaprasadarao, and D. Das, Effect of Er doping on the structural and magnetic properties of cobalt-ferrite, Journal of Applied Physics 116: 17A502-1-3, 2014.6. Imran Ahmad,Tahir Abbas,A.B. Ziya,Asghari Maqsood, Structural and magnetic properties of erbium doped nanocrystalline Li–Ni ferrites Ceramics International 40 : 7941-7945, 2014.7. Myrtil L. Kahn and Z. John Zhang, Synthesis and magnetic properties of spinel ferrite nanoparticles doped with lanthanide ions, Appl. Phys. Lett. 78: 3651-3653, 2001.8. Widanarto, W., Sahar, M.R., Ghoshal, S.K., Arifin, R., Rohani, M.S. and Hamzah, K, Effect of natural Fe3O4 nanoparticles on structural and optical properties of Er3+ doped tellurite glass, J. Magn. Magn. Mater. 326: 123-128, 2013.9. Xiruo Zhao, Wei Wanga,, Yajun Zhang, Sizhu Wu, Feng Li and J. Ping Liu, Synthesis and Characterization of gadolinium doped cobalt ferrite nanoparticles with enhanced adsorption..., Chemical Engineering Journal, 250:164–174, 2014.10. Sachnin A.Kulkarni, P.S.Sawadh, PrakashK.Palei and Kiran K. Kokate. Effect of synthesis route on

the structural, optical and magnetic properties of Fe3O4 nanoparticles, Ceramics International 40(2014)1945–1949.11. YUAN Haibin, ZHANG Jianhui, YU Ruijin and SU Qiang, Synthesis of rare earth sulfides and their UV-vis absorption spectra, Journal of rare earth 27: 308-311, 2009.12. D. Espinosa, L. B. Carlsson, and A. M. Figueiredo Neto, Influence of nanoparticle size on the nonlinear optical properties of magnetite ferrofluids, Physical Review E 88: 0323021-7, 2013.